
4
Implications of Knowledge Gained Since 1999 for the CERP
The Comprehensive Everglades Restoration Plan (CERP; USACE and SFWMD, 1999) is the manifestation of a large planning effort. It provides a blueprint to overhaul the water management system in South Florida through approximately 50 major projects and 68 project components to be completed over 30 to 40 years. When completed, the CERP was envisioned to restore hydrologic and ecological function across the Greater Everglades ecosystem and a secure water supply for the residents of the region. Core elements of the CERP are vastly increased water storage capacity and reduction of barriers to sheet flow, such that water can be stored in the wet season and released in the dry season to mimic historic seasonal and spatial hydrology (see Chapter 2). Unfortunately, over the first half of the project timetable, the restoration has not proceeded according to plan. CERP implementation progress has been slow, impeded by funding constraints and a cumbersome project planning, approval, and authorization process, among other things. Moreover, the projects advanced have been largely restricted to the periphery of the remnant Everglades (NRC, 2007). Little has been accomplished through the CERP to restore flow velocities and dry season flow volumes in the central Everglades. The heart of the Everglades continues to degrade. Meanwhile, the northern estuaries continue to experience damaging high flows, which impact their ecological condition. In 2005 and 2016, elevated discharge to coastal waters contributed to extensive algal blooms (see also Box 2-2).
Recently, major breakthroughs have been made in CERP planning, approval, and authorization. The Central Everglades Planning Project (USACE and SFWMD, 2013a) was developed and approved as a comprehensive approach to combine components of several CERP projects and provide incremental benefits associated with increased flows through the central Everglades and a modest reduction in damaging regulatory releases to the northern estuaries (NRC, 2014). Numerous other CERP projects are now authorized, with six under construction, and
new planning efforts for the Western Everglades, Loxahatchee River, and Lake Okeechobee Watershed are under way (see Chapter 3).
As we approach the mid-point of the original CERP timeline with encouraging momentum in planning and construction, it is appropriate to examine the CERP goals and the evolving restoration plan in the context of conditions that have changed and the improved understanding that has occurred over the past 16 years. In the past few years, restoration planners have learned that some major storage elements in the plan described in the 1999 CERP Feasibility Report (known as the “Yellow Book”) are no longer feasible and others remain uncertain. Additionally, a modified regulation schedule has substantially reduced natural storage in Lake Okeechobee, which could impact the capacity to reach CERP goals with the original plan. New understanding of climate change and sea level rise also presents the potential for significant changes in the future conditions that were not anticipated in the Yellow Book (NRC, 2014). In this chapter, the committee examines major changes that have occurred since 1999 that are likely to affect the construction of the CERP as initially envisioned, and the potential for achieving the original objectives.
CHANGING BASELINES
One significant change since the CERP was adopted is that the scientific understanding of the pre-drainage system, on which operational targets to support Everglades restoration are based, is now widely accepted as much wetter than was previously assumed. Although the general goals to restore hydrology, provide for natural habitats and species, and enhance water supply, while sustaining existing flood protection (see Chapter 2) have not changed, assumptions about pre-drainage conditions underlying the specific operational targets (e.g., water depths, duration, flow volumes) that served as the basis of CERP development to achieve those goals are likely no longer valid. These targets are primarily hydrologic and were originally based on the Natural System Model (NSM) v. 4.51, which simulates the frequency, duration, and spatial extent of water inundation without the current levees, canals, dikes, and pumps that alter the hydrology. Since the CERP was launched, new versions of the NSM have been developed based on extensive research indicating that wetter conditions prevailed in the historic system than previously thought (McVoy et al., 2011). The Natural System Regional Simulation Model (NSRSM) is the most recent version in use for planning and assessment purposes. Based on knowledge gained and enhanced tools developed over the past 17 years, it is now understood that restoring pre-drainage conditions in the remnant Everglades would require
___________________
1 Subsequently upgraded to v. 4.6.2.
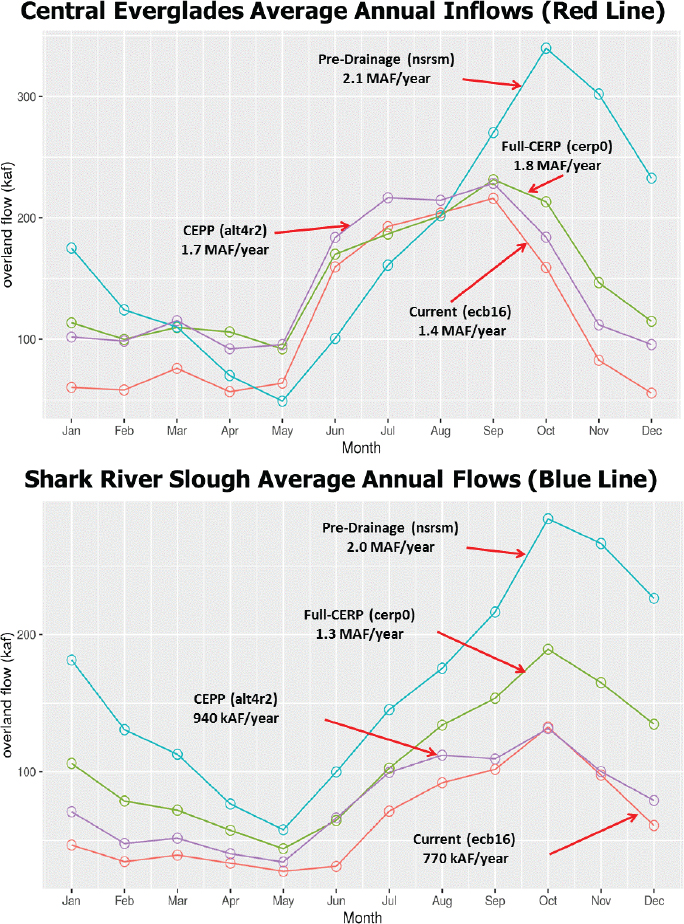
greater water depths, flow volumes, and flow velocities than assumed in the Yellow Book (see Figure 4-1) (RECOVER, 2011a). Comparisons between the NSM and NSRSM show increases in average annual flow volumes ranging from 6 to 67 percent across two different Everglades transects (see Box 4-1).
Past reports of this committee (NRC, 2007, 2008) have emphasized that “getting the water right” is not the goal itself but a means to facilitate the restoration of the physical, chemical, and biological processes that sustained the historical Everglades (see Chapter 2). Thus, NSRSM simulations are not the only information guiding operational targets, because changed conditions may make such targets undesirable or unachievable. For example, it is well understood that increasing the water depth in areas that have subsided because of dry conditions and enhanced oxidation of peat, such as WCA-3B, is likely to adversely affect those habitats. Nevertheless, new information on historic water depths may necessitate renewed discussions of tradeoffs and future CERP design options considering potentially improved conditions associated with higher flows in the southern Everglades. Even if the restored system cannot replicate the pre-drainage system or attain all the physical, chemical, and biological goals, improved ecosystem functioning is still expected from partial achievement of these NSRSM targets, and restoration benefits from incremental restoration steps may, in fact, be significant. Program-level adaptive management (see also Chapter 5), designed to adjust implementation, as necessary, to improve the probability of restoration success (RECOVER, 2015), necessitates that the significance of this new information on expected systemwide restoration outcomes be understood in the context of the original restoration goals, with modifications made to the plan or the goals, as appropriate.
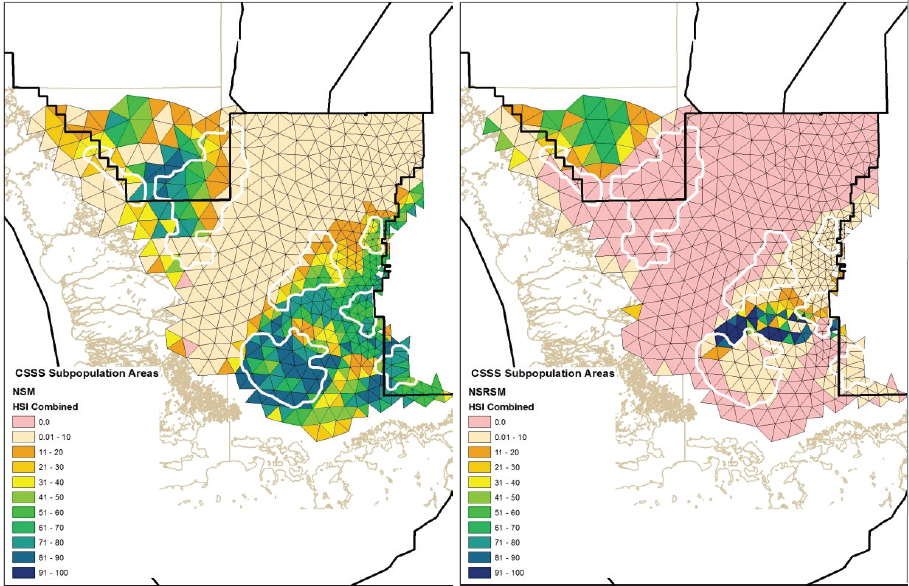
An example that illustrates the challenges of setting restoration goals in the context of changing baselines is management of the Cape Sable seaside sparrow, an endangered subspecies whose entire global distribution is limited to Everglades National Park, and the marl prairie habitat in which it resides. There are three marl prairies in Everglades National Park: Ochopee marl prairie, west of Shark River Slough; Rockland marl prairie, east of Shark River Slough; and Perrine marl prairie, farther south in the vicinity of Taylor Slough. Currently, these sites are characterized by inorganic marl soil (in contrast to organic peat found elsewhere in the Everglades); a particularly diverse vegetation community dominated by grasses, sedges and rushes; and shorter hydroperiods relative to marsh habitats (McVoy et al., 2011). They are the only habitat occupied by Cape Sable seaside sparrows; thus, their protection is mandated under the Endangered Species Act.
Assessments of the impact of the CERP on the endangered sparrows have uniformly concluded that ultimately the species and the marl prairies will benefit from the restoration (FWS, 2016; NRC 2012; SEI 2003, 2007; Walters et al.
SOURCE: R. Johnson, DOI, personal communication, 2016.
2000). This supposition was based on flows being reduced in western Shark River Slough, where current conditions in the adjacent Ochopee marl prairie occupied by sparrow subpopulation A are too wet and increased flows in northeastern Shark River Slough, where current conditions in the adjacent Rockland marl prairie occupied by subpopulations C, E, and F are too dry (see Figure 3-6). In sum, it was anticipated that the CERP would restore marl prairies that are currently in degraded condition. However, in the analysis of pre-drainage conditions that informed the NSRSM, McVoy et al. (2011) characterized the marl prairies as more drastically affected by altered drainage than any other habitats. In the pre-drainage system these areas were marl marshes with shallow peat soils over a marl base, but drainage led to oxidation of the peat layer. Compared to current conditions, the pre-drainage marl marshes had a lower elevation gradient relative to the bordering sloughs, deeper water, and longer hydroperiods. McVoy et al. (2011) estimate former hydroperiods to be 8-9 months. For comparison, current hydroperiods are 4-8 months (Walters et al., 2000) and the current management objective for the prairies under the Everglades Restoration Transition Plan is a hydroperiod of 3-7 months (USACE, 2011b).
Thus, the NSRSM projections for the marl prairies are at odds with current operational water management targets for the Cape Sable seaside sparrow. If NSRSM projections of pre-drainage flows are used to guide future restoration objectives for these areas, the marl prairies could become marl marshes once again, but this change would jeopardize the continued existence of sufficient habitat to support the endangered sparrows. This was not the case when projections were based on NSM and the previous understanding of the pre-drainage system that NSM represented (see Figure 4-2). Providing sufficient habitat for Cape Sable seaside sparrows and duplicating the pre-drainage system require very different hydrology. This illustrates the complexity of establishing restoration goals.
An updated program review of restoration goals is essential to future planning and would include a realistic assessment of what can be achieved, includ-
SOURCE: McLean and Pearlstine, 2015.
ing goals for particular areas such as the marl prairies inhabited by the sparrows (see Chapter 5). Restoring pre-drainage features while retaining post-drainage features that are viewed as desirable (e.g., marl prairies inhabited by Cape Sable seaside sparrows) is especially challenging. In many instances, recreating the historical hydrology embodied in the NSRSM may not be a realistic goal, and in the case of the marl prairies, a desirable one. Current restoration plans (Figure 4-1) focus on increasing dry season flows rather than peak flows, although the CERP and the Central Everglades Planning Project more closely approach pre-drainage flows into WCA-3A compared to flows into Everglades National Park (Figure 4-1). Meeting all ecological goals will not be an easy task within a river of grass where everything is connected, but new tools are available that can be used to assess tradeoffs between ecological goals to maximize systemwide restoration benefits. These tools and strategies for refining CERP goals considering new information are discussed in Chapter 5.
UNDERSTANDING SEA LEVEL RISE AND CLIMATE CHANGE
Much has been learned about the potential implications of climate change and sea level rise for Everglades restoration since the CERP was launched (Catano et al., 2015; Havens and Steinman, 2015; Kearney et al., 2015; Koch et al., 2015; Nungesser et al., 2015; Obeysekera et al., 2015; Orem et al., 2015; SFRCC, 2011; van der Valk et al., 2015). These changes and their implications for the CERP were reviewed extensively in the committee’s last report (NRC, 2014), and these issues are briefly summarized here with some updated information. Sea level rise and changes in temperature, precipitation, and evapotranspiration have different impacts on the structure and functioning of the Everglades, interactions with the built environment, and restoration plans. Compounding the challenge of the assessment of the anticipated effects on South Florida is the differing levels of certainty in the magnitude and nature of the change in these climatic drivers.
Sea Level Rise
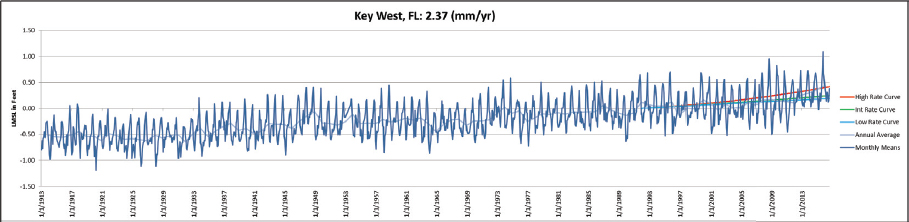
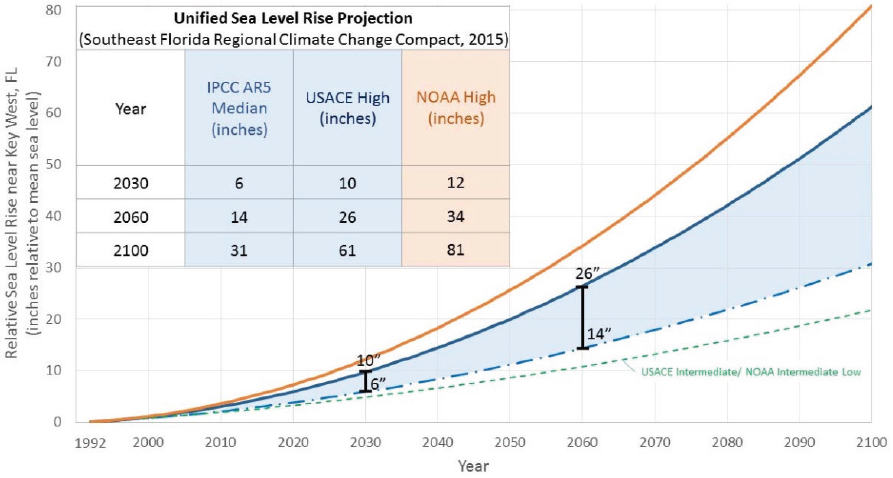
Global sea level rise has been observed to be about 7.5 inches (0.19 m) during 1910–2010 (IPCC, 2013), although recent trends in Florida suggest an acceleration in the rate of sea level rise (see Figure 4-3). The Southeast Florida Regional Climate Change Compact (2015) released a recent “unified sea level rise projection” of 31 to 61 inches (0.8 to 1.5 m) by 2100 (see Figure 4-4). Sea level rise is expected to profoundly impact the coastal zone of the Florida peninsula (IPCC, 2013; Obeysekera et al., 2011a,b; Parris et al., 2012). Sea level rise will alter the structure and functioning of current coastal ecosystems, expanding and deepening Florida Bay and other coastal estuaries, reducing
SOURCE: G. Landers, USACE, personal communciation, 2016.
SOURCE: SFRCC (2015).
the extent of inland freshwater wetlands, and causing an inland migration of the mangrove ecotone (Kearney et al., 2015; Koch et al., 2015; NRC, 2014). Rising sea level also is increasing flooding of developed coastal areas and salt water intrusion in coastal aquifers. With intermediate USACE projections of sea level rise (24 inches or 0.9 m by 2100), some restoration project benefits will be substantially reduced (e.g., Central Everglades benefits, by the loss of wetlands within the project footprint; USACE and SFWMD, 2014a) and by 2100 at high projections of sea level rise, no benefits are expected from the Biscayne Bay Coastal Wetland, Phase 1 project (USACE and SFWMD, 2012).
Climate Change
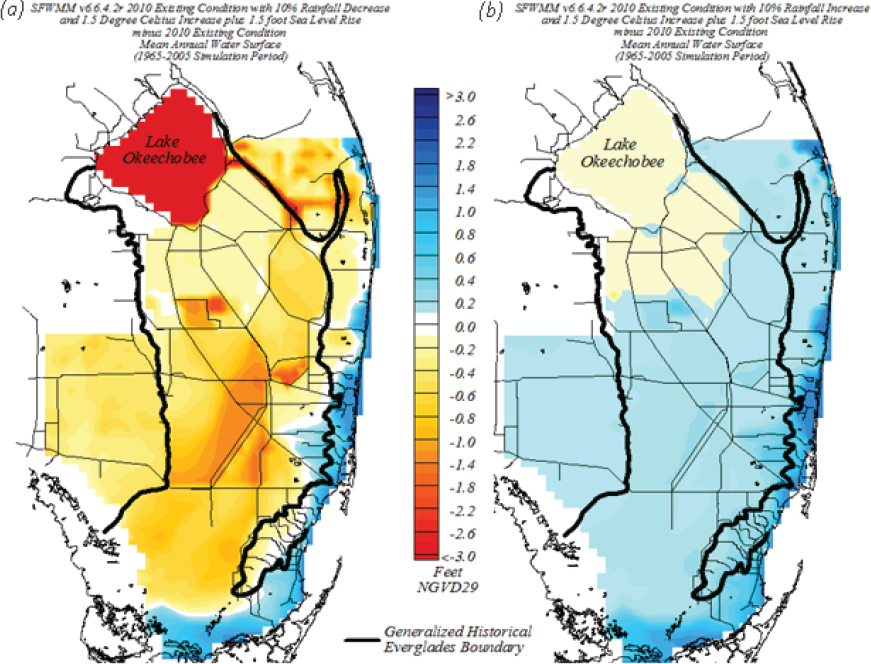
A scenario analysis by Obeysekera et al. (2015) advanced understanding of the potential hydrologic impacts of future changes in precipitation and evapotranspiration. These results were subsequently used to evaluate the ecological implications of changing climate across different Everglades habitats (Catano et al., 2015; Havens and Steinman, 2015; Kearney et al., 2015; Koch et al., 2015; Nungesser et al., 2015; Orem et al., 2015; van der Valk et al., 2015). The scenarios include baseline conditions with a 1.5°C increase in temperature, ±10 percent change in annual precipitation, and a 1.5-foot increase in sea level for a 50-year planning horizon (2010-2060). This analysis suggests that, depending on the rainfall and temperature scenario, there would be major changes in water budgets, ecosystem structure and functioning, and in water supply demands met that could have important implications for CERP goals. Increased sea levels will also compromise flood protection infrastructure in the urbanized areas of southeastern Florida and cause increased salt water intrusion of water supply wells (see Figure 4-5). Projections of changes in precipitation quantity are highly uncertain, but decreases in annual precipitation are probably more likely than increases in precipitation (Obeysekera et al., 2015). Climate projections suggest a greater certainty of increases in temperature which will drive increases in water loss through evapotranspiration. The implications of two specific scenarios developed by Obeysekera et al. (2015) are discussed here—10 percent increased and 10 percent decreased precipitation (each with 1.5°C increase in temperature and 1.5-foot increase in sea level).
Increased Rainfall Scenario
Analysis of the 10 percent increased rainfall scenario suggests an increase in damaging high water events in the northern estuaries. Increasing rainfall would help meet agricultural and urban water demands, although increased evapotranspiration is anticipated to counter-balance the effects of increased rainfall
SOURCE: J. Obeysekera, SFWMD, personal communication, 2014.
on water levels of Lake Okeechobee (Havens and Steinman, 2015). Minimal adverse impacts are anticipated in the Everglades landscape (Nungesser et al., 2015). The 10 percent increase in rainfall scenario is expected to have beneficial impacts on carbon accretion as organic soils in most areas, although peat soil oxidation will continue during dry years in areas currently experiencing peat loss. Greater flow through Shark River and Taylor Sloughs will likely mitigate the impacts of sea level rise to some degree, reduce hypersaline conditions in Florida Bay, and promote mangrove growth leading to reduced impacts from cyclonic storms (Orem et al., 2015). Increased rainfall is projected to benefit aquatic prey productivity and apex predators (Catano et al., 2015).
Reduced Rainfall Scenario
The reduced rainfall scenario showed dramatic effects on the Greater Everglades ecosystem. Compared to a future base condition with climate conditions consistent with the past 30 years, water levels in Lake Okeechobee are lowered substantially (on average by more than 3 feet), with multiple years well below the historic range, although some years are projected to experience very high levels following rainfall events. The littoral and near-shore zones—areas that support emergent and submerged plants—are projected to be dry for more than 50 percent of the time (compared to less than 4 percent under the future base scenario). It is uncertain whether a shallow lake that would result under the reduced precipitation scenario could support submerged vascular plants, which are critical to the recreational fishery and for migratory birds. The substantial decline in lake levels could result in considerable unmet water demand and loss of agricultural revenue. Reduced rainfall would also result in dramatic (90-95 percent) reductions in regulatory releases to the northern estuaries but also an 80 percent decline in the capacity to provide environmental water releases under low flow conditions (Havens and Steinman, 2015).
Median marsh water depths of the remnant Everglades would be reduced by 5-114 cm and inundation duration shortened periods by 14-47 percent. These shifts in hydrologic pattern would likely translate into ecologically significant changes. Moreover, severe decreases in water flow would likely alter the structure and functioning of the Everglades through severe drought, increased wildfires, extensive peat loss, loss of the ridge and slough landscape pattern, and changes in vegetation composition (Nungesser et al., 2015; Orem et al., 2015; van der Valk et al., 2015). With the loss of peat soils, the likely enhanced release of nutrients and contaminants stored in the organic soil (e.g., nitrogen, phosphorus, sulfur, mercury) may exacerbate eutrophication and contamination downstream (Orem et al., 2014). All wildlife indicators are negatively affected under the reduced rainfall scenario, including iconic animals such as wading birds and alligators (Catano et al., 2015).
Implications of Climate Change and Sea Level Rise for CERP
Disturbance in ecosystem functioning associated with sea level rise and climate change may necessitate that restoration goals be revisited (NRC, 2014). For example, would increases in the depth of Florida Bay help mitigate the hypersalinity issues that the CERP is designed to address? Kearney et al. (2015) analyzed the effects of potential climate change scenarios (with 1.5 feet or 0.5 m of sea level rise in 50 years) on a variety of juvenile fish and lobster species in Florida Bay and found only small changes in habitat suitability across the sce-
narios for six of seven species examined. Only one of the seven species investigated (Lagodon rhomboides, i.e., pinfish) would likely experience a sizable decrease in optimal habitat under any of the scenarios. This analysis suggests that the estuarine fauna of Florida Bay may not be as vulnerable to climate change as other components of the greater Everglades, such as those in the marine/terrestrial ecotone. However, these models are relatively simplistic, examining only single species effects of physical drivers without consideration of the many interspecific interactions that may occur as the ecosystem responds to changing sea level rise and climate. More complex models that capture the mechanistic links among physics, chemistry, and biology, as well as the dynamics of the estuarine food web, may be necessary to further understand the potential effects of climate change on the Florida Bay ecosystem.
Although NRC (2014) stated that “climate change provides a strong incentive for accelerating restoration,” the committee did not suggest that changing climate and sea level rise provides a blanket endorsement of all CERP projects. Instead, the report recommended that climate and sea-level rise projections be used to rigorously evaluate individual project benefits, which may lead to changes in priorities or plans from a systemwide perspective. The loss of benefits for some projects may necessitate that projects that have not yet been constructed be reconfigured or even eliminated. In contrast, projects with strong benefits in mitigating the impacts of climate change and sea level rise may merit advancement in restoration scheduling. For example, Koch et al. (2015) noted that greater freshwater flows targeted by Everglades restoration efforts could enhance mangrove peat accumulation and reduce saltwater intrusion. However, these benefits have not been quantified at the project or systemwide scale. Analysis of benefits or drawbacks of projects under anticipated climate change should then be used to reevaluate CERP project implementation and inform planning.
Of particular importance for CERP planning in the context of climate change is a critical assessment of water storage needs (see next section). Although the analysis conducted by Obeysekera et al. (2015) provides valuable insight, it represents simplified conditions. For example, the analysis evaluates potential hydrologic response of the current Everglades to hypothetical future meteorological conditions and sea level rise, not how the CERP would alter, attenuate, or exacerbate this response. Also, only annual perturbations to meteorological conditions were examined. A useful next step would be to examine the hydrologic response to seasonal shifts in the distribution and quantity of precipitation and the subsequent effects of these changes on habitats and species (see also the Chapter 5 section on Tools to Support Forward-Looking Analyses). It is likely that extreme events will become more common under future climatic conditions (NASEM, 2016; Melillo et al. 2014). Increases in the occurrence of
extreme events will likely increase the need for additional capacity for storage. There is a critical need for additional storage under high water conditions to protect the northern estuaries and the WCAs. These conditions are likely to become more acute in a future where seasonal shifts in precipitation patterns and extreme events are more common. Modeling tools and approaches to assess the implications of climate change and sea level rise to the CERP are discussed in more detail in Chapter 5.
The benefits and costs of projects anticipated to be impacted by climate change and sea level rise need to be evaluated in a systemwide context, considering how ecosystem changes may influence restoration goals. For example, how does sea level rise affect restoration goals for Everglades National Park? Should climate change and sea-level rise mitigation and adaptation be considered equally among other CERP goals? These issues can be addressed through a combination of sound project planning and forward-looking analysis that rigorously considers climate change and sea-level rise scenarios, project-level adaptive management, and program-level adaptive management (see Chapter 5).
STORAGE
Storage of water in surface and in-ground reservoirs and in aquifers is a critically important part of the CERP for attenuating extreme high and low water discharges to the northern estuaries and the Everglades and low water discharges to Florida Bay (see Chapter 2). With sufficient storage capacity, peak discharges and water levels can be reduced by storing portions of high flow events for later release either when flows are below damaging levels or during periods of low flows to enhance ecological conditions downstream and also to supplement water supplies for urban or agricultural water uses (see Box 4-2).
In the Yellow Book (USACE and SFWMD, 1999), major elements of CERP storage included the following:
- New surface water storage reservoirs in the Caloosahatchee and St. Lucie basins, north of Lake Okeechobee, in the Everglades Agricultural Area, and in Palm Beach, Broward and Miami-Dade counties with a capacity to store 1.2 million acre-feet (AF)
- In-ground water storage in existing limestone quarries in Miami-Dade County and western Palm Beach County, with engineered liners as needed to manage seepage and a combined capacity of 325,000 AF
- Underground water storage in over 330 aquifer storage and recovery (ASR) wells around the northern boundary of Lake Okeechobee, in Water Preserve Areas, and the Caloosahatchee Basin to capture and store water during high flows to supplement flows during dry periods
- Management of Lake Okeechobee as an ecological resource by modifying the lake’s regulation schedule to reduce the extreme high and low levels that damage the lake and its littoral zone, while allowing the lake to continue to serve as an important source for water supply
Specific locations and engineering details for most storage projects were not determined in the Yellow Book (USACE and SFWMD, 1999), but those characteristics were deferred to later project-specific feasibility studies.
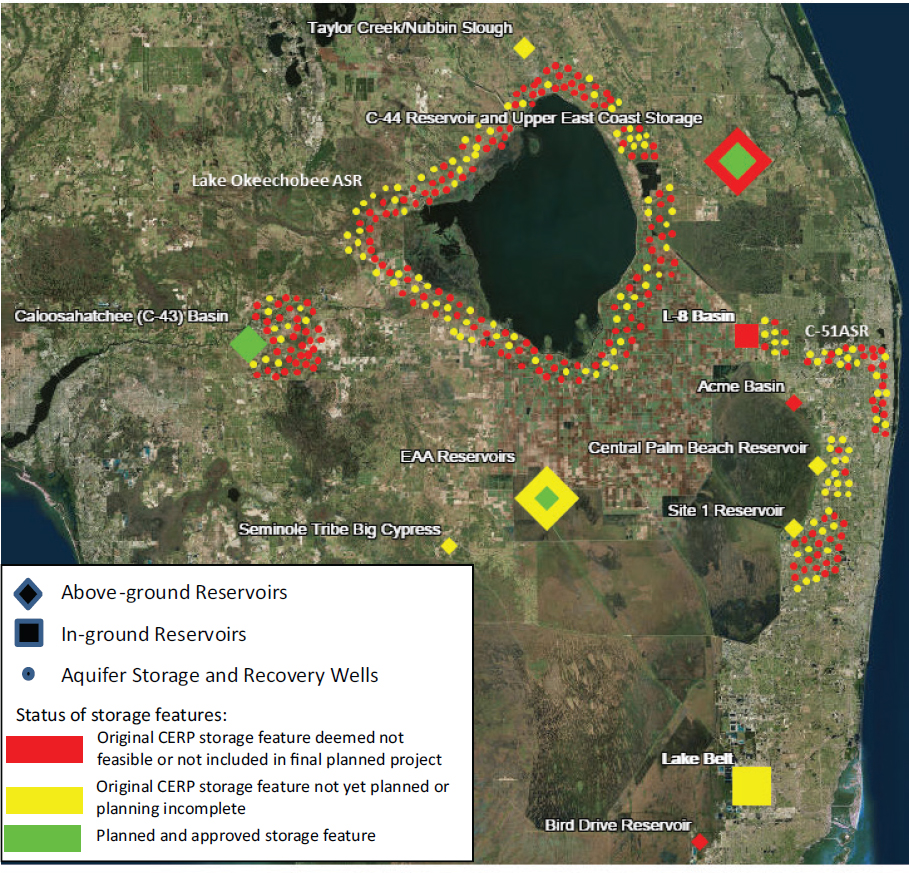
The major components of CERP storage are outlined in Tables 4-1, 4-2, and 4-3 and Figure 4-6. Table 4-1 summarizes the original planned storage capacity of each of the major storage features and their updated capacities based on recent planning (if completed), but it is important to recognize that ecosystem benefits from storage are linked to the way the storage features are operated and not only on the storage capacity. Different operational plans and other system
TABLE 4-1 Proposed and Updated Capacities of Non-ASR Storage Components of the Restoration Plan
| STORAGE COMPONENT | Yellow Book Storage Capacity Acre-Feet | Updated Storage Capacity Acre-Feet |
|---|---|---|
| Existing System Storage | ||
| Lake Okeechobee | 3,817,000a | 3,253,000a |
| Water Conservation Areas | 1,882,000 | 1,882,000 |
| Total lake/WCA storage | 5,699,000 | 5,135,000 |
| Above-ground Reservoirs | ||
| North Storage Reservoir (Kissimmee) | 200,000 | TBD |
| Taylor Creek/Nubbin Slough | 50,000 | TBD |
| Caloosahatchee (C-43) Basinb | 160,000 |
170,000 |
| C-44 Reservoirb | 40,000 |
50,600 |
| Other Upper East Coast Storageb,g | 349,000 |
109,400g |
| EAA Reservoirs | 360,000 | |
| Central Palm Beach Reservoir | 19,920 | TBD |
| Site 1 Reservoir | 14,760 | TBDd |
| Bird Drive Reservoirb | 11,600 | |
| Acme Basinb | 4,950 |
0f |
| Seminole Tribe Big Cypress | 7,440 | TBD |
| Total above-ground reservoir storage | 1,217,670 | |
|
Projects planned to date |
925,550 |
386,000 |
|
Potential storage in projects not yet planned, or planning not finalized: |
292,120 | |
| In-ground reservoirs | ||
| North Lake Belt | 90,000 | Feasibility unproven |
| Central Lake Belt | 187,200 | Feasibility unproven |
| L-8 Basinb | 48,000 | FEB operated for water quality, not storage |
| Total in-ground reservoir storage | 325,200 | |
|
Projects planned to date |
48,000 | 0 |
|
Potential storage in projects not yet planned, or planning not finalized: |
277,200 | |
a Updated capacity based on difference between an assumed low level of 9 feet and the highest stage in the upper band (17.25 feet for Lake Okeechobee Regulation Schedule (LORS) 2008 and 18.5 feet for Water Supply and Environment [WSE]), based on calculator in http://www.sfwmd.gov/gisapps/losac/sfwmd.asp based on the polynomial model.
b Planning completed.
c 2015 Report to Congress suggests that these features are fully replaced by CEPP storage.
d The Site 1 Impoundment plan would provide 13,280 AF if constructed, but policy conversations are underway that propose not completing the reservoir. Thus, the committee considers planning incomplete for this feature.
e The project delivery team determined this project to be infeasible.
f Land sold before it could be acquired. Remaining project elements completed outside of CERP.
g Includes C-23, C-24, C-25, and St. Lucie North and South Fork reservoirs (which have been estimated at 130,000 AF when combined with the C-44 Reservoir). The updated estimate includes the Indian River Lagoon-South (IRL-S) natural storage areas (30,000 AF). Note that although the storage capacity decreased significantly between the original CERP framework and the final IRL-S PIR, modeling analyses showed that the CERP objectives for the IRL-S project could be reached with substantially less storage.
h An FEB is operated with the primary objective to optimize performance of the STAs (e.g., reduce excessive loading and periods of drydown) rather than to optimize the quantity or timing of water flow to the natural system. Therefore, the hydrologic benefits may be less than other storage features, depending on their operational plans and objectives.
SOURCES: USACE and SFWMD (1999, 2004a, 2010, 2014a) and NRC (2005).
TABLE 4-2 Summary of Average Annual and Maximum Inflows and Outflows by Storage Feature
| STORAGE COMPONENT | Avg. Annual Acre-Feet In | Avg. Annual Acre-Feet Out | Max Annual Acre-Feet In | Max Annual Acre-Feet Out | Max Annual Inflow-Outflow | Yellow Book Capacity Acre-Feet |
|---|---|---|---|---|---|---|
| Lake Okeechobee | 2,537,300 | 1,803,400 | 4,263,200 | 4,022,700 | 2,231,900 | 3,817,000 |
| Water Conservation Areas | 1,633,200 | 316,100 | 3,138,600 | 567,200 | 2,879,200 | 1,882,000 |
| Total Above-Ground Reservoirs | 1,279,270 | 1,084,900 | 2,643,930 | 2,411,180 | 912,610 | 1,217,670 |
| Total In-Ground Reservoirs | 323,100 | 314,300 | 519,400 | 546,900 | 285,600 | 325,200 |
| Aquifer Storage and Recovery | 573,310 | 269,630 | 1,662,400 | 871,600 | 1,637,000 | Not applicable |
Notes from NRC (2005):“Many values in the table are based on simulation output [Alternative D13R of the South Florida Water Management Model, 11/98 version], which are reported to more significant figures than can be verified. These values provide only general comparisons of the magnitudes of flows and storage capacity, as no quantitative estimates of uncertainty are available. . . . Inputs to reservoirs do not include local precipitation or seepage. Outputs from reservoirs do not include evapotranspiration or ASR injection losses. Water fluxes to and from Water Conservation Areas (WCAs) include overland flow and groundwater seepage.”
SOURCE: Adapted from NRC, 2005.
constraints may lead to different outcomes in terms of mitigating high water releases from Lake Okeechobee, providing supplemental water to the ecosystem, and meeting other water demands. A 300,000-AF reservoir, if operated primarily to meet agricultural or urban water demand, may provide similar ecosystem benefits as a 70,000-AF reservoir operated primarily to supplement flows to the natural system. Similarly, a 50,000-AF flow equalization basin (FEB) designed to optimize performance of a stormwater treatment area (STA) would likely provide lower ecosystem flows than a similarly sized storage reservoir designed to
TABLE 4-3 ASR Components of the Restoration Plan
| # of Wells | Maximum Injection/Withdrawal Capacity at 5 MGD/well (in AF/yr) | Avg. Annual Acre-Feet In | Avg. Annual Acre-Feet Out | Max Annual Inflow, Acre-Feet | |
|---|---|---|---|---|---|
| Lake Okeechobee | 200 | 1,120,185 | 259,100 | 134,600 | 1,120,100 |
| Caloosahatchee (C-43) | 44 | 246,441 | 97,910 | 47,630 | 170,500 |
| C-51 | 34 | 190,431 | 80,500 | 24,200 | 135,700 |
| West Palm Beach (L-8) | 10 | 56,009 | 37,800 | 11,700 | 54,600 |
| Central Palm Beach Reservoir | 15 | 84,014 | 42,300 | 28,500 | 74,700 |
| Site 1 Impoundment (Hillsboro) | 30 | 168,028 | 55,700 | 23,000 | 106,800 |
| All | 333 | 1,865,108 | 573,310 | 269,630 | 1,662,400 |
See Note to Table 4-2, which applies also to Table 4-3.
SOURCE: Adapted from NRC, 2005 with updated numbers of ASR wells based on USACE and SFWMD (2015b).
maximize hydrologic benefits. The benefits of storage features are best examined through regional hydrologic and ecological modeling. Tables 4-2 and 4-3 summarize original CERP modeling results to allow basic comparison of the inflows and outflows provided by the different storage features. Scenario modeling of the ecological impacts of reduced storage is discussed later in the chapter.
In addition to new reservoirs, storage in Lake Okeechobee and the Water Conservation Areas (WCAs) were included as part of the integrated plan. Lake Okeechobee offers the largest storage capacity in the South Florida ecosystem (see Table 4-1) and is managed to address the multiple objectives of protecting and preserving lake habitat while providing flood control, water supply, and water deliveries for downstream ecosystems. Changes in Lake Okeechobee management and implications to water storage are discussed later in the chapter. The WCAs are not currently operated as reservoirs, although flows in and out of the WCAs are managed according to regulation schedules that have been established to address multiple objectives, including limiting seepage (and associated flooding) to the east, enhancing conditions for endangered species, and providing rain-driven flows to Everglades National Park and water supply to the Lower East Coast.
Additional CERP elements were proposed to enhance water availability for the natural system through seepage management or water reuse. Seepage man-
| Max Annual Outflow Acre-Feet | Max Annual Inflow-Outflow | Maximum Inflow or Outflow as % of Annual Pump Capacity | Updated Estimate with Proportional Max Inflow/Outflow | |||
|---|---|---|---|---|---|---|
| Inflow | Outflow | # Wells | Max Inflow | Max Outflow | ||
| 521,700 | 1,120,100 | 100.0 | 46.6 | 78 | 436,839 | 203,463 |
| 139,200 | 170,500 | 69.0 | 56.5 | 10 | 38,750 | 31,636 |
| 73,000 | 132,000 | 97.5 | 38.3 | 14 | 55,876 | 30,059 |
| 32,800 | 54,600 | 71.3 | 58.6 | 6 | 32,760 | 19,680 |
| 48,700 | 59,500 | 88.9 | 58.0 | 13 | 64,740 | 42,207 |
| 56,200 | 100,300 | 63.6 | 33.4 | 10 | 35,600 | 18,733 |
| 871,600 | 1,637,000 | 89.1 | 46.7 | 131 | 664,565 | 345,778 |
agement is a critical feature of the CERP and recent planning efforts (see USACE and SFWMD, 2014a; and the L-31N seepage management project2). The role of wastewater reuse in restoration plans is much less certain, as a pilot study to examine wastewater reuse as a source of fresh water for Biscayne Bay has not been advanced. Despite the importance of these projects to overall system benefits, they will not be discussed in this chapter because the incremental storage and volumetric flow benefits associated from these individual projects are difficult to determine with existing information.
The major CERP storage features, including surface and in-ground storage and aquifer storage and recovery, and their updated status are discussed in the following sections. The various components of storage are discussed in detail elsewhere and will only be summarized briefly here in the context of major developments in planned storage since the launch of the CERP. Readers interested in more detail should consult NRC (2005), the Yellow Book (USACE and SFWMD, 1999), and the Task Force 2014 Integrated Financial Plan (SFERTF, 2014) for additional information.
___________________
2 See also http://www.l31nseepage.org/index1.html.
Above-Ground Storage Reservoirs
In this section, the largest conventional above-ground reservoir features in the Yellow Book plan are described, organized by area (see also Table 4-1 and Figure 4-6). Smaller surface storage features are described in Box 4-3.
Kissimmee River Area
Storage north of Lake Okeechobee, could, by virtue of its location, benefit multiple geographic regions (e.g., Lake Okeechobee and areas to the east, west, and south of the lake). The CERP originally envisioned two reservoirs north of Lake Okeechobee: the 200,000-AF North Storage Reservoir and the 50,000-AF Taylor Creek/Nubbin Slough reservoir (each with accompanying STAs). The Taylor Creek/Nubbin Slough reservoir was one of ten initially authorized CERP projects. These reservoirs, paired with 200 ASR wells (discussed separately later in this section), would mitigate high and low flows to Lake Okeechobee, decrease stress on the lake’s littoral zone, and reduce the duration and frequency of damaging high and low flows to the Caloosahatchee and St. Lucie estuaries. No substantial planning progress has been made on either reservoir. They have now been combined into the Lake Okeechobee Watershed project, for which planning began in 2016 (see Chapter 3).
These CERP projects will complement other ongoing efforts outside of the CERP by the state of Florida as part of its Northern Everglades and Estuaries Protection Program. As of 2015, the SFWMD has established over 89,000 AF of dispersed water storage capacity in the Kissimmee, Caloosahatchee, and St. Lucie watersheds through a program that pays ranchers for providing storage on private lands (SFWMD, 2015b). The Lake Okeechobee Watershed Construction Project Phase II Technical Plan (SFWMD et al., 2008) identified 900,000 to 1,300,000 AF in storage projects to meet the state’s goals for water quality and quantity management for Lake Okeechobee and the northern estuaries (see Box 4-4). The 2016 Legacy Florida Act now provides steady state funding for projects in the northern Everglades (see Chapter 3).
Caloosahatchee River Area
The Yellow Book included the 160,000-AF Caloosahatchee C-43 West Reservoir in the Caloosahatchee River basin, along with 44 ASR wells. The project is intended to reduce the frequency of damaging high and low flows to the Caloosahatchee estuary by capturing local runoff and retaining a portion of the high-water regulatory releases from Lake Okeechobee and supplying water to the estuary during low flow conditions. The reservoir also provides a local
water supply. The C-43 West Reservoir was authorized in WRRDA 2014 as a 170,000-AF reservoir (16-feet deep; USACE and SFWMD, 2010). The ASR wells associated with the reservoir were not included in the project implementation report and have not been authorized.
Indian River Lagoon and the Upper East Coast
The CERP Yellow Book included plans for extensive storage in the Upper East Coast to attenuate high flows by capturing local runoff, providing water supply including low-flow augmentation for the Indian River Lagoon and St. Lucie River Estuary, and improving estuarine water quality. The plan included the 40,000-AF C-44 reservoir and an unspecified number of reservoirs on the north and south forks of the C-23/C-24/C-25 canal system in Martin and St. Lucie Counties representing an additional 349,000 AF storage capacity (see Figure 3-13).
In the development of the Indian River Lagoon-South (IRL-S) project implementation report, the project team determined that the goals and objectives of the CERP could be met with substantially less storage. The final plan, included 130,000 AF of reservoir storage, including the C-44 reservoir (50,600 AF, up to 15-feet deep; USACE and SFWMD, 2015d), with the remainder from other reservoirs. Additionally, 30,000 AF in natural storage will be provided from restored wetlands (USACE and SFWMD, 2004a). The project was authorized in WRDA 2007, and construction progress is under way at the C-44 reservoir.
Everglades Agricultural Area (EAA)
The Everglades Agricultural Reservoir was envisioned in the Yellow Book as a 360,000 AF storage unit (60,000 acres, 6-feet deep) consisting of three compartments. Compartment 1 (120,000 AF, filled from excess EAA runoff) was designed to meet irrigation demands. Compartment 2 (120,000 AF, filled from overflow to compartment 1 or Lake Okeechobee regulatory releases) was designed to meet demand for environmental uses but could supply irrigation needs if all environmental demands were met. Compartment 3 (120,000 AF, filled with overflow from compartment 2 or Lake Okeechobee regulatory releases) was to be used solely to enhance environmental deliveries. Overall, the project was intended to reduce flooding in the EAA, WCAs, and northern estuaries and provide water supply for irrigation and the remnant Everglades ecosystem (146,000 and 274,000 AF/year respectively). Compartments 1 and 2 were among the initially authorized projects (EAA Reservoir Phase 1) because of the environmental, flood control, and water supply benefits provided and because the lands had already been acquired (USACE and SFWMD, 1999).
Efforts were made to develop final plans for the Phase 1 EAA reservoir (USACE and SFWMD, 2006) considering a broad array of potential configurations and land footprint alternatives (USACE and SFWMD, 2004b). However, the project implementation report was never finalized, in part because of difficulties documenting benefits of the stand-alone reservoir to the WCAs and Everglades National Park (NRC, 2007). Construction of the A-1 reservoir (190,000 AF) began in 2006, expedited through the state’s Acceler8 program, but construction was halted in 2008 amidst legal challenges (Buermann, 2008) and shortly before the announcement of the U.S. Sugar land purchase.
Ultimately, prior to resolution of the reservoir project planning, the state and federal lands originally intended for use by the EAA reservoir system (see USACE and SFWMD, 2004b) were converted to other uses. Approximately 8,800 acres were added to STA-2 and 6,400 acres added to STA-5/6 as part of a SFWMD STA expansion project completed in 2012.3 The Restoration Strategies, launched in 2012 to satisfy state water quality standards for the Everglades Protection Area, used 16,600 acres for the 60,000-AF capacity A-1 FEB at the site where construction had already begun for the EAA Phase 1 Reservoir. The A-1 lands and initial construction were readily adaptable to the new purpose. The A-1 FEB was completed in 2015 (see Chapter 3) and is now operating, although it is intended to improve the quality of existing flows from EAA basin runoff and improve the functioning of the STAs to meet existing water quality requirements, rather than to increase flows to the Everglades ecosystem. Thus, its storage volume is not included among the updated storage capacity in Table 4-1.
The A-2 FEB included in the Central Everglades Planning Project has a capacity of 56,000 AF and was situated on the 14,500-acre Talisman property, also originally intended for the EAA reservoir. Although a 12-feet deep reservoir offered the greatest benefits of the Central Everglades Planning Project alternatives considered and was included among the cost-effective alternatives, a deep reservoir was judged to be too expensive ($1.8-2 billion estimated) for a project that was intended as a first increment of restoration. Like the A-1 FEB, the A-2 FEB will not be managed as a traditional reservoir but operations will be optimized to ensure that the STAs meet the required water quality criteria as the primary objective, with increased flow to the natural system from Lake Okeechobee as a secondary objective.
Overall, the storage provided in the EAA on state and federal lands in the CERP is substantially lower than that envisioned in the Yellow Book. The 240,000-AF capacity in the EAA Reservoir devoted to providing new water supply for the environment has effectively been replaced by a 56,000-AF FEB that
___________________
3 See http://my.sfwmd.gov/portal/page/portal/xweb%20protecting%20and%20restoring/restoration%20progress.
is optimized for water quality rather than storage. The 60,000-AF A-1 FEB is not included in this revised storage total because it is designed to treat existing flows. The A-2 FEB in the Central Everglades project will increase flows to the Everglades by approximately 210,000 AF/yr on average (USACE and SFWMD, 2014a; see Figure 4-1). This flow is 77 percent of the 274,000 AF/yr new water originally intended to be supplied to the Everglades by the CERP EAA Reservoir (as modeled for the Restudy; see NRC, 2005). Thus, the A-2 FEB, despite its much smaller size, provides a large proportion of average annual new CERP flows to WCA-3 but delivers a smaller proportion of the new CERP water to Shark River Slough (see Figure 4-1). As noted in a report by the University of Florida (UF, 2015), the A-2 FEB will not fully meet the dry season flow requirements of the Everglades, nor does it provide substantive relief to the St. Lucie and Caloosahatchee Estuaries by reducing the frequency of damaging high-volume freshwater discharges from Lake Okeechobee.
Future plans for storage in this region remain unclear. The Central Everglades project implementation report (USACE and SFWMD, 2014a) states that the A-2 FEB could be converted to a deep reservoir at a later date to provide an additional increment of storage. Likewise, the A-1 FEB was constructed with space outside the levee embankment to allow room for increasing the height to allow for greater storage. But no plans have documented remaining storage needs, and support for future action is uneven. Even though the Central Everglades Planning Project made clear that its investments in storage were intended as a first increment, the 2015 Report to Congress (USACE and DOI, 2016) states that the Central Everglades project features would replace the EAA Reservoir, and no future CERP costs are projected associated with the EAA Reservoir project. There has been no analysis to evaluate the implications of various levels of additional storage in the EAA (including no additional storage beyond CEPP) on achieving CERP objectives, although such planning is scheduled for 2021-2024 (USACE, 2016b).
Summary of Above-Ground Reservoir Storage
Plans have been developed and are being implemented to construct 386,000 AF of CERP storage in the South Florida ecosystem, out of the original 1.2 MAF outlined in the 1999 plan. Of this storage, 85 percent is located in either the Caloosahatchee or St. Lucie watershed, and only 15 percent can be used to enhance flow to the remnant Everglades ecosystem. Another 292,000 AF of above-ground storage originally envisioned in the CERP is not yet planned but is likely to be addressed in future planning efforts. However, it appears that more than 500,000 AF in storage is no longer envisioned to be constructed. In some cases (e.g., IRL-S), smaller storage reservoirs were able to meet the original
CERP project objectives, but in other cases, the land is no longer available or the project has been deemed infeasible, and no CERP analysis has evaluated the implications of these project changes to the overall restoration outcomes.
In-Ground Storage: Lake Belt and L-8 Features
The CERP included 325,000 AF of storage capacity in large in-ground reservoirs (see Table 4-1) located at former limestone mining sites in Palm Beach and Miami-Dade Counties. At this time, one reservoir has been repurposed for optimizing STA function and the two Lake Belt reservoirs have yet to be judged to be feasible storage alternatives. This section discusses the implications of these developments for the CERP.
L-8 Basin
The L-8 Basin reservoir was originally envisioned as a 48,000-AF capacity in-ground reservoir, paired with 10 ASR wells. Located in western Palm Beach County, the L-8 reservoir was intended to mitigate high and low discharges to the Loxahatchee River and Lake Worth Lagoon in addition to providing water supply. The L-8 Basin reservoir was converted to an FEB in Restoration Strategies, and because the FEB is operated to optimize the function of the STAs with existing flows, it will not provide the storage benefits intended in the original design. As of 2016, the Loxahatchee River Watershed Restoration project delivery team is evaluating other storage alternatives to replace this feature, including natural storage, shallow storage, and a storage reservoir paired with 2-4 ASR wells.
Lake Belt Reservoirs
Two large reservoirs were proposed in the Lake Belt region in Miami-Dade County. These sites were part of an “eastern flow-way” that captured urban stormwater runoff in Broward and Miami-Dade Counties and routed this water, in addition to water from WCAs 2 and 3, into Northeast Shark River Slough and Biscayne Bay. The Lake Belt reservoirs provided storage to alter the timing of flows and provide water when it is most needed during the dry season. The North Lake Belt reservoir (90,000 AF) was intended to augment canal flows in the dry season and enhance water deliveries to Biscayne Bay. The Central Lake Belt reservoir (190,000 AF) was envisioned to provide excess water from WCAs 2 and 3 to Northeast Shark River Slough, WCA 3B, and Biscayne Bay (USACE and SFWMD, 1999). The Lake Belt reservoirs provided an additional 342,000 AF/year to the Everglades, accounting for 68 percent of the new water provided under the CERP to Everglades National Park. Given that the modeled
water budgets showed that the CERP provided approximately 500,000 AF/year of new water to Shark River Slough in Everglades National Park (Figures B-1 and B-2 in Appendix B), loss of the Lake Belt reservoirs and the eastern flow-way could significantly reduce or possibly eliminate the new water provided to the park and Florida Bay.
Seepage barriers are necessary at the Lake Belt sites due to the high transmissivity of the groundwater aquifers in the area. NRC (2005) stated, “The technology required to create these seepage barriers at the required scale in permeable limestone has not yet been developed or tested, and hence both costs and feasibility associated with this storage component are uncertain.” No action has been taken on pilot studies of in-ground reservoir technology (originally scheduled to be completed from 1999-2012), even though the findings are essential to determine the feasibility of the Lake Belt reservoirs or the need for replacement storage options to meet the CERP objectives. Reforms included in WRRDA 2014 will sunset the pilot studies, and without them, the future of the Lake Belt reservoirs is unclear. No CERP analyses have been conducted to determine the impact to CERP outcomes if the Lake Belt features are never constructed or the feasibility of replacing these features with storage elsewhere in the system.
Aquifer Storage and Recovery
In the original Yellow Book plan, ASR represented a large fraction of the total CERP storage and provided important long-term storage benefits. The CERP envisioned 333 ASR wells (each 5-MGD) distributed across the region and often paired with reservoirs to enhance their storage capacity (see previous sections on above-ground reservoirs and NRC, 2015). The benefits of ASR are difficult to compare to reservoirs, because of the notable differences in the way ASR wells are operated. ASR wells have almost limitless storage capacity in the subsurface, and their benefits are primarily determined by recovery rates and pumping rates. Reservoirs typically can be filled much more quickly, depending on conveyance capacity. ASR wells often inject water for extended periods, and if suitable subsurface conditions exist, ASR wells are capable of providing recovered water over multi-year droughts in ways that even the largest reservoirs cannot. South Florida reservoirs more typically store water during wet periods and supply it in the immediately following dry season. Original CERP model simulations over a 31-year period (see Table 4-2) show that ASR provided a maximum annual storage (maximum annual inflow) of 1.7 MAF—more than 50 percent of the total provided by all other engineered CERP storage projects. In extreme dry years, ASR recovered as much as 872,000 AF of water (approximately 30 percent of the maximum outflow from all other engineered CERP storage). Average annual ASR recovery is less than half of that injected, by volume (see Table 4-3).
Uncertainties about science and engineering aspects of large-scale ASR in Everglades restoration led project planers to include a series of pilot projects in the recommended plan. USACE and SFWMD (2013a and 2015b) summarize the results of two single-well pilot projects and an 11-year regional study to address aggregate hydraulic, geophysical, and ecotoxicological effects of a system with 333 ASR wells (for more on the ASR Regional Study, see also Chapter 3 and NRC, 2015). Although the Hillsboro and Kissimmee ASR pilot projects reported “no fatal flaws” in the use of ASR at the single-well scale, the 11-year $25 million regional study (USACE and SFWMD, 2015b) reported that it is unlikely that the aquifer will sustain 333 wells as defined in the CERP. Modeling showed that a substantially reduced number of wells were needed to meet aquifer pressure and well pressure limits (94 in the Upper Florian Aquifer and 37 in the Avon Park Permeable Zone). Overall, the amount of water that can be stored and retrieved from ASR has been reduced by about 60 percent compared to what was envisioned in the original formulation of the CERP (Table 4-3). Planners could explore alternative well placement scenarios, including additional injection wells in the highly permeable Boulder Zone, where water recovery is not feasible. Although no modeling was conducted in the Regional Study to assess systemwide implications of only 131 ASR wells, the lost ASR storage would likely impact the ability to meet CERP goals and targets.
Lake Okeechobee Operations
A major factor that affects regional surface water storage in South Florida, and thus the ability of CERP to meet restoration goals, is the manner in which water levels are managed in Lake Okeechobee. Lake inflows and outflows are managed according to guidelines identified in lake regulation schedules. All regulation schedules for Lake Okeechobee have been developed in the context of a constraint created when the Herbert Hoover Dike was constructed—that the yearly inflow volume greatly exceeds the capacity of outlet structures to remove that water (USACE, 2007d). This situation demands a strategy of dropping the lake to a low level before the wet season so that water does not rise to dangerous levels where the dike could be breached, and then allowing the lake to become deeper prior to the dry season to ensure that there is adequate water for downstream agricultural and other uses.
Background and History of Lake Regulation Schedules
In 1951, the USACE implemented a formal schedule with distinct regulatory bands, which define seasonally varying water levels that, when exceeded, triggered water discharges from the lake (USACE, 1978). Refinements to the USACE
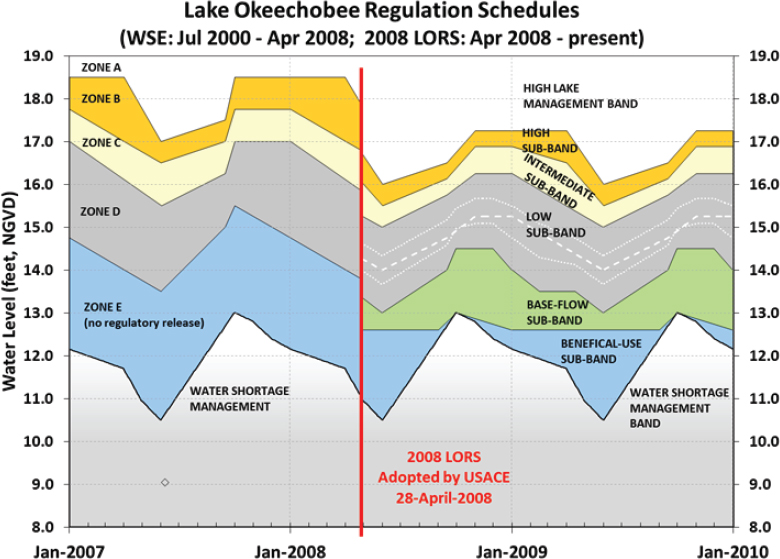
lake regulation schedules have been made several times primarily in response to periods of prolonged drought when the lake did not provide adequate water for regional uses that had been growing over time (SFWMD, 1988). The 1978 schedule in particular was focused on providing water supply and routinely held the lake at a relatively high level (up to 17.5 feet National Geodetic Vertical Datum [NGVD] 1929) to meet a large demand for irrigation water. An evaluation of the 1978 regulation schedule (SFWMD, 1988) concluded that the schedule’s high water levels were not necessary to meet water use demands and resulted in damaging large volume releases of freshwater to the Saint Lucie and Caloosahatchee estuaries. A new schedule (Run 25) was subsequently adopted, with the aim of reducing the frequency of occurrence of stages above 17 feet NGVD, reducing high volume releases of water to the estuaries, and still meeting requirements of water users. Run 25 was the federally-authorized regulation schedule during the development of the CERP, and therefore it is the operating schedule that was included in all regional hydrologic modeling used to screen restoration alternatives and develop for the CERP (USACE, 1999).
In the years since the CERP was developed, the regulation schedule for Lake Okeechobee has been modified twice. The first revised schedule, called Water Supply and Environment (WSE), was implemented in April 2000 and was developed to further reduce adverse impacts to the lake’s littoral zone and the estuaries (beyond what was accomplished by Run 25), while still meeting water supply demands. In the years leading up to development of the WSE schedule, a substantive number of research projects (e.g., Aumen and Wetzel, 1995) identified numerous values provided by the lake’s littoral zone. During the development of the WSE, USACE (1999) affirmed that the lake’s littoral zone—the western wetland region of the lake encompassing an area of approximately 500 km2—is biologically diverse; contains a mosaic of habitats including low-nutrient interior regions of sawgrass, spikerush, and periphyton that function much like the Everglades; and provide habitat for the federally endangered snail kite. The littoral zone also provides habitat for a diverse assemblage of fish and reptiles including economically important sport fish (Aumen and Wetzel, 1995; Havens and Gawlick, 2005). The ecological conditions of the littoral zone are affected by high water levels due to the configuration of the dike that surrounds the lake. Historically, when water levels in the lake increased in the wet season, the lake expanded in spatial extent into marsh regions to the northeast, south, and southwest (Havens et al., 1996). With an encircling dike, the lake became more constrained spatially, like a bathtub, and when water levels rise above 15 feet NGVD, the lake encompasses the entire surface area inside the dike. As depth increases in the littoral zone, several adverse impacts occur: the submerged plant community shifts from vascular plants to phytoplankton; phosphorus transport into the littoral zone increases, which can lead to cattail
expansion; and increased wave energy can cause a loss of emergent plants at the edge of the littoral zone (Johnson et al., 2007).
The WSE schedule incorporated, for the first time, a proactive “decision tree” into lake operations. Decisions about holding or releasing water were done not only based on current water levels but also on short- and long-term outlooks of inflow volume. Short-term outlooks were based on the hydrologic conditions (wet vs. dry) of the tributaries north of the lake, and the long-term outlooks were based on ocean circulation cycles that influence rainfall in South Florida, in particular the El Niño Southern Oscillation (ENSO) and Atlantic Multi-Decadal Oscillation (AMO).
In 2007, because of concerns for the structural integrity of the dike, the USACE began a comprehensive rehabilitation effort, to reinforce the Herbert Hoover Dike that surrounds Lake Okeechobee with total costs estimated at $1 billion (SFERTF, 2009; USACE, 2012b). The USACE also adopted a new lower Lake Okeechobee regulation schedule (LORS; USACE, 2007d), implemented in 2008, that was designed to hold the lake at what the USACE considered to be safe levels until dike rehabilitation was complete. Like the WSE, LORS 2008 has seasonally-varying bands that identify the amounts of water to be released from the lake to protect the dike and releases of water from the lake for flood control purposes are determined by rainfall projections, tributary hydrologic conditions, and multi-season climate projections (USACE, 2007c). A major difference from WSE is the explicit objective of LORS 2008 to hold Lake Okeechobee at a lower level, generally between 12.5 and 15.5 feet NVGD (USACE, 2007c) by continual low-volume releases to the estuaries and when necessary by high volume regulatory releases. This condition is done by managing water within bands shown in Figure 4-7 and described in Box 4-5. LORS 2008 was envisioned as an interim schedule until rehabilitation of key sections of the Herbert Hoover Dike were completed (USACE, 2007d).
Consequences of the LORS 2008 Regulation Schedule
Because Run 25 and the WSE schedule have the same upper band, there was not a reduction in the potential amount of water that could be held in the lake, even though operations were quite different. In contrast, the maximum water level in the LORS 2008 schedule is 1.25 feet lower than in Run 25 and WSE, which is equivalent to a loss of 564,000 AF of potential storage capacity in the lake. Considering monthly variations in the schedules, the LORS high management band is 1.00 to 1.75 feet lower than the WSE, reflecting equivalent losses in storage ranging from 460,000 to 800,000 AF depending on the time of year.4 As a
___________________
4 Calculated based on http://my.sfwmd.gov/gisapps/losac/sfwmd.asp.
SOURCE: SFWMD (2015b).
result, if CERP is implemented exactly as planned in the Yellow Book (USACE and SFWMD, 1999) and operated under today’s LORS 2008 lake regulation schedule, there would be a large potential shortfall in regional storage capacity. Options to make up for this lost storage could include surface storage in reservoirs, dispersed storage on land, and/or raising the water storage capacity of Lake Okeechobee.
If the upper band of lake regulation schedule is not increased once the Herbert Hoover Dike repairs are completed or if the storage is not replaced by other projects, this would result in substantially reduced water availability for environmental, agricultural, or urban uses and a lower reduction in harmful high-volume discharges to the estuaries than anticipated in the original CERP. On the other hand, the environmental impact statement for the current schedule indicated that it would provide substantive benefits for the lake’s littoral zone, and in fact, the acreage of submerged and emergent plants has been at record
high levels in recent years (Zhang et al., 2016)—though it is unclear whether this is because of the regulation schedule or a period of below-average rainfall in some of the years.
Options for Increased Future Water Storage in Lake Okeechobee
At this time, the USACE has not determined what, if anything, will be done with the Lake Okeechobee regulation schedule once rehabilitation of the Herbert Hoover Dike (see Chapter 3) is complete. A process to revise LORS 2008 is not scheduled to begin until 2022, after the start of the planning efforts on Lake Okeechobee Watershed (2017-2019), the Western Everglades (2017-2019), and EAA storage (2021-2023). The Herbert Hoover Dike Dam Safety Modification Study (USACE, 2016l), however, states that the regulation schedule can be revised concurrently with the rehabilitation efforts under way.
Any consideration of a new regulation schedule will need to take into account the various costs and benefits to the lake’s littoral zone, the northern estuaries, the Everglades WCAs, and water supply, considering the inter-dependencies of existing water storage, conveyance, and treatment infrastructure as well as that under construction (e.g., Restoration Strategies, C-43, C-44) and future projects that are authorized or likely to be authorized (e.g., Central Everglades) and storage options in other locations (e.g. Lake Okeechobee Watershed, EAA, Western Everglades). Given the many system interdependencies, it is difficult to fully assess these future costs and benefits from the LORS 2008 environmental impact statement (USACE, 2007d) analyses, which was based on existing infrastructure and other constraints that existed at that time. The comparison between LORS 2008 and WSE in USACE (2007d) indicated that under the WSE schedule, there was a five-fold greater risk of extreme high water levels (above 17 feet NVGD) in the lake that could (1) damage submerged vegetation and shoreline emergent plants; and (2) cause more phosphorus transport into the littoral zone. At the same time, WSE had a lower risk of long-lasting high flow events to the northern estuaries, which can negatively affect estuarine biota. The EIS indicated little difference between the two schedules regarding WCA performance measures (tree island flooding and peat dry-out), which likely reflects water quality treatment infrastructure constraints that still exist today regarding sending more treated water to the Everglades Protection Area. If those constraints are lessened by the CERP and other storage and treatment projects, then one can reasonably expect that a change in the lake schedule, in particular holding more water for delivery to the south, could have downstream benefits.
Estimated project costs of regaining 564,000 AF of lost storage by raising the lake can be compared against other storage options (Zhang et al., 2016). The financial costs for raising the lake levels likely are negligible, aside from the costs of conducting an environmental impact statement and any enhanced costs of operations. By comparison, the estimated annualized cost to store water in surface reservoirs has been estimated to range between $162-325 per acre foot capacity per year (Hazen and Sawyer, 2011; Lynch and Shabman, 2011) and the annualized costs of dispersed water management have been estimated between $77-268 per acre foot capacity per year (Gray and Lee, 2015; Meiers, 2013). The annualized cost for replacing the lost 564,000 AF storage capacity in the lake is estimated at $43-183 million/year. This simplified cost comparison does not include a full assessment of economic costs and benefits, including environmental costs and benefits and other social and economic factors, which would need to be included in a full consideration of storage alternatives.
Effects of Lost Storage on CERP Performance
A recent analysis of several restoration scenarios through the Synthesis of Everglades Research and Ecosystem Services (SERES) project (Arik et al., 2015) provides insights into the systemwide impacts that could occur with the loss of major elements of CERP storage. The SERES study focused on two of what they considered to be a short list of CERP components that have the largest effect on restoration: (1) storage and (2) the extent of levee removal and canal filling or decompartmentalization. Formulation of the storage alternatives was guided in large part by the findings of the ASR Regional Study Technical Data Report (USACE and SFWMD, 2015b), which suggested that ASR may only be feasible at a scale one-third of that proposed in the CERP, and the concern that the Lake Belt in-ground storage and Bird Drive reservoirs may not be feasible. In light of those observations, the SERES project formulated five scenarios to evaluate effects of loss of storage as well as options to offset those losses:
- Existing Condition (operated under LORS 2008)
- CERP, as designed in the Yellow Book
- Scaled-back CERP storage (approximately 1/3 of CERP ASR, no Lake Belt, no Bird Drive Reservoir), representing about half of the constructed storage in CERP; decompartmentalization is the same as CERP
- Expanded decompartmentalization and surface storage, no ASR
- Greatly expanded decompartmentalization and storage, no ASR
The following discussion focuses on the SERES project findings regarding the different benefits provided by the CERP as originally designed (SERES Scenario B) and a CERP plan with substantially reduced storage (Scenario C) compared to existing conditions. The storage features in these three scenarios are described in Table 4-4. Note that Scenario C (scaled-back CERP) still includes 360,000 AF water storage in the EAA Reservoir, even though the land at this time has been designated for low volume FEBs. Also, in the original SERES analysis, the lake regulation schedule for Scenarios B and C was assumed to be the WSE, which provides an additional 564,000 AF of potential storage. Upon request of the committee, the SERES team provided additional hydrologic modeling of the alternatives using LORS 2008 (R. Paudel, Everglades Foundation, personal communication, 2016), to illuminate the difference in restoration benefits from the current lower regulation schedule, in case the water levels allowed within this schedule are not increased in the future schedule modifications. These modified alternatives are Scenarios BLORS and CLORS.
The South Florida Water Management Model (SFWMM) was used to evaluate the hydrologic performance of each alternative and other model tools,
TABLE 4-4 Storage Features for Three Alternatives Considered in the SERES Analysis of Restoration Options
| Component | Alternative Scenarios | ||
|---|---|---|---|
| A: Base Conditions |
B: CERP |
C: Scaled-back CERP |
|
| Lake Okeechobee ASR (MGD) | 0 | 1000 | 250 |
| EAA Reservoir (kAF) | 0 | 360 | 360 |
| Lake Belt Reservoirs (kAF) | 0 | 280 | 0 |
| Bird Drive Reservoir (kAF) | 0 | 11.6 | 0 |
| Lake Regulation Schedule | LORS | WSE | WSE |
SOURCE: SERES Project (Arik et al. 2015).
including ecological and landscape models, were used to assess the ecological, water quality, and landscape impacts related to specific performance measures. The SFWMM was run using the 1965 to 2000 period of record of rainfall as the driver of the model. As was the case in the development of the CERP, this evaluation assumes future stationarity in the temporal distribution of rainfall. Particular attention is given in this review to water levels in Lake Okeechobee, high volume discharges to the St. Lucie and Caloosahatchee estuaries, and select hydrologic features in the Everglades.
Lake Okeechobee
Compared to Scenario B (CERP), Scenario C (scaled-back CERP) resulted in a slight increase in the occurrence of low and high water levels. However, when LORS 2008 is retained as the regulation schedule in CERP (Scenario BLORS), there is a substantial increase in low water levels compared to current conditions, which is further exacerbated under Scenario CLORS with reduced storage (see Table 4-5). Under LORS, the median water level in the lake under future restoration scenarios (BLORS and CLORS) is more than a foot lower than under WSE (Scenarios B and C), which generally would be beneficial to the lake’s submerged plant assemblage and the emergent littoral zone and its flora and fauna.
Northern Estuaries
As shown in Table 4-6 and Table 4-7, all the restoration scenarios lead to large reductions in the volume of discharges to the estuaries relative to base conditions. However, reducing regional storage results in a substantial increase in high volume discharges to the northern estuaries. Scenario C (scaled-back
TABLE 4-5 Lake Okeechobee Performance Measures for SERES CERP Scenarios
| A: Base Conditions (LORS) | WSE Reg. Sched. | LORS 2008 Reg. Sched. | |||
|---|---|---|---|---|---|
| B: CERP | C: Scaled-Back CERP | BLORS: CERP | CLORS: Scaled-Back CERP | ||
| Low Water Performance Measure (<10 ft NGVD), 100 is best | 85 | 74 | 69 | 66 | 60 |
| High Water Performance Measure (>17 ft NGVD), 100 is best | 99 | 93 | 88 | 100 | 99 |
| 50% Water Level (ft NGVD) | 13.4 | 13.8 | 13.8 | 12.6 | 12.6 |
NOTE: For the low and high water performance measures, higher numbers are better, with 100 being the best possible score to optimize lake habitat. A detailed description of calculation of the high and low lake stage performance measure can be found in RECOVER (2007c).
SOURCE: SERES Project (Arik et al., 2015); R. Paudel, Everglades Foundation, personal communication (2016).
TABLE 4-6 St. Lucie Estuary Performance Measures for SERES CERP Scenarios
| A: Base Condit ions (LORS) | WSE Reg. Sched. | LORS 2008 Reg. Sched. | |||
|---|---|---|---|---|---|
| B: CERP | C: Scaled-Back CERP | BLORS: CERP | CLORS: Scaled-Back CERP | ||
| Mean annual flood control (regulatory) releases (kAF) | 150 | 28 | 49 | 45 | 57 |
| High discharges (months, with avg. 2000-3000 cfs) | 45 | 20 | 17 | 19 | 19 |
| Very high discharges (months, with avg. >3000 cfs) | 30 | 8 | 15 | 9 | 11 |
| Low flow (months, with avg. <350 cfs) | 103 | 51 | 54 | 104 | 105 |
NOTE: Months are based on model results over 1965-2000. For both high and low discharges, a lower number is better for estuarine conditions and desired salinity.
SOURCE: SERES Project (2015); R. Paudel, Everglades Foundation, personal communication (2016).
TABLE 4-7 Caloosahatchee Estuary Performance Measures for SERES CERP Scenarios
| A: Base Conditions (LORS) | WSE Reg. Sched. | LORS 2008 Reg. Sched. | |||
|---|---|---|---|---|---|
| B: CERP | C: Scaled-Back CERP | BLORS: CERP | CLORS: Scaled-Back CERP | ||
| Mean annual flood control (regulatory) releases (kAF) | 390 | 78 | 131 | 182 | 208 |
| High discharges (months, with avg. 2800-4500 cfs) | 67 | 16 | 21 | 43 | 48 |
| Very high discharges (months, with avg. >4500 cfs) | 32 | 10 | 14 | 16 | 18 |
| Low flow (months, with avg. <450 cfs) | 121 | 55 | 63 | 77 | 77 |
NOTE: Months are based on model results over 1965-2000. For both high and low discharges, a lower number is better for estuarine conditions and desired salinity.
SOURCE: SERES Project (2015); R. Paudel, Everglades Foundation, personal communication (2016).
CERP with WSE) results in a 75 percent increase in regulatory releases by volume to the St. Lucie estuary and a 68 percent increase to the Caloosahatchee estuary compared to Scenario B (CERP with WSE) (see row 1 [mean annual flood control releases] of Tables 4-6 and 4-7). A reduction in CERP storage (Scenario C) also is associated with an increased number of months with high and very high flows, which can adversely impact the biota of the estuarine ecosystems.
Retaining the LORS regulation schedule in the CERP also results in higher flood control releases by volume compared to the CERP with WSE. Compared to the original CERP with WSE (Scenario B), CERP with LORS (Scenario BLORS) results in a 61 percent increase in regulatory discharges by volume to the St. Lucie estuary and a 133 percent increase for the Caloosahatchee (see row 1 of Tables 4-6 and 4-7). Additionally, in the Caloosahatchee, compared to CERP with WSE (Scenario B), CERP with LORS (Scenario BLORS) causes the number of months with high discharge to more than double and the number of months with very high discharge to increase by 60 percent. The number of months with low flow conditions (on average) in CERP with LORS (Scenario BLORS) is 40 percent higher than the original CERP with WSE (Scenario B) in the Caloosahatchee and approximately double (equal to the base condition) in the St. Lucie (see Tables 4-6 and 4-7).
With both scaled-back CERP and LORS (Scenario CLORS), the restoration benefits to the northern estuaries are substantially reduced from that envisioned in the CERP with WSE (Scenario B); the scaled-back CERP under LORS (Scenario CLORS) results in 104 and 167 percent increases in regulatory releases by volume to the St. Lucie and Caloosahatchee estuaries, respectively, compared to the original CERP projections with WSE (Scenario B).
Water Levels and Flows in the Remnant Everglades
Changing the lake regulation schedule has little effect on water levels or flows to various parts of the remnant Everglades. This was determined by comparing the hydrologic outputs from Scenarios B and C against Scenarios BLORS and CLORS for select areas:
- Stage duration curves for northern and southern WCA 3B;
- Stage duration curves in northern and central WCA 2A and WCA 2B;
- Stage duration curves in northeast Shark River Slough and the Rocky Glades;
- Stage duration curves in western Shark Slough; and
- Stage duration curves in the eastern and western Marl Prairies.
There are, however, noticeable systemwide effects of the removal of water storage features (i.e., differences between Scenarios B [CERP] and C [scaled-
back CERP]). Three examples of hydrologic effects are presented here. First, under Scenario C, there are substantial changes in ponding depth throughout the Everglades compared to Scenario B (see Figure 4-8). The differences seem largely driven by the removal of the Lake Belt reservoirs in Scenario C. Without the reservoirs, substantively lower ponding depths (0.05-0.5 ft) are observed in WCA 3B and the eastern side of Everglades National Park. In contrast, water
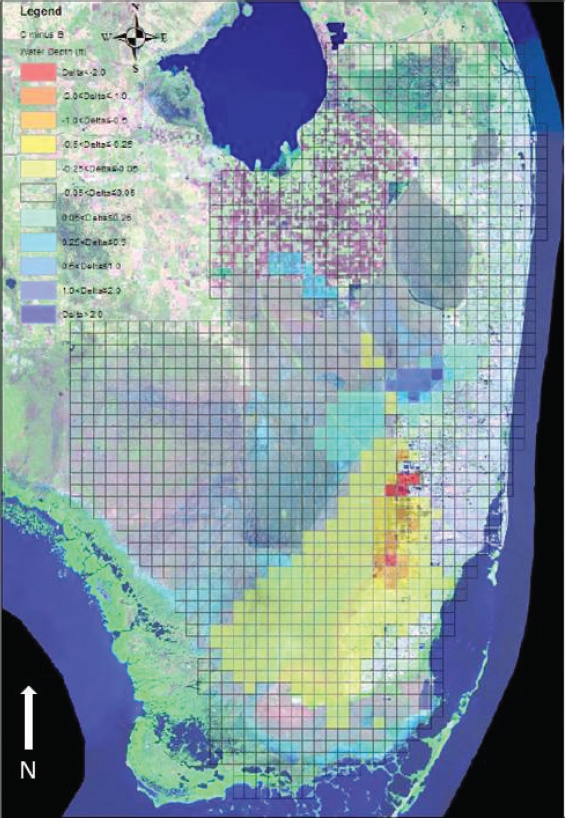
SOURCE: SERES Project (Arik et al., 2015).
levels in WCA 2B become substantively higher, because excess water is no longer being moved to the south via the eastern flow-way.
At a local scale, there is a substantive reduction in the flow of water across Transect 27, which bisects Shark River Slough and reflects the amount of water that flows seasonally toward the Gulf estuaries. Compared to Scenario B (CERP), under Scenario C, the average annual reduction in flow is 111,000 AF, with 49,000 AF less during the wet season and 62,000 AF less flow in the dry season on average. This potentially could have effects on the flora and fauna of the southern Everglades as well as on the salinity of the downstream estuaries. As a result of reduced flow in Scenario C (scaled-back CERP), average salinities in Florida Bay are increased by approximately 1 ppt (see Table 4-8), although it is not clear whether it is statistically or ecologically significant.
TABLE 4-8 Performance Measures under Scenario B (CERP) and Scenario C (Scaled-back CERP) Compared to Base Conditions
| Scenario A: Base Conditions, LORS 2008 | Scenario B: CERP + WSE | Scenario C: Scaled-Back CERP + WSE | |
|---|---|---|---|
| Florida Bay Salinity (avg.) in ppta | 28 | 26 | 27 |
| Flood control releases, Caloosahatchee (kAF)b | 390 | 78 | 131 |
| Flood control releases, St. Lucie (kAF)b | 150 | 28 | 49 |
| Average annual overland flow into northern WCA-3A from EAA (kAF) c | 170 | 424 | 425 |
| Average annual overland flow to Gulf Estuaries (kAF)c | 704 | 1314 | 1200 |
| Apple snail habitat quality in WCA-3A, Northd | |||
| Change in wading bird flock abundance (ENP)e | +12% | +9% | |
| Change in Fish Density (SRS)f | +31% | +28% | |
| Number of fire closure daysg | –78% | –67% |
NOTES: Shading reported from SERES Project (Arik et al., 2015).
a Green shading represents a difference from historic salinity levels of 2 ppt or less; while yellow is 3-5 ppt difference from historical conditions (24 ppt).
b Green indicates flood control releases reduced 75% or more compared to existing conditions; yellow is reduced less than 75%; red is existing conditions.
c Green is equal or exceeding 80% of NSM flows; yellow is 60-79% of NSM flows; red is less than 60% of NSM flows.
d Green reflects 0-20% of years with dry soil, yellow reflects 21-33% of years with dry soil, and red with more than 33% of years with dry soil. Colors based on weighted averages of likelihood of dry soil conditions in indicator regions. Data in Arik et al. (2015) are provided for each indicator region and colors are only provided for the overall average.
e Green reflects >5% average annual increase in wading bird abundance relative to Scenario A.
f Green reflects >5% average change in fish density relative to Scenario A.
g No color coding provided.
SOURCE: Data from SERES project (Arik et al., 2015).
This same pattern characterized other performance measures that reflect objectives of restoration of the central Everglades, such as apple snail habitat quality, wading bird abundance, and fish density (Table 4-8). Both Scenario B (CERP) and Scenario C (scaled-back CERP) produced benefits, but the former produced greater improvement than the latter. Reductions in benefits due to scaling back the CERP were not as dramatic as in the northern estuaries, but were consistent.
Implications for CERP Planning
Collectively, the knowledge gained since the start of the CERP has profound implications for restoration outcomes. Steps that could be taken to consider this information at a systemwide scale in the context of program-level adaptive management are discussed in Chapter 5. However, there are also near term implications for CERP planning, particularly related to water storage.
Systemwide Screening Analysis of Storage Alternatives
In light of the substantial storage that has been lost from the CERP plan, a systemwide screening-level analysis of alternatives formulated around key yet-to-be-initiated storage projects is needed. The purpose of the analysis is to identify the systemwide outcomes of various water storage alternatives, considering what has been learned about water storage feasibility to date, and the most cost-effective combinations of yet-to-be implemented storage alternatives to achieve CERP goals. Such a systemwide analysis is necessary to inform project planning.
Alternatives considered in this screening exercise should include various combinations and sizes of storage projects in the authorized CERP plan as well as any newly identified opportunities located north or south of Lake Okeechobee. This analysis should include in-lake, above-ground, and in-ground storage alternatives and ASR, although feasibility should be a key consideration of each element included. Effects of climate change on cost-effective alternatives, especially potential changes in precipitation and evapotranspiration, should also be examined. Examination of multiple direct outputs of a relatively large number of combinations and alternative capacities of interrelated projects is not trivial, but is manageable. Such analyses are consistent with early screening analyses conducted for the River of Grass and the Central Everglades planning processes, and output from these screening analyses can highlight the most cost-effective projects or combinations of projects that deserve further detailed analysis (i.e., those that deliver the largest intended benefits, such as habitat improvement or reduction in regulatory releases, for the cost without unacceptable impacts). Estimating impacts of those outputs on downstream ecological systems is a more
complex undertaking, one that could be limited to only a few alternatives or may be deferred to project planning efforts.
A hydrologic simulation model of storage facilities for this analysis can be much less complex than SFWMD’s systemwide model. The simpler model can be used to estimate relationships between storage capacities and direct outputs, such as frequencies of high and low flows, frequency distributions of downstream releases, distributions of reservoir states, and other performance measures. Those results, combined with storage-cost curves, can be used to estimate marginal increases in output with respect to cost leading to identification of storage capacities at which further expansion leads to diminishing returns to investments. Once cost-effective alternatives for storage have been identified, this information will inform more detailed analyses of performance measures, environmental benefits, and environmental risks. The committee recommends that a screening-level analysis of this type be undertaken as a preliminary step before proceeding to more detailed project planning north and south of the lake as well as for the lake itself.
Revisions to the Lake Okeechobee Regulation Schedule
The future lake schedule is critically important to future CERP planning decisions regarding storage north or south of the lake. The adoption of the LORS 2008 schedule, intended to reduce life safety risks in light of structural problems with the Herbert Hoover Dike (see Chapter 3), alone reduced potential storage by 564,000 AF. Yet, the potential for increasing lake levels in a future schedule remains unresolved. Replacing the storage lost by a return to a WSE-like schedule, could offset the need for some other constructed storage. In contrast, keeping LORS indefinitely could necessitate increased CERP storage to achieve the original restoration objectives.
Developing a new lake schedule would require a planning process, with extensive public involvement, that weighs ecological benefits to the lake, the northern estuaries, and the remnant Everglades; related economic impacts/benefits; and water supply. Much good science has been developed over the past decade to inform these discussions. Additionally, the Central Everglades Planning Project developed processes and tools to consider multiple benefits and tradeoffs, and to engage interested stakeholders in a way that promoted transparency and also enhanced interagency communication (see NRC, 2014).
According to the 2015 Integrated Delivery Schedule (USACE, 2016b), the planning process to revisit the lake regulation schedule is not anticipated to begin until 2022—after the planning process for storage north of the lake (Lake Okeechobee Watershed; 2016-2019) has been completed and the planning for south-of-the-lake storage (EAA storage and ASR/Decomp Phase 2; 2021-2024)
is already under way. Because of the huge quantity of storage provided (or lost) in small adjustments to the regulation schedule and the implications of those storage changes on CERP outcomes, an expedited evaluation of the Lake Okeechobee regulation schedule is needed to better inform ongoing and near-term storage planning. If storage plans are developed north or south of the lake prior to a reconsideration of LORS 2008, these project plans may need to be revisited considering changes to the regulation schedule. If agencies choose to delay planning efforts on projects to provide storage north or south of the lake until the revised lake schedule is determined, such delays should not adversely affect the pace of restoration progress. There is sufficient construction work associated with approved and authorized projects and for the Central Everglades Planning Project, which is pending authorization, to last at least the next 15 years with typical funding levels. The committee understands that the lake schedule may need to be again revised once the storage plans north and south of the lake have been established and constructed, but such a revision is anticipated to be relatively straight-forward.
Expediting a review of the lake regulation schedule could also potentially expedite benefits to the northern estuaries. Because the USACE requires a new assessment of dam safety and risk with any change to the regulation schedule (see Chapter 3), more time may be needed to finalize the new regulation schedule so that it is ready to be adopted as soon as the Herbert Hoover Dike rehabilitation is sufficiently complete to sustain higher water levels.
CONCLUSIONS AND RECOMMENDATIONS
Knowledge gained regarding the pre-drainage system, climate change, and sea level rise suggests that a reexamination of the CERP restoration goals—including both ecology and hydrology—is in order, together with a realistic assessment of what can be achieved. It is now widely accepted that the Everglades ecosystem was much wetter historically than previously thought. As a result, re-creating historic hydrology will require more new water and have different ecological outcomes than envisioned in the CERP. This information raises new issues and opportunities that should be considered in the context of future CERP design options, including the potential for improved conditions and likely risks associated with higher flows in the southern Everglades. Restoring pre-drainage features while preserving post-drainage features that are viewed as desirable, for example the presence of marl prairies inhabited by Cape Sable Seaside Sparrows, will be especially challenging. Even if the restored system cannot replicate the pre-drainage system or attain all the physical, chemical, and biological goals, improved ecosystem functioning is anticipated from partial attainment of objectives for historical water depth, and benefits from incremen-
tal restoration steps may be significant. Revised goals should also reflect the dynamic nature of the system and developing constraints imposed by climate change and sea level rise. Climate change has the potential for marked effects on the structure and functioning of the Everglades, increasing the need for CERP benefits that are robust in the face of climate change uncertainties or outcomes that help mitigate the effects of changing climate and sea level rise.
New information, project designs, and revised lake management rules have reduced the storage capacity envisioned originally in the CERP by over 1 million AF compared to the 1999 plan, which could have serious ecological consequences in both the northern estuaries and the Everglades ecosystem if this shortfall is not addressed. Major reductions in storage capacity are associated with the replacement of the EAA and L-8 Reservoirs with FEBs, the largely reduced capacity of regional ASR, the uncertain feasibility of the Lake Belt reservoirs, and the implementation of a new Lake Okeechobee regulation schedule. The amount of storage capacity provided by planned and authorized CERP projects to date plus the Central Everglades Planning Project (386,000 AF) is less than the 564,000 AF lost by the lower 2008 Lake Okeechobee regulation schedule. Additionally, based on the conclusions of the ASR Regional Study, estimated feasible ASR storage has been reduced by approximately 60 percent, reducing its maximum outflow capacity to a level comparable to a single large CERP reservoir and reducing CERP benefits provided in multi-year droughts. Recent scenario analyses by the SERES project show how loss of storage reduces restoration performance in the northern estuaries in terms of mean annual flood control releases and months with low flow. The SERES analyses show additional impacts to restoration benefits in the remnant Everglades ecosystem and Florida Bay. Further analysis is warranted to examine the implications of various levels of storage on CERP outcomes. It is possible that updated storage designs may be distributed and operated more effectively than originally envisioned, but sufficient information is not publicly available to predict the hydrologic and ecological effects of various changes in storage on the expected systemwide benefits of the CERP. Meanwhile, climate change scenario analyses suggest an increased need for water storage under both reduced and increased precipitation scenarios to mitigate future ecosystem and water supply impacts.
Considerable uncertainty exists regarding future Lake Okeechobee regulation, available water storage beyond Lake Okeechobee, and the impacts of a changing climate. This uncertainty should not be ignored; rather, it should be addressed and incorporated into CERP planning. To address scientific and planning uncertainties associated with climate change and water storage, there is a critical need to analyze these factors and their interacting effects in CERP planning efforts. A systemwide screening analysis of feasible, yet-to-be-implemented CERP storage alternatives is needed to evaluate modeled restoration outcomes
with various levels of storage. This screening could also identify the most cost-effective combinations of storage alternatives, which could be examined in more detail in individual project planning efforts. Assessments of hydrologic responses to changes in precipitation (including quantity, intensity, distribution, and changes in seasonality) under anticipated increases in temperature and evapotranspiration should be conducted on the most promising alternatives to demonstrate the outcomes of the CERP in the face of climate change and sea level rise with variable quantities and locations of storage.
The process to revise the Lake Okeechobee regulation schedule should be initiated as soon as possible in parallel with the Herbert Hoover Dike modifications to inform near-term project planning involving water storage north and south of the lake. The large impacts on water storage with just modest changes in the lake regulation schedule suggest that Lake Okeechobee is a central factor in future considerations of water storage. Decisions made on the future regulation schedule will affect storage needs both north and south of the lake and overall restoration outcomes and costs. A planning process, with substantial public engagement, would need to evaluate different regulation schedule options and their differential benefits for the lake, the northern estuaries, and the remnant Everglades as well as related economic and water supply impacts. Expediting the revision to the lake regulation schedule would also ensure that the process is complete (including a required dam safety risk assessment) so that the new schedule can be put into place as soon as the Herbert Hoover Dike repairs are determined to be sufficient to sustain higher water levels, thereby expediting ecological benefits to the northern estuaries. Once other storage elements are constructed, the lake schedule will likely need to be revisited to optimize its operations considering the additional storage features.


