
6
Analysis and Interpretation of Registry Health Outcome Data
As discussed in the previous chapters, the data collected by the Airborne Hazards and Open Burn Pit (AH&OBP) Registry questionnaire have important limitations. Nonetheless, this was the information available to the committee. This chapter uses the health outcomes data collected by the questionnaire to examine overall prevalence rates of selected conditions among registry participants and to assess associations between those health outcomes and the exposures of interest.
The chapter begins with a description of the health outcomes data collected from the registry questionnaire and an assessment of the scientific validity of the collected information. Using that information and the results of previous reports and epidemiological studies on burn pit exposures and health effects, the committee addresses the conditions and diseases that are the most plausibly affected by exposures to burn pits and other airborne hazards that might have been experienced during deployment to the Southwest Asia theater of operations. Selected demographic and military characteristics are then presented and described for those health conditions the committee considered to be of most interest: respiratory and cardiovascular conditions. The final part of the chapter describes the methods and results of multivariate analyses of exposures and the selected health outcomes, a mandated part of the committee’s charge that it has addressed with a full awareness of the serious inadequacies of using the data for such purposes. The chapter concludes with a discussion of how to interpret the associations of health outcome data and exposure data, but due to limitations noted, the committee does not draw any conclusions based on its analyses.
HEALTH OUTCOMES COLLECTED BY THE QUESTIONNAIRE
Box 6-1 lists all health outcomes identified in the questionnaire. All outcomes are self-reported. Some questions asked respondents about symptoms they have experienced or are currently experiencing. Others sought to capture the presence of specific diseases and were phrased as “Has a doctor or other health professional ever told you . . . ?” A few questions throughout the questionnaire included long lists of symptoms and conditions and asked respondents to indicate all that were applicable. However, many of the conditions in those lists were not included in more detail as separate questions elsewhere in the questionnaire.
The majority of health-related outcomes in the questionnaire focused on the respiratory and cardiovascular systems. While a few outcomes related to other organ systems were included, the committee regarded these questions as being too general to be of value in its analyses. Exposure to particulate matter from burn pits, dust, and other potential sources has been shown to acutely affect organ systems in addition to the respiratory and cardiovascular
systems, and thus these other systems are potential candidates for further research on acute and long-term effects as well (IOM, 2011; see Tables 5-1 and 6-2).
The questionnaire does not elicit information on many of the conditions that may be possible confounders—such as a history of specific lung infections—or that have been found to be associated with similar exposures, such as reduced lung function. The committee cautions that the limited information—both in number of conditions asked about and the failure to elicit specific details—precluded it from performing detailed analyses of many conditions.
Responses to questions on cancer diagnoses and history were not included in the committee’s analysis. This decision was based on several factors. First, the questions included in the cancer section were very general and limited to type and age at diagnosis for a maximum of three cancer diagnoses. No information was collected on stage, timing of related symptoms or additional diagnoses (that is, before, during, or after deployment), or treatment. Second, the committee considers the time since exposure to have been too short and the mean age of both the respondents and eligible populations of Gulf War and post-9/11 veterans to be too young for the development of most cancers that could be due to airborne hazards or open burn pit–related pollutants.
The committee limited its analysis of health outcomes to focus on symptoms, conditions, and diseases with latencies between the exposure and the likely disease onset of more than 6 months and less than 10 years; the health outcomes were also limited to those associated with the respiratory and the cardiovascular systems because these are the most plausible and well-documented potential health effects of the exposures of concern and have the most information collected from the registry. However, the registry’s data on health outcomes were not captured with the specificity that would be necessary to draw conclusions about the presence or absence of specific diagnoses in the registry population.
Strategies for Assessing Self-Reported Health Information
The committee applied multiple methods to both directly and indirectly examine the characteristics, attributes, and quality of the registry health data. Direct methods included analyses to check for internal consistency of the questionnaire; indirect methods included reviewing published comparisons of analyses using registry data and the Department of Veterans Affairs (VA) medical records.
This section reports the results of both the analyses that the committee directed and those that VA provided. Although all the analyses were carried out by the same contractor, they differ in their use of respondent data from different points in time, thereby consisting of different numbers of registry participants. VA provided data to the contractor that were not made available for the committee’s analyses because of VA-imposed restrictions on the use of personally identifiable information, and these data were used by the contractor to perform analyses that were not possible for the committee to conduct.
Comparisons with VA Health Record Diagnoses
VA evaluated the validity of self-reported conditions from registry respondents by comparing them with information contained in the VA health records for these same respondentswho used VA health care. The sample contained 7,078 registry participants who had completed the registry questionnaire as of March 31, 2015, and had at least one inpatient or outpatient visit with VA health care in each of the four years prior to registry participation (19.0% of all registry participants). International Classification of Diseases, Ninth Revision (ICD-9) codes for primary diagnosis and up to nine secondary diagnoses were used to confirm diagnoses. Prevalence was calculated using the proportion of participants who reported the condition on the questionnaire or who had the diagnostic code in their VA medical records. Sensitivity (the proportion of respondents who had the condition in the medical record and also affirmed it in the questionnaire), specificity (the proportion of respondents who did not have the condition in the medical record and did not report having it on the questionnaire), and positive predictive value (the proportion of respondents who reported the condition in the questionnaire and had it recorded in the VA medical record) were computed (see Table 6-1).
For most conditions, a higher prevalence was found on responses to the questionnaire than in VA medical records. The exceptions were for chronic obstructive pulmonary disease (COPD), coronary artery disease, myocardial infarction, and cancer; the largest differences in prevalence were for allergies and chronic bronchitis. The reasons for these differences are unclear, but the differences may be due to the conditions being diagnosed more than 4 years prior to participation in the registry, diagnosis by a non-VA provider, or, most likely for allergies, people having reported the symptoms after self-diagnosing it but never having sought medical treatment for them. Similarly, people who have been diagnosed with acute bronchitis may not know that it is distinct from chronic bronchitis. In addition, a diagnosis in the medical record (for example, coronary artery disease) may be self reported based on the clinical event (such as myocardial infarction) or symptom (such as angina pectoris) that was experienced by the respondent. Similarly, a diagnosis in the medical record with a broad scope, such as COPD, may be self-reported as a more specific condition (e.g., emphysema or chronic bronchitis). The highest sensitivity was 77.6% for hypertension. Sensitivity was moderate or low for most conditions, which suggests either that people diagnosed with these conditions are often not reporting them on the questionnaire or that people who report having the condition do not have it documented. The latter would explain the higher prevalence of most conditions based on the questionnaire. Specificity was high (greater than 90%) for most conditions, and lowest for
TABLE 6-1 Disease Prevalence Comparing VA Medical Records and Questionnaire Responses for 7,078 Registry Respondents
| Disease | Medical Record Diagnosis | Prevalence (%) | Questionnaire as a Screen for Disease from Codes (%) | ||||
|---|---|---|---|---|---|---|---|
| Yes | No | Medical Record | Questionnaire | Sensitivity | Specificity | Positive Predictive Value | |
| Allergies | 1,895 | 4,699 | 28.7 | 45.1 | 64.1 | 62.6 | 45.1 |
| Asthma | 1,202 | 5,477 | 18.0 | 20.7 | 60.3 | 87.9 | 20.7 |
| Emphysema | 31 | 6,703 | 0.5 | 2.6 | 61.3 | 97.7 | 10.8 |
| Chronic bronchitis | 91 | 6,425 | 1.4 | 18.6 | 62.6 | 81.7 | 4.6 |
| Chronic obstructive pulmonary disease | 694 | 5,916 | 10.5 | 7.2 | 29.7 | 95.4 | 43.3 |
| Constrictive bronchiolitis | 8 | 6,323 | 0.1 | 1.9 | 62.5 | 98.2 | 4.1 |
| Idiopathic pulmonary fibrosis | 3 | 6,335 | <.1 | 0.4 | 0.0 | 99.6 | 0.0 |
| High blood pressure | 3,045 | 3,758 | 44.8 | 47.2 | 77.6 | 77.4 | 73.5 |
| Coronary artery dissease | 339 | 6,350 | 5.1 | 3.8 | 37.2 | 98.0 | 50.2 |
| Myocardial infarction | 317 | 6,536 | 4.6 | 2.8 | 31.2 | 98.6 | 52.4 |
| Angina pectoris | 61 | 6,318 | 1.0 | 2.5 | 32.8 | 97.8 | 12.5 |
| Cancer | 660 | 6,230 | 9.6 | 7.8 | 40.6 | 95.6 | 49.6 |
SOURCE: Gasper and Kawata, 2015.
hypertension (77.4%) and allergies (62.6%). The high specificity for most conditions indicates that respondents who do not have the conditions (according to their VA medical records) also do not report having the conditions on the questionnaire. Positive predictive value varied considerably, from 0% for idiopathic pulmonary fibrosis to 73.5% for hypertension (Gasper and Kawata, 2015).
In a subsequent analysis, Liu et al. (2016) used a subpopulation of registry respondents (N = 4,343) for whom deployment dates and specific location information (military bases with and without documented burn pits) were available to examine the associations between geographic and self-reported burn pits emissions exposure and self-reported respiratory and cardiovascular conditions. Self-reported diagnoses were compared with VA medical record information for 2,857 respondents who used VA health care at least once between January 2007 and November 2015. Participants who reported having been diagnosed with a condition before deployment were excluded from both the analyses of self-report and the comparisons with VA medical records for that condition. Models were adjusted for demographic, lifestyle, and military service characteristics. The burn pit exposure measures were restricted to a population who were deployed to locations during periods when burn pits were known to operate. A strong dose–response association was found between cumulative days deployed within a 2-mile radius of a burn pit and self-reported emphysema, chronic bronchitis, or COPD. The same association was weaker when VA medical record diagnoses were used in place of self-report. In both the self-report and VA medical record analyses, no dose–response associations were found between cumulative days of deployment near a documented burn pit and the incidence of asthma, hypertension, or cardiovascular disease. When the number of self-reported hours per day of burn pit smoke was used as the exposure measure in place of days deployed near a burn pit, the associations with self-reported hypertension and the combined respiratory outcome of emphysema, chronic bronchitis, or COPD were strong and larger. On the other hand, neither of the burn pit emissions exposure measures variables (days or hours) showed a dose–response association with any of the respiratory or cardiovascular diagnoses in VA health records. The limited correlation between self-reported diagnoses and the diagnoses recorded in VA medical records may indicate a misidentification of self-reported health conditions, which in turn implies that analyses performed using self-reported diagnoses may likewise be affected.
Internal Consistency of the Questionnaire
As a way to check the internal consistency of the questionnaire, the committee performed a cross-tabulation to determine the agreement between respondents who endorsed functional limitations due to hypertension (2.1.F) and who also endorsed hypertension in 2.2.2.A. A similar cross-tabulation was made for those who endorsed functional limitations due to a lung/breathing problem (2.1.F) and those who endorsed at least one respiratory condition in 2.2.1.B–H. Table 6-2 shows the cross-tabulation between these health conditions and their corresponding functional limitations. Among those respondents who did not report hypertension, 0.5% reported functional limitations due to hypertension; in addition, among those who did not report any respiratory conditions, 13.6% reported functional limitations due to a lung/breathing problem. The disagreement for hypertension is likely due to erroneous self-report. The discordance between a lung/breathing problem and for any respiratory condition is likely due to both erroneous self-report and because functional limitations due to lung/breathing problems may result from undiagnosed respiratory conditions or perhaps other factors such as a lack of fitness. This analysis of comparing correspondence between reported functional limitations due to hypertension or lung problems and the reporting of the conditions themselves is by no means a perfect measure, especially because the wording of the questions for functional limitations and diagnosed respiratory and cardiovascular conditions differs, but it nonetheless raises questions. While there was high agreement with functional limitation due to hypertension and self-reported diagnosis of hypertension, a better correspondence would be expected between self-reported lung/breathing problem and any respiratory diagnoses. This suggests that there was reasonable internal consistency in the questionnaire, but, based on the lung and respiratory indicators, a closer correspondence would have generated more confidence in the reliability of the self-reported questionnaire data.
A second method that the committee used to check internal consistency was to examine the correlation of strong predictors, such as sex and smoking status and smoking status and respiratory and cardiovascular health outcomes. A higher proportion of women than men were nonsmokers, for example, which is consistent with the general population (CDC, 2014a). Using nonsmokers as the reference group, the associations between smoking status and each health outcome were considered. Former smokers and current smokers both had lower odds of asthma than nonsmokers. For the other conditions, former and current smokers had higher odds of each health outcome compared with nonsmokers. Nonsmokers were more likely to report no respiratory or cardiovascular conditions than were former and current smokers, but by contrast, nonsmokers were more likely to report having cardiovascular conditions alone than persons in the other smoking categories. Current smokers were more likely than nonsmokers and former smokers to report diagnoses of both respiratory and cardiovascular conditions and also respiratory conditions alone (data not shown). There were too few nonsmokers who reported no exposures to burn pits or other airborne hazards to use that group as a comparison to isolate the effect of airborne exposures on respiratory or cardiovascular outcomes.
TABLE 6-2 Endorsement of Health Conditions and Their Associated Functional Limitations
| Functional Limitations Due to Hypertension (Q 2.1.F.16) | ||
|---|---|---|
| Yes | No | |
| Hypertension (Q 2.2.2.A) | ||
| Yes | 5,324 (32.4%) | 11,109 (67.6%) |
| No | 134 (0.5%) | 27,856 (99.5%) |
| Functional Limitations Due to Lung/Breathing Problem (Q 2.1.F.19) | ||
| Yes | No | |
| Any respiratory condition (Q 2.2.1.B–H) | ||
| Yes | 7,019 (53.6%) | 6,088 (46.4%) |
| No | 4,017 (13.6%) | 25,589 (86.4%) |
The committee also examined body mass index (BMI) in relation to respiratory and cardiovascular outcomes. As expected, the respondents who were obese reported more respiratory and cardiovascular diagnoses and diagnoses of cardiovascular conditions alone than respondents with lower BMI. Normal BMI respondents were most likely to report neither respiratory nor cardiovascular condition diagnoses. Underweight responents had the highest percentage who reported a respiratory condition only. The strong correlation of smoking and BMI individually with higher odds of most outcomes is consistent with expected associations of smoking and BMI with respiratory and cardiovascular disease. This likewise suggests reasonable internal consistency of the questionnaire.
HEALTH CONDITIONS USED IN ANALYSES
The committee focused on the following health outcomes for its analysis:
- Asthma
- Functional limitation due to lung or breathing problem
- Emphysema/chronic bronchitis/COPD
- Any respiratory symptom
- Hypertension
- Coronary artery disease (CAD), myocardial infarction (MI), angina
The committee chose to group some of these conditions for analysis purposes even though separate questions were asked for each because there is overlap in the symptoms of many of these conditions, and the committee was concerned about the ability of respondents to distinguish among them. All except one of the questions used (functional limitation due to lung or breathing problem) were limited to respiratory and cardiovascular health outcomes that were diagnosed by a medical professional (“Have you ever been told by a doctor or health care provider that you have . . . ?”). Asthma and respiratory symptoms represent reactive airway disease. Respiratory symptoms included cough for more than 3 weeks, wheeze, sputum for more than 3 weeks, and non-angina chest pain in the past 12 months. Emphysema/chronic bronchitis/COPD represent chronic obstructive lung diseases, while CAD/MI/angina represent ischemic cardiac disease. In particular, both emphysema/chronic bronchitis/COPD and CAD/MI/angina represent groupings of common diagnoses whose meaning and usage by laypersons often overlap.
Functional limitation due to a lung or breathing problem was also included in the health outcomes examined by the committee because this represents the primary outcome of concern for registry participants with burn pit and other deployment-related inhalational exposures and provides information on the severity of the health condition. Studies of deployed service members have shown respiratory symptoms to be associated with substantial functional limitation and an inability to perform the military physical fitness testing required to maintain active duty status (King et al., 2011). The questionnaire section on functional limitations asked respondents to rate on a five-point scale how difficult specific activities (e.g., jogging a mile on level ground, walking a mile on level ground, walking up an incline, climbing a flight of stairs) were to perform. For any activity that was reported as “difficult,” respondents were then asked to indicate what condition or health problem caused the difficulty or difficulties. “Lung/breathing problem (for example, asthma and emphysema)” was one of the 36 possible choices that respondents could choose. It is not possible to determine which conditions cause the difficulty in activities if more than one functional limitation or condition is indicated. Of the 41,350 respondents who reported that at least one activity was “difficult,” more than two-thirds (67.8%) of respondents indicated more than one cause, and 12.4% indicated seven or more causes. If the cause of a functional limitation is a lung/breathing problem, this series of questions is designed to assess how severely it affects the respondent.
Table 6-3 shows the overall responses by health condition for all 46,404 participants for which the committee was given data. No adjustments have been made. The highest prevalence for a respiratory condition was for a functional limitation due to lung/breathing problem (25.7%) followed by allergies (23.0%), and the lowest prevalence was reported for emphysema (1.3%). Cardiovascular outcomes were less common, but more than one-third of registry respondents reported hypertension (35.6%). Few respondents reported other cardiovascular outcomes.
TABLE 6-3 Overall Respiratory and Cardiovascular Disease Frequencies Reported by All Respondents
| Yes | No | Refused | Missing | Don’t Know | |
|---|---|---|---|---|---|
| Respiratory Conditions | |||||
|
Allergies |
18,203 (23.0%) | 25,505 (55.0%) | 254 (0.6%) | 7 (0.02%) | 2,435 (5.3%) |
|
Asthma |
6,754 (14.6%) | 37,544 (81.0%) | 342 (0.7%) | 7 (0.02%) | 1,757 (3.8%) |
|
Emphysema |
588 (1.3%) | 44,221 (95.3%) | 178 (0.4%) | 7 (0.02%) | 1,410 (3.0%) |
|
Chronic bronchitis |
5,921 (12.8%) | 37,606 (81.0%) | 216 (0.5%) | 7 (0.02%) | 2,654 (5.7%) |
|
COPD |
1,524 (3.3%) | 42,612 (91.8%) | 201 (0.4%) | 7 (0.02%) | 2,060 (4.4%) |
|
Lung disease other than asthma, emphysema, chronic bronchitis, COPD |
4,333 (9.3%) | 39,341 (84.8%) | 219 (0.5%) | 7 (0.02%) | 2,504 (5.4%) |
|
Functional limitation due to lung/breathing problem* |
11,899 (25.7%) | 34,194 (73.7%) | 199 (0.4%) | 4 (0.01%) | 78 (0.2%) |
| Cardiovascular Conditions | |||||
|
Hypertension |
16,502 (35.6%) | 28,136 (60.6%) | 229 (0.5%) | 7 (0.02%) | 1,530 (3.3%) |
|
Coronary artery disease |
858 (1.9%) | 43,944 (94.7%) | 165 (0.4%) | 7 (0.02%) | 1,430 (3.1%) |
|
Angina pectoris |
578 (1.3%) | 42,894 (92.4%) | 156 (0.3%) | 8 (0.02%) | 2,768 (6.0%) |
|
Myocardial infarction |
644 (1.4%) | 44,764 (96.5%) | 136 (0.3%) | 7 (0.02%) | 853 (1.8%) |
|
Heart condition other than CAD, angina, or MI |
3,017 (6.5%) | 41,604 (89.7%) | 167 (0.4%) | 7 (0.02%) | 1,609 (3.5%) |
NOTE: CAD = coronary artery disease; COPD = chronic obstructive pulmonary disease; MI = myocardial infarction.
* Excludes 30 respondents who skipped this question because they did not report having a functional limitation.
The committee finds that the overall prevalence of reported respiratory and cardiovascular conditions (higher prevalence of asthma, allergies, and hypertension and lower prevalence of emphysema, COPD, angina pectoris, coronary artery disease, and myocardial infarction) is not unexpected for a population that is predominantly male, aged 25–60 (average age 38.7 years), and for whom about one-third report a current or former history of smoking (CDC, 2014b; Mozaffarian et al., 2015; Yoon et al., 2015).
The distribution of the number of respiratory and cardiovascular conditions reported by respondents based on their endorsement of one or more the 11 possible conditions listed in the questionnaire is shown in Table 6-4. Having a respiratory condition was defined as a yes response to any question from 2.2.1.A–2.2.1.F. Similarly, having a cardiovascular condition was defined as a yes response to any of the questions from 2.2.2.A–E. Just more than one-third (34.7%) of all registry respondents did not report a diagnosis of any respiratory or cardiovascular condition (see Table 6-5). For respondents who reported a diagnosis, 33.6% indicated a single condition, and 31.7% reported two or more conditions.
Table 6-6 shows the number and percent of respondents reporting both respiratory (answered yes to at least one question in 2.2.1.B–H or 2.1.F) and cardiovascular outcomes (answered yes to at least one question in 2.2.2.A–E), although the orgin of the conditions is unknown. The numbers in the cells are not mutually exclusive, as one person could have reported multiple respiratory and cardiovascular outcomes. For example, among respondents to the asthma and hypertension questions, 6.4% answered yes to having both health conditions.
Descriptive Statistics for Health Outcomes
The stratified analysis excludes respondents who reported that they were diagnosed before deployment (Question 2.2.1.I for respiratory conditions or Question 2.2.2.F for cardiovascular conditions) because it is not plausible that deployment caused the condition. However, because of the lack of specificity for these two questions, someone who, for example, self-reported post-deployment coronary heart disease (i.e., coronary artery disease, myocardial
TABLE 6-4 Distribution of Self-Reported Respiratory and Cardiovascular Conditions
| Number of Health Conditions | Frequency | Percent |
|---|---|---|
| 0 | 16,116 | 34.7 |
| 1 | 15,577 | 33.6 |
| 2 | 8,444 | 18.2 |
| 3 | 3,690 | 8.0 |
| 4 | 1,581 | 3.4 |
| 5 | 633 | 1.4 |
| 6 | 219 | 0.5 |
| 7 | 94 | 0.2 |
| 8 | 33 | 0.1 |
| 9 | 7 | 0.0 |
| 10 | 7 | 0.0 |
| 11 | 3 | 0.0 |
TABLE 6-5 Cross-Tabulation of Self-Reported Respiratory and Cardiovascular Conditions
| Hypertension | Coronary Artery Disease | Angina Pectoris | Myocardial Infarction | Other Heart Conditions | ||||||
|---|---|---|---|---|---|---|---|---|---|---|
| N | % | N | % | N | % | N | % | N | % | |
| Asthma | 2,762 | 6.4 | 194 | 0.5 | 154 | 0.4 | 150 | 0.3 | 608 | 1.4 |
| Emphysema | 318 | 0.7 | 67 | 0.2 | 40 | 0.1 | 47 | 0.1 | 82 | 0.2 |
| Chronic bronchitis | 2,748 | 6.5 | 229 | 0.5 | 174 | 0.4 | 193 | 0.5 | 630 | 1.5 |
| COPD | 805 | 1.9 | 144 | 0.3 | 85 | 0.2 | 101 | 0.2 | 222 | 0.5 |
| Other lung conditions | 1,990 | 4.7 | 200 | 0.5 | 132 | 0.3 | 125 | 0.3 | 560 | 1.3 |
| Constrictive bronchiolitis | 259 | 0.6 | 26 | 0.1 | 24 | 0.1 | 19 | 0.0 | 71 | 0.2 |
| Any pulmonary fibrosis | 63 | 0.2 | 14 | 0.0 | 8 | 0.0 | 7 | 0.0 | 28 | 0.1 |
| Functional limitation due to lung/breathing problem | 4,648 | 10.5 | 324 | 0.7 | 234 | 0.5 | 255 | 0.6 | 987 | 2.2 |
NOTE: COPD = chronic obstructive pulmonary disease.
TABLE 6-6 Frequencies of Self-Reported Diagnoses for Any Respiratory or Cardiovascular Conditions Before Versus During or After Deployment
| Deployment Status | ||
|---|---|---|
| Before Deployment | During/After Deployment | |
| Any respiratory conditions (N = 12,563) | 1,266 (10.1%) | 11,297 (89.9%) |
| Any cardiovascular conditions (N = 17,168) | 1,208 (7.0%) | 15,960 (93.0%) |
infarction, or angina pectoris) could have been excluded if the person had pre-deployment hypertension rather than pre-deployment coronary heart disease, but there is no way to address this other than through exclusions. The committee examined the distribution of the responses with regard to deployment status, in which respiratory or cardiovascular diagnoses before deployment were grouped separately from diagnoses that occurred during and after deployment. No respondents selected all three time periods (before, during, or after deployment), and none chose both before and during deployment. About 12% (1,630) of respondents selected both during and after deployment. As shown in Table 6-6, of the 12,563 participants who were diagnosed with any respiratory condition and had information on the timing of diagnosis with regard to deployment status, 10.1% were diagnosed before deployment. Of the 17,168 participants who were diagnosed with any cardiovascular condition and had information on the timing of diagnosis with regard to deployment status, 7.0% were diagnosed before deployment.
Tables 6-7 and 6-8 show each of the health outcome category diagnoses limited to those reported during and after deployment and stratified by select demographic and lifestyle characteristics that were available to the committee. The questionnaire does not contain questions on demographic characteristics; that information was obtained by linking the registry data to the Department of Defense (DoD) administrative data (Contingency Tracking System [CTS] and Gulf War Oil Well Fire Smoke Registry files). Service members deployed during the stabilization era (1992–2001) only are not included in those files, and thus their demographic characteristics are missing and not available for comparison. The administrative data do not contain updated information on demographic covariates, such as marital status or education; however, those factors are not considered central to the analyses. Gender and race/ethnicity information was derived from the most recent deployment in the CTS or Gulf War Oil Well Fire Smoke Registry file for which the data were not missing; age was taken from the AH&OBP Registry at the time of questionnaire completion. Smoking status was derived using Questions 2.5.A and 2.5.C from the questionnaire. Table 6-7 shows the number and percentage of respondents by demographic and other attributes who did and did not report a diagnosis of each health outcome category. Table 6-8 shows the odds ratios, upper and lower confidence limits, and p-values for each demographic category by health outcome. For both tables, the associations with sex, age, or race as the main independent variable are unadjusted. Associations where smoking status is the main independent variable are adjusted for sex, age, and race. Associations where BMI is the main independent variable are adjusted for sex, age, race, and smoking status. The finding that the proportion of respondents with a functional limitation due to a lung/breathing problem was nearly equal for all age groups was unexpected (see Table 6-7). However, the committee was unable to further assess this finding because national prevalence data for lung/breathing problems due to functional limitation as elicited in the questionnaire are not available.
Potential confounders such as age, smoking, and BMI were examined as they are often associated with respiratory diseases (i.e., emphysema, chronic bronchitis, or COPD) and cardiovascular diseases (i.e., CAD, MI, or angina pectoris). Table 6-8 provides the adjusted associations of age, smoking, and BMI with selected groups of respiratory and cardiovascular conditions, better reflecting an independent association with these predictors. As expected, older age, being a current smoker, and being overweight or obese were associated with a higher prevalence of self-reported respiratory or cardiovascular diseases. These results provide some assurance of the quality of self-reported information on potential confounders and health conditions.
Other covariates that were used in the committee’s analyses include military occupation, country of deployment, service branch, rank, unit component, and total length of deployment. The distribution of military characteristics by era for respondents and eligible nonrespondents is shown in Table 4-2 in Chapter 4. Although all military factors were statistically significant predictors because of the size of the respondent population, they are not included in the health outcomes tables because they are not informative for assessing the accuracy of self-reported health outcomes.
Women report a higher prevalence of asthma and chronic respiratory conditions (diagnoses of emphysema, chronic bronchitis, and COPD combined) than men. Men reported a higher prevalence of all cardiovascular conditions. Using younger than 30 years old as the reference group, the odds of each health outcome category increased with each increasing age group. Similarly, using white race as the reference group, the odds of each health outcome were increased for black, Hispanic, and other races. Compared with a BMI classified as underweight or normal weight, overweight and obese respondents had higher odds of each of the health outcomes.
TABLE 6-7 Number and Percent of Health Outcomes Reported During or After Deployment by Demographic Categories
| Asthma | Emphysema, Chronic Bronchitis, or COPD | Any Respiratory Symptoms | Functional Limitation Due to Lung Problem | |||||||||||||||||||
|---|---|---|---|---|---|---|---|---|---|---|---|---|---|---|---|---|---|---|---|---|---|---|
| Yes | No | Missing | Yes | No | Missing | Yes | No | Yes | No | Missing | ||||||||||||
| N | % | N | % | N | % | N | % | N | % | N | % | N | % | N | % | N | % | N | % | N | % | |
| Total | 5,861 | 13.0 | 37,189 | 82.4 | 2,088 | 4.6 | 6,470 | 14.3 | 35,286 | 78.2 | 3,382 | 7.5 | 34,533 | 74.4 | 11,871 | 25.6 | 11,899 | 25.6 | 34,194 | 73.7 | 311 | 0.7 |
| Sex | ||||||||||||||||||||||
|
Male |
4,873 | 12.1 | 33,487 | 83.2 | 1,871 | 4.7 | 5,435 | 13.5 | 31,749 | 78.9 | 3,047 | 7.6 | 30,723 | 74.3 | 10,622 | 25.7 | 10,487 | 25.4 | 30,582 | 74.0 | 276 | 0.7 |
|
Female |
912 | 20.1 | 3,425 | 75.6 | 192 | 4.2 | 939 | 20.7 | 3,292 | 72.7 | 298 | 6.6 | 3,498 | 74.8 | 1,180 | 25.2 | 1,295 | 27.7 | 3,351 | 71.6 | 32 | 0.7 |
|
Missing |
76 | 20.1 | 277 | 73.3 | 25 | 6.6 | 96 | 25.4 | 245 | 64.8 | 37 | 9.8 | 312 | 81.9 | 69 | 18.1 | 117 | 30.7 | 261 | 68.5 | 3 | 0.8 |
| Age at questionnaire completion (years) | ||||||||||||||||||||||
|
<30 |
914 | 11.9 | 6,364 | 83.2 | 373 | 4.9 | 985 | 12.9 | 6,117 | 80.0 | 549 | 7.2 | 5,838 | 73.8 | 2,068 | 26.2 | 2,006 | 25.4 | 5,842 | 73.9 | 58 | 0.7 |
|
30–39 |
2,159 | 12.4 | 14,505 | 83.0 | 816 | 4.7 | 2,162 | 12.4 | 14,045 | 80.3 | 1,273 | 7.3 | 13,254 | 73.7 | 4,729 | 26.3 | 4,460 | 24.8 | 13,392 | 74.5 | 131 | 0.7 |
|
40–49 |
1,922 | 13.7 | 11,478 | 81.9 | 619 | 4.4 | 2,202 | 15.7 | 10,693 | 76.3 | 1,124 | 8.0 | 10,685 | 74.4 | 3,682 | 25.6 | 3,724 | 25.9 | 10,551 | 73.4 | 92 | 0.6 |
|
50–59 |
749 | 14.4 | 4,210 | 80.9 | 246 | 4.7 | 979 | 18.8 | 3,861 | 74.2 | 365 | 72.0 | 4,134 | 77.3 | 1,212 | 22.7 | 1,474 | 27.6 | 3,847 | 72.0 | 25 | 0.5 |
|
≥60 |
117 | 14.9 | 632 | 80.7 | 34 | 4.3 | 142 | 18.1 | 570 | 72.8 | 71 | 9.1 | 622 | 77.6 | 180 | 22.4 | 235 | 29.3 | 562 | 70.1 | 5 | 0.6 |
| Race | ||||||||||||||||||||||
|
White |
3,447 | 11.7 | 24,666 | 83.9 | 1,269 | 4.3 | 3,865 | 13.2 | 23,567 | 80.2 | 1,950 | 6.6 | 22,248 | 73.6 | 7,966 | 26.4 | 7,762 | 25.7 | 22,231 | 73.6 | 221 | 0.7 |
|
Black |
640 | 17.5 | 2,818 | 77.2 | 190 | 5.2 | 710 | 19.5 | 2,590 | 71.0 | 348 | 9.5 | 2,858 | 75.7 | 915 | 24.3 | 980 | 26.0 | 2,774 | 73.5 | 19 | 0.5 |
|
Hispanic |
490 | 14.9 | 2,599 | 79.0 | 200 | 6.1 | 443 | 13.5 | 2,491 | 75.7 | 355 | 10.8 | 2,632 | 78.1 | 740 | 21.9 | 801 | 23.8 | 2,548 | 75.6 | 23 | 0.7 |
|
Other |
173 | 12.1 | 1,161 | 81.3 | 94 | 6.6 | 183 | 12.8 | 1,105 | 77.4 | 140 | 9.8 | 1,064 | 71.9 | 416 | 28.1 | 329 | 22.2 | 1,138 | 76.9 | 13 | 0.9 |
|
Missing |
1,111 | 15.0 | 5,945 | 80.4 | 335 | 4.5 | 1,269 | 17.2 | 5,533 | 74.9 | 589 | 8.0 | 5,731 | 75.8 | 1,834 | 24.2 | 2,027 | 26.8 | 5,503 | 72.7 | 35 | 0.5 |
| Smoking | ||||||||||||||||||||||
|
Nonsmoker |
3,449 | 13.5 | 20,848 | 81.6 | 1,242 | 4.9 | 3,218 | 12.6 | 20,357 | 79.7 | 1,964 | 7.7 | 18,823 | 71.8 | 7,389 | 28.2 | 6,535 | 24.9 | 19,485 | 74.3 | 192 | 0.7 |
|
Former smoker |
1,297 | 12.8 | 8,510 | 83.8 | 352 | 3.5 | 1,588 | 15.6 | 7,944 | 78.2 | 627 | 6.2 | 7,904 | 75.4 | 2,575 | 24.6 | 2,794 | 26.7 | 7,663 | 73.1 | 22 | 0.2 |
|
Current smoker |
567 | 10.8 | 4,493 | 85.7 | 182 | 3.5 | 1,005 | 19.2 | 3,931 | 75.0 | 306 | 5.8 | 4,501 | 83.0 | 919 | 17.0 | 1,463 | 27.0 | 3,948 | 72.8 | 9 | 0.2 |
|
Missing |
548 | 13.1 | 3,338 | 79.5 | 312 | 7.4 | 659 | 15.7 | 3,054 | 72.7 | 485 | 11.6 | 3,305 | 77.0 | 988 | 23.0 | 1,107 | 25.8 | 3,098 | 72.2 | 88 | 2.0 |
| Body mass index | ||||||||||||||||||||||
|
Underweight/Normal |
784 | 10.4 | 6,407 | 85.3 | 316 | 4.2 | 859 | 11.4 | 6,135 | 81.7 | 513 | 6.8 | 5,268 | 68.1 | 2,467 | 31.9 | 1,669 | 21.6 | 6,003 | 77.6 | 63 | 0.8 |
|
Overweight |
2,478 | 11.4 | 18,300 | 84.3 | 943 | 4.3 | 2,746 | 12.6 | 17,425 | 80.2 | 1,550 | 7.1 | 16,035 | 71.9 | 6,272 | 28.1 | 5,351 | 24.0 | 16,818 | 75.4 | 138 | 0.6 |
|
Obese |
2,455 | 16.5 | 11,758 | 78.9 | 686 | 4.6 | 2,688 | 18.0 | 11,081 | 74.4 | 1,130 | 7.6 | 12,470 | 81.3 | 2,863 | 18.7 | 4,618 | 30.1 | 10,666 | 69.6 | 49 | 0.3 |
|
Missing |
144 | 14.2 | 724 | 71.6 | 143 | 14.1 | 177 | 17.5 | 645 | 63.8 | 189 | 18.7 | 760 | 73.9 | 269 | 26.1 | 261 | 25.4 | 707 | 68.7 | 61 | 5.9 |
| Hypertension | CAD, MI, or Angina Pectoris | |||||||||||
|---|---|---|---|---|---|---|---|---|---|---|---|---|
| Yes | No | Missing | Yes | No | Missing | |||||||
| N | % | N | % | N | % | N | % | N | % | N | % | |
| Total | 15,531 | 34.4 | 27,908 | 61.7 | 1,757 | 3.9 | 1,513 | 3.3 | 40,485 | 89.6 | 3,198 | 7.1 |
| Sex | ||||||||||||
Male |
14,440 | 35.8 | 24,219 | 60.1 | 1,631 | 4.0 | 1,376 | 3.4 | 35,975 | 89.3 | 2,939 | 7.3 |
Female |
888 | 19.6 | 3,530 | 77.9 | 114 | 2.5 | 100 | 2.2 | 4,216 | 93.0 | 216 | 4.8 |
Missing |
203 | 54.3 | 159 | 42.5 | 12 | 3.2 | 37 | 9.9 | 294 | 78.6 | 43 | 11.5 |
| Age at questionnaire completion (years) | ||||||||||||
<30 |
2,375 | 30.9 | 4,978 | 64.7 | 336 | 4.4 | 178 | 2.3 | 7,034 | 91.5 | 477 | 6.2 |
30–39 |
5,463 | 31.3 | 11,294 | 64.6 | 718 | 4.1 | 404 | 2.3 | 15,947 | 91.3 | 1,124 | 6.4 |
40–49 |
5,214 | 37.2 | 8,308 | 59.3 | 498 | 3.6 | 595 | 4.2 | 12,341 | 88.0 | 1,084 | 7.7 |
50–59 |
2,128 | 40.7 | 2,921 | 55.9 | 181 | 3.5 | 280 | 5.4 | 4,491 | 85.9 | 459 | 8.8 |
≥60 |
351 | 44.9 | 407 | 52.0 | 24 | 3.1 | 56 | 7.2 | 672 | 85.9 | 54 | 6.9 |
| Race | ||||||||||||
White |
9,206 | 31.3 | 19,095 | 64.9 | 1,115 | 3.8 | 826 | 2.8 | 26,849 | 91.3 | 1,741 | 5.9 |
Black |
1,650 | 45.5 | 1,846 | 50.9 | 130 | 3.6 | 208 | 5.7 | 3,030 | 83.6 | 388 | 10.7 |
Hispanic |
1,077 | 32.6 | 2,032 | 61.5 | 195 | 5.9 | 97 | 2.9 | 2,922 | 88.4 | 285 | 8.6 |
Other |
503 | 34.7 | 863 | 59.6 | 83 | 5.7 | 40 | 2.8 | 1,278 | 88.2 | 131 | 9.0 |
Missing |
3,095 | 41.8 | 4,072 | 55.0 | 234 | 3.2 | 342 | 4.6 | 6,406 | 86.6 | 653 | 8.8 |
| Smoking | ||||||||||||
Nonsmoker |
8,612 | 33.8 | 15,917 | 62.5 | 948 | 3.7 | 779 | 3.1 | 22,939 | 90.0 | 1,759 | 6.9 |
Former Smoker |
3,673 | 36.0 | 6,188 | 60.7 | 336 | 3.3 | 386 | 3.8 | 9,227 | 90.5 | 584 | 5.7 |
Current Smoker |
1,828 | 34.4 | 3,317 | 62.4 | 174 | 3.3 | 219 | 4.1 | 4,748 | 89.3 | 352 | 6.6 |
Missing |
1,418 | 33.7 | 2,486 | 59.1 | 299 | 7.1 | 129 | 3.1 | 3,571 | 85.0 | 503 | 12.0 |
| Body mass index | ||||||||||||
Underweight/Normal |
1,344 | 17.7 | 5,965 | 78.7 | 270 | 3.6 | 136 | 1.8 | 7,028 | 92.7 | 415 | 5.5 |
Overweight |
6,679 | 30.8 | 14,148 | 65.2 | 874 | 4.0 | 620 | 2.9 | 19,716 | 90.9 | 1,365 | 6.3 |
Obese |
7,122 | 47.8 | 7,292 | 48.9 | 494 | 3.3 | 725 | 4.9 | 12,949 | 86.9 | 1,234 | 8.3 |
Missing |
386 | 38.3 | 503 | 49.9 | 119 | 11.8 | 32 | 3.2 | 792 | 78.6 | 184 | 18.3 |
NOTES: There are no missing data for any respiratory symptoms because the data were derived from a check-all-that-apply item and coded 1 if the respondent checked any symptom and 0 otherwise. CAD = coronary artery disease; COPD = chronic obstructive pulmonary disease; MI = myocardial infarction.
TABLE 6-8 Odds Ratios and Confidence Intervals for Health Outcomes Reported During or After Deployment by Demographic Categories
| Asthma | Emphysema, Chronic Bronchitis, or COPD | Any Respiratory Symptoms | Functional Limitation Due to Lung Problem | |||||||||||||
|---|---|---|---|---|---|---|---|---|---|---|---|---|---|---|---|---|
| OR | LCL | UCL | P-value | OR | LCL | UCL | P-value | OR | LCL | UCL | P-value | OR | LCL | UCL | P-value | |
| Sex | ||||||||||||||||
| Male | (ref) | |||||||||||||||
| Female | 1.8 | 1.7 | 2.0 | * | 1.7 | 1.5 | 1.8 | * | 1.0 | 1.0 | 1.1 | 0.49 | 1.1 | 1.1 | 1.2 | * |
| Missing | 1.9 | 1.5 | 2.4 | * | 2.3 | 1.8 | 2.9 | * | 1.6 | 1.2 | 2.0 | * | 1.3 | 1.1 | 1.6 | 0.02 |
| Age (years) | ||||||||||||||||
| <30 | (ref) | |||||||||||||||
| 30–39 | 1.0 | 1.0 | 1.1 | 0.40 | 1.0 | 0.9 | 1.0 | 0.28 | 1.0 | 0.9 | 1.1 | 0.81 | 1.0 | 0.9 | 1.0 | 0.33 |
| 40–49 | 1.2 | 1.1 | 1.3 | * | 1.3 | 1.2 | 1.4 | * | 1.0 | 1.0 | 1.1 | 0.39 | 1.0 | 1.0 | 1.1 | 0.39 |
| 50–59 | 1.2 | 1.1 | 1.4 | * | 1.6 | 1.4 | 1.7 | * | 1.2 | 1.1 | 1.3 | * | 1.1 | 1.0 | 1.2 | * |
| ≥60 | 1.3 | 1.0 | 1.6 | 0.02 | 1.5 | 1.3 | 1.9 | * | 1.2 | 1.0 | 1.5 | 0.02 | 1.2 | 1.0 | 1.4 | 0.02 |
| Race | ||||||||||||||||
| White | (ref) | |||||||||||||||
| Black | 1.6 | 1.5 | 1.8 | * | 1.7 | 1.5 | 1.8 | * | 1.1 | 1.0 | 1.2 | * | 1.0 | 0.9 | 1.1 | 0.77 |
| Hispanic | 1.3 | 1.2 | 1.5 | * | 1.1 | 1.0 | 1.2 | 0.14 | 1.3 | 1.2 | 1.4 | * | 0.9 | 0.8 | 1.0 | 0.01 |
| Other | 1.1 | 0.9 | 1.3 | 0.44 | 1.0 | 0.9 | 1.2 | 0.90 | 1.1 | 1.1 | 1.2 | * | 0.8 | 0.7 | 0.9 | * |
| Missing | 1.3 | 1.2 | 1.4 | * | 1.4 | 1.3 | 1.5 | * | 0.9 | 0.8 | 1.0 | 0.14 | 1.1 | 1.0 | 1.1 | 0.07 |
| Smoking | ||||||||||||||||
| Nonsmoker | (ref) | |||||||||||||||
| Former smoker | 1.0 | 0.9 | 1.0 | 0.26 | 1.3 | 1.2 | 1.4 | * | 1.9 | 1.8 | 2.1 | * | 1.1 | 1.0 | 1.1 | * |
| Current smoker | 0.8 | 0.7 | 0.9 | * | 1.7 | 1.5 | 1.8 | * | 1.2 | 1.2 | 1.3 | * | 1.1 | 1.0 | 1.2 | * |
| Missing | 1.0 | 0.9 | 1.1 | 0.49 | 1.4 | 1.3 | 1.6 | * | 1.3 | 1.2 | 1.4 | * | 1.1 | 1.0 | 1.2 | 0.07 |
| Body mass index | ||||||||||||||||
| Underweight/Normal | (ref) | |||||||||||||||
| Overweight | 1.2 | 1.1 | 1.3 | * | 1.2 | 1.1 | 1.3 | * | 1.3 | 1.1 | 1.5 | * | 1.2 | 1.1 | 1.3 | * |
| Obese | 1.8 | 1.7 | 2.0 | * | 1.8 | 1.7 | 2.0 | * | 2.1 | 2.0 | 2.2 | * | 1.6 | 1.5 | 1.7 | * |
| Missing | 1.5 | 1.2 | 1.8 | * | 1.9 | 1.6 | 2.3 | * | 1.2 | 1.2 | 1.3 | * | 1.3 | 1.1 | 1.5 | * |
| Hypertension | Coronary Artery Disease, Angina Pectoris, or Myocardial Infarction | |||||||
|---|---|---|---|---|---|---|---|---|
| OR | LCL | UCL | P-value | OR | LCL | UCL | P-value | |
| Sex | ||||||||
| Male | (ref) | |||||||
| Female | 0.4 | 0.4 | 0.5 | * | 0.6 | 0.5 | 0.8 | * |
| Missing | 2.1 | 1.7 | 2.6 | * | 3.3 | 2.3 | 4.7 | * |
| Age (years) | ||||||||
| <30 | (ref) | |||||||
| 30–39 | 1.0 | 1.0 | 1.1 | 0.65 | 1.0 | 0.8 | 1.2 | 0.99 |
| 40–49 | 1.3 | 1.2 | 1.4 | * | 1.9 | 1.6 | 2.3 | * |
| 50–59 | 1.5 | 1.4 | 1.6 | * | 2.5 | 2.0 | 3.0 | * |
| ≥60 | 1.8 | 1.6 | 2.1 | * | 3.3 | 2.4 | 4.5 | * |
| Race | ||||||||
| White | (ref) | |||||||
| Black | 1.9 | 1.7 | 2.0 | * | 2.2 | 1.9 | 2.6 | * |
| Hispanic | 1.1 | 1.0 | 1.2 | 0.02 | 1.1 | 0.9 | 1.3 | 0.49 |
| Other | * | |||||||
| Missing | 1.6 | 1.5 | 1.7 | * | 1.7 | 1.5 | 2.0 | * |
| Smoking | ||||||||
| Nonsmoker | (ref) | |||||||
| Former smoker | 1.1 | 1.1 | 1.2 | * | 1.3 | 1.1 | 1.4 | * |
| Current smoker | 1.0 | 1.0 | 1.1 | 0.33 | 1.4 | 1.2 | 1.6 | * |
| Missing | 1.1 | 1.0 | 1.1 | 0.08 | 1.1 | 0.9 | 1.3 | 0.30 |
| Body mass index | ||||||||
| Underweight/Normal | (ref) | |||||||
| Overweight | 1.9 | 1.8 | 2.0 | * | 1.5 | 1.3 | 1.8 | * |
| Obese | 3.8 | 3.6 | 4.1 | * | 2.5 | 2.1 | 3.0 | * |
| Missing | 3.4 | 2.9 | 3.9 | * | 2.0 | 1.4 | 3.0 | * |
NOTE: LCL = lower confidence level; OR = odds ratio; ref = reference group; UCL = upper confidence level.
* Denotes p-value <0.01.
ANALYSES OF EXPOSURES AND HEALTH OUTCOMES
Methods
For the committee’s multivariate analysis of airborne hazard exposure potentials and selected respiratory and cardiovascular health outcomes, the committee limited the population to post-9/11 respondents and considered several metrics of exposure. First, the committee examined exposure to burn pits using three measures that combine duration and presumed intensity of exposure, as first described in Chapter 5: (1) cumulative days deployed near a burn pit, derived by summing the number of days of each deployment for which a respondent indicated that he or she was near a burn pit (based on Question 1.2.D); (2) cumulative days of burn pit duty (based on Question 1.2.F); and (3) cumulative hours of exposure to smoke from burn pits, created by multiplying the average number of hours each day that smoke or fumes from burn pits entered the worksite or housing by the number of days of deployment (based on Question 1.2.G). Those measures are presented as quartiles with the first (lowest exposure) quartile serving as the reference group. Other exposures contribute pollutants that may lead to respiratory distress, and therefore dust, diesel/exhaust/fuel, combat, and construction exposure potential scores were considered in the analysis and are presented as categories ranging from 0 to 6, where 0 is the lowest level of exposure potential and also serves as the reference group for comparisons. The soot exposure measure was not included because the question was asked only of respondents who served in the 1990–1991 Gulf War. Finally, the committee used a composite exposure potential measure, which was calculated based on the levels of exposure to the six individual exposure categories (burn pits, dust, diesel, combat, construction, soot; described in Chapter 5) to examine the association between the totality of airborne exposures of concern and each health outcome. Those results are presented as quartiles, with the first quartile serving as the reference.
Outcome measures were limited to selected respiratory and cardiovascular diseases. Respiratory outcomes included asthma; emphysema, chronic bronchitis, or COPD as a composite variable; any functional limitation due to a lung or breathing problem; and respiratory symptoms as a composite variable. Cardiovascular disease included hypertension and cardiovascular disease (CAD, MI, or angina pectoris) as a composite variable. The models excluded respondents diagnosed with a respiratory or cardiovascular disease before deployment. Respondents with missing exposure or disease were excluded from the analysis. Sample sizes differed across models and ranged from 32,178 for construction exposure and emphysema, chronic bronchitis, or COPD to 39,271 for each of the three burn pit metrics (cumulative days near a burn pit, cumulative days of burn pit duties, and cumulative hours of exposure to smoke from burn pits) and any respiratory symptoms.
All of the models adjusted for the following covariates: sex; age at questionnaire completion in approximate quartiles (19–30, 31–37, 38–44, or ≥45 years); education level (less than college or “some college or more”); race/ethnicity (white or “other”); BMI (underweight/normal [<25 kg/m2], overweight [25–30 kg/m2], or obese [>30 kg/m2]); smoking status (current smoker, former smoker, or never smoker); unit component (active duty, National Guard, or reserve); rank (enlisted, warrant officer, or commissioned officer); service branch (Army, Navy, Marine Corps, Air Force, or Coast Guard); and primary duty occupational specialty (10 broad groups based on the Millennium Cohort Study1). For covariates with less than 5% missing data, the missing data were imputed with the modal category. For covariates with greater than 5% missing data, a separate category for missing was entered into the regression.
Results
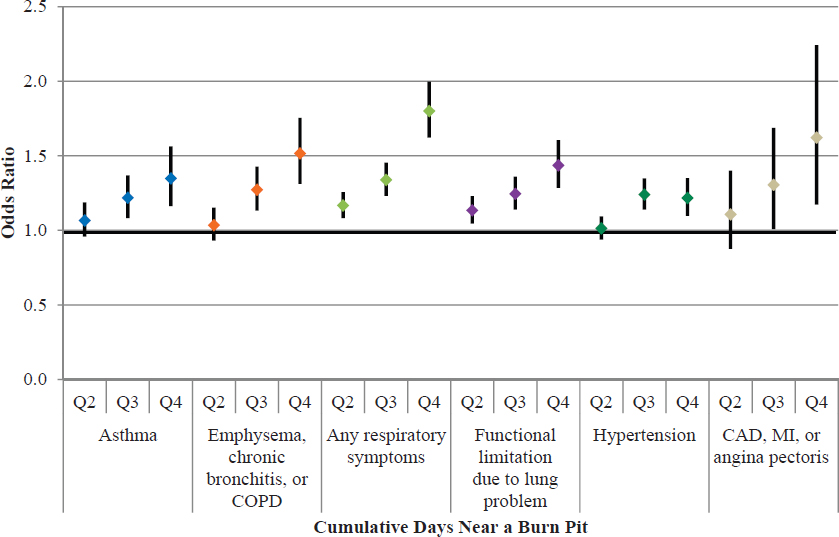
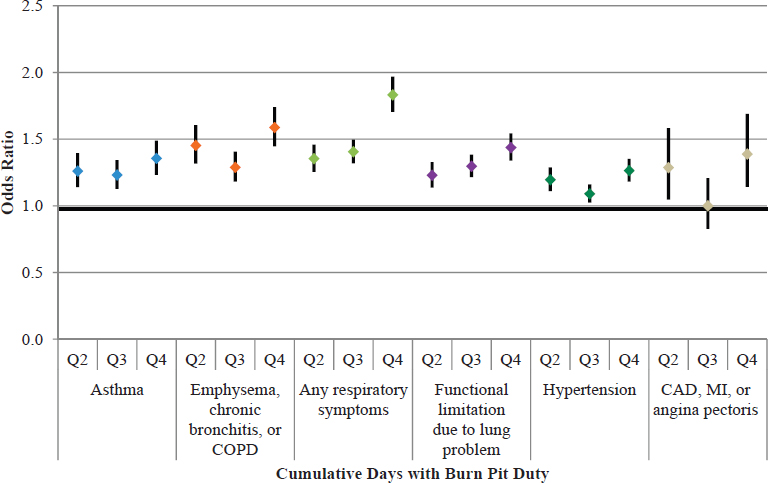
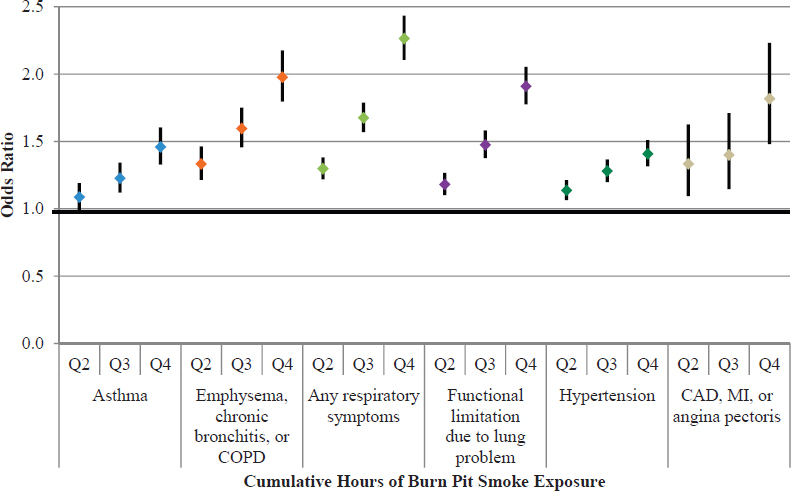
Analyses involving the three specific burn pit exposure variables (amount of time near burn pits; amount of time deployed with burn pit duties; and number of hours exposed to burn pit smoke) yielded associations that were consistent with those found by using the burn pit exposure potential variable constructed by the committee. The results of the associations with health outcomes using the three derived burn pit exposure variables are shown in
___________________
1 Personal communication from Joseph Gasper, senior study director at Westat. Emailed responses to a request from the Committee on the Assessment of the Department of Veterans Affairs Airborne Hazards and Open Burn Pit Registry by Cynthia LeardMann, senior epidemiologist at the Deployment Health Research Department, Naval Health Research Center. San Diego, California, September 2, 2015.
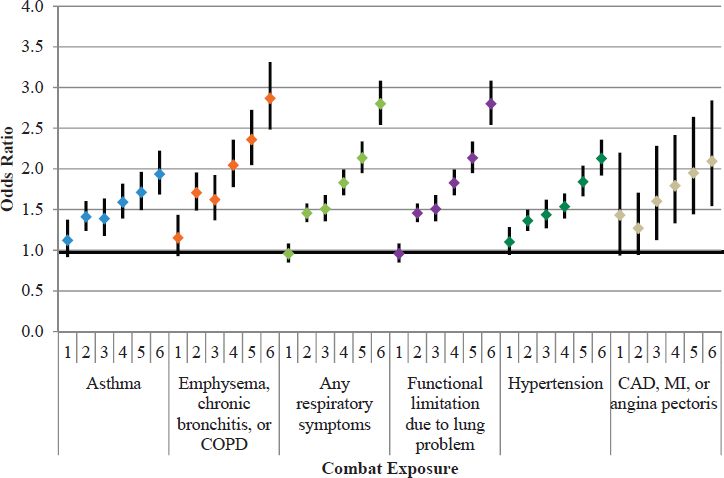
Figures 6-1a–c. Tables of multivariable model result estimates from which the figures were derived are shown in Appendix E. Quartile 1 (the lowest exposure potential) is used as the referent group. All three burn pit exposure variables are associated in a dose–response relationship with all health outcomes of interest (p <0.01; test for p trend data not shown). The magnitude of association is substantial, there are generally monotonic gradients across the quartiles of exposure, and given the sample size, almost all associations are statistically significant. Those registry participants who reported being more proximal to burn pits, having more hours of smoke exposure, or having burn pit duties, in general, reported a greater prevalence of respiratory and cardiovascular disease.
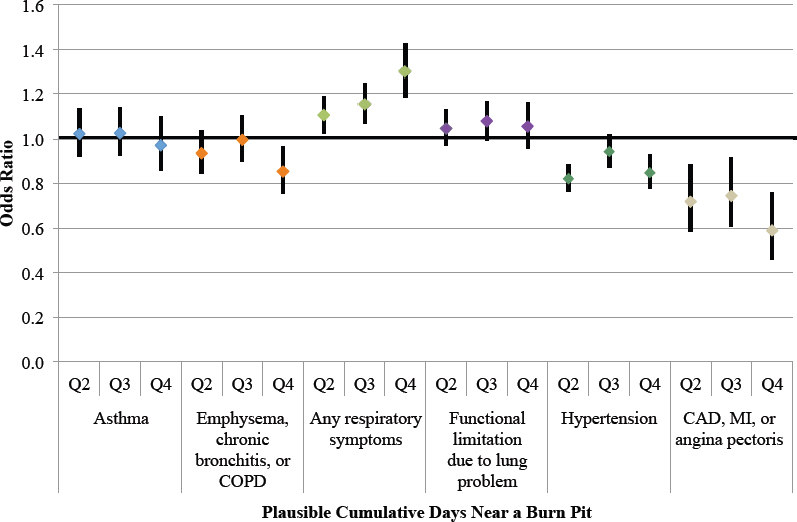
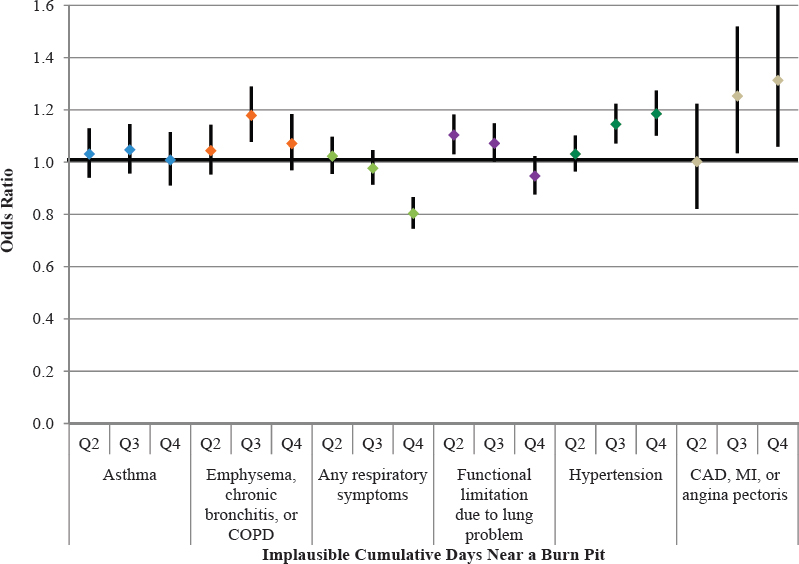
To gain further insight into the quality of the data, the three burn pit exposure variables were each partitioned based on the country of deployment (information on the location of deployment, including base names, was not provided to the committee). Separate burn pit exposure measures were created for exposure that was reported in Iraq or Afghanistan, where burn pits were most likely to be located, considered “plausible exposure,” and exposure that was reported in other countries, such as Kuwait, where burn pits were least likely to be located, considered “implausible exposure.” The results are shown in Figures 6-2a–e. Respondents were divided into quartiles, with the first quartile serving as the reference group (see Chapter 5, Table 5-4, for quartile cut points).
Using the measure of days deployed near a burn pit, all quartiles of plausible exposure were statistically significant for any respiratory symptoms only. Tests for p trend showed statistical significance (p <0.01) for any respiratory symptoms, hypertension, and CAD/MI/angina pectoris. For the measure of implausible exposure of near a burn pit, not all of the quartiles of exposure were statistically significantly associated with any one health outcome; however, the test for trend was statistically significant (p <0.01) for emphysema, chronic bronchitis, or COPD; any respiratory symptoms; and both categories of cardiovascular outcomes.
NOTE: CAD = coronary artery disease; COPD = chronic obstructive pulmonary disease; MI = myocardial infarction.
NOTE: CAD = coronary artery disease; COPD = chronic obstructive pulmonary disease; MI = myocardial infarction.
NOTE: CAD = coronary artery disease; COPD = chronic obstructive pulmonary disease; MI = myocardial infarction.
NOTE: CAD = coronary artery disease; COPD = chronic obstructive pulmonary disease; MI = myocardial infarction.
NOTE: CAD = coronary artery disease; COPD = chronic obstructive pulmonary disease; MI = myocardial infarction.
NOTE: CAD = coronary artery disease; COPD = chronic obstructive pulmonary disease; MI = myocardial infarction.
NOTE: CAD = coronary artery disease; COPD = chronic obstructive pulmonary disease; MI = myocardial infarction.
NOTE: CAD = coronary artery disease; COPD = chronic obstructive pulmonary disease; MI = myocardial infarction.
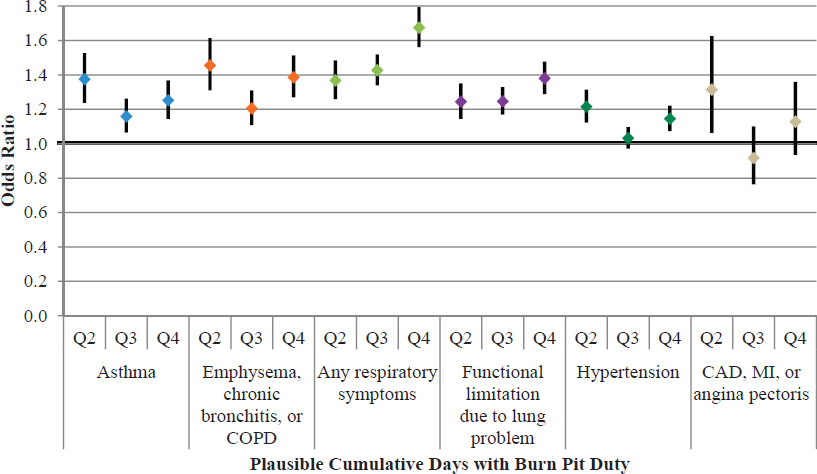
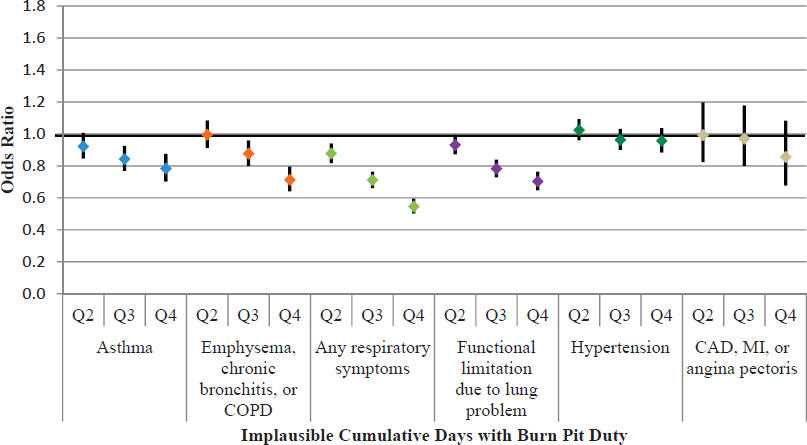
For burn pit duties, all plausible exposure quartiles were associated with all four respiratory outcomes, and the tests for trend were all statistically significant. Associations with the cardiovascular outcome categories were not as consistent, although the test for trend for hypertension was statistically significant (p <0.01). Implausible exposures followed the same general pattern as the plausible exposure, and were associated with all the respiratory outcomes (especially quartiles 3 and 4), but no quartile of exposure was associated with either of the cardiovascular condition categories. Tests for p-trend for implausible exposure of burn pit duties were statistically significant for all respiratory categories, but not for either cardiovascular category.
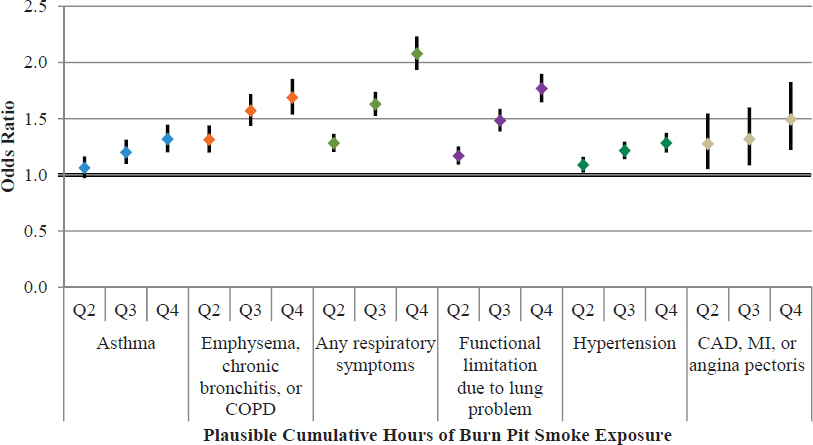
The measure of smoke hours is only presented for plausible exposures because it indicates self-report burn pit exposure that occurred outside of Iraq and Afghanistan, and 90% of respondents had reported 0 hours for that variable. In effect, applying the definitions to create the quartiles would make the first three quartiles zero. Plausible smoke hours showed showed positive, strong associations with all the respiratory and cardiovascular conditions categories, and the tests for trend were all also statistically significant.
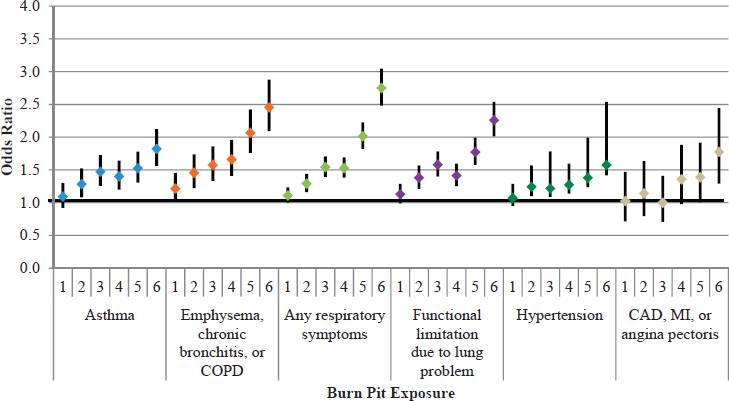
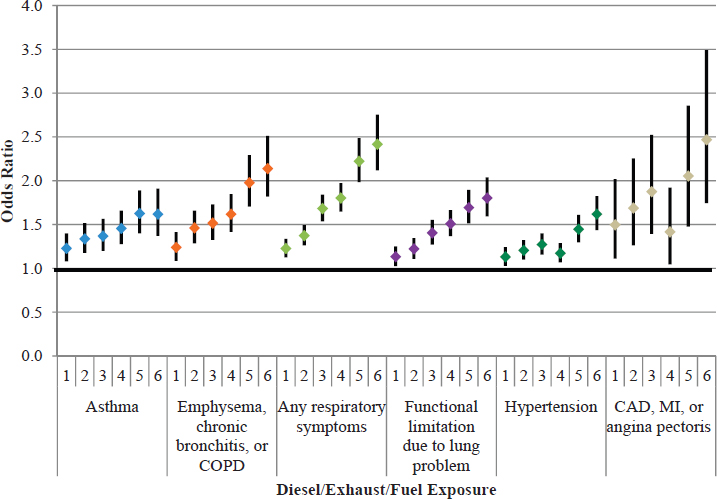
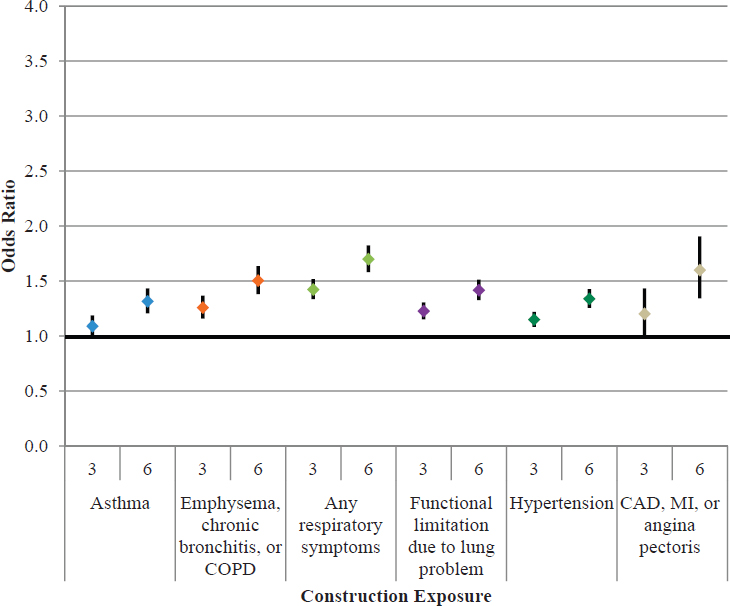
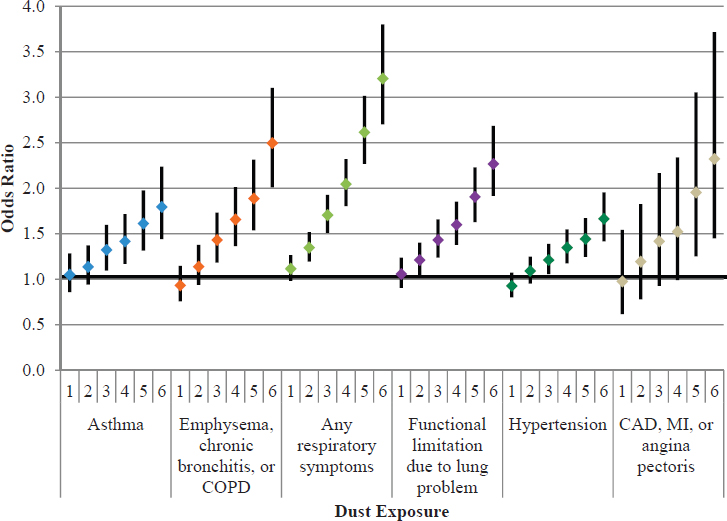
Associations between the five exposure category variables (burn pits, diesel/exhaust/fuel, construction, dust, and combat) and respiratory and cardiovascular health outcomes were examined and adjusted for potential confounding as described above. Figures 6-3a–e show the results of the regression models using the exposure potential scores, with the lowest level (0) as the reference group. Higher levels of each of the exposure category variables were strongly and uniformly associated with an increased prevalence of each of the health outcomes. The magnitude of the association was substantial, with point estimates often above 2.0 in the highest category, and they generally followed a monotonic dose–response gradient of stronger associations with increasing exposure score. The pattern of exposures is similar to those found for the three burn pit metrics in Figures 6-1a–c. The consistency across diverse and such fundamentally different exposures and across distinctly different health outcomes is notable and will be discussed in more detail under Interpretation of Registry Data. The tables show a clear trend that those who reported greater exposure also reported greater prevalence of self-reported respiratory and cardiovascular disease.
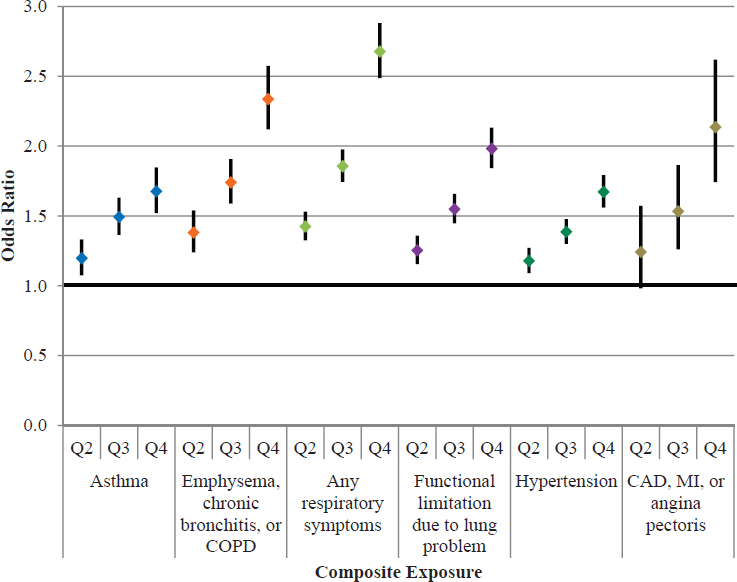
Figure 6-4 shows the results of the regression models that used the composite exposure potential measure. Quartile 1 (having the lowest exposure potential) was used as the reference group. Higher levels of the composite exposure were strongly and uniformly associated with increased odds for each of the respiratory and cardiovascular outcome categories. The p-test for trend for all health outcome categories was statistically significant (p <0.01).
NOTE: CAD = coronary artery disease; COPD = chronic obstructive pulmonary disease; MI = myocardial infarction.
NOTE: CAD = coronary artery disease; COPD = chronic obstructive pulmonary disease; MI = myocardial infarction.
NOTE: CAD = coronary artery disease; COPD = chronic obstructive pulmonary disease; MI = myocardial infarction.
NOTE: CAD = coronary artery disease; COPD = chronic obstructive pulmonary disease; MI = myocardial infarction.
NOTE: CAD = coronary artery disease; COPD = chronic obstructive pulmonary disease; MI = myocardial infarction.
NOTE: CAD = coronary artery disease; COPD = chronic obstructive pulmonary disease; MI = myocardial infarction.
Unexpected Patterns of Association
The committee used an approach motivated by Hill’s criteria for causation (Hill, 1965) to analyze the potential for a relationship of exposure to airborne hazards and open burn pits emissions with health outcomes. In addition to the strength of association, consistency, specificity, temporality, and biologic gradient, the committee felt that it was important to explore the plausibility of the findings of its analysis of registry data. In so doing, it uncovered some unexpected findings that are not consistent with the currently understood scientific mechanisms of exposure and outcome.
The committee’s approach was an analysis of associations between exposures and health conditions collected by the registry questionnaire that, based on current scientific knowledge, do not have a recognized or known linkage or plausible biologic mechanism by which the exposure could influence the health condition. The goal of this analysis was to inform the committee’s assessment of the potential for reporting bias by using data (albeit, of admittedly poor quality) on less likely or unexpected associations.
The committee originally planned to examine such outcomes as varicose veins, hernia, and knee problems collected in Question 2.1.F, but VA did not provide those data for analysis. Instead, the committee used nonmilitary exposure to asbestos (5.5.A) as an exposure considered unlikely to be related to neurological conditions (2.2.3.B), immune problems (2.2.3.C), and liver conditions (2.2.3.D) to examine those associations. All models were adjusted for sex, age at questionnaire completion, education level, race/ethnicity, BMI, smoking status, unit component, rank, service branch, primary duty occupational specialty, and total deployment time. While it is remotely possible for there to be some unknown connection between the exposure and the health conditions, such a connection is far less plausible than for respiratory and cardiovascular conditions (for which literatures exist). To prevent confounding, respondents who self-reported respiratory and cardiovascular conditions were excluded.
For this analysis, the asbestos exposure variable was categorized in five groups: no exposure and four quartiles of self-reported exposure duration (from lowest to highest). Those with no exposure were used as the reference group. The “no exposure” category consisted of those who answered “no” to Question 5.5.A; the quartile categories were created from those who provided a response to the number of years of asbestos exposure in 5.5.C. Table 6-9 shows that higher exposures to asbestos were statistically significantly associated with increased odds of each of the examined health outcomes, and the tests for trend were also all statistically significant (p-trend <0.01).
Thus, although there is little known scientific evidence that asbestos exposure is associated with a higher prevalence of neurologic, immune, or liver conditions, the analyses found a statistically significant association between higher levels of exposure and a higher prevalence of each of these health conditions. The relationship was relatively monotonic. These findings suggest that the statistical relationships between self-reported exposure to airborne hazards and the prevalence of self-reported health outcomes in the registry responses are biased toward
TABLE 6-9 Associations Between Asbestos and Selected Health Outcomes
| Neurological Conditions N = 36,399 | Immune Problems N = 30,759 | Liver Conditions N = 36,883 | |||||||||||
|---|---|---|---|---|---|---|---|---|---|---|---|---|---|
| Asbestos (5.5.A and 5.5.C) | Years [Median (min, max)] | OR | LCL | UCL | P | OR | LCL | UCL | P | OR | LCL | UCL | P |
| Q1 | 1 (1,2) | 1.27 | 1.15 | 1.40 | * | 1.31 | 1.18 | 1.45 | * | 1.25 | 1.07 | 1.47 | * |
| Q2 | 3 (3,4) | 1.42 | 1.27 | 1.58 | * | 1.24 | 1.10 | 1.39 | * | 1.04 | 0.86 | 1.25 | 0.71 |
| Q3 | 6 (5,8) | 1.20 | 1.07 | 1.34 | * | 1.27 | 1.13 | 1.44 | * | 1.13 | 0.93 | 1.37 | 0.22 |
| Q4 | 14 (9,41) | 1.53 | 1.36 | 1.71 | * | 1.42 | 1.26 | 1.59 | * | 1.30 | 1.10 | 1.55 | * |
| P-trend* | P-trend* | P-trend* | |||||||||||
NOTE: LCL = lower confidence level; OR = odds ratio; UCL = upper confidence level.
* Denotes p-value <0.01.
a positive association, although the committee does not have direct information on what may be driving that pattern. The associations might arise because of selection bias and self-reporting or because of circumstances that are unique to the exposures and conditions experienced by the questionnaire respondents. The source of or reasons for any associations, however, cannot be determined from the available data.
OVERALL INTERPRETATION OF REGISTRY DATA ANALYSIS
Registry respondents represent a very small (less than 2%) and self-selected portion of the U.S. service members who deployed to Iraq, Afghanistan, or other countries in Southwest Asia. Those individuals who enrolled in the registry tended to report a range of exposures and respiratory and cardiovascular health problems, and participants who reported higher levels of exposure tended to also report a higher prevalence of adverse health outcomes. The respiratory and cardiovascular conditions reported by registry participants are relatively common in the U.S. population and are not unexpected, based on the respondents’ age range and other demographic factors. Empirically, among registry respondents, the overall and stratified prevalence of self-reported respiratory and cardiovascular conditions differed by health outcome, but all were statistically significantly associated with exposure to burn pits and other potentially harmful deployment exposures. The analysis indicated that each exposure category had strong and consistent associations with the self-reported health outcomes of interest: asthma; emphysema, chronic bronchitis, or COPD; any respiratory symptoms; functional limitations due to lung or breathing problems; cardiovascular disease; and hypertension. These associations were observed for several indicators of burn pit exposure as well as for a range of other deployment exposures, such as exposures to diesel/exhaust/fuel, construction, dust, and combat. All of these exposures could potentially affect any of the health outcomes considered.
The combined overall prevalence among registry respondents was lowest for CAD at 3.6% and greatest for hypertension at 35.8%. Asthma, allergies, emphysema, chronic bronchitis, COPD, and hypertension are all relatively common chronic diseases, even among young and middle age adults (CDC, 2014b; Mozaffarian et al., 2015; Yoon et al., 2015). Because many of these conditions do not result in hospitalizations, it is difficult to produce accurate prevalence estimates.
The registry respondents represent a unique population with a high proportion of self-reported exposure to burn pits or the smoke from burn pits; 96% of respondents reported being near a burn pit on at least one deployment. Within this unique population, the prevalence of self-reported health outcomes appears to increase, with few exceptions, as the intensity of the self-reported exposure to burn pits or the smoke from burn pits increases, even after adjusting for multiple possible confounders. The same trend is found for the other deployment-related exposures (dust, construction, diesel/exhaust/fuel, and combat). Similar strong and consistent associations were seen for several outcomes (neurologic, immune, and liver conditions) that the committee did not consider likely to be affected by exposures to asbestos. The magnitude of association is substantial, with adjusted odds ratios of 2.0 and higher in the uppermost exposure categories for nearly all of the associations examined. Generally monotonic dose–response gradients are seen, with more exposure associated with a higher prevalence of disease in registry respondents. However, it seems unlikely that these statistical trends reflect a biological link between exposure and a health outcome, given that associations that do not seem biologically plausible show patterns of association that are similar to those seen for exposures and conditions that could be directly related.
Given these strong and consistent findings for both biologically plausible and also biologically less plausible associations, and despite substantial and highly statistically significant indications of association, these associations may reflect possible positive bias in the dataset or indicate a need for appropriately designed studies to follow up on the many potential health effects reported for more exposed individuals. The current registry data have limitations for use in quantifying the effects of any or all deployment exposures on the subsequent risk or prevalence of disease within the registry population, let alone suggesting that the associations are generalizable to the broader deployed veteran population. However, these statistical associations do warrant closer scrutiny and evaluation so as to allow for a better understanding of what is generating the findings and trend patterns.
First, as previously discussed in Chapter 2, there are substantial limitations to using registry data to draw conclusions about the strength and plausibility of associations. The questions that elicited the self-reported exposures are nonspecific, were often poorly worded, and can only be used to make the most general of associations.
The questions and the data that result from them cannot be used to quantify the duration or intensity of those exposures, which would be more useful and accurate information for determining the strengths of association with the health outcomes of interest.
Second, because participation in the AH&OBP Registry is voluntary, responses from self-selected participants that enrolled in the registry may result in an inaccurate measure of the true association between exposure and health outcomes. The very small proportion of individuals who successfully enrolled in the registry may have selectively included those who were more likely to have a disease and perhaps were more likely to have been heavily exposed as well, resulting in higher exposure potential. Very few respondents reported no exposures, but approximately one-third did not report having been diagnosed with a respiratory or cardiovascular condition (see Table 6-4). However, to generate the observed patterns, there would need to be selective participation among those with both exposure and disease (jointly) or absence of (or less) exposure and absence of disease (jointly). While that is possible, given the very limited enrollment, the observations are not readily explained. An alternative explanation is that among participants, those who reported more exposure were also more likely to report disease; even modest correlations of this sort can generate substantial associations (Brenner et al., 1993). Without knowing the true exposure or disease status of respondents or the eligible population, it is difficult to evaluate the plausibility of reporting error and its effect on the observed associations.
Third, limitations in the registry data constrain the analyses to suggest, at most, where epidemiologic studies are needed to quantify, confirm, or refute the associations between exposures and health outcomes. It is clear from the registry responses and comments from veterans service organizations that some service members and veterans with burn pit and other airborne exposures from deployment to Southwest Asia are experiencing serious health effects. Nonetheless, a valid assessment of the relationship between measured exposures and health outcomes can only be accomplished through well-designed epidemiologic studies, such as that recommended in Long-Term Health Consequences of Exposure to Burn Pits in Iraq and Afghanistan (IOM, 2011).
SYNOPSIS AND CONCLUSIONS
Based on the information presented in this chapter, the committee has reached the following findings, conclusions, and recommendations regarding the analysis and interpretation of AH&OBP Registry data. These observations address four major areas included in the committee’s charge.
(1) What is the best approach to analyzing the registry data in order to gain insights into the potential effects of burn pit and airborne exposures on health outcomes?
As delineated in Chapter 5, the available exposure data are of poor quality, but it is possible to construct a set of indicators of exposure potential from them that while being of uncertain validity, are worthy of examination. The committee believes it is possible to perform some informative analyses of registry health information by using these indicators along with data on a circumscribed set of health outcomes, delineated below. So long as the results are not overinterpreted with respect to the association of exposures with health outcomes, there is value in conducting such analyses. The most useful approach to carrying them out is to generate variables using multiple indicators of exposures and multiple grouped indicators of health outcomes. Descriptive information on registry participants also has value in documenting the experience of those who chose to complete the questionnaire.
The population of registry respondents is sufficiently large to permit analyses of exposure and disease with adjustment for some potential confounders. Such analyses are subject to severe limitations, though, and must be presented with strong caveats regarding their implications. Given all the uncertainties, it is prudent to take multiple approaches to analyzing the data in order to assess the robustness of results. Undertaking additional methodologic work to better understand the sources of bias that resulted in the committee’s counterintuitive finding that all exposures were statistically associated with all outcomes would, additionally, be productive.
(2) Which health outcomes in the registry are most amenable to analysis?
The committee believes that the limitations of the AH&OBP Registry questionnaire and the data collected by it are too great to allow any firm conclusions to be drawn from its analysis. Within that constraint, it believes that
the health outcomes data related to the symptoms, conditions, and diseases associated with the respiratory and the cardiovascular systems are the best candidates for analysis because these constitute the most plausible and well-documented potential health effects of the exposures of concern. Cancer outcomes data from the questionnaire are unlikely to be informative because the questions are too general, insufficient time has elapsed since the exposures for effects to manifest, and the population is too young for most cancers to have developed.
Many respondents reported respiratory and cardiovascular conditions, as would be expected given that those with health problems are likely to be motivated to participate in the registry. Well-established predictors of these conditions, such as age and smoking, followed the expected patterns, offering some evidence for the accuracy of the self-reported data. Less than 10% of respondents indicated a pre-deployment diagnosis of a respiratory or cardiovascular condition. Excluding persons who reported being diagnosed with a condition before deployment had little effect on the prevalence rates of the health conditions examined.
Over half of the all respondents (55.5%) reported having either a respiratory or cardiovascular diagnosis, 15.3% of all respondents reported at least one respiratory and cardiovascular diagnosis, 14.8% reported only a respiratory diagnosis, and 25.4% reported only a cardiovascular diagnosis. Generally speaking, the observed higher prevalence of asthma, allergies, and hypertension and the lower prevalence of emphysema, COPD, angina pectoris, CAD, and MI appear consistent with what would be expected in a population that is predominantly male, aged 25–60 (average age 38.7 years), and for whom about one-third report a current or former history of smoking.
While it would not be informative to compare the absolute rates of disease among registry participants—a small and highly self-selected population—to other more general populations, the health data may be of sufficient quality to justify internal comparisons in which subsets of registry participants with varying levels of potential exposure are compared with one another. Analyses of organ systems other than respiratory and cardiovascular would be less valuable as the questions were worded too broadly to allow interpretation of any results using those variables.
Analyses of plausible and implausible exposure to burn pits based on the country of deployment were conducted using three burn pit exposure metrics. For cumulative days deployed near a burn pit, many of the point estimates for quartiles of plausible exposure were lower than the point estimates for the same disease category for implausible exposure. All quartiles of plausible exposure of cumulative days near a burn pit were statistically significantly associated with any respiratory symptoms only. For the measure of implausible exposure of near a burn pit, not all of the quartiles of exposure were statistically significantly associated with any one health outcome. For cumulative days of burn pit duties, all plausible exposure quartiles were associated with all four respiratory outcomes, but only select quartiles showed statistically significant associations with the cardiovascular outcome categories. Implausible exposures showed a general decreasing trend with increasing exposure potential for all categories of conditions. Point estimates of health outcome categories for plausible exposure by quartile were higher than nearly all corresponding estimates for implausible exposure. The measure of smoke hours could only be analyzed for plausible exposures and showed positive, strong associations with all the respiratory and cardiovascular conditons categories. These results are supportive evidence for the accuracy of self-reported exposure to burn pits.
While the committee recognizes serious limitations in the quality of exposure and disease information and in the self-selected nature of registry participants, examinations of the relationship between exposure and health outcomes among participants may provide a foundation for hypothesis generation for more rigorous research investigations.
(3) What can be learned about airborne hazards and open burn pits exposures and health outcomes through the analysis of registry data?
An examination of multiple indices of exposure to burn pit emissions and other hazards associated with deployment showed that these indices had strong and consistent relationships with essentially all the health outcomes considered. That is, registry participants who reported more exposures of all types also tended to report more health problems of all types. Exposure potential variables used in the multivariable analysis (burn pits, dust, construction, diesel/exhaust/fuel, combat) were strongly and uniformly associated with increased odds of each of the respiratory and cardiovascular health outcomes. The magnitude of the statistical associations was substantial, there were generally monotonic gradients across quartiles of exposure, and all associations were statistically
significant. Registry participants who report being closer to burn pits, having more hours of smoke exposure, and having burn pit duties also report a greater prevalence of respiratory and cardiovascular disease.
The committee’s exposure potential variables had strong and consistent associations with self-reported asthma; emphysema, chronic bronchitis, or COPD; any respiratory symptom; functional limitations due to a lung or breathing problem; cardiovascular disease; and hypertension. This was observed for the three indicators of burn pit exposure and for the composite exposure potential measure as well. However, diseases and conditions that are not known to be related to these exposures, such as sleep apnea, showed similar positive associations. In addition, analyses found that several other exposures and diseases that were not plausibly related to one another were also statistically associated, such as asbestos exposure and neurologic conditions or immune problems.
Such outcomes strongly suggest that the results of analyses of registry data cannot be taken at face value and that the identified associations may be an artifact of the population’s selection and the limitations of the self-reported exposure and disease data. The registry analyses are not generalizable and can only describe what exposures and conditions the population of registry respondents are reporting. Registry data cannot be used to determine cause or estimate prevalence in the total eligible population of service members or veterans.
Given the implausible consistency of the findings of statistical associations between exposures and outcomes—including the example of asbestos and neurologic conditions that are not well supported by the scientific literature—the committee concludes that the associations are likely to reflect biases arising from selective participation in the registry, problems with self-reported exposure and disease data, or other factors unrelated to exposure–disease associations. The registry data by themselves have, at best, limited utility in exposure and health studies but may be more useful when combined with other sources of information, including deployment data and VA and DoD medical records.
The committee wishes to emphasize that it would have reached the same determination regarding the weaknesses of the registry data had the analyses found no associations or weak associations between the exposures and health outcomes. The strong conclusion that can be drawn from the results of the committee’s analyses is that a more rigorous and appropriate study design is needed to examine the relationship between the exposures encountered during deployment to the Southwest Asia theater of operations and health outcomes.
While the registry provides a forum for collecting and recording information on those who were deployed and are motivated to participate, it cannot answer such questions. Thus, the committee recommends that other means for evaluating the potential health effects associated with airborne hazards and open burn pit exposures be developed, such as a well-designed epidemiologic study. The 2011 Institute of Medicine report Long-Term Health Consequences of Exposure to Burn Pits in Iraq and Afghanistan contains advice and recommendations on how such a study might be conducted.
Given this and the committee’s other findings regarding the registry, the committee recommends that VA’s messaging be explicit about the limitations on the ability of the registry to generate valid information that can be used to improve VA health and benefits programs or inform the treatment of individuals potentially exposed to burn pits or other airborne hazards in theater in order to ensure that participants and others do not form unrealistic expectations about the value of participation or capabilities of the registry.
(4) How can VA health care data be used constructively in conjunction with registry data to examine exposures and health outcomes?
As reported in Chapter 4, respondents were more likely to use VA health care than the eligible population (69% versus 46%), and these same respondents were also more likely to report disease. Examination of VA user status and self-reported health outcomes among registry participants showed higher prevalences of most health conditions among VA users compared with nonusers (Gasper and Katawa, 2015). Sensitivity was moderate or low for most conditions, suggesting either that persons diagnosed with these conditions are not reporting them on the questionnaire or people who report having the condition do not have it documented in their VA medical records. High specificity (greater than 90%) for most conditions indicates that respondents who do not have the conditions (according to their VA medical records) also do not report having the conditions on the questionnaire.
Although information is only available for a subset of the population that uses VA health care, there is potential value in linking the registry data to health care utilization and conducting analyses for this subset of registry
participants—something that was not possible with the data available to the committee. Self-reported diseases follow expected patterns in relation to known predictors and are corroborated to some extent by VA health care data. The committee therefore concludes that the registry’s self-report disease information has at least modest validity. A periodic reassessment of the comparisons between self-reported information collected by the questionnaire and diagnoses in VA medical records for respondents who use VA health care would provide further evidence concerning the level of validity of self-reported health outcomes in the population of respondents.
REFERENCES
Brenner, H., D. A. Savitz, and O. Gefeller. 1993. The effects of joint misclassification of exposure and disease on epidemiologic measures of association. Journal of Clinical Epidemiology 46(10):1195–1202.
CDC (Centers for Disease Control and Prevention). 2014a. Current cigarette smoking among adults in the United States. https://www.cdc.gov/tobacco/data_statistics/fact_sheets/adult_data/cig_smoking/index.htm#national (accessed October 15, 2016).
CDC. 2014b. National Health Interview Survey summary health statistics. http://ftp.cdc.gov/pub/Health_Statistics/NCHS/NHIS/SHS/2014_SHS_Table_A-2.pdf (accessed September 23, 2016).
Gasper, J. and J. Kawata. 2015. An evaluation of selection bias and data quality: Open Burn Pit and Airborne Hazards Registry. Prepared for the Department of Veterans Affairs Office of Public Health, Post-Deployment Health Group by Westat. September.
Hill, A. B. 1965. The environment and disease: Association or causation? Proceedings of the Royal Society of Medicine 58(5):295–300.
IOM (Institute of Medicine). 2011. Long-term health consequences of exposure to burn pits in Iraq and Afghanistan. Washington, DC: The National Academies Press.
King, M. S., R. Eisenberg, J. H. Newman, J. J. Tolle, F. E. Harrell, H. Nian, M. Ninan, E. S. Lambright, J. R. Sheller, and J. E. Johnson. 2011. Constrictive bronchiolitis in soldiers returning from Iraq and Afghanistan. New England Journal of Medicine 365:222–230.
Liu, J., N. Lezama, J. Gasper, J. Kawata, S. Morley, D. Helmer, and P. Ciminera. 2016. Burn pit emissions exposure and respiratory and cardiovascular conditions among Airborne Hazards and Open Burn Pit Registry participants. Journal of Occupational and Environmental Medicine 58(7):e249–e255.
Mozaffarian, D., E. J. Benjamin, A. S. Go, D. K. Arnett, M. J. Blaha, M. Cushman, S. de Ferranti, J. P. Despres, H. J. Fullerton, V. J. Howard, M. D. Huffman, S. E. Judd, B. M. Kissela, D. T. Lackland, J. H. Lichtman, L. D. Lisabeth, S. Liu, R. H. Mackey, D. B. Matchar, D. K. McGuire, E. R. Mohler, C. S. Moy, P. Muntner, M. E. Mussolino, K. Nasir, R. W. Neumar, G. Nichol, L. Palaniappan, D. K. Pandey, M. J. Reeves, C. J. Rodriguez, P. D. Sorlie, J. Stein, A. Towfighi, T. N. Turan, S. S. Virani, J. Z. Willey, D. Woo, R. W. Yeh, M. B. Turner, and the American Heart Association Statistics Committee and Stroke Statistics Subcommitee. 2015. Heart disease and stroke statistics—2015 update: A report from the American Heart Association. Circulation 131:e29–e322.
Yoon, S. S., C. D. Fayar, and M. D. Carroll. 2015. Hypertension prevalence and control among adults: United States, 2011–2014. National Center for Health Statistics Data Brief No. 220. Hyattsville, MD: National Center for Health Statistics.


