
4
Analysis Methods and Descriptive Statistics
This chapter is the first of three chapters that describe the methods and results of the committee’s analysis of the first 13 months of data from the Airborne Hazards and Open Burn Pit (AH&OBP) Registry. It begins with an overview of the data requested and received. This is followed by a discussion of preliminary analyses undertaken to examine the quality of the data and potential biases by quantifying missing information and characterizing the respondents in terms of participation rates and representativeness to the eligible population. Descriptive statistics including demographic and military characteristics of registry respondents are provided, and comparisons with all eligible veterans and service members are made. Detailed methods, analyses, and interpretation of exposure data collected by the questionnaire are presented in Chapter 5, and Chapter 6 provides the methods, analyses, and interpretation of the health outcomes that the committee believes offer the most value. Where applicable, the committee describes challenges encountered throughout its process and the resulting impacts.
DATA REQUESTED AND RECEIVED
The analysis of the AH&OBP Registry data was conducted with the purpose of describing the exposures and health conditions reported by veterans and service members who chose to participate in the registry; it cannot, by nature (see Chapter 2), support any conclusions about health conditions caused by exposure to burn pits. Given the inherent limitations of registries in providing representative and reliable data, the committee took a cautious approach to its analysis of registry data. This section describes the committee’s general approach to requesting, collecting, and analyzing the data collected by the AH&OBP Registry.
The data request process began in October 2014 and took more than 13 months to complete. The committee, under the National Academies of Sciences, Engineering, and Medicine (the National Academies), and the Department of Veterans Affairs (VA) signed a Data Use Agreement on December 18, 2015, to allow the committee access to de-identified data for analyses to complete their task. Appendix D contains a list of the variables requested from each data source and the status of each (received or not released).
DATA ON AH&OBP REGISTRY PARTICIPANTS
The committee’s dataset included all completed questionnaires (N = 46,404) submitted between June 19, 2014, and July 31, 2015. The committee requested all data contained in the questionnaires. However, no person-
ally identifiable information was included and some variables were modified, as described in the section titled “Unavailable Data.”
The extent of the available data was limited in two important ways. First, although analyses would likely have been more informative if the committee had additional data, it was constrained to using data limited to approximately the first 13 months of registry operation. Second, the dataset only included individuals who completed the full questionnaire (referred to as respondents). “Complete” was defined by VA as those questionnaires for which respondents answered all applicable questions (“don’t know” and “refused” options were provided) and clicked the “submit” button. The choice of using this definition of “completed” rather than allowing for questionnaires that were only partially completed to be used was made by VA (Nicolas Lezama, VA, personal communication, January 26, 2016). After submission, a user’s status changes to “participant” in the database, and the time stamp is recorded in the context of tracking participation. No data on partial completions—that is, data from questionnaires that had been started but the individual never clicked “submit,” regardless of the number of sections or questions completed—were made available. It was not clear to the committee why such a strict criterion was used to define participation in the registry, and it likely resulted in a substantial loss of data (see discussion of participation rates) and possibly a less representative sample consisting only of final registry respondents. Such a rigid definition of completion is inconsistent with best practices in survey and epidemiological research (AAPOR, 2016), which call for participants to be as those who have completed some minimal number of sections or questions that are designated as key to information needs and objectives.
Questionnaire data were provided in four files that could be linked using a unique identification code: a main dataset that contained responses to all of the exposure and health condition questions (SAQMain); a data file that contained information on all deployment segments, both verified and added deployments (SAQ Deployment Segment Data); participation statistics, such as date and time started and completed, and year of birth; and other user data, such as dates that the user account was created, consent given, and eligibility status. All four files were extracted from VA’s database on July 31, 2015.
In all, the committee’s dataset included data from three sources—the registry, the Gulf War Oil Well Fire Smoke Registry, and the Contingency Tracking System (CTS)—which are summarized in Box 4-1. The CTS and Gulf War Oil Well Fire Smoke Registry were current to December 31, 2015. Data from all three sources were able to be linked using a unique, randomly assigned identifier. The Gulf War Oil Well Fire Smoke Registry contains records of all service members who served in Operation Desert Storm and Operation Desert Shield while the oil-well fires were burning (VA, 2015a). The CTS is a subset of the Department of Defense (DoD) Defense Manpower Data Center (DMDC) database of service personnel who were physically located in the Operation Enduring Freedom (OEF) and Operation Iraqi Freedom (OIF) areas of operations or who were specifically identified as directly supporting those missions outside of the designated combat zone, such as aircrew or support personnel located outside the combat zone (Bonds et al., 2010). Because the registry questionnaire does not collect all key demographic variables necessary for the committee’s analysis, demographic information for respondents was drawn from the CTS extract for all OIF/OEF service members and from the Gulf War Oil Well Fire Smoke Registry file for all Gulf War service members.
Characterizing Eligibility
The eligible population was defined as service members and veterans who deployed to contingency operations in the Southwest Asia theater of operations (Iraq, Kuwait, Saudi Arabia, Bahrain, Gulf of Aden, Gulf of Oman, Oman, Qatar, United Arab Emirates, Persian Gulf, Arabian Sea, and Red Sea) at any time on or after August 2, 1990, or in Afghanistan or Djibouti on or after September 11, 2001. A key advantage of the AH&OBP Registry is that eligibility is well-defined by period of deployment and deployment locations and documented by DMDC, which also maintains a broad array of demographic and military characteristics information for all service members.
To examine how well the experience of the registry respondents reflects the experience of the larger eligible deployed population, the committee used the data from the CTS and Gulf War Oil Well Fire Smoke Registry to define and characterize the eligible population. Neither the CTS extract nor the Gulf War Oil Well Fire Smoke Registry data included information on service members deployed to the Gulf region during the stabilization period
between April 1991 and August 2001. Therefore, these respondents were excluded from the analysis if they did not also deploy during the 1990–1991 Gulf War or post-9/11 conflicts. Because less than 1% of respondents were deployed during the stabilization period, the committee did not feel that their exclusion would significantly affect the results of the analysis. For analyses of exposure and disease stratified by era, respondents were counted in each era for which they had a deployment. Similarly, for analyses that were deployment-segment based, respondents were included in multiple country and year categories if they had deployments in more than one category. The resulting eligible population included 545,383 Gulf War and 2,483,392 post-9/11 service members.
The CTS file was used as the “gold standard” for determining the eligibility of post-9/11 service members and veterans because its data were imported into the registry database to determine an individual’s eligibility. However, when the CTS file data were linked to the questionnaire data, 333 respondents either had no deployment records in the CTS or were ineligible according to the CTS and were excluded to reconcile the inconsistency. The number of cases excluded is a small proportion of the respondents. Because the CTS file is supposed to be used to screen for eligibility for the registry, in theory there should be no differences, and the same screening criteria that is used by the registry was applied using the code VA provided. One possible explanation for the discrepancy is that VA allowed some individuals who were determined ineligible to request an eligibility review and complete the questionnaire, but it is unknown how often such waivers are given. Another possibility is that because the CTS is updated monthly, the CTS file that the committee had was more up-to-date than the CTS file that was used to screen for the registry.
Service era is defined on the basis of deployment year only. Therefore, for the stratification analyses by service era, Gulf War era was defined as deployments during 1990–1991, and post-9/11 era was defined as 2001 or later. Because the committee only had data on the deployment year, not the month and day, anyone with a deployment date in 2001 or later was included and considered part of the post-9/11 cohort. Therefore, respondents deployed between January 1, 2001, and September 10, 2001, would have been included with post-9/11 rather than the stabilization period. Table 4-1 shows the number of respondents with deployments in each era based on the questionnaire. Because VA only provided the year of deployment, there may be some inaccuracies in these numbers. Similar discrepancies were observed for the Gulf War Oil Well Fire Smoke Registry file and treated in a similar manner.
TABLE 4-1 Number of Respondents by Era
| Era | Number | Percent |
|---|---|---|
| Not Mutually Exclusive | ||
|
Gulf War (1990–1991) |
5,595 | 12.1 |
|
Stabilization Period (1992–2000) |
1,356 | 2.9 |
|
Post-9/11 (2001 or later) |
42,673 | 92.0 |
| Mutually Exclusive | ||
|
Gulf War only (1990–1991) |
3,498 | 7.5 |
|
Stabilization Period only (1992–2000) |
120 | 0.3 |
|
Post-9/11 only (2001 or later) |
39,804 | 85.8 |
|
Multiple eras |
2,982 | 6.4 |
Unavailable Data
Several of the committee’s data requests were not fulfilled because VA determined that such data could potentially be personally identifiable. Notably, many of these data have been made available to contractors for other analyses. The text below briefly describes the committee’s purpose for requesting those data and the effect that not having those data had on the committee’s ability to conduct its analyses.
Only information on completed questionnaires was made available to the committee. Information about persons who did not complete the questionnaire would have provided valuable information about the differences between those who attempted and those who completed the questionnaire. Differential completion rates by demographic and military characteristics, reported exposures, and reported health outcomes could reveal other challenges and biases.
The dates and locations of deployment were limited to the year(s) and country or countries. Limiting the deployment dates and within-country location information weakened the committee’s efforts to construct reliable measures of exposure potential (see Chapter 5). However, VA provided a variable of deployment length in days for each segment reported in the questionnaire that could then be used to calculate exposure potential and other outcomes of interest.
VA further affected the committee’s ability to estimate exposure by not releasing the names or locations of bases where respondents reported spending the majority of their time on each deployment. All results provided to the committee were required to be aggregated, and having such information as the number of respondents who served at a particular base would in no way provide identifying information. DoD has created and selectively made available a list of bases with burn pits in the gulf region (Joseph Gasper, Westat, personal communication, August 11, 2016). The base names reported in the registry combined with that information would have allowed the committee to create a more reliable measure of burn pit exposure by cross-checking the information reported by respondents. For example, if a respondent reported exposure to burn pits, but also reported spending the majority of his or her time at a base without burn pits, this could be adjusted for in the analysis (as done in a separate analysis for VA (Gasper and Katawa, 2015b).
To conduct more complete analyses of potential exposure and health outcomes would require more detailed information on the dates and specific locations of deployment, patterns of participation by periods of service, and objective measures of exposures. Sub-analyses could be conducted to compare respondents to eligible persons known to have documented burn pit exposure—a more appropriate comparison group than potential exposure based on country and year of deployment. Such an exercise would provide additional insight into how characteristics may differ between registry respondents and the eligible population. To accomplish this would require DoD data that documented burn pit sites overall, the dates of use, and the dates when incinerators were implemented (perhaps more accurately on a subset of bases, such as Joint Base Balad, Camp Taji and Camp Speicher); it would also be necessary to link this information to registry deployment and location data. That analysis would result in a subsample of the total eligible population who were potentially exposed to burn pits, but it would also likely
produce a more accurate representation of the proportions of the eligible population who served at such locations and who chose to participate in the registry as well as differences in their characteristics. If these data are made available for the full eligible population, the volume of information for a systematic analysis of differences between registry respondents and the eligible population or nonrespondents would be far more extensive than that which is often available in research.
The committee also was unable to examine differences based on separation status—active service members compared to veterans—because the CTS extract file provided by VA did not contain a variable for separation code. Without this information, it was not possible to determine whether differences in respondents versus the eligible population (and potential participation biases) were greater among veterans than among those still on active duty.
No data on health care use or conditions as recorded in medical records through VA or DoD’s Military Health System were provided for either registry respondents or the eligible population. The committee sought that data to help answer VA’s request for recommendations regarding the means of addressing the medical needs of veterans with health conditions related to burn pit exposure and “associations of self-reported exposures with Veterans Health Administration (VHA) health care experience.” Specifically, the VHA Assistant Deputy Under Secretary for Health Enrollment Files contain enrollment, eligibility, demographic, cost, and location information for VHA enrollees and non-enrollees who have received VA care. VHA clinical and administrative data systems contain in-person registry evaluations that are identified based on the presence of a clinical note title or health factors, such as International Classification of Diseases codes that may have been useful to the committee in considering data linkages and analyses to enable a response to this request (VA, 2015a).
Mortality data were not available, so service members who died before the registry was implemented could not be removed from the eligible population. Having the number of eligible persons who have died along with their cause of death would have allowed the committee to analyze whether certain primary causes of death were more frequent and are perhaps an area of interest for further study that may or may not have implications on deployments.
ANALYSIS METHODS
Through the National Academies, the committee contracted for all analyses to be performed by Westat, Inc., but the analyses were done under the direction of the committee. Several iterations of analysis were necessary as the committee absorbed the results of an analysis and identified new questions and important areas to examine in the next iteration. Westat was selected to be the committee’s subcontractor for several reasons. Its analysts already had intimate knowledge of the registry, the Gulf War Oil Well Fire Smoke Registry, and the CTS data; Westat had previously been approved as a subcontractor for VA-related studies through other contacts with the National Academies, given their authority to operate in VA spaces and with VA data; and Westat had completed similar analyses and issued reports with similar goals to the committee’s (Gasper and Katawa, 2015b; Liu et al., 2016; VA, 2015a,b).
The comparisons made in this chapter are of two types. The first comparisons are made between respondents and the eligible population minus the respondents (effectively, the nonrespondents). The second type of comparisons presented are between respondents and the eligible population (which includes the respondents). When results are described, it is clearly noted where one method or the other was used.
Most of the results are presented as frequencies and percentages. Any statistical testing conducted to describe differences between groups used t-tests or chi-square statistics. All significance levels (alpha) were set at 0.05. The methods and the results of the univariate and multivariate analyses used to examine self-reported exposures and health conditions are described in detail in Chapters 5 and 6. All analyses were carried out using SAS version 9.4, a software package commonly used for this type of application and well known for high quality.
No corrections were made for multiple comparisons. Testing multiple associations within a single dataset—for example, testing several exposures against multiple health outcomes—increases the probability that at least one comparison will result in a statistically significant association even if the result is not real. The probability of finding statistical associations increases as the number of comparisons goes up and using analytical methods to attempt to account for this creates problems of its own. Thus, instead of attempting to apply a correction method
to its analyses, the committee presents all comparisons and results, and its interpretations are not based on p-values alone, but the overall consistent pattern of results and the plausibility of individual associations.
Assuring Quality Control of Analyses
As the committee’s subcontractor, Westat used a variety of systems and procedures to ensure that the committee’s analyses were performed accurately and that the results were of the highest possible quality. Such processes included a review of the analysis plan, checking raw data files, and a multistep review of results, the details of which were provided by Westat and are described in the following paragraphs (Westat, 2016).
Before it was implemented, the analysis plan drafted by the committee was first reviewed by senior Westat staff, including a biostatistician, an epidemiologist, and a social scientist with expertise in military health research. Based on clarification questions and other expertise offered by Westat staff, the committee then refined various aspects of the analysis plan. In the months following the receipt of the data, a similar process was followed for all subsequent requests for analysis, ensuring that Westat staff understood the committee’s intent and applied the most appropriate statistical methods, especially when there were several possible methods to use, to answer the research questions.
The first step to ensuring the integrity of the data files received from VA—and therefore the accuracy of the committee’s data analysis—was to generate frequencies of each item in the data files provided by VA. Westat inspected all administrative and survey data for range errors, logic errors, and other types of errors. All corrections, updates, or additions to the data were recorded and documented in the SAS analysis programs. Full documentation was maintained on all programs used in the process of building the analysis files. This procedure allowed for a rapid rebuilding of the analysis file when additional variables were needed from the raw data received from VA or when variables were recoded.
To ensure that the results of the analysis were of the highest quality, Westat used a multistep process. For each analysis requested by the committee, Westat staff translated the request into detailed specifications for the senior programmer. Specifications included instructions for constructing new variables, dividing the data to specific subgroups (such as deployment by era), and the statistical procedures to be used for running multivariate analyses and performing statistical tests. The specifications were reviewed by an epidemiologist or biostatistician prior to sending them to the programmer. All programs used to run the analysis were fully documented by the programmer.
The committee’s analyses required the construction of new variables, including exposure and disease measures. For each constructed variable, cross-tabulations of the raw variables and the constructed variables were made and reviewed to ensure that all of the cases were coded correctly in the constructed variable. As an additional check, a small sample of cases were selected and reviewed a second time to ensure that the constructed variables were properly coded based on the raw data.
Meetings were held among Westat staff at least once a week to review output from the analyses for accuracy and to determine any potential revisions that the analysis required. National Academies staff and committee members were consulted on an as-needed basis. Changes were communicated to the programmer in revised specifications as needed. Before the final written results of an analysis were delivered to National Academies staff and the committee, they were reviewed internally by Westat, typically a senior staff member, to check for accuracy, completeness, and quality and to ensure that the findings were fully supported by the data.
PARTICIPATION RATES
Based on DoD data, as of December 31, 2015, there were approximately 3.5 million individuals who were eligible to participate in the AH&OBP Registry. As of June 30, 2015, 46,498 people had completed the registry questionnaire. Some of those respondents—94—did not verify or add an eligible deployment segment and were removed from the final number of respondents used in the committee’s exposure and health outcome analyses. Therefore, the final number of respondents was 46,404.
DoD deployment information (both the CTS and Gulf War Oil Well Fire Smoke Registry files) was used as the gold standard for determining deployment dates and countries and thus determining eligibility and response
rates as well. The CTS data included 2,483,392 eligible post-9/11 service members, and the Gulf War Oil Well Fire Smoke Registry file included 545,383 eligible service members. These numbers cannot simply be added together to determine the eligible population denominator because they are not mutually exclusive, as described above and shown in Table 4-1, and the respondents from each era are not necessarily a subset of the populations in the CTS and Gulf War Oil Well Fire Smoke Registry files because a small number of the respondents (those who were deployed during the Stabilization period only) are not in one of those files.
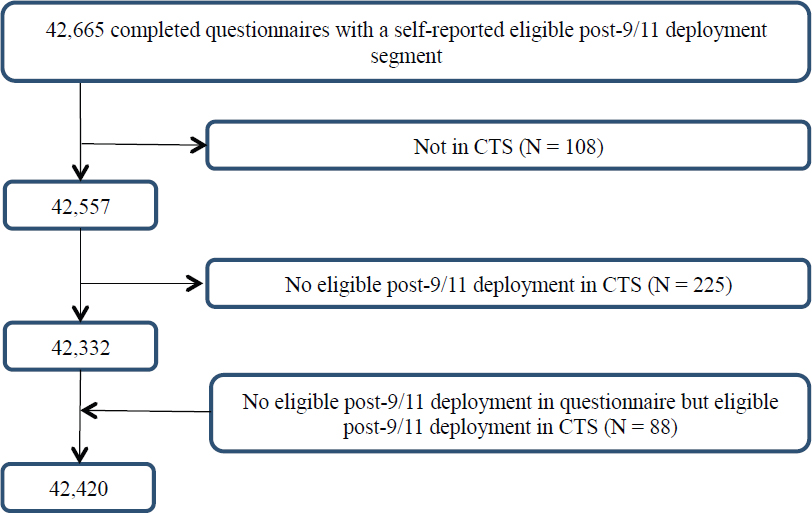
There were 42,665 respondents with an eligible post-9/11 deployment in the registry after excluding 8 respondents who had a post-9/11 deployment in the registry but for whom the country was not eligible according to the questionnaire. It is not clear why these respondents were included. An additional 333 respondents were excluded, 108 because they were not in the CTS and another 225 who did not have an eligible deployment in the CTS. Moreover, 88 respondents who had no eligible post-9/11 deployment in the registry were included because they were determined to be eligible according to the CTS. After these exclusions and inclusions, the final number of post-9/11 questionnaire completers was 42,420, as shown in Figure 4-1.
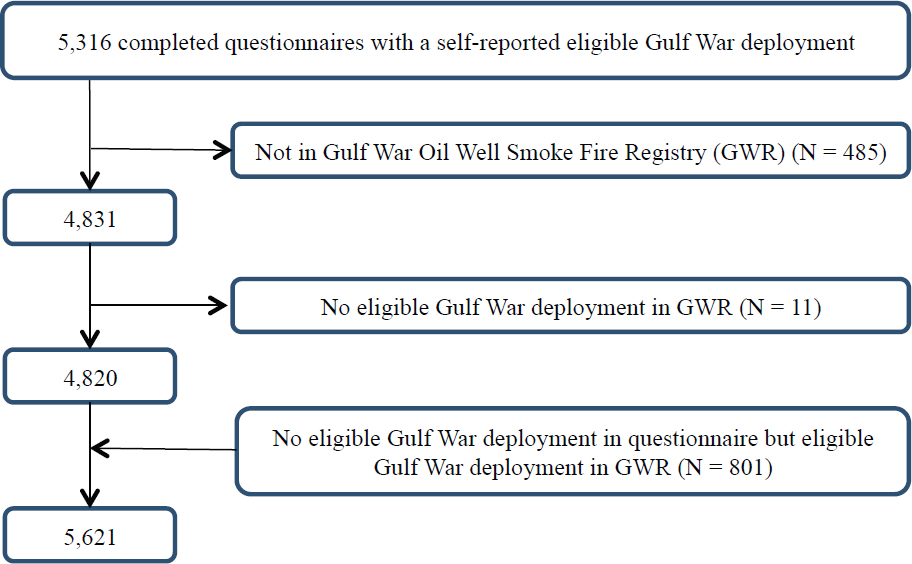
A total of 5,621 Gulf War veterans completed the AH&OBP Registry questionnaire; of those, 496 were found to be ineligible and were excluded based on data from the Gulf War Oil Well Fire Smoke Registry file. The 801 respondents who were eligible according to the Gulf War Oil Well Fire Smoke Registry file but were ineligible based on questionnaire deployment data were included in the analysis because the DoD data were considered to be the gold standard for determining eligibility. A total of 5,621 Gulf War questionnaire completers were included in the final analysis as shown in Figure 4-2.
The response rates were 1.0% and 1.7% for Gulf War and post-9/11 questionnaire completers, respectively. Because the committee only had access to the year of deployment (not the month or day), one reason for the discrepancies could be the lack of granularity. The reason that the number of eligible respondents is 46,404 and not 48,041—the sum of 42,420 and 5,621—is because the post-9/11 and Gulf War respondents are not mutually exclusive groups; some respondents are included in both groups (see Table 4-1).
During the pilot testing period, from April to June 2014, 194 respondents completed the questionnaire; 181
NOTE: CTS = Contingency Tracking System.
had eligible deployments and were included in the committee’s analyses. These questionnaires are included in the June 2014 numbers. The monthly number of completed questionnaires has remained relatively stable since the registry was opened (see Figure 4-3).
Participation is dependent on having created a user account, completed a Web-based consent form, completed the online self-assessment questionnaire, and had at least one eligible deployment segment, as discussed in Chapter 3. Thus, the committee identified a need to examine potential selection bias created by the process of completing the questionnaire, according to the four stages of questionnaire completion: people who accessed the registry and established a user account; people who consented to participate; people who partially completed the registry’s questionnaire; and people who completed and submitted the full questionnaire.
Comparisons between the eligible population and those who participated in each stage would give information about the facilitators and barriers to questionnaire completion and shed light on potential selection biases. However, because data on respondents who accessed, consented, and partially completed the questionnaire were not made available to the committee, this exercise could not be conducted.
Nevertheless, some data covering a similar time period (April 25, 2014, to December 31, 2014; N = 28,426) have been reported (VA, 2015b). Table 4-2 shows the number of people who accessed the registry, consented, and completed the full questionnaire (the number of persons who partially completed the questionnaire was not available). Based on that data, 38% of individuals who accessed the registry never completed the questionnaire (N = 17,498). The inclusion of partially completed questionnaires could result in a more representative and larger sample. A dropout rate of nearly 40% raises some significant concerns that merit additional investigation, although the limitations set on the data provided did not allow the committee to carry out such an investigation. In particular, because no information is available on the high numbers of partial completers, it is not possible to determine what effect, if any, successful efforts to retain or recapture these cases in the registry would have on the influence of selective participation bias or what steps might be taken for them to complete the questionnaire. This information would also have provided valuable insights into influences of initial and full participation.
VA internally examined the characteristics of drop-off points for persons who did not complete the question-
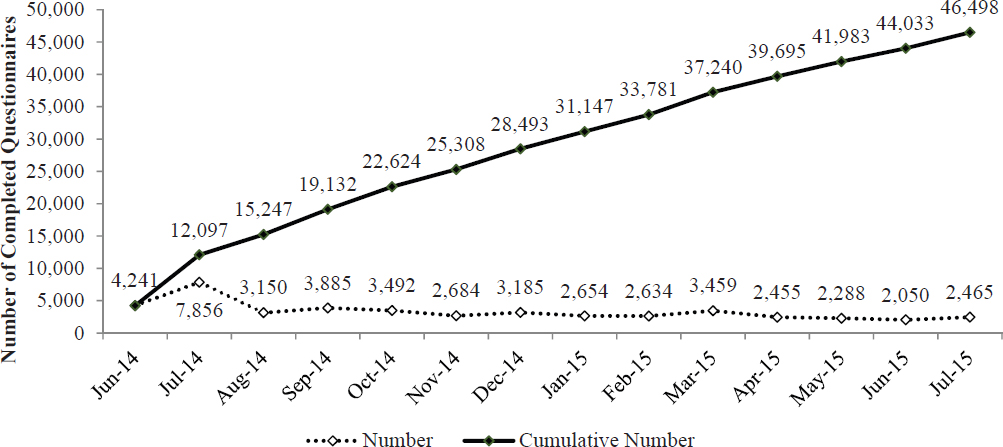
TABLE 4-2 Number of Respondents at Each Stage of Participation
| Status of Respondents | Total Through December 2014 |
|---|---|
| Total number of user accounts | 45,924 |
| Users providing Web consent | 43,308 |
| Completed questionnaire | 28,426 |
SOURCE: VA, 2015b.
naire. More than 50% of people who were determined to be eligible and able to access the questionnaire had not started it (defined as no response to Section 1.2, which required respondents to confirm or add deployment segment information). Of those who started the questionnaire (defined as answering at least one question), 38% did not proceed past the first question (Lezama, 2016). Without additional data on the characteristics of those who reached each stage of participation, especially those who started but did not submit a fully completed questionnaire, the committee’s ability to carefully examine factors that might have affected participation was limited.
REPRESENTATIVENESS
The degree to which the characteristics and experiences of a group or sample of people reflect those of the larger population is known as representativeness. The more representative a group is of the population, the greater the ability to generalize findings from analyses based on the group to the population. For this reason, it is important to examine how representative the AH&OBP Registry respondents (1.0% and 1.7% for Gulf War and post-9/11 respondents, respectively) are of the eligible deployed veteran population. The representativeness of the respondents is primarily affected by a type of selection bias created by the voluntary nature of participation, which leads to the respondents being self-selected (see Chapter 2). Therefore, to assess the representativeness of
registry respondents, the committee compared the demographic and military characteristics of the respondents and the eligible population.
Demographic and Military Characteristics Comparisons
Comparisons of demographic and military service characteristics between respondents and the full eligible population can provide important insights into selective participation among those defined as eligible and into what might have motivated participation, so that the value of the registry for simply describing the exposure and health experience of the total population of those eligible can be evaluated.
The only demographic characteristics collected by the questionnaire were birth date and current age. For the nonrespondents who were included only in the Gulf War Oil Well Fire Smoke Registry file, 25 years (the number of years between 1991—the end of the Gulf War—and the launch of the registry) was added to their listed age in the Gulf War file to estimate the ages they would have been if they had completed the registry questionnaire. For the post-9/11 nonrespondents included in the CTS file, their most current age in the CTS file was used. Other demographic information was obtained by linking data from the CTS and Gulf War Oil Well Fire Smoke Registry to the registry data.
Table 4-3 shows the distribution of select demographic and military characteristics of all respondents included in the committee’s dataset. As shown in Table 4-1, respondents consist primarily (86%) of individuals who served only in the post-9/11 era; service members of the Gulf War constitute 8% of respondents; 7% served in multiple periods; and less than 1% served only during the stabilization period. The categories of military characteristics, including pay grade, branch of service, and unit component were created to be mutually exclusive based on the most current information from the last deployment, according to the CTS and Gulf War Oil Well Fire Smoke Registry files. (Therefore, if a person was deployed first as an active-duty service member for one deployment then served in the reserves for the next, the person would be categorized as a reservist because this is the latest information according to the DoD administrative deployment records.) Individuals were counted once in the demographic-characteristic categories because those categories were mutually exclusive. Education level and marital status were based on information from the most recent deployment.
Overall, registry respondents were primarily male (89.1%), white (65.1%), married (58.8%), and enlisted (81.5%); they had primarily served in the Army (65.2%) and on active-duty (64.3%); a majority had completed high school or less (60.3%); and they were an average of 38.7 years of age when they completed the questionnaire. They spent an average of 14.5 months deployed, and 75% reported more than one eligible deployment, with an average of 4.4 deployments.
Comparisons of Differences Between Respondents and Total Eligible Population
Because of the large sample sizes available, the majority of comparisons will show statistically significant differences between groups, even when the differences are small, so the committee examined relative percent differences between the respondents and the eligible population. The relative percent differences are used in order to describe the magnitude of the differences and are calculated for each characteristic by subtracting the percent of the eligible population with that characteristic from the corresponding percent among the respondents, and then dividing by the percent of the eligible population, with the answer expressed as a percent (that is, the percent difference of two percentages). Differences that are positive indicate overrepresentation among registry respondents, while negative differences indicate characteristics that are underrepresented among registry participants. The committee used a cut-off of 10% to identify differences with practical (versus statistical) significance. One sample chi-square tests of independence (and t-tests for average age) were used to determine statistically significant differences in the distributions of registry respondents and the full eligible population for key demographic and military characteristics. Table 4-4 presents these data comparing respondents and all eligible service members (both respondents and nonrespondents combined), stratified by era of service.
Most of the characteristics show relative differences greater than 10%, with many being more than 40%. The greatest relative difference was between post-9/11 respondents and eligible personnel who served in both Iraq and
Afghanistan (80.6%). Differences on some characteristics (e.g., marital status) have little practical significance or meaning, but many others are important to consider as potential confounders of health outcomes; these include sex, age, race, branch of service, cumulative deployment measures, and countries of deployment. People who reported service in multiple eras were included in all categories for which they had deployments (for example, Gulf War and post-9/11). Individuals were counted once in most categories, with two exceptions: country of deployment and era of service, where individuals were counted in multiple categories because all records were considered.
Differences between Gulf War era respondents and the eligible population were not as pronounced as was the case with the post-9/11 group, and the relatively smaller samples sizes for certain categories of respondents make some of the estimates less reliable. Army service was overrepresented among Gulf War respondents compared with the eligible population (76.4% versus 56.3%, a relative difference of 35.7%). Conversely, the proportion of respondents who served in the Navy/Coast Guard was lower than in the eligible population (4.0% versus 19.0%). Likewise, respondents who served in the Air Force and Marine Corps were also underrepresented (relative differences of 25.2% and 19.0%, respectively). The overrepresentation of Army service may be because these veterans were more likely than those serving in other branches to be deployed at land-based locations with or near burn pits.
About half (50.4%) of all eligible Gulf War service personnel had not deployed to either Iraq or Kuwait, compared with only 35.5% of respondents (a relative difference of −29.6%). Greater positive differences, and thus overrepresentation, were observed between the two groups for deployment to Iraq only (relative difference 40.0%) and Iraq and Kuwait (43.4%). The overrepresentation of Iraq/Kuwait locations of deployment is likely because the forward operating bases that used burn pits at that time were located in Iraq and Kuwait. Therefore, veterans and service members deployed to those locations may be more inclined to participate in the registry.
The few differences observed in demographic as opposed to military characteristics included an overrepresentation of women (16.2%) and those with some college or a bachelor’s degree (relative difference of 33.3%) and a substantial underrepresentation of those aged 60 and older (relative difference of −56.6%).
While the post-9/11 respondents who chose to participate differed from the eligible population in ways similar to the Gulf War respondents (branch of service and country of deployment), they also differed from the eligible population on nearly every other characteristic examined. Among post-9/11 respondents, service in the Army was overrepresented by 26.9%, while those in the Navy/Coast Guard and Marines were underrepresented (relative differences of −73.0% and −11.0%, respectively). Previous reports of post-9/11 veterans and service members have corroborated this finding and have specifically restricted study populations to Army and Air Force personnel because of the low number of Navy and Marine Corps personnel with deployment locations within a 5-mile radius of the documented burn pits in the sample (AFHSC et al., 2010; Smith et al., 2012).
While the majority of both respondents and the eligible population had deployed to Iraq, Afghanistan, or both countries (86.3% versus 67.1%), registry respondents were substantially overrepresented among those who had deployed to Iraq only (relative difference, 31.8%) and to Iraq and Afghanistan (relative difference, 80.6%). In contrast, respondents were substantially underrepresented among those who did not serve in either Iraq or Afghanistan (a relative difference of −58.0%).
Regarding other military characteristics, post-9/11 respondents who were members of the reserve or National Guard were overrepresented (relative difference, 34.3%), and those on active-duty service were underrepresented (relative difference, −12.8%) in the registry when compared with the eligible population. The distribution of the number of deployments was also markedly different, with respondents reporting more eligible deployment segments than the eligible population. For example, 15.1% of respondents had one eligible deployment compared with 26.0% of the eligible population (relative difference, −41.9%), but 14.0% of respondents had 10 or more eligible deployment segments compared with 8.8% of eligible service members (relative difference 59.1%).
In addition to the differences in military characteristics, post-9/11 respondents and eligible persons from that era differed in all of the demographic characteristics available for assessment. For example, women (−14.3%), those less than 30 years old (−41.0%), and minority race/ethnicities (with several relative differences of −20% or more) were substantially underrepresented among respondents, while those who were married and those with some college or with bachelor’s degrees were overrepresented among registry participants (relative differences of 20.9% and 33.3%) relative to all eligibles from this era.
Other comparisons of post-9/11 respondents with all eligible persons conducted for VA (Gasper and Katawa,
TABLE 4-3 Distribution of Select Demographic and Military Characteristics for All Registry Respondents
| N | % | |
|---|---|---|
| Sex | ||
|
Male |
41,345 | 89.1 |
|
Female |
4,678 | 10.1 |
|
Missing |
381 | 0.9 |
| Age at questionnaire completiona | 46,404 | 38.7 |
|
<30 years old |
7,906 | 17.0 |
|
30–39 years old |
17,983 | 38.8 |
|
40–49 years old |
14,367 | 31.0 |
|
50–59 years old |
5,346 | 11.5 |
|
≥60 years old |
802 | 1.7 |
| Race | ||
|
White |
30,214 | 65.1 |
|
Black |
3,773 | 8.1 |
|
Hispanic |
3,372 | 7.3 |
|
Other |
1,480 | 3.2 |
|
Missing |
7,565 | 16.3 |
| Marital status | ||
|
Married |
27,279 | 58.8 |
|
Not married |
15,136 | 32.6 |
|
Missing |
3,989 | 8.6 |
| Rank | ||
|
Enlisted |
37,520 | 81.5 |
|
Officer/Warrant Officer |
8,507 | 18.4 |
| Branch | ||
|
Army |
30,253 | 65.2 |
|
Air Force |
8,514 | 18.3 |
|
Marine Corps |
5,087 | 11.0 |
|
Navy/Coast Guard |
2,534 | 5.5 |
|
Missing |
16 | 0.0 |
| Component | ||
|
Active duty |
29,860 | 64.3 |
|
Reserve/National Guard |
16,167 | 34.8 |
|
Missing |
377 | 0.8 |
| Education | ||
|
High school or less |
27,973 | 60.3 |
|
Some college/bachelor’s degree |
14,356 | 30.9 |
|
Postgraduate |
3,105 | 6.7 |
|
Missing |
970 | 2.1 |
| Occupation | ||
|
Infantry, gun crews, and seamanship |
11,974 | 25.8 |
|
Electronic equipment repair |
3,144 | 6.8 |
|
Communications and intelligence |
4,013 | 8.6 |
|
Health care |
3,074 | 6.6 |
|
Other technical and allied specialists |
1,374 | 3.0 |
|
Functional support and administration |
6,520 | 14.1 |
| N | % | |
|---|---|---|
|
Electrical/mechanical equipment repair |
6,368 | 13.7 |
|
Craft work |
1,641 | 3.5 |
|
Service and supply |
6,212 | 13.4 |
|
Nonoccupational or missing |
2,084 | 4.5 |
| Months of deployment (from Survey)a | 46,404 | 14.5 |
|
3 or less |
2,082 | 4.5 |
|
4–6 |
6,744 | 14.5 |
|
7–12 |
16,298 | 35.1 |
|
13–15 |
4,989 | 10.8 |
|
16–18 |
3,487 | 7.5 |
|
19–21 |
3,422 | 7.4 |
|
22–24 |
2,847 | 6.1 |
|
More than 24 |
6,535 | 14.1 |
| Eligible segments (from Survey) | 46,404 | 4.4 |
|
1 |
11,613 | 25.0 |
|
2 |
7,519 | 16.2 |
|
3 |
5,685 | 12.3 |
|
4 |
4,279 | 9.2 |
|
5 |
3,727 | 8.0 |
|
6 |
3,037 | 6.5 |
|
7 |
2,329 | 5.0 |
|
8 |
1,765 | 3.8 |
|
9 |
1,395 | 3.0 |
|
10 |
1,119 | 2.4 |
|
More than 10 |
3,936 | 8.5 |
a Age at questionnaire completion (in years) and months of deployment are presented as mean and standard deviation.
2015b) that were based on a different sample of registry data (with fewer participants) were largely consistent with these results. However, because that report included data pertaining to VHA health care utilization (not available to the committee), some important additional differences were noted. In particular, respondents were substantially more likely to have used VA services than all eligibles from this era (69.3% versus 46.0%, a relative difference of 50.6%), and among VHA enrollees, the registry underrepresented veterans in lower VA priority groups for treatment by 30%.
Gulf War Respondents Versus Post-9/11 Respondents
The demographic makeup of the registry population differs in significant ways between the Gulf War and the post-9/11 respondent populations for most demographic and military characteristics. These differences are most apparent in age, level of education, rank, branch of service, component, and number of deployments. Post-9/11 respondents were younger on average (37.8 versus 48.6 years) and more educated (33.8% versus 4.3% had a bachelor’s degree or higher) than Gulf War respondents. As for military characteristics, more post-9/11 respondents were officers (19.3% versus 10.0%), served in the Air Force (19.1% versus 7.7%), and were part of the reserves or National Guard (36.4% versus 17.1%) than Gulf War respondents. Although the majority of both post-9/11 and Gulf War respondents served in the Army, the proportion was smaller for post-9/11 (64.7% versus 76.4%).
TABLE 4-4 Relative Differences of Select Demographic and Military Characteristics of Respondents and Nonrespondents, Stratified by Era of Service
| Gulf War | Post-9/11 | |||||||||||
|---|---|---|---|---|---|---|---|---|---|---|---|---|
| Respondents (N = 5,621) | All Eligibles (N = 545,383) | P-value | Relative Difference | Respondents (N = 42,420) | All Eligibles (N = 2,483,392) | P-value | Relative Difference | |||||
| N | % | N | % | N | % | N | % | |||||
| Sex | ||||||||||||
|
Male |
5,173 | 92.0 | 507,167 | 93.0 | 0.0015 | −1.1 | 38,108 | 89.8 | 2,188,896 | 88.1 | <0.0001 | 1.9 |
|
Female |
443 | 7.9 | 37,175 | 6.8 | 16.2 | 4,311 | 10.2 | 294,427 | 11.9 | −14.3 | ||
|
Missing |
5 | 0.1 | 1,041 | 0.2 | −50.0 | 1 | 0.0 | 69 | 0.0 | |||
| Age (years) | ||||||||||||
|
<30 |
<0.0001 | 7,575 | 17.9 | 743,305 | 29.9 | <0.0001 | −40.1 | |||||
|
30–39 |
17,895 | 42.2 | 1,049,801 | 42.3 | −0.2 | |||||||
|
40–49 |
2,988 | 53.2 | 265,696 | 48.7 | 9.2 | 12,361 | 29.1 | 469,207 | 18.9 | 54.0 | ||
|
50–59 |
1,461 | 26.0 | 148,541 | 27.2 | −4.4 | 4,121 | 9.7 | 188,736 | 7.6 | 27.6 | ||
|
≥60 |
201 | 3.6 | 45,140 | 8.3 | −56.6 | 465 | 1.1 | 32,208 | 1.3 | −15.4 | ||
|
Missing |
971 | 17.3 | 86,006 | 15.8 | 9.5 | 3 | 0.0 | 135 | 0.0 | |||
| Mean age (years)a | 48.6 | 49.9 | <0.0001 | 37.8 | 35.2 | <0.0001 | ||||||
| Race | ||||||||||||
|
White |
3,852 | 68.5 | 362,828 | 66.5 | 0.0091 | 3.0 | 29,219 | 68.9 | 1,549,807 | 62.4 | <0.0001 | 10.4 |
|
Black |
1,280 | 22.8 | 130,311 | 23.9 | −4.6 | 3,254 | 7.7 | 344,065 | 13.9 | −44.6 | ||
|
Hispanic |
271 | 4.8 | 27,774 | 5.1 | −5.9 | 3,361 | 7.9 | 252,262 | 10.2 | −22.5 | ||
|
Other |
208 | 3.7 | 22,755 | 4.2 | −11.9 | 1,406 | 3.3 | 128,926 | 5.2 | −36.5 | ||
|
Missing |
10 | 0.2 | 1,715 | 0.3 | −33.3 | 5,180 | 12.2 | 208,332 | 8.4 | 45.2 | ||
| Marital status | ||||||||||||
|
Married |
27,279 | 64.3 | 1,320,818 | 53.2 | <0.0001 | 20.9 | ||||||
|
Not married |
15,136 | 35.7 | 1,161,949 | 46.8 | −23.7 | |||||||
|
Missing |
5 | 0.0 | 625 | 0.0 | ||||||||
| Rank | ||||||||||||
|
Enlisted |
5,058 | 90.0 | 490,666 | 90.0 | 0.9834 | 0.0 | 34,241 | 80.7 | 2,137,892 | 86.1 | <0.0001 | −6.3 |
|
Officer/Warrant Officer |
562 | 10.0 | 54,569 | 10.0 | 0.0 | 8,179 | 19.3 | 345,489 | 13.9 | 38.8 | ||
|
Missing |
148 | 0.0 | 11 | 0.0 | ||||||||
| Branch | ||||||||||||
|
Air Force |
435 | 7.7 | 56,089 | 10.3 | <0.0001 | −25.2 | 8,117 | 19.1 | 446,536 | 18.0 | <0.0001 | 6.1 |
|
Army |
4,292 | 76.4 | 306,834 | 56.3 | 35.7 | 27,447 | 64.7 | 1,265,848 | 51.0 | 26.9 | ||
|
Marine Corps |
669 | 11.9 | 80,219 | 14.7 | −19.0 | 4,778 | 11.3 | 316,317 | 12.7 | −11.0 | ||
|
Navy/Coast Guard |
225 | 4.0 | 102,241 | 19.0 | −79.0 | 2,078 | 5.0 | 454,691 | 18.0 | −73 | ||
| Unit Component | ||||||||||||
|
Active Duty |
4,657 | 82.9 | 460,153 | 84.4 | 0.0017 | −1.8 | 26,965 | 63.6 | 1,810,150 | 72.9 | <0.0001 | −12.8 |
|
Reserve/National Guard |
964 | 17.1 | 85,229 | 15.6 | 9.6 | 15,455 | 36.4 | 673,242 | 27.1 | 34.3 | ||
|
Missing |
1 | 0.0 | ||||||||||
| Education | ||||||||||||
|
High school or less |
5,320 | 94.6 | 520,324 | 95.4 | <0.0001 | −0.8 | 27,446 | 64.7 | 1,844,601 | 74.3 | <0.0001 | −12.9 |
|
Some college/bachelor’s degree |
224 | 4.0 | 16,272 | 3.0 | 33.3 | 12,224 | 28.8 | 505,986 | 20.4 | 41.2 | ||
|
Postgraduate |
15 | 0.3 | 2,299 | 0.4 | −25.0 | 2,136 | 5.0 | 92,578 | 3.7 | 35.1 | ||
|
Missing |
62 | 1.1 | 6,488 | 1.2 | −8.3 | 614 | 1.4 | 40,227 | 1.6 | −12.5 | ||
| Country of Deployment | ||||||||||||
|
Iraq only |
1,573 | 28.0 | 108,978 | 20.0 | <0.0001 | 40.0 | 18,627 | 43.9 | 826,062 | 33.3 | <0.0001 | 31.8 |
|
Kuwait only |
716 | 12.7 | 70,658 | 13.0 | −2.3 | |||||||
|
Iraq and Kuwait |
1,339 | 23.8 | 90,734 | 16.6 | 43.4 | |||||||
|
Neither Iraq or Kuwait |
1,993 | 35.5 | 275,013 | 50.4 | −29.6 | |||||||
|
Afghanistan only |
9,692 | 22.8 | 578,646 | 23.3 | −2.1 | |||||||
|
Iraq and Afghanistan |
8,292 | 19.5 | 269,378 | 10.8 | 80.6 | |||||||
|
Neither Iraq or |
5,809 | 13.7 | 809,306 | 32.6 | −58.0 | |||||||
|
Afghanistan |
||||||||||||
| Duty Occupation | ||||||||||||
|
Infantry, gun crews, and seamanship |
1,674 | 29.8 | 150,788 | 27.6 | <0.0001 | 8.0 | 10,978 | 25.9 | 635,871 | 25.6 | <0.0001 | 1.2 |
|
Electronic equipment repair |
289 | 5.1 | 36,942 | 6.8 | −25.0 | 2,935 | 6.9 | 191,457 | 7.7 | −10.4 | ||
|
Communications and intelligence |
521 | 9.3 | 48,351 | 8.9 | 4.5 | 3,647 | 8.6 | 211,558 | 8.5 | 1.2 | ||
|
Health care |
327 | 5.8 | 27,998 | 5.1 | 13.7 | 2,842 | 6.7 | 141,102 | 5.7 | 17.5 | ||
|
Other technical and allied specialists |
134 | 2.4 | 11,191 | 2.1 | 14.3 | 1,285 | 3.0 | 59,700 | 2.4 | 25.0 | ||
|
Functional support and administration |
669 | 11.9 | 63,188 | 11.6 | 2.6 | 6,059 | 14.3 | 323,987 | 13.0 | 10.0 | ||
|
Electrical/mechanical equipment repair |
905 | 16.1 | 101,695 | 18.6 | −13.4 | 5,826 | 13.7 | 419,648 | 16.9 | −18.9 | ||
|
Craft work |
162 | 2.9 | 18,572 | 3.4 | −14.7 | 1,552 | 3.7 | 105,227 | 4.2 | −11.9 | ||
|
Service and supply |
759 | 13.5 | 71,123 | 13.0 | 3.8 | 5,710 | 13.5 | 312,888 | 12.6 | 7.1 | ||
|
Nonoccupational |
117 | 2.1 | 9,460 | 1.7 | 23.5 | 902 | 2.1 | 44,625 | 1.8 | 16.7 | ||
|
Missing |
64 | 1.1 | 6,075 | 1.1 | 0.0 | 684 | 1.6 | 37,329 | 1.5 | 6.7 | ||
| Gulf War | Post-9/11 | |||||||||||
|---|---|---|---|---|---|---|---|---|---|---|---|---|
| Respondents (N = 5,621) | All Eligibles (N = 545,383) | P-value | Relative Difference | Respondents (N = 42,420) | All Eligibles (N = 2,483,392) | P-value | Relative Difference | |||||
| N | % | N | % | N | % | N | % | |||||
| Eligible deployment segments | ||||||||||||
1 |
1,747 | 31.1 | 209,544 | 38.4 | <0.0001 | −19.0 | 6,403 | 15.1 | 646,351 | 26.0 | <0.0001 | −41.9 |
2 |
2,148 | 38.2 | 192,375 | 35.3 | 8.2 | 6,393 | 15.1 | 472,130 | 19.0 | −20.5 | ||
3 |
1,395 | 24.8 | 110,727 | 20.3 | 22.2 | 4,830 | 11.4 | 284,519 | 11.5 | −0.9 | ||
4 |
285 | 5.1 | 25,393 | 4.7 | 8.5 | 3,782 | 8.9 | 195,025 | 7.9 | 12.7 | ||
5 |
46 | 0.8 | 7,344 | 1.3 | −38.5 | 3,752 | 8.8 | 182,661 | 7.4 | 18.9 | ||
6 |
3,288 | 7.8 | 157,664 | 6.3 | 23.8 | |||||||
7 |
2,821 | 6.7 | 122,092 | 4.9 | 36.7 | |||||||
8 |
2,117 | 5.0 | 87,434 | 3.5 | 42.9 | |||||||
9 |
1,687 | 4.0 | 65,763 | 2.6 | 53.8 | |||||||
10 |
1,419 | 3.3 | 51,697 | 2.1 | 57.1 | |||||||
More than 10 |
5,928 | 14.0 | 218,056 | 8.8 | 59.1 | |||||||
a Age at questionnaire completion (in years) is presented as mean and standard deviation.
Likewise, a smaller proportion of post-9/11 respondents were active duty compared with Gulf War respondents (63.6% versus 82.9%).
The distribution of the number of eligible deployment segments also varies greatly between respondents of the two eras. Almost all Gulf War respondents were deployed one, two, or three times (31.1%, 38.2%, and 24.8%, respectively), whereas only 41.6% of post-9/11 respondents reported three or fewer deployments. The maximum number of eligible deployment segments among Gulf War respondents was five, and less than 1% of respondents reported that many. However, 48.6% of post-9/11 respondents (and 35.4% of the eligible population) had five or more eligible deployment segments, and 14% of respondents were deployed 10 times or more as of December 31, 2015.
Because of the short nature of the Gulf War—6 months of lead-up operations and 100 hours of ground combat (Torreon, 2015)—few deployments would have been possible. On the other hand, there has been a well documented trend of multiple deployments among post-9/11 service members (Baiocchi, 2013; IOM, 2013).
In summary, there are several important differences in demographic and military characteristics between respondents and the eligible populations from which they are derived. Among Gulf War respondents, there were few demographic differences, but respondents were more likely to have served in the Army and have been deployed to Iraq or Iraq and Kuwait than the eligible population. Post-9/11 respondents were less racially diverse and older that the eligible comparison population and were overrepresented by service in the Army, service in the reserves/National Guard, deployment to Iraq and Iraq and Afghanistan, and having multiple deployment segments. Comparing the respondents by era shows that the Gulf War era respondents were older, more racially diverse, had less education, were more likely to be enlisted, had a greater proportion that served in the Army, were more likely to have been active duty, and deployed fewer times than post-9/11 respondents.
Overall, the registry (based on the data through July 2015) contains a low proportion of eligible respondents (less than 2% of the full population). However, the results of the comparisons are not unexpected. For example, given the mission and function of the Army, it is likely that soldiers of the post-9/11 era were most likely to have been deployed to locations with burn pits, and therefore, it is not surprising that they have a higher participation rate than respondents who served in other branches. As noted, even with an increased representation, only 2.2% of eligible post-9/11 Army members participated in the AH&OBP Registry. When conducting analyses of registry data, it is important to recognize these differences by era and to present results separately by era of service.
Effect of Nonresponse
To further study the representativeness of the registry data, the committee examined a separate analysis generated for VA that was limited to post-9/11 respondents and eligibles and linked registry data with VA health care records which included information of service use and priority group assignment (Gasper and Katawa, 2015b). The registry respondents were compared with their eligible population to determine the effect of nonresponse from eligible nonrespondents on estimates of disease prevalence. Seven self-reported provider-diagnosed respiratory and cardiovascular conditions and a measure of functional limitations due to a lung or breathing problem were used to determine whether a bias exists.
Nonresponse-adjusted weights were developed and applied based on calculated propensity scores that used all available demographic, military, and health care utilization characteristics that were found to be correlated with nonresponse. Propensity stratification uses a logistic regression model to relate covariates to an individual’s probability of response (that is, participation in the registry). The propensity score is the conditional probability of response given the covariates. The propensity scores were used to stratify the participants into propensity classes (cells), which served as nonresponse adjustment cells. The nonresponse weight was calculated as the inverse of the response rate (fraction of respondents in a cell). The eligible population was then divided into cells of the propensity score, and nonresponse weights were calculated for each cell. The weights were then applied to estimates of disease and exposure and compared with unadjusted estimates. It should be noted that this approach does not eliminate bias due to unobserved outcomes or variables that are available in the registry data but not available in VA or DoD administrative datasets (Gasper and Katawa, 2015b).
TABLE 4-5 Comparison of Unadjusted and Nonresponse Adjusted Estimates of Self-Reported Health Conditions from the AH&OBP Registry
| Health Condition | Unadjusted (%) | Adjusted (%) | Relative Difference (%) |
|---|---|---|---|
| Allergies | 38.5 | 38.1 | 1 |
| Asthma | 14.8 | 13.9 | 6.1 |
| Emphysema, chronic bronchitis, or COPD | 14.7 | 12.9 | 12.2 |
| Constrictive bronchiolitis | 1.2 | 0.9 | 25 |
| Idiopathic pulmonary fibrosis | 0.2 | 0.2 | 0 |
| Functional limitation/breathing problem | 27.5 | 25.0 | 9.1 |
| High blood pressure | 34.7 | 32.1 | 7.5 |
| Coronary artery disease | 2.9 | 2.3 | 20.7 |
NOTE: AH&OBP = Airborne Hazards and Open Burn Pit; COPD = chronic obstructive pulmonary disease.
SOURCE: Gasper and Kawata, 2015b.
All adjusted estimates of health conditions were consistently lower than (or, in the case of idiopathic pulmonary fibrosis, the same as) than unadjusted estimates (see Table 4-5), with the greatest absolute difference being 2.6% for hypertension and relative differences of 10% or more for emphysema, chronic bronchitis, or chronic obstructive pulmonary disease (COPD); constrictive bronchiolitis; and coronary artery disease. These results suggested that the registry may modestly overestimate disease prevalence. The largest differences between respondents and the eligible population were for VA health care utilization and VA priority group (which is based on a number of factors, including disability). In fiscal year 2013, respondents were more likely to use VA health care (69% versus 46%, a relative difference of 50.6%) and to report a disease than members of the eligible population. An examination of VA health care user status and self-reported health outcomes among registry respondents found higher prevalence rates of most health conditions among VA users compared with nonusers. For example, 37.7% of registry respondents who use VA health care reported hypertension, compared with 28.0% of respondents who do not use VA health care. This suggests that if more non-VA users participated in the registry, the prevalence of many health conditions would be lower (Gasper and Katawa, 2015b).
Committee’s Propensity Analysis
The committee conducted a similar analysis of nonresponse bias by comparing demographic and military characteristics of post-9/11 era respondents with those of the eligible population. Information on the demographic and military service characteristics of respondents and eligible non-respondents was obtained by linking registry data with the CTS deployment file.
The committee did not have access to VA medical records, and therefore the models on disease estimates accounting for nonresponse bias were based only on the demographic and military characteristics that were available to the committee and correlated with nonresponse. Nonresponse-adjusted weights were developed using propensity stratification and a method similar to the one used for the VA analyses described above. Whereas 5 cells were used for the VA analysis, 10 cells were used for the committee’s analysis because this resulted in the least amount of bias for the post-9/11 respondents.
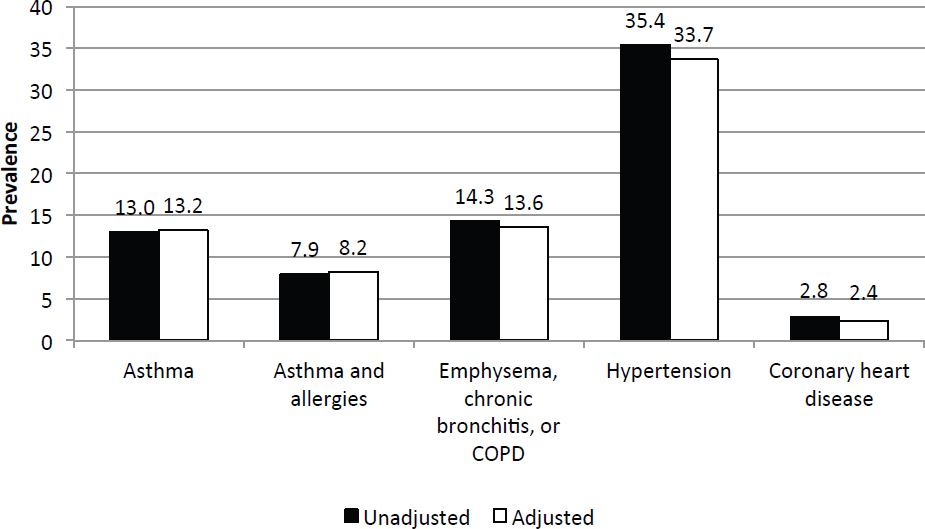
Figure 4-4 shows that there were few differences in the estimates of disease before and after the nonresponse adjustment, and the direction of the differences was not consistent among diseases. The conclusions that can be drawn from this analysis are more limited because health care utilization characteristics were not made available to the committee, which prevented evaluations of the validity of self-reported disease. Moreover, it is likely that respondents are self-selected in ways that are unable to be observed or determined with certainty, such as experiences in theater, exposures, motivation to participate, and health concerns or outcomes. Without including the VA health care utilization factors in the adjustment, most of the differences between adjusted and unadjusted estimates are small.
NOTE: COPD = chronic obstructive pulmonary disease.
Based on both VA’s and the committee’s nonresponse bias analyses, the committee sought to determine what proportion of the variance in propensity is accounted for by the variables to which the committee had access. One method to distinguish between registry respondents and eligible non-respondents is to examine the distribution of propensity scores for the two groups from the logistic regression model predicting response status. Both respondents and nonrespondents had low mean propensity scores (0.024 and 0.017, respectively). A second method is to examine the cumulative percentage of non-respondents whose propensity score is below the 20th percentile of propensity scores for respondents. Most nonrespondents should have propensity scores that are lower than most respondents. If 80% of nonrespondents have propensity scores lower than the 20th percentile of respondent propensity scores, it suggests that the covariates included in the logistic regression strongly predict response status; however, in this analysis only 45% of nonrespondents had propensity scores that were less than the 20th percentile for respondents. The considerable overlap in the distribution of propensity scores for respondents and nonrespondents suggests that the demographic and military characteristics available to the committee do a modest to weak job of distinguishing between the two groups. Adding the VA health care utilization data would likely improve the proportion of variability that could be accounted for between respondents and eligible nonrespondents, but it still would not adjust for the greater motivation of people with presumed exposure and health effects to participate.
OVERVIEW OF QUESTIONNAIRE RESULTS
The committee examined the variability in responses to specific items on the questionnaire and the degree to which questions were not answered to further assess the degree to which biases are apparent in the registry data. To examine variability in responses, the committee looked at questions for which a large proportion of respondents endorsed an exposure or health condition. Because this registry is voluntary and some degree of selection bias is expected, the lack of variability in responses for exposure or health-related conditions may confirm or refute potential biases. An examination of items with high rates of nonresponse (missing answers, refusals, or “don’t
know”) could indicate reporting or recall biases or evidence of poorly worded questions (as noted in Chapter 3). Reporting and recall biases would be evident as respondents are more likely to report or recall certain exposures or health conditions of concern than others. A lack of variability of responses also affects the ability to observe associations and draw conclusions.
Questions with Limited Variability in Responses
The committee examined variability in responses for six exposures of interest (burn pits, dust, construction duties, fuel exhaust, combat, and soot from oil-well fires) and all of the health outcomes, with a focus on respiratory and cardiovascular diseases. For questions that were part of a skip pattern, the variability in responses was examined only among those respondents who were eligible to answer the question. For questions about exposure that are asked on each deployment, the question was considered to have been “endorsed” if the respondent indicated exposure on any deployment. Responses that were not endorsed were either missing or considered as no exposure. The percentage of respondents who endorsed a question was calculated using all respondents eligible to answer the question. Items that the committee did not consider useful for assessing exposure or disease relationships were excluded, such as Question 8.1.B, which asks whether respondents use the Internet and was endorsed by more than 95% of respondents.
Table 4-6 shows the questions with the least amount of variability at the individual level, all of which were endorsed by at least 85% of respondents. Three exposure questions—near a burn pit, exposed to soot, and exposed to dust storms—were endorsed by the vast majority of respondents. Ever having been near a burn pit was endorsed on at least one deployment by 96% of respondents. Among the respondents who served in the 1990–1991 Gulf War, 89% reported that they were exposed to soot from oil-well fires. Exposure to dust storms during deployment, defined as at least one day per month, was reported by 85% of respondents.
Several other questions related to deployment experience or health outcomes had little variability. Question 3.1.H asked whether the respondent was concerned that in the future his or her health will be affected by something breathed during deployment, and it was endorsed by 92% of respondents. Question 1.4.D asked respondents whether, during deployment, they experienced wheezing, difficulty breathing, or itchy or irritated nose, eyes, or throat that they thought was the result of poor air quality; 88% of respondents answered yes to this question.
The lack of variability noted for these key exposure questions is important in that it limits the analysis that is possible using these items (see Chapters 5 and 6). Given that the registry was marketed with a focus on burn
TABLE 4-6 Questions with Limited Variability in Response
| Question | Text | Number Eligible | Percent Endorsed |
|---|---|---|---|
| 1.2.A | Were you exposed to soot, ash, smoke, or fumes from Gulf War oil well fires? | 5,595c | 89.3a |
| 1.2.D | Were you near a burn pit during these dates (or on the base or close enough to the base for you to see the smoke)? | 46,404 | 95.8a |
| 1.2.H | On a typical day, how many hours were you outside or in an open tent or shelter? | 46,404 | 96.3b |
| 1.4.C | In a typical month, how many days were you exposed to dust storms? | 46,404 | 85.3b |
| 1.4.D | During your deployment(s), did you experience wheezing, difficulty breathing, an itchy or irritated nose, eyes, or throat that you thought was the result of poor air quality? | 46,404 | 88.3a |
| 3.1.H | Are you concerned that in the future that your health will be affected by something you breathed during deployment? | 46,404 | 92.0a |
a A response of “yes” is considered endorsed.
bA response of greater than 0 is considered endorsed.
c Question only asked to Gulf War service members.
pit exposures, it is not surprising that virtually all respondents endorsed this exposure. In effect, the high levels of endorsement for the items in Table 4-6 imply a very skewed sample. Many of the exposures that the questions sought to elucidate are relatively common so that nearly anyone who was deployed endorsed them. Moreover, there are no follow-up questions to allow for more granular detail. Questions that do not allow for variability are of little use for analyses examining associations.
Questions with High Rates of Nonresponse
For individual items on the questionnaire, nonresponse analyses were conducted, with missing, don’t know, and refused responses grouped as a separate category. Respondents were required to answer every question—although “don’t know” and “refused” options were provided for most questions. VA indicated that there was an “anomaly” in an earlier version of the questionnaire which allowed respondents to skip questions. This resulted in a third type of “missing” data. Item nonresponse rates were calculated for each item in the questionnaire. The item nonresponse rate was calculated as the number of nonresponses divided by the total number of respondents eligible to answer the question. Table 4-7 shows the percentage of nonresponses (don’t know, refused, and missing responses) for each questionnaire item except for “check all that apply” questions (see Chapter 3 for a description of the types of questions contained in the questionnaire). Questions that were asked of each eligible deployment segment versus for the individual are indicated under the eligible column; the majority of questions were asked once at the individual level. Eligible refers to the number of deployment segments or individuals, after accounting for skip patterns, that were eligible to answer the question. For example, the question about the number of hours that smoke/fumes from the burn pit entered the work site/housing is restricted to deployment segments for which a participant reported having been near a burn pit.
Several items had nonresponse rates greater than 15%, and some had nonresponse rates of greater than 30%. “Don’t know” responses contributed to the vast majority of the nonresponse rate. For example, Question 5.5.A, which asks respondents whether they have ever worked in a job with asbestos exposure, including military service, had a nonresponse rate (mostly attributed to don’t know responses) of 35%. Such high levels of don’t know and missing responses indicate that the data derived from these questions may not be valid or, therefore, may not be useful for analysis (as discussed in Chapter 3). The high rates of nonresponse, particularly “don’t know” may be the result of poorly written questions that are difficult to answer, whereas questions with higher levels of refused or missing answers may be the result of survey fatigue. Notably, unlike the few questions with little variability in responses, item nonresponse was greatest for questions that were noted as being more nebulous, compound, and outside of the focus of the registry. As noted in Chapter 3, much could have been done to improve the questions and likely increase item response rates.
Table 4-8 presents the percentages of yes, no, and nonresponses for each exposure and health condition question. Among the exposure questions with high nonresponse rates was Question 1.2.D (whether a respondent was a near a burn pit on each deployment) which had a nonresponse rate of nearly 20%. In other words, for 20% of deployments, the response was don’t know, refused, or missing for this question. Question 1.2.G (the number of hours per day during the deployment that smoke/fumes from a burn pit entered the work site or housing area) had a nonresponse rate of 18.8%. Question 1.2.I (the number of hours per day near sewage ponds) had a nonresponse rate of 39.1%. Question 1.3.B (the number of days exposed to smoke from heavy weapons) had a nonresponse rate of 22.5%.
A previous analysis of registry data found that nonresponse rates for questions asked by deployment segment were significantly higher on deployments that were asked about later in the questionnaire than those that were asked about earlier, a pattern that suggests that nonresponse may be due to respondent fatigue (Gasper and Katawa, 2015a). A further analysis found the nonresponse rate to Question 1.2.D (ever having been near a burn pit on deployment) was higher for deployments to bases where burn pits did not exist than on those where they did, suggesting that some of the “don’t know” responses may actually be “not exposed” (Gasper and Katawa, 2015b). Because the committee was not given deployment dates or base information, these analyses could not be replicated.
In addition to the exposure questions, several questions on health conditions and concerns had high nonresponse rates. Most of those items were questions that the committee found to be poorly worded or otherwise prob-
TABLE 4-7 Number of Eligible Responses and Percentage of Nonresponses by Question
| Question | Text | Eligible | Nonresponse | |
|---|---|---|---|---|
| N | % | |||
| Q1.2.A | Were you exposed to soot, ash, smoke, or fumes from the Gulf War oil well fires during any GWA deployment? | 6,694a | 585 | 8.7 |
| Q1.2.B | Where did you spend most of your time during these dates? | 206,373b | 29,557 | 14.3 |
| Q1.2.C | Where did you spend the second most amount of time? | 206,373b | 35,180 | 17.0 |
| Q1.2.D | Were you near a burn pit during any deployment? | 206,373b | 40,648 | 19.7 |
| Q1.2.F | Did you have any burn pit duties on any deployment? | 129,192b | 2,582 | 2.0 |
| Q1.2.G | Did smoke or fumes from the burn pit enter your work site or housing on any deployment? | 129,192b | 24,321 | 18.8 |
| Q1.2.H | Were you outside or in an open tent or shelter during any deployment? | 206,373b | 22,158 | 10.7 |
| Q1.2.I | Did you smell or see sewage ponds on any deployment? | 206,373b | 80,743 | 39.1 |
| Q1.3.A | Were you ever close enough to feel the blast from an IED (improvised explosive device) or other explosive device? | 46,404 | 1,361 | 2.9 |
| Q1.3.B | In a typical month, how many days were you near heavy smoke from weapons, signal smoke, markers or other combat items? | 46,404 | 10,420 | 22.5 |
| Q1.3.C | In a typical month, how many days were you in convoy or other vehicle operations? | 46,404 | 2,677 | 5.8 |
| Q1.3.D | In a typical month, how many days did you perform refueling operations? | 46,404 | 3,575 | 7.7 |
| Q1.3.E | In a typical month, how many days did you perform aircraft, generator, or other large engine maintenance? | 46,404 | 2,786 | 6.0 |
| Q1.3.F | In a typical month, how many days did you perform construction duties? | 46,404 | 4,767 | 10.3 |
| Q1.3.G | In a typical month, how many days did you perform pesticide duties for your unit? | 46,404 | 5,008 | 10.8 |
| Q1.4.A | Did you do anything differently during your deployment(s), when you thought or were informed air quality was bad (for example during dust storms or heavy pollution days)? | 46,404 | 1,132 | 2.4 |
| Q1.4.C | In a typical month during your deployment(s), how many days did you experience dust storms? | 46,404 | 6,190 | 13.3 |
| Q1.4.D | During your deployment(s), did you experience wheezing, difficulty breathing, an itchy or irritated nose, eyes or throat that you thought was the result of poor air quality? | 46,404 | 3,701 | 8.0 |
| Q1.4.E | How many days in an average month did you experience wheezing, difficulty breathing, an itchy or irritated eyes, nose, or throat that you thought was the result of poor air quality? | 40,990 | 6,123 | 14.9 |
| Q1.4.F | During your deployment(s), did you seek medical care for wheezing, difficulty breathing, an itchy or irritated nose, eyes, or throat that you thought was the result of poor air quality? | 46,404 | 4,185 | 9.0 |
| Q2.1.A | How difficult is it to run or jog 1 mile on a level surface? | 46,404 | 693 | 1.5 |
| Q2.1.B | How difficult is it to walk on a level surface for one mile? | 46,404 | 566 | 1.2 |
| Q2.1.C | How difficult is it to walk a 1/4 of a mile—about 3 city blocks? | 46,404 | 565 | 1.2 |
| Q2.1.D | How difficult is it to walk up a hill or incline? | 46,404 | 495 | 1.1 |
| Q2.1.E | How difficult is it to walk up 10 steps or climb a flight of stairs? | 46,404 | 464 | 1.0 |
| Q2.2.1.A | Have you been told by a doctor or other health professional that you had Hay fever or allergies to pollen, dust, or animals? | 46,404 | 2,696 | 5.8 |
| Q2.2.1.B | Have you ever been told by a doctor or other health care professional that you had asthma? | 46,404 | 2,106 | 4.5 |
| Question | Text | Eligible | Nonresponse | |
|---|---|---|---|---|
| N | % | |||
| Q2.2.1.C | Have you ever been told by a doctor or other health care professional that you had emphysema? | 46,404 | 1,595 | 3.4 |
| Q2.2.1.D | Have you ever been told by a doctor or other health care professional that you had chronic bronchitis? | 46,404 | 2,877 | 6.2 |
| Q2.2.1.E | Have you ever been told by a doctor or other health care professional that you had chronic obstructive pulmonary disease also called COPD? | 46,404 | 2,268 | 4.9 |
| Q2.2.1.F | Have you ever been told by a doctor or other health care professional that you had some lung disease or condition other than asthma, emphysema, chronic bronchitis or COPD? | 46,404 | 2,730 | 5.9 |
| Q2.2.1.G | Have you ever been told by a doctor or other health care professional that you had constrictive bronchiolitis (CB)? | 4,333 | 848 | 19.6 |
| Q2.2.1.H | Have you ever been told by a doctor or other health care professional that you had idiopathic pulmonary fibrosis (IPF)? | 4,333 | 650 | 15.0 |
| Q2.2.1.J | Did this lung disease get better, worse, or about the same during deployment? | 1,266 | 133 | 10.5 |
| Q2.2.1.M | How would you rate your shortness of breath or breathlessness? (check the description/grade that applies to you.) | 26,294 | 528 | 2.0 |
| Q2.2.2.A | Have you ever been told by a doctor or other health care professional that you had hypertension, also called high blood pressure? | 46,404 | 1,766 | 3.8 |
| Q2.2.2.B | Have you ever been told by a doctor or other health care professional that you had coronary artery disease? | 46,404 | 1,602 | 3.5 |
| Q2.2.2.C | Have you ever been told by a doctor or other health care professional that you had angina pectoris? | 46,404 | 2,932 | 6.3 |
| Q2.2.2.D | Have you ever been told by a doctor or other health care professional that you had a heart attack, also called myocardial infarction? | 46,404 | 996 | 2.1 |
| Q2.2.2.E | Have you ever been told by a doctor or other health care professional that you had a heart condition other than coronary artery disease or angina or myocardial infarction? | 46,404 | 1,783 | 3.8 |
| Q2.2.3.A | During the past 12 months, have you regularly had insomnia or trouble sleeping? | 46,404 | 993 | 2.1 |
| Q2.2.3.B | During the past 12 months, have you had Neurological problems? (Some examples of neurological problems may include numbness, tingling, or weakness in your arms or legs or difficulties with thinking or memory.) | 46,404 | 2,058 | 4.4 |
| Q2.2.3.C | During the past 12 months, have you had problems of the immune system? | 46,404 | 9,166 | 19.8 |
| Q2.2.3.D | During the past 12 months, have you been told by a doctor or other health professional that you had any kind of liver condition? | 46,404 | 1,656 | 3.6 |
| Q2.2.3.E | During the past 12 months, have you been told by a doctor or other health professional that you had any chronic multi-symptom illness (examples include irritable bowel syndrome, chronic fatigue syndrome, and fibromyalgia)? | 46,404 | 3,266 | 7.0 |
| Q2.2.3.G | On average, how many hours of sleep do you get in a 24-hour period (round up 30 minutes or more to the next whole hour)? | 46,404 | 1,505 | 3.2 |
| Q2.2.3.H | Questions H and I are about snoring and breathing during sleep. To answer these questions, please consider both what others have told you and what you know about yourself. How often do you snore? | 46,404 | 4,406 | 9.5 |
| Q2.2.3.I | How often do you have times when you stop breathing during your sleep? | 46,404 | 18,279 | 39.4 |
| Q2.3.A | How tall are you without shoes? | 46,404 | 216 | 0.5 |
| Q2.3.B | How much do you weigh without shoes? | 46,404 | 931 | 2.0 |
| Q2.4.A | Have you ever been told by a doctor or other health professional that you had cancer or a malignancy (tumor) of any kind? | 46,404 | 907 | 2.0 |
| Question | Text | Eligible | Nonresponse | |
|---|---|---|---|---|
| N | % | |||
| Q2.4.B | What kind of cancer was it? | 45,500 | 69 | 0.2 |
| Q2.4.C | How old were you when this cancer was first diagnosed? | 2,382 | 83 | 3.5 |
| Q2.4.D | If you were diagnosed with a second cancer, what kind of cancer was it? | 45,401 | 202 | 0.4 |
| Q2.4.E | How old were you when this cancer was first diagnosed? | 372 | 23 | 6.2 |
| Q2.4.F | If you were diagnosed with a third cancer, what kind of cancer was it? | 45,381 | 228 | 0.5 |
| Q2.4.G | How old were you when this cancer was first diagnosed? | 82 | 9 | 11.0 |
| Q2.5.A | Have you smoked at least 100 cigarettes in your entire life? | 46,404 | 1,208 | 2.6 |
| Q2.5.B | How old were you when you first started to smoke fairly regularly? | 18,984 | 738 | 3.9 |
| Q2.5.C | Do you now smoke cigarettes every day, some days or not at all? | 15,943 | 44 | 0.3 |
| Q2.5.D | How long has it been since you quit smoking? | 10,479 | 385 | 3.7 |
| Q2.5.E | On the average, how many cigarettes do you now smoke a day? | 5,420 | 201 | 3.7 |
| Q2.5.F | Have you ever smoked tobacco products other than cigarettes even one time? (Such as cigars, pipes, water pipes or hookahs, small cigars that look like cigarettes, bidis, cigarillos, marijuana)? | 46,404 | 898 | 1.9 |
| Q2.5.G | Do you now smoke tobacco products other than cigarettes every day, some days, rarely, or not at all? | 45,509 | 78 | 0.2 |
| Q2.5.H | Have you ever used smokeless tobacco products even one time? (Such as chewing tobacco, snuff, dip, snus, or dissolvable tobacco)? | 46,404 | 520 | 1.1 |
| Q2.5.I | Do you now use smokeless tobacco products every day, some days, rarely, or not at all? | 45,888 | 37 | 0.1 |
| Q2.5.J | Are you exposed to second-hand smoke or environmental tobacco smoke every day, some days, rarely, or not at all? | 46,404 | 646 | 1.4 |
| Q2.6.A | Did you start smoking for the first time while being deployed? | 18,984 | 161 | 0.8 |
| Q2.6.B | How did deployment(s) change how much you smoked? | 15,862 | 678 | 4.3 |
| Q2.7.A | In the PAST YEAR, how often did you drink any type of alcoholic beverage. (Included are liquor such as whiskey or gin, beer, wine, wine coolers, and any other type of alcoholic beverage)? “On average, how many days per week did you drink?” | 46,404 | 1,961 | 4.2 |
| Q3.1.A | Compared to pre-deployment, would you say your overall health is better, worse, or about the same? | 46,404 | 1,554 | 3.3 |
| Q3.1.B | During your deployment(s), do you believe you were sick because of something you breathed? | 46,404 | 13,804 | 29.7 |
| Q3.1.C | Do you currently have a sickness or condition you think began or got worse because of something you breathed during deployment(s)? | 46,404 | 14,709 | 31.7 |
| Q3.1.D | When did the problem start? | 25,703 | 18 | 0.1 |
| Q3.1.E | Please rate your concern that something you breathed during deployment has already affected your health. | 46,404 | 514 | 1.1 |
| Q3.1.F | Please identify your biggest health concern that something you breathed during deployment has already affected your health. | 43,868 | 1,435 | 3.3 |
| Q3.1.G | Have you discussed this concern with your health care provider, medical professional or team? | 43,868 | — | — |
| Q3.1.H | Are you concerned that in the future that your health will be affected by something you breathed during deployment(s)? | 46,404 | 3,002 | 6.5 |
| Q3.1.I | Please rate your concern that something you breathed during deployment will affect your future health. | 42,704 | 76 | 0.2 |
| Q3.1.J | Please identify your biggest health concern that something you breathed during deployment will affect your future health. | 42,602 | 645 | 1.5 |
| Question | Text | Eligible | Nonresponse | |
|---|---|---|---|---|
| N | % | |||
| Q3.1.K | Which exposure do you think has the biggest overall effect on your health? | 45,614 | 2,937 | 6.4 |
| Q5.1.A | Which of the following were you doing last week? | 46,404 | 2,020 | 4.4 |
| Q5.1.B | What is the main reason you did not work last week/have a job or business last week? | 9,660 | 216 | 2.2 |
| Q5.2.A | Select the occupational category that best describes your main occupation (the civilian job you’ve held the longest). Do not include your occupation during military service. If your occupation is not included, select other occupation. | 46,404 | 4,803 | 10.4 |
| Q5.2.B | Total years in this non-military job {0-99} years (enter 0 if less than one year). | 46,404 | 6,847 | 14.8 |
| Q5.3.A | Have you ever worked for a year or more in any dusty job outside the military? | 46,404 | 1,219 | 2.6 |
| Q5.3.B.1 | For the job with the biggest dust exposure: Select the occupation category that best describes the job with the longest dust exposure. If your occupation is not included, select other occupation: | 5,650 | 87 | 1.5 |
| Q5.3.B.3 | Total years in this job {0–99} years (enter 0 if less than one year). | 5,650 | 186 | 3.3 |
| Q5.3.B.4 | Are you working in this dusty job now? | 5,650 | 61 | 1.1 |
| Q5.4.A | Have you ever been exposed to gas, smoke, chemical vapors or fumes in your work outside the military? | 46,404 | 3,082 | 6.6 |
| Q5.4.B.1 | For the job with the biggest gas, smoke, vapor or fume exposure: Select the occupational category that best describes the job with the longest gas, smoke, chemical vapor, or fume exposures. If your occupation is not included, select other | 8,060 | 76 | 0.9 |
| Q5.4.B.3 | Total years in this job {0–99} years (enter 0 if less than one year). | 8,060 | 260 | 3.2 |
| Q5.4.B.4 | Are you working in this job with gas, smoke, chemical vapors, or fumes now? | 8,060 | 81 | 1.0 |
| Q5.5.A | Have you ever worked in a job with asbestos exposure, including military service? | 46,404 | 16,259 | 35.0 |
| Q5.5.B | Circle the type(s) of asbestos exposure that describe(s) how you were exposed to. | 14,059 | 504 | 3.6 |
| Q5.5.C | How many years did you work in a job with asbestos exposure? (enter 0 if less than one year) | 14,059 | 2,045 | 14.5 |
| Q5.5.D | Are you working in a job with asbestos exposure now? | 14,059 | 1,777 | 12.6 |
| Q6.1.A | Are there any traditional farm animals that live on your land or that you visit on a regular basis? | 46,404 | 317 | 0.7 |
| Q6.1.B | Have you ever removed mold in your home because of its effect on your health? | 46,404 | 920 | 2.0 |
| Q6.1.C | Have you ever lived in a home that had elevated radon levels? | 46,404 | 8,868 | 19.1 |
| Q6.1.E | How many total hours a week, on average, do you participate in all the above hobbies combined? | 8,701 | 1,922 | 22.1 |
| Q7.1.A | About how long has it been since you last saw or talked to a doctor or other health care professional about your own health? Include doctors seen while a patient in a hospital. | 46,404 | 462 | 1.0 |
| Q7.1.B | Do you wish to see a DoD or VA health care provider to discuss your health concerns related to airborne hazards during deployment? | 46,404 | 9,452 | 20.4 |
| Q8.1.A | How do you prefer to receive updated information on burn pits and other airborne exposures? | 46,404 | 513 | 1.1 |
| Q8.1.B | Do you use the Internet? | 46,404 | 645 | 1.4 |
| Q8.1.C | Do you send or receive emails? | 46,404 | 32,348 | 69.7 |
NOTE: COPD = chronic obstructive pulmonary disease; GWA = Gulf War Area.
a Question only asked for Gulf War deployments.
b Question asked for each deployment.
lematic, and the high nonresponse rates further support the committee’s evaluation of the questions, as discussed in Chapter 3. For example, Question 2.2.3.C asked about immune system problems and had an item nonresponse rate of 19.8%. This question is vaguely worded, does not ask about doctor diagnoses or provide examples, and therefore, respondents may not have known whether they had these problems. Question 2.2.3.I (whether the individual stops breathing during sleep) is also a poorly worded question (most people are unsure of their behaviors or the frequency of them while asleep) and, perhaps as a result, has high rates of nonresponse (39.0%). Other questions that asked respondents whether sickness experienced during deployment was because of something they breathed (Question 3.1.B) and whether they are currently sick because of something they breathed (Question 3.1.C) likewise had high nonresponse rates, approximately 30% and 32%, respectively.
SYNOPSIS AND CONCLUSIONS
Based on the material presented in this chapter, the committee has reached the following general observations and conclusions related to the availability and content of the AH&OBP Registry data. Subsequent chapters offer more detailed information on the exposure and health outcomes data provided for analysis and the methods used to analyze it to best effect.
Data made available by VA are limited in several respects that are important to the committee’s ability to fully address its charge. Primary among these are the restrictions on the availability of some data because they were deemed to be potentially personally identifiable, including data on health care use or conditions as recorded in medical records through VA/DoD for either registry participants or the eligible population. The committee fully understands and appreciates VA’s desire to ensure the security of personally identifiable information. However, VA’s access restrictions limited the committee’s ability to fully analyze participation in and the content of the registry and to construct and evaluate reliable measures of exposure potential and health outcomes. The restrictions also affected the confidence with which the committee can draw conclusions regarding the process of data acquisition and the validity of the information reported on exposure and health outcomes.
A second major limitation is that questionnaire and other data were only available for those who fully completed the questionnaire. A VA report (2015b) indicated that nearly 40% of those who initiated an AH&OBP Registry questionnaire did not complete it, an observation that should be followed up. The committee recommends that VA evaluate whether and how registrants who did not complete the questionnaire differ from those who did, analyze the determinants of non-completion, and use this information to formulate strategies to encourage registrants to finish and submit their responses and improve the completion rate for future participants.
The registry’s title and the descriptions used by VA and DoD when communicating its availability were predominantly focused on environmental exposures experienced during deployment (as discussed in Chapter 3). That messaging likely resulted in higher levels of participation among those who feel that they experienced such exposures or whose health might have been affected by these or other military-related exposures. For example, 96% of all respondents reported being exposed to a burn pit on at least one deployment and 85.6% of Gulf War era respondents reported exposure to smoke from oil-well fires. Moreover, 85.2% of all respondents reported exposure to dust storms. The lack of data on those who were deployed and do not believe they were exposed to burn pits precludes using the registry to compare exposed with unexposed individuals. Therefore, the only means available for evaluating burn pit exposure is to examine gradations of exposure among the respondents using questions pertaining to being near a burn pit, having burn pit duties, and whether smoke or fumes from the burn pit entered the worksite or housing, as is described in detail in Chapter 5.
The makeup of the registry population differs in significant ways between the Gulf War and the post-9/11 respondent populations, as well as between each era of respondents and their respective eligible populations, for most demographic and military characteristics. When comparing registry participants either to nonrespondents only or to all eligibles it is important to recognize these differences, and examine outcomes separately by era of service as well as for the aggregated population. When a comparison group is necessary for analyses of registry data, the committee concludes that the eligible population stratified by era is the superior choice.
Although it is not possible to estimate the degree of reporting and response bias among those who choose to participate in the registry compared with the eligible population, comparing the eligible population with the
TABLE 4-8 Percentage of Endorsed and Nonresponses for Exposure and Health Condition Questions
| Question | Text | Yes | No | Nonresponse | ||||
|---|---|---|---|---|---|---|---|---|
| Eligible | N | % | N | % | N | % | ||
| Q1.2.A | Were you exposed to soot, ash, smoke, or fumes from the Gulf War oil well fires during any GWA deployment? | 6,694a | 5,729 | 85.6 | 380 | 5.7 | 585 | 8.7 |
| Q1.2.D | Were you near a burn pit during any deployment? | 206,373b | 129,192 | 62.6 | 36,533 | 17.7 | 40,648 | 19.7 |
| Q1.2.F | Did you have any burn pit duties on any deployment? | 129,192b | 66,087 | 51.2 | 60,523 | 46.8 | 2,582 | 2.0 |
| Q1.2.G | Did smoke or fumes from the burn pit enter your work site or housing on any deployment? | 129,192b | 103,234 | 79.9 | 1,637 | 1.3 | 24,321 | 18.8 |
| Q1.2.H | Were you outside or in an open tent or shelter during any deployment? | 206,373b | 177,880 | 86.2 | 6,335 | 3.1 | 22,158 | 10.7 |
| Q1.2.I | Did you smell or see sewage ponds on any deployment? | 206,373b | 84,591 | 41.0 | 41,039 | 19.9 | 80,743 | 39.1 |
| Q1.3.A | Were you ever close enough to feel the blast from an IED (improvised explosive device) or other explosive device? | 46,404 | 33,517 | 72.2 | 11,526 | 24.8 | 1,361 | 2.9 |
| Q1.3.B | In a typical month, how many days were you near heavy smoke from weapons, signal smoke, markers or other combat items? | 46,404 | 28,845 | 62.2 | 7,139 | 15.4 | 10,420 | 22.5 |
| Q1.3.C | In a typical month, how many days were you in convoy or other vehicle operations? | 46,404 | 35,390 | 76.3 | 8,337 | 18.0 | 2,677 | 5.8 |
| Q1.3.D | In a typical month, how many days did you perform refueling operations? | 46,404 | 30,669 | 66.1 | 12,160 | 26.2 | 3,575 | 7.7 |
| Q1.3.E | In a typical month, how many days did you perform aircraft, generator, or other large engine maintenance? | 46,404 | 18,515 | 39.9 | 25,103 | 54.1 | 2,786 | 6.0 |
| Q1.3.F | In a typical month, how many days did you perform construction duties? | 46,404 | 16,754 | 36.1 | 24,883 | 53.6 | 4,767 | 10.3 |
| Q1.3.G | In a typical month, how many days did you perform pesticide duties for your unit? | 46,404 | 5,107 | 11.0 | 36,289 | 78.2 | 5,008 | 10.8 |
| Q1.4.C | In a typical month during your deployment(s), how many days did you experience dust storms? | 46,404 | 39,558 | 85.2 | 656 | 1.4 | 6,190 | 13.3 |
| Q1.4.D | During your deployment(s), did you experience wheezing, difficulty breathing, an itchy or irritated nose, eyes or throat that you thought was the result of poor air quality? | 46,404 | 40,990 | 88.3 | 1,713 | 3.7 | 3,701 | 8.0 |
| Q1.4.E | How many days in an average month did you experience wheezing, difficulty breathing, an itchy or irritated eyes, nose, or throat that you thought was the result of poor air quality? | 40,990 | 34,842 | 85.0 | 25 | 0.1 | 6,123 | 14.9 |
| Q1.4.F | During your deployment(s), did you seek medical care for wheezing, difficulty breathing, an itchy or irritated nose, eyes, or throat that you thought was the result of poor air quality? | 46,404 | 16,141 | 34.8 | 26,078 | 56.2 | 4,185 | 9.0 |
| Q2.2.1.A | Have you been told by a doctor or other health professional that you had Hay fever or allergies to pollen, dust, or animals? | 46,404 | 18,203 | 39.2 | 25,505 | 55.0 | 2,696 | 5.8 |
| Question | Text | Yes | No | Nonresponse | ||||
|---|---|---|---|---|---|---|---|---|
| Eligible | N | % | N | % | N | % | ||
| Q2.2.1.B | Have you ever been told by a doctor or other health care professional that you had asthma? | 46,404 | 6,754 | 14.6 | 37,544 | 80.9 | 2,106 | 4.5 |
| Q2.2.1.C | Have you ever been told by a doctor or other health care professional that you had emphysema? | 46,404 | 588 | 1.3 | 44,221 | 95.3 | 1,595 | 3.4 |
| Q2.2.1.D | Have you ever been told by a doctor or other health care professional that you had chronic bronchitis? | 46,404 | 5,921 | 12.8 | 37,606 | 81.0 | 2,877 | 6.2 |
| Q2.2.1.E | Have you ever been told by a doctor or other health care professional that you had chronic obstructive pulmonary disease also called COPD? | 46,404 | 1,524 | 3.3 | 42,612 | 91.8 | 2,268 | 4.9 |
| Q2.2.1.F | Have you ever been told by a doctor or other health care professional that you had some lung disease or condition other than asthma, emphysema, chronic bronchitis or COPD? | 46,404 | 4,333 | 9.3 | 39,341 | 84.8 | 2,730 | 5.9 |
| Q2.2.1.G | Have you ever been told by a doctor or other health care professional that you had constrictive bronchiolitis (CB)? | 4,333 | 501 | 11.6 | 2,984 | 68.9 | 848 | 19.6 |
| Q2.2.1.H | Have you ever been told by a doctor or other health care professional that you had idiopathic pulmonary fibrosis (IPF)? | 4,333 | 99 | 2.3 | 3,584 | 82.7 | 650 | 15.0 |
| Q2.2.2.A | Have you ever been told by a doctor or other health care professional that you had hypertension, also called high blood pressure? | 46,404 | 16,502 | 35.6 | 28,136 | 60.6 | 1,766 | 3.8 |
| Q2.2.2.B | Have you ever been told by a doctor or other health care professional that you had coronary artery disease? | 46,404 | 858 | 1.8 | 43,944 | 94.7 | 1,602 | 3.5 |
| Q2.2.2.C | Have you ever been told by a doctor or other health care professional that you had angina pectoris? | 46,404 | 578 | 1.2 | 42,894 | 92.4 | 2,932 | 6.3 |
| Q2.2.2.D | Have you ever been told by a doctor or other health care professional that you had a heart attack, also called myocardial infarction? | 46,404 | 644 | 1.4 | 44,764 | 96.5 | 996 | 2.1 |
| Q2.2.2.E | Have you ever been told by a doctor or other health care professional that you had a heart condition other than coronary artery disease or angina or myocardial infarction? | 46,404 | 3,017 | 6.5 | 41,604 | 89.7 | 1,783 | 3.8 |
| Q2.2.3.A | During the past 12 months, have you regularly had insomnia or trouble sleeping? | 46,404 | 36,942 | 79.6 | 8,469 | 18.3 | 993 | 2.1 |
| Q2.2.3.B | During the past 12 months, have you had neurological problems? (Some examples of neurological problems may include numbness, tingling, or weakness in your arms or legs or difficulties with thinking or memory.) | 46,404 | 32,925 | 71.0 | 11,421 | 24.6 | 2,058 | 4.4 |
| Q2.2.3.C | During the past 12 months, have you had problems of the immune system? | 46,404 | 8,519 | 18.4 | 28,719 | 61.9 | 9,166 | 19.8 |
| Q2.2.3.D | During the past 12 months, have you been told by a doctor or other health professional that you had any kind of liver condition? | 46,404 | 3,107 | 6.7 | 41,641 | 89.7 | 1,656 | 3.6 |
| Q2.2.3.E | During the past 12 months, have you been told by a doctor or other health professional that you had any chronic multi-symptom illness (examples include irritable bowel syndrome, chronic fatigue syndrome, and fibromyalgia)? | 46,404 | 8,294 | 17.9 | 34,844 | 75.1 | 3,266 | 7.0 |
| Q2.2.3.H | Questions H and I are about snoring and breathing during sleep. To answer these questions, please consider both what others have told you and what you know about yourself. How often do you snore? | 46,404 | 40,291 | 86.8 | 1,707 | 3.7 | 4,406 | 9.5 |
| Q2.2.3.I | How often do you have times when you stop breathing during your sleep? | 46,404 | 20,454 | 44.1 | 7,671 | 16.5 | 18,279 | 39.4 |
| Q2.4.A | Have you ever been told by a doctor or other health professional that you had Cancer or a malignancy (tumor) of any kind? | 46,404 | 2,590 | 5.6 | 42,907 | 92.5 | 907 | 2.0 |
NOTE: COPD = chronic obstructive pulmonary disease; GWA = Gulf War Area.
a Question only asked for Gulf War deployments.
b Question asked for each deployment.
respondents on factors such as demographic characteristics may result in some insights that can be extrapolated to other areas of interest or included as effect modifiers in analyses of exposure and disease. However, these comparisons are weak because there are many unmeasured (or unavailable) variables, such as VA health care and utilization data and other factors that may influence the motivation to participate. Therefore, the committee was not able to draw firm conclusions from empirical evidence regarding the quality of the data. Applying propensity scores and weights designed to adjust for potential nonresponse bias using the available demographic and military characteristics met with limited success in reducing observed differences.
Based on the comparison of demographic and military characteristics between the respondents and eligible populations by era and the propensity analysis conducted, the committee concludes that the registry population is not representative of the eligible population. The committee further emphasizes that findings using the registry data are not generalizable to the broader, eligible population and should not be used for making inferences of that nature.
Several items have high rates of consistent responses (showing little variability), making them ultimately of little use for analyses. Items with little variability are evidence of selection bias (and perhaps other biases) which also affect their utility in analyses. Furthermore, several questions had nonresponse rates of greater than 15%, lending additional supporting evidence that many of the questions are poorly worded or otherwise problematic.
The AH&OBP Registry questionnaire data are amenable to analysis using standard statistical methods. However, the participants whose data were made available to the committee are a small (less than 2% of the eligible population), non-random, self-selected sample that is not broadly representative of the population of Gulf/OIF/OEF/OND and other eligible members of the military, and the results of analyses of them are not generalizable to the whole population of current or former service members covered by the registry. The committee therefore focused its analysis efforts on comparisons among registry participants rather than comparisons of registry participants to external populations. The distinctiveness of those who chose to participate precludes meaningful comparisons to the health experience of other populations. Internal analyses comparing registry participants to one another are limited by the quality of the exposure and disease information, but they have potential to generate hypotheses that would stimulate more rigorous epidemiologic evaluation through other approaches.
REFERENCES
AAPOR (American Association for Public Opinion Research). 2016. Standard definitions: Final dispositions of case codes and outcome rates for surveys. 9th edition. Oakbrook Terrace, IL: AAPOR.
Armed Forces Health Surveillance Center, Naval Health Research Center, and U.S. Army Public Health Command. 2010. Epidemiological studies of health outcomes among troops deployed to burn pit sites. Silver Spring, MD: Armed Forces Health Surveillance Center.
Baiocchi, D. 2013. Measuring army deployments to Iraq and Afghanistan. Santa Monica: RAND Corporation. http://www.rand.org/pubs/research_reports/RR145.html (accessed September 26, 2016).
Bonds, T. M., D. Baiocchi, and L. L. McDonald. 2010. Army deployments of OIF and OEF. Santa Monica, CA: RAND Corporation. http://www.rand.org/pubs/documented_briefings/DB587.html (accessed February 4, 2016)
Gasper, J., and J. Kawata. 2015a. Deployment segment analysis. Memo prepared for Paul Ciminera at the Department of Veterans Affairs Office of Public Health, Post-Deployment Health Group. April 27.
Gasper, J., and J. Kawata. 2015b. An evaluation of selection bias and data quality: Open Burn Pit and Airborne Hazards Registry. Prepared for the Department of Veterans Affairs Office of Public Health, Post-Deployment Health Group by Westat. September.
IOM (Institute of Medicine). 2013. Returning home from Iraq and Afghanistan: Assessment of readjustment needs of veterans, service members, and their families. Washington, DC: The National Academies Press.
Lezama, N.G. 2016. Responses from the Department of Veterans Affairs to questions from the Committee on the Review of the Department of Veterans Affairs Airborne Hazards and Open Burn Pit Registry. Received February 18.
Liu, J., N. Lezama, J. Gasper, J. Kawata, S. Morley, D. Helmer, and P. Ciminera. 2016. Burn pit emissions exposure and respiratory and cardiovascular conditions among airborne hazards and open burn pit registry participants. Journal of Occupational and Environmental Medicine 58(7):e249–e255.
Smith, B., C. A. Wong, E. J. Boyko, C. J. Phillips, G. D. Gackstetter, M. A. Ryan, and T. C. Smith. 2012. The effects of exposure to documented open-air burn pits on respiratory health among deployers of the Millennium Cohort Study. Journal of Occupational and Environmental Medicine 54(6):708–716.
Torreon, B. S. 2015. U.S. periods of war and dates of recent conflicts. Congressional Research Service. Report RS21405. https://www.fas.org/sgp/crs/natsec/RS21405.pdf (accessed October 3, 2016).
VA (Department of Veterans Affairs). 2015a. Report on data from the Airborne Hazards and Open Burn Pit (AH&OBP) Registry. April. http://www.publichealth.va.gov/docs/exposures/va-ahobp-registry-data-report-april2015.pdf (accessed September 10, 2016).
VA. 2015b. Report on data from the Airborne Hazards and Open Burn Pit (AH&OBP) Registry, June 2015. http://www.publichealth.va.gov/docs/exposures/va-ahobp-registry-data-report-june2015.pdf (accessed September 10, 2016).
Westat. 2016. Quality control procedures. Prepared by Westat in response to a request from the Committee on the Assessment of the Department of Veterans Affairs Airborne Hazards and Open Burn Pit Registry. Received October 3.
This page intentionally left blank.


