
1
Introduction
CONTEXT
In 2014, approximately 15 percent of all retail electricity used in the United States was consumed by lighting (EIA, 2016). Since that time, the commercialization of lighting products utilizing light-emitting diodes (LEDs) has grown dramatically. Projections suggest that LED products will account for 48 percent of lighting sales in 2020 and 84 percent of sales in 2030 (based on the light output over product life) (Navigant, 2014), with lighting expected to consume 14 percent of electricity in 2020 and 11 percent in 2030.1 However, only 6.4 percent of U.S. general illumination, measured in number of installations, was provided by LEDs in 2015 (DOE, 2016).
Widespread adoption of LED products has the potential to result in a 40 percent savings in the energy consumed by lighting by 2030 (Navigant, 2014), relative to the use of other lighting technologies, but these projections are contingent on technology developments that achieve the Department of Energy (DOE) goal of 200 lumens per watt (lm/W) luminaire efficacy by 2025 (DOE, 2016). The 2013 report Assessment of Advanced Solid-State Lighting (NRC, 2013) provided two estimates of savings in electricity consumption. In the first estimate, based on the lamp efficacy standards in the Energy Independence and Security Act (EISA) of 2007, Section 321, electricity consumption for lighting could be reduced by 514 terawatt hours (TWh) in the residential sector and 60 TWh in commercial applications, cumulative from 2012 to 2020. In the second estimate, based on more aggressive assumptions about improvements in the efficacies of LED luminaires, the cumulative savings over the same time period were 939 TWh in the residential sector and 771 TWh in the commercial sector. A number of technical challenges must be overcome to reach these efficacy targets. Furthermore, widespread consumer acceptance of this technology will require products to consistently deliver high-quality light and meet consumer expectations regarding reliability and interoperability with control systems.
STUDY ORIGIN
As required by EISA 2007, DOE engaged the National Research Council2 (NRC) to conduct a study of the status of solid-state lighting (SSL), resulting in Assessment of Advanced Solid-State Lighting (NRC, 2013). The legislation also includes a requirement for a follow-up report to update the findings of the initial study. The statement of task (Box 1.1) for the second phase of this study involves three main topics: an assessment of the commercialization of SSL, considerations of improvements to current technology, and an evaluation of SSL manufacturing. The primary tasks for the study were to provide the following:
- An assessment of market trends for light-emitting diodes (LEDs) and organic light-emitting diodes (OLEDs).
- An evaluation of the extent of problems with lighting quality, durability, power quality, and integration with controls, as well as recommended improvements.
- A discussion of advancements of LEDs and OLEDs that could increase the number of suitable applications for these technologies.
- An assessment of the ways in which the activities of DOE’s Solid-State Lighting Program can contribute to improvements in SSL technologies.
- Comments on the challenges of high-volume, low-cost manufacturing of SSL devices.
___________________
1 Data compiled from the “Residential Sector Key Indicators and Consumption” table and the “Commercial Sector Key Indicators and Consumption” table—both in the Reference Case (Energy Information Administration [EIA], “Total Energy: Production: Crude Oil and Lease Condensate,” http://www.eia.gov/forecasts/aeo/data/browser/, accessed August 12, 2016).
2 Effective July 1, 2015, the institution is called the National Academies of Sciences, Engineering, and Medicine. References in this report to the National Research Council are used in an historical context identifying programs prior to July 1.
- An evaluation of domestic and foreign manufacturing supply chains of LEDs and OLEDs, as well as suggestions for leveraging investments.
- A consideration of countries that dominate particular aspects of the manufacturing supply chain and identification of opportunities for U.S. industry.
To respond to these tasks, the National Academies of Sciences, Engineering, and Medicine established the Committee on Assessment of Solid-State Lighting, Phase 2, composed of diverse experts in the fields of SSL, electronics, lighting design, human perception of light, industry commercialization, and policy (committee biographical information is provided in Appendix A). While conducting this study, the committee members relied on their own expertise, information from publications they judged to be of high quality, and many interactions with experts in the field (Appendix B).
The committee addresses Item 1 of the statement of task, commercialization, in Chapter 2, noting the large changes in the cost and deployment volume of SSL in the past few years. Item 2, improvements to current technology, is discussed in Chapters 3 and 4, which update the findings of the 2013 report to include the latest status of LED- and OLED-based SSL devices and luminaires. The committee addresses Item 3, manufacturing, in Chapter 5, a focus that is new since the 2013 report, when the manufacturing of SSL was in a nascent stage.
INTRODUCTION TO LIGHTING
As in many technical fields, terminology used by lighting experts can differ from common language. A discussion of lighting hardware, metrics for measuring light, color quality, and lighting technologies was provided in the earlier report (NRC, 2013), and this background information is provided in Appendix C. The increased prevalence of LED lighting products has led to some subtle changes in the use and meanings of some terms used to describe light hardware. For instance, the designation for MR16 lamps technically refers to lamps with 2-inch-diameter multifaceted mirror reflectors. However, many LED replacement “MR16” lamps do not include reflectors at all. Instead, the LED packages and optical elements of the lamps are designed to produce a similar distribution of light to true MR16 halogen lamps.
Light Intensity and Efficacy
As described in Appendix C, the primary measure of the amount of light emitted from a lamp (light bulb) or luminaire (light fixture) is luminous flux, which has the unit of lumen (lm). Luminous flux is a measure of the optical power emitted from a light source, weighted by the sensitivity of the human visual system. Since the human visual system is not equally sensitive to all wavelengths of light, the spectral power distribution (the relative amount of light per wavelength) of light generated impacts luminous flux. The luminous flux of a lamp is most closely related to its total light output as perceived by the human visual system. Luminous efficacy, which has a unit of lumens per watt (lm/W), is the luminous flux emitted by a lighting product per watt of electrical power consumed. Luminous efficacy is a measure of the energy efficiency of a lamp or luminaire. A high value indicates an
energy-efficient lighting product, and a low value suggests that a lamp or luminaire is relatively inefficient. Generally, the luminous efficacy of lamps and luminaires cannot be directly compared. Lamps are typically placed within luminaires during operation, where some of the emitted light is lost to absorption. For instance, the efficacy of fluorescent tubes can exceed 100 lm/W, but in the fluorescent fixture can lead to an average loss of 26 percent of the light (PNNL, undated).
Light Color Properties
There are two primary color properties of a light source: chromaticity and color rendering. Chromaticity is a description of the appearance of the color of the light when viewed directly. There are several ways to quantify and communicate chromaticity. For white light sources, correlated color temperature (CCT), which is an indication of the temperature of a blackbody radiator that produces a light that appears most similar in color, is most commonly used. White lights with a reddish tint, which are often described as appearing “warm,” tend to have CCTs of approximately 2,500 K to 3,500 K. Neutral white light often has a CCT of approximately 3,500 K to 4,500 K. White lights with a bluish tint, often described as appearing “cool,” commonly have CCTs of approximately 4,500 K to 6,500 K. Because CCT describes the yellowishness/bluishness of nominally white light sources, a supplementary descriptor of the greenishness/reddishness is useful. This measure, Duv, is a signed quantity of the difference between the chromaticity of the light and the chromaticity of a blackbody radiator (Ohno, 2014). Positive values indicate greenish chromaticities, and negative values indicate reddish chromaticities. While chromaticity describes the color appearance of the light, color rendering refers to the color appearance of objects illuminated by the light source. A common measure of the color rendering characteristics of a light source is the color rendering index (CRI) (CIE, 1995). The CRI is calculated by comparing the color appearance of a set of object colors when illuminated by the light source of interest with their color appearance when illuminated by a reference illuminant (blackbody radiator or daylight). A general color rendering index (Ra) of 100 means that the test source renders eight particular object colors identically to the reference illuminant. The measurement of color rendering remains controversial, with many proposed alternative metrics (e.g., Davis and Ohno, 2010; Rea and Freyssinier-Nova, 2008). The Illuminating Engineering Society (IES) has recently published a new color rendering metric (IES, 2015), typically referred to by its document number, TM-30.3
Relationship Between Color and Efficacy
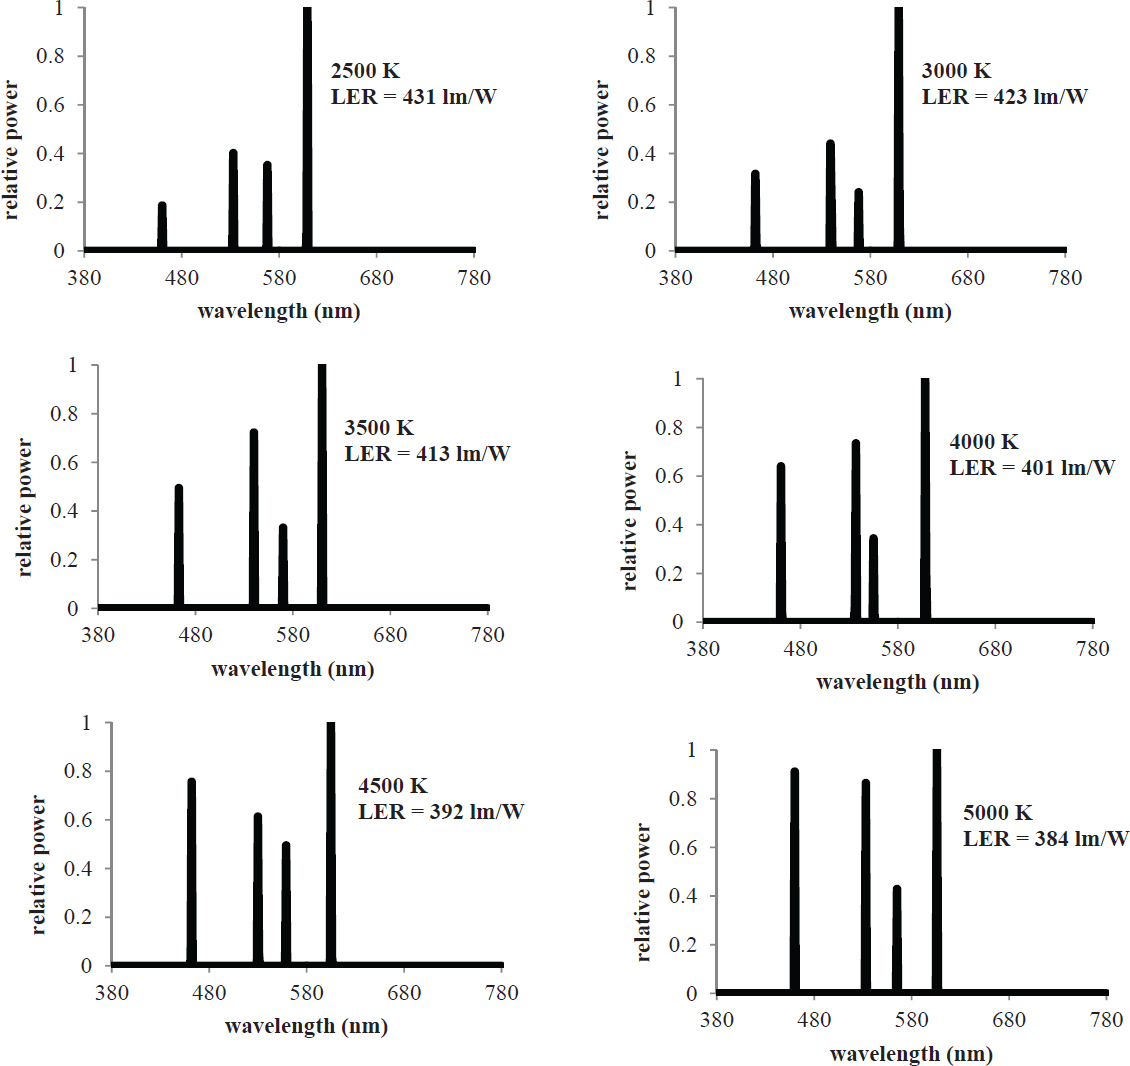
As explained in Appendix C, the spectral power distribution (SPD) of a light source not only determines chromaticity and color rendering, but also has a significant impact on luminous efficacy. Luminous efficacy of radiation (LER) accounts for the visual system’s differential sensitivity to different wavelengths of light and represents the theoretical maximum luminous efficacy, as illustrated in Figure C.9 in Appendix C. The sensitivity of the human visual system is maximal for light of 555 nm (green), which has an LER of 683 lm/W, and is lower for shorter (bluer) and longer (redder) wavelengths.4 The actual luminous efficacy of a lighting product is dependent on both the LER and the efficiency with which the technology converts electricity to light (radiant efficiency). The LER of a light source can be maximized for a given chromaticity and general color rendering index (Ra). For instance, the SPDs shown in Figure 1.1 were optimized for maximum LER for six different CCTs, with the following restrictions: Duv = 0.0, CRI Ra = 80, and each SPD consists of only four individual wavelengths of light (similar to the spectral power from four lasers). As can be seen, with these restrictions, SPDs with lower CCTs can achieve higher LERs than higher CCTs. Currently, cool white (high-CCT) LEDs have higher luminous efficacies than warm white (low-CCT) LEDs (DOE, 2015). This is simply a consequence of differences in radiant efficiency—it is not due to differences in the sensitivity of the human visual system.
FINDING: Warm white light is not inherently less efficacious than cool white light. The development of long-wavelength (red) emitters with high radiant efficiency would enable the production of high-efficacy warm white SSL products. DOE is currently prioritizing the development of high-efficiency, high-flux red LEDs and high-efficiency red down-converters (DOE, 2016).
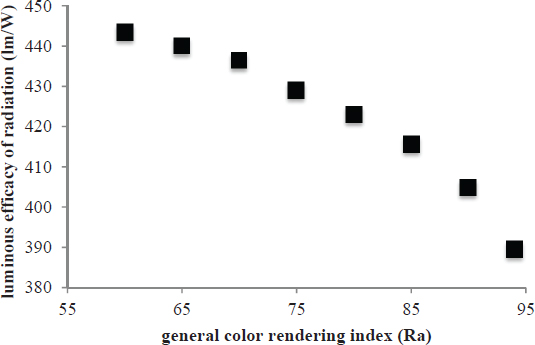
Color rendering and LER are generally inversely related. Figure 1.2 shows the maximum LER as a function of Ra for SPDs consisting of four wavelengths of spectral power, with CCT = 3,000 K and Duv = 0.000. The tension between two variables must be negotiated by lighting manufacturers and lighting designers throughout product development and specification.
Lighting Quality
Lighting designers aim to provide high-quality lighting in the built environment. Although the determinants of light quality are debatable, they are frequently thought to include
___________________
3 TM-30 is “a method for evaluating light source color rendition that takes an objective and statistical approach, quantifying the fidelity (closeness to a reference) and gamut (increase or decrease in chroma) of a light source. The method also generates a color vector graphic that indicates average hue and chroma shifts, and which helps with interpreting the values of Rf and Rg” (Illuminating Engineering Society of North America [IES], “IES Method for Evaluating Light Source Color Rendition,” http://www.ies.org/store/product/ies-method-for-evaluating-light-source-color-rendition-3368.cfm, accessed October 4, 2016).
4 This is illustrated by Figure C.9 in Appendix C.
color quality (chromaticity and color rendering), light intensity, and visual comfort (IES, 2009). Expectations for color quality and light intensity are highly context dependent. For instance, the optimal intensity of light for a movie theater is very different from that for a health clinic. In a movie theater, the lighting must be quite dim, so as to not interfere with the appearance of the projected image. In a health clinic, the intensity of the light must be higher to allow the practitioners to examine patients, maintain cleanliness, and perform clerical work. Similarly, judgments of chromaticity quality are often quite different when considering fine dining restaurants or corporate offices. Visual comfort is frequently defined as the absence of glare, flicker, and disruptive shadows (IES, 2009). Judgments of quality are also applied to lighting products and are frequently dependent on expectations. Consumers, such as homeowners or facilities managers, purchasing retrofit lamps typically expect the lamps to behave and perform identically to the replaced product. They
expect the same chromaticity, color rendering, luminous flux, spatial distribution of emitted light, and interoperability with control systems. They may also consider product consistency, purchase price, efficacy, and lifetime when judging product quality. Professional lighting designers also consider these factors but have specialized knowledge and understand the metrics that characterize the attributes of the products. Rather than expecting all lighting products to behave identically, professionals expect them to perform according to their specifications and judge quality accordingly.
Average or typical prices of lighting products can be expressed in a number of ways. When considering a type of technology or product category, the price per kilolumen ($/klm) can be useful. When using this metric for low luminous flux (<1,000 lm) product types, the value represents the price for more than one product. When applied to higher luminous flux (>1,000 lx) product types, this measure communicates the price of less than one product. Sometimes, the price per kilolumen-hour ($/klm-h) is used, which takes expected product lifetime into account.
ELECTRICITY CONSUMED BY LIGHTING IN THE UNITED STATES
The most recent estimates of electricity consumed by lighting in the United States were developed by the Energy Information Administration (EIA). Commercial lighting, including street and highway lighting, was estimated to consume 262 TWh in 2014, accounting for 19 percent of the electricity consumed by commercial and institutional buildings (EIA, 2015). Residential lighting consumed an estimated 150 TWh that same year, representing 14 percent of residential consumption of electricity (EIA, 2015). The combined electricity consumption of 412 TWh from both sectors in 2014 was a reduction of approximately 17 percent from their estimated consumption of 499 TWh in 2010 (EIA, 2011), the data considered in the 2013 NRC report. Data on the electricity consumed by lighting for manufacturing are less recent, with an estimated consumption of 52 TWh in 2010, a 17 percent reduction from the 63 TWh consumed in 2006.5
Projections predict a 57 percent reduction in the energy consumed by lighting in the United States in 2040, relative to consumption in 2013 (EIA, 2015). Increases in the utilization of electric light and efficiency rebound effects, whereby increases in energy efficiency are offset by reductions in energy conserving behaviors of users, are accounted for in this projection, but increases in the efficacy of lighting products used are expected to lead to a reduction of lighting energy consumption by an average of 3.1 percent per year in the residential sector and by an average of 0.6 percent in the commercial sector until 2040 (EIA, 2015).
OVERVIEW OF LED APPLICATION TYPES
By the end of the 2014, the number of LED products installed in the United States had quadrupled since 2012 (Navigant, 2014), the time at which the 2013 NRC study on SSL was being conducted. Although LEDs reached only 3 percent market penetration for general illumination applications in the United States in 2014 (Navigant, 2014), this technology was already dominating some niche applications, including traffic signaling, exit signage, flashlights, and refrigerator case lighting (Navigant, 2014). Small directional lamps, largely consisting of MR16 replacements, achieved the greatest general lighting market penetration in 2014, representing 21.8 percent of the installed base (10.3 million units) (Navigant, 2014). Medium screw-base lamps, which serve as direct replacements for many standard incandescent lamps, had the largest number of installed units (77.7 million) at that time. However, because the number of medium screw sockets is so large, this only represents 2.4 percent market penetration (Navigant, 2014). Market penetration of other directional lighting products, including downlight luminaires and larger directional lamps, was 5.8 percent (67 million units). Other interior applications include decorative lamps (1.5 percent penetration; 67 million units), linear luminaires (including those using replacement lamps: 1.3 percent penetration; 12.5 million units), and low/high bay luminaires (2.2 percent penetration; 3.1 million units). Overall, LEDs penetrated 2.8 percent of the indoor illumination market in 2014, with 188 million units installed. At that time, LEDs were installed in 10.1 percent of exterior illumination applications (17.9 million products). LED products have been
___________________
5 EIA, “2010 Manufacturing Energy Consumption Survey Data,” https://www.eia.gov/consumption/manufacturing/data/2010/#r5, accessed August 8, 2016.
used in outdoor lighting applications longer than indoor applications, because of the promise of a long life with subsequent reduced maintenance. In outdoor applications, LEDs achieved greatest market penetration with area/roadway luminaires (12.7 percent market penetration; 5.7 million installed units) and lamps and luminaires to illuminate the exterior of buildings (11.5 percent market penetration; 7.6 million installed units). LEDs were used less frequently to illuminate parking lots (9.7 percent market penetration; 2.8 million units) and parking garages (5.0 percent market penetration; 1.8 million units). LEDs were installed in 3.3 percent (8.3 million units) of other illumination applications, such as wall washing, cove lighting, stadium lighting, and tunnel lighting (Navigant, 2014).
Early reports suggest that market penetration increased substantially in 2015, accounting for 6.4 percent (473 million units) of the general illumination installed base (DOE, 2016). Small directional lamps continued to have the greatest proportion of market penetration at 32.1 percent (16.3 million units), and medium screw-base lamps had the greatest number of installed units at 202 million (6.0 percent market penetration). Market penetration for other interior applications was 11 percent (127 million units) for other directional lights, 3.0 percent (36.9 million products) for decorative lamps, 3.2 percent (31.5 million units) for linear fixtures, and 3.7 percent (5.4 million) for low/high bay luminaires, resulting in a total LED market penetration of 6.1 percent (419 million units) for interior applications. For exterior applications, the greatest increase in market penetration was for building exterior lights (21.2 percent; 14.7 million installed units) in 2015. Market penetration for other exterior applications was 20 percent (9.1 million units) for area and roadway luminaires, 13.0 percent (5.0 million products) for parking garage lights, and 13.9 percent (4.0 million) for parking lot lights, resulting in a total LED market penetration of 17.9 percent (32.7 million units) for exterior applications. LEDs were installed in 8.0 percent (21.4 million units) of other lighting applications (DOE, 2016).
FINDING: LED-based lighting products account for a rather small portion (6.4 percent in 2015) of installed base of general illumination products in the United States. However, market penetration is accelerating and more than doubled from 2014 to 2015.
The luminous efficacy of LED products is variable both within and between each product category. Interestingly, MR16 lamps, which achieved the greatest market penetration in 2014, had a lower average efficacy, 58 lm/W (highest efficacy of 95 lm/W), than other LED product types listed in the Lighting Facts database.6 Although the consumer decision-making process driving this adoption has not been studied, one potential reason for strong uptake of this lamp type is the relatively low luminous efficacy of alternate technologies (EIA, 2016). The characteristics of MR16 lamps are very difficult to achieve with fluorescent solutions, so halogen technology is still widely used. Another possible reason for their strong adoption is the relative ease with which LEDs can create small, directional lights (Jordan et al., 1996), such as MR16 lamps. Other directional lamps (average efficacy of 63 lm/W; highest efficacy of 111 lm/W) and luminaires (average efficacy of 63 lm/W; highest efficacy of 124 lm/W) had slightly higher typical efficacies, as did decorative lamps (average efficacy of 66 lm/W; highest efficacy of 90 lm/W) and medium screw-base lamps (average efficacy of 72 lm/W; highest efficacy of 107 lm/W). Linear replacement lamps (average efficacy of 108 lm/W; highest efficacy of 148 lm/W), linear luminaires (average efficacy of 93 lm/W; highest efficacy of 139 lm/W), and low/high bay luminaires (average efficacy of 97 lm/W; highest efficacy of 141 lm/W) were more efficacious, possibly because the incumbent technologies (linear fluorescent lamps and high-intensity discharge lamps) for these applications have quite high luminous efficacies. For outdoor applications, the least efficacious products were used to illuminate the exterior of buildings (average efficacy of 77 lm/W; highest efficacy of 132 lm/W). Replacement lamps for parking garages had rather high luminous efficacies (average efficacy of 108 lm/W; highest efficacy of 158 lm/W). Area/roadway lights (average efficacy of 87 lm/W; highest efficacy of 137 lm/W), parking lot luminaires (average efficacy of 87 lm/W; highest efficacy of 137 lm/W), and parking garage luminaires (average efficacy of 86 lm/W; highest efficacy of 150 lm/W) performed similarly to each other.
Although the purchase price of LED products remains more expensive than alternative technologies, the prices of LED products and components have decreased significantly since the 2013 NRC report (DOE, 2016). The price of LED packages was as low as $1/klm at the end of 2014, while OLED panels were priced at $200/klm. The typical purchase price of a warm white, dimmable medium screw-base replacement LED lamp was $10/klm in 2015, on a par with $10/klm for a dimmable CFL and compared to $2.50/klm for a halogen lamp. The purchase price of a warm white 2' × 4' linear luminaire was $29/klm, compared with $4/klm for a linear fluorescent luminaire. LED roadway luminaires cost $58/klm at the end of 2014, and competing technologies were priced at $1.2/klm to $2.1/klm. Also in 2014, LED MR16 replacements were priced at $40/klm at that time, whereas halogen MR16 lamps were $11/klm (DOE, 2015). Prices of LED products continue to decrease rapidly. Although commercially available OLED luminaires are rare, a typical price for 2015 was estimated to be $870/klm, based
___________________
6 For further information, see the LED Lighting Facts website at http://www.lightingfacts.com/Products.
on one luminaire available to consumers in the United States (DOE, 2016).7
LED products are replacing incandescent lamps, presumably, at least in part, because the Energy Independence and Security Act of 2007 (P.L.110-14) reduced the availability of that technology beginning in 2012. However, LEDs also appear to be replacing other lighting technologies. Despite the phasing out of the traditional incandescent lamps, shipments of compact fluorescent lamps (CFLs) have decreased (NEMA, 2015). Market penetration of CFLs decreased from 2012 to 2014 for decorative lamps and directional lighting products (EIA, 2016). Furthermore, some of the applications in which LEDs are penetrating do not typically use incandescent technology. For instance, roadway lighting had traditionally been achieved with high-intensity discharge technologies.
Manufacturers of LED products have adopted different strategies in the integration of LED packages in lamps and luminaires. While many manufacturers directly install LED packages in their lighting products, some are using LED modules or LED light engines.8 In 2014, 33 percent of LED luminaires and 12 percent of LED lamps utilized LED modules, while 9 percent of LED luminaires and 1 percent of LED lamps used LED light engines.9
The 2013 NRC report warned of the potential for unintended consequences, including the possibility that increased application of electric lighting solutions would negate the increased efficacy of SSL, leading to an increase in the energy consumed by lighting (NRC, 2013). While the market penetration of LEDs is still too small to determine whether this situation will arise, the decrease in total electricity consumed by lighting in the United States between 2010 and 2014 (EIA, 2011, 2015), discussed in the section, “Electricity Consumed by Lighting in the United States,” suggests that the adoption of more energy-efficient lighting technologies and the benefits of reduced electricity it confers is not being cancelled out by the rebound effect that can occur when lower electricity prices lead to increased consumption. However, as LEDs have some desirable characteristics that other high-efficacy technologies do not have, such as very small size, excellent performance in cold temperatures, and robustness, this issue has not yet been settled. The 2013 report also noted that many commercialized LED products had lower luminous flux than the light sources they were designed to replace. This situation has improved in the past few years, but the luminous flux of replacement and retrofit products remains variable. A 2013 analysis of medium screw-base lamps suggests that Energy Star minimum luminous flux requirements for manufacturers wishing to claim equivalency with incandescent wattage resulted in widespread compliance (DOE, 2013a). A 2016 report found that only approximately 20 percent of LED MR lamps had luminous flux values comparable their 50 W halogen counterparts (DOE, 2013b). These findings suggest that some types of LED products are not performing equivalently to the technologies they are replacing, but that incentive programs offered to consumers to reduce the cost of buying the product can be leveraged to drive consistency.
REFERENCES
CIE (Commission Internationale de l’Éclairage). 1995. Method of Measuring and Specifying Colour Rendering Properties of Light Sources. CIE 13.3. Vienna, Austria.
Davis, W., and Y. Ohno. 2010. Color quality scale. Optical Engineering 49(3):033602.
DOE (U.S. Department of Energy). 2013a. “Snapshot: Light Bulbs.” http://apps1.eere.energy.gov/buildings/publications/pdfs/ssl/snapshot2013_a-lamp.pdf.
DOE. 2013b. “Snapshot: MR16 Lamps.” http://energy.gov/sites/prod/files/2016/01/f29/snapshot2016_mr16_0.pdf.
DOE. 2015. Solid-State Lighting R&D Plan. Washington, D.C. May.
DOE. 2016. Solid-State Lighting R&D Plan. Washington, D.C. June.
EIA (Energy Information Administration). 2011. Annual Energy Review, 2010. Washington, D.C.
EIA. 2015. Annual Energy Review, 2014. Washington, D.C.
EIA. 2016. Annual Energy Outlook 2016. Washington, D.C.
Holzman, H.N. 1999. Branch circuits and feeders. Chapter 12 in Modern Commercial Wiring. Tinley Park, Ill.: Goodheart-Willcox.
IES (Illuminating Engineering Society of North America). 2009. Light + Design: A Guide to Designing Quality Lighting for People and Buildings. IES DG18-08. New York.
IES. 2015. IES Method for Evaluating Light Source Color Rendition. TM-30-15. New York.
Jordan, R.H., A. Dodabalapur, and R.E. Slusher. 1996. Efficiency enhancement of microcavity organic light emitting diodes. Applied Physics Letters 69(14):1997-1999.
Navigant Consulting, Inc. 2014. Energy Savings Forecast of Solid-State Lighting in General Illumination Applications. Prepared by Navigant Consulting, Inc., for the U.S. Department of Energy, Office of Energy Efficiency and Renewable Energy, Building Technologies Program. August.
NEMA (National Electrical Manufacturers Association). 2015. Lamp Indices: Compact Fluorescent Lamp Shipments Continue to Lag. January 20. http://www.nema.org/news/Pages/Compact-Fluorescent-LampShipments-Continue-to-Lag.aspx.
NRC (National Research Council). 2013. Assessment of Advanced Solid-State Lighting. Washington, D.C.: The National Academies Press.
Ohno, Y. 2014. Practical use and calculation of CCT and Duv. Leukos 10(1):47-55.
PNNL (Pacific Northwest National Laboratory). Performance of T12 and T8 Fluorescent Lamps and Troffers and LED Linear Replacement Lamps. Prepared for the U.S. Department of Energy by PNNL.
Rea, M.S., and J.P. Freyssinier-Nova. 2008. Color rendering: A tale of two metrics. Color Research and Application 33(3):192-202.
__________________
7 Based on Acuity Brands Luminaires’ Chalina 5-Panel Brushed Nickel OLED Pendant available at Home Depot.
8 LED modules cannot be directly connected to branch circuits, whereas LED light engines can (Holzman, 1999).
9 Stephanie Pruitt, Strategies Unlimited, “Lighting and LEDs Market Overview and Forecast,” presentation to the committee on November 11, 2015.


