
2
Setting the Stage: Keynote Session
Steve Hamburg, co-chair of the workshop planning committee, opened the keynote session by stressing that the workshop is about a conversation. He said the structure of the agenda was designed deliberately to provide opportunity for dialogue and emphasized several kinds of questions: What is the nature of the problem? What is known? What is not known? How can knowledge gaps be filled and what are the opportunities to benefit society?
Kris Nygaard, the workshop planning committee’s other co-chair, emphasized the importance of the diverse group of stakeholders in the room sharing their range of opinions and knowledge on the subject. He highlighted the major themes of the workshop including regional perspectives, technologies for managing water, characteristics of produced water, and discussions on research and technology gaps and opportunities.
The three keynote presentations at the start of the workshop provided background on produced water and framed the major topics. The panel session was moderated by George King (Apache Corporation).
THE ENERGY-WATER NEXUS
Diana Bauer, U.S. Department of Energy
Bauer introduced the audience to work being conducted on the energy-water nexus at the U.S. Department of Energy (DOE) and the relationship of DOE’s activities to flowback and produced water as part of its focus on technology research, modeling analysis, and data systems. She referred to the 2014 DOE report The Water-Energy Nexus: Challenges and Opportunities (DOE, 2014) when discussing the energy of water usage through the U.S. economy (see Figure 2.1). Focusing first on overall withdrawals of water from surface and groundwater sources and their relationship to energy production and infrastructure, she indicated that close to 50 percent of water withdrawals nationally from fresh and saline sources are for thermoelectric cooling. Approximately one-third of annual water withdrawals are used for agriculture and approximately 10 to 15 percent of withdrawals are used directly for a combination of public water supplies and industry applications.
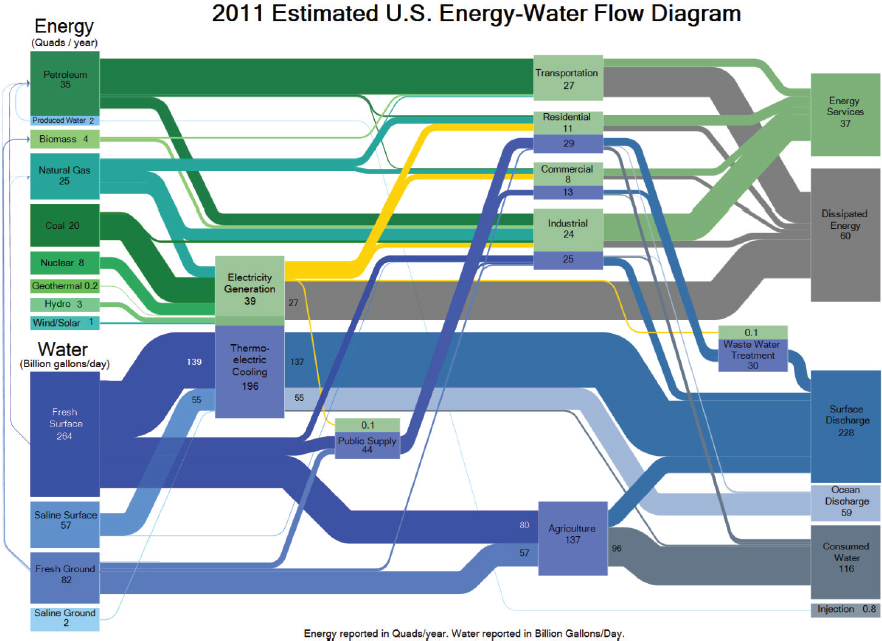
SOURCE: DOE, 2014.
Smaller percentages of withdrawals of groundwater and surface water are associated with oil and natural gas production (see Figure 2.1).
Bauer noted that DOE is in the process of developing a set of diagrams similar to Figure 2.1 for the state level and indicated that the quantities of produced water from oil and gas production are not large relative to water volumes withdrawn and used for other purposes. Some of the strategy pillars from the DOE 2014 report apply directly to the use of produced waters, Bauer noted. One example included the strategy of increasing the safe and productive use of nontraditional water sources; in this way, produced water could be considered a nontraditional water source in some regions.
In their congressional budget justification to Congress earlier this year, Bauer said that DOE had identified a total of $96 million for work on the energy-water nexus, with a fair portion of that funding oriented toward technology and investments on energy-optimized treatment, management, and beneficial use of nontraditional waters. Desalination is a strong focus in the proposed DOE budget for fiscal year 2017. In water-stressed regions, she said, delivering water becomes more energy intensive because of the reliance on more marginal sources of water. In some regions of the
country struggling with water availability, produced water may be another potential water source following treatment.
Bauer noted a low-energy/low-carbon/low-cost desalination research and development hub as another element in the proposed DOE budget for fiscal year 2017. This hub would be a multilevel, multitiered effort with a scientific foundation in technologies and test beds in the area of desalination. DOE is interested in both treating and desalinating water from the ocean or from brackish aquifers or brackish groundwater. Some of these desalination technologies may also be used to treat produced water, she said. These technologies could contribute to identifying and pursuing opportunities for using treated produced water to solve regional problems with respect to water availability.
Bauer referred to an example from the thermoelectric industry to illustrate ways new technology could help to diversify the water sources used for thermoelectric cooling. Thermoelectric generation is a substantial user of water and at present, she said, about 75 percent of thermoelectric cooling systems use fresh surface water, with lesser amounts deriving from saline, brackish, and reclaimed water sources (see Figure 2.2). To reduce dependence on surface water resources, and diversify both the sources of water and the water type, potential exists to consider using produced water, after appropriate treatment with various technologies, for thermoelectric cooling.
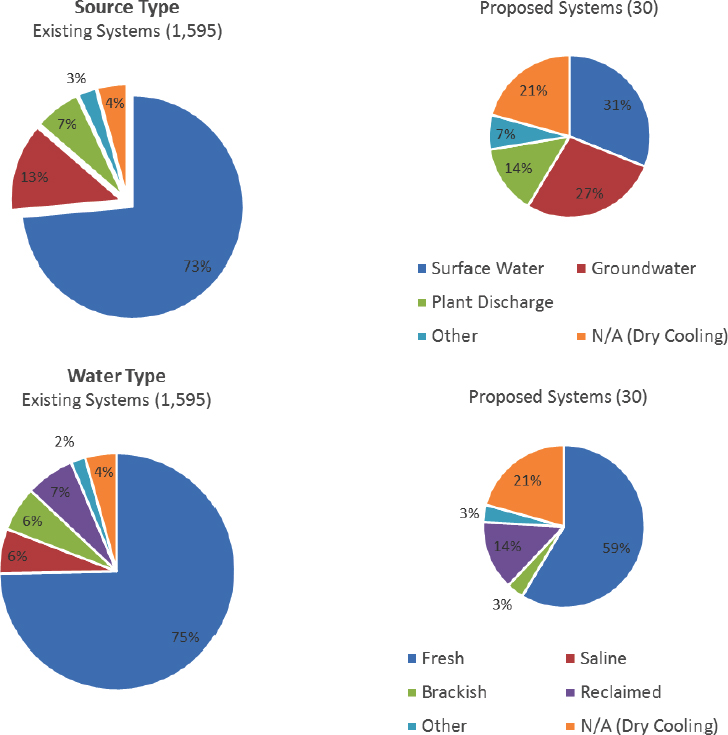
NOTES: N/A = not applicable. These systems will not require water because they are dry cooling systems.
SOURCE: DOE, 2014.
Due to the importance of individual states in discussions about the energy-water nexus, Bauer also indicated that DOE is developing a database of state water policies which affect energy. Thus far, DOE has created such a database for electricity and plans to develop a similar one for oil and gas. In addition, DOE is working with organizations such as the National Association of Regulatory Utility Commissioners, the National Association of State Energy Officials, the National Council of State Legislators, and the National Governors Association to frame an integrated policy analysis of federal- and state-level policies and approaches to energy and water.
Bauer closed by mentioning that the energy-water nexus is a global issue. Lessons can be learned from other countries such as China, countries in the Middle East, and Australia on topics such as desalination, she said. One example is the U.S.-China Clean Energy Research Center where the University of California, Berkeley, has led the U.S. contribution on treatment and management of nontraditional water in collaboration with its Chinese counterpart, the Research Institute for Petroleum Exploration and Development.
FLOWBACK AND PRODUCED WATERS
John Veil, Veil Environmental, LLC
Veil opened his presentation by mentioning that produced water is quite variable over place and time. The water contains many constituents at different concentrations. He suggested grouping the main constituents in produced water into four broad categories:
- Salt content, including salinity and total dissolved solids (TDS);
- Oil and grease, the presence and composition of which are determined by analytical measurements for different types of organic chemicals;
- Toxicity, which includes chemical constituents that may have leached into the formation water from the surrounding rock and the hydrocarbons with which the formation water has been in contact for millennia; and
- Naturally occurring radioactive material (NORM), which may exist in some rock formations in the form of radioactive elements (e.g., uranium, radium, and radon), and which may transfer into the formation water in small amounts.
Until last year, Veil said, the most complete publicly available reference on produced water volumes and management was Clark and Veil (2009). He said that those authors examined the 2007 calendar year and estimated about 21 billion barrels of water were produced from all of the U.S. oil and gas wells. Last year, a new report (Veil, 2015) was prepared for the Groundwater Protection Council (GWPC) to update the 2009 report. In this new report, the 2012 calendar year was examined for data on produced water volume and management. Veil provided some of the findings from this recent report in his presentation:
Between 2007 and 2012, the amount of crude oil produced in the United States increased by 29 percent and the amount of natural gas produced increased by 22 percent, he said. Although these numbers would suggest that produced water volumes should also have increased by a similar amount during the same period, they did not and rather increased by a smaller amount. He hypothesized that the reasons may lie in the fact that in 2007, the production of oil and gas was primarily from conventional (vertically drilled) wells. Conventional wells initially generate small amounts of produced water that tends to increase in volume over time. Between 2007 and 2012, he said, a number of conventional wells were taken out service and were replaced by newer unconventional wells that generate lower volumes of produced water compared to conventional wells when production begins, and usually generate very low volumes later in the lifetime of the well. Thus, he suggested, a change
TABLE 2.1 Ranked Top 10 States in 2012 Water Production
| Ranking | State | 2012 Water (bbl/yr) | % of All U.S. Produced Water |
|---|---|---|---|
| 1 | Texas | 7,435,659,000 | 35 |
| 2 | California | 3,074,585,000 | 15 |
| 3 | Oklahoma | 2,325,153,000 | 11 |
| 4 | Wyoming | 2,178,065,000 | 10 |
| 5 | Kansas | 1,061,019,000 | 5 |
| 6 | Louisiana | 927,635,000 | 4 |
| 7 | New Mexico | 769,153,000 | 4 |
| 8 | Alaska | 624,762,000 | 3 |
| 9 | Federal Offshore | 358,389,000 | 2 |
| 10 | Colorado | 320,191,000 | 2 |
NOTE: bbl = billion barrels.
SOURCE: Veil, slide 9.
in production strategies may have contributed to lower volumes of produced water relative to the overall increase in volumes of oil and gas produced over this period.
Veil showed a table indicating the 10 states that had the highest produced water volumes for 2012 (see Table 2.1). Texas generated more than one-third of all the U.S. produced water. California, Oklahoma, and Wyoming each recorded 10 percent or more of all the U.S. produced water in 2012. Produced water volumes from federal offshore leases in the Gulf of Mexico, also included in Table 2.1, were not large relative to most other states and represented just 2 percent of total U.S. produced water volumes.
Veil emphasized the importance of the ratio of water to oil production as a way to compare water production volumes from different states.1 He noted that when he collected these data from states, not every state had data distinguishing how much water derived from oil wells and how much water was from gas wells. However, 21 states could share useful data and, from this information, he calculated a weighted average and found 9.2 barrels of water were produced for every barrel of oil in 2012. Oklahoma and Texas were not included in the list and he suggested that volumes of produced water relative to oil in these states may be much larger than in the other states. Veil suggested that if he had access to all of the data, a ratio of produced water to oil might be closer to 10 to 1.
The remainder of Veil’s presentation covered four topics: produced water management practice, produced water treatment, reusing produced water, and barriers and possible solutions/opportunities to increasing use of produced water.
Produced Water Management Practice
Work conducted to develop the Veil (2015) report included surveys of each of the states with oil and gas production for information on how produced water was managed. Veil said that he found that 45 percent of produced water was injected back into the formation for enhanced recovery
___________________
1 Water-to-oil ratios can be used to evaluate the relative production age of oil within the production lifetime. For example, the volume of water produced from oil wells does not remain constant with time. The water-to-oil ratio can increase with well age (Clark and Veil, 2009).
operations; about 39 percent was injected into disposal wells; and 7 percent was addressed through offsite commercial disposal, mostly injected via disposal wells. Thus, about 91 percent of all produced water was injected back into the ground, he indicated. The remaining management practices included surface discharge at 5.5 percent and evaporation at 3.5 percent. Based on the study, Veil estimated that only about six-tenths of 1 percent of produced water was used for further applications. Of the states that collected data on volumes of produced waters that were used for subsequent applications (most states do not collect this type of data), he noted the following in:
- Arkansas, 2 million barrels (volume in units) of produced water per year were used to make new hydraulic fracturing fluids.
- California, 46 million barrels per year of produced water were used but the state did not report explicitly how it was being used. Veil further elaborated that in places like in the San Ardo field in California, where some of the produced water is treated to very high standards, the treated produced water may be used for irrigation or for cooling tower boiler feed.
- Colorado, 47 million barrels of produced water were used, mostly for hydraulic fracturing fluids.
- Ohio, 750,000 barrels of produced water were used for new hydraulic fracturing fluids or used for ice control on roads. This latter type of use is not done in every state, but a few states do allow spreading of produced water on road surfaces for ice control during winter periods, Veil noted.
- Pennsylvania, 29 million barrels of produced water were used for new hydraulic fracturing and other drilling fluids.
Produced Water Treatment
Veil briefly introduced treatment aspects of produced water, stating that, even if water is injected for disposal, treatment may be necessary. The goal, he said, is to ensure the water being injected to the subsurface is compatible with the rock formation and water already present to avoid chemical reactions that cause precipitates to clog the rock porosity. Characteristics of concern include solids, dissolved oil, microbial activity, and chemical compounds that create corrosion. Veil aggregated treatment technologies into three groups:
- Metal and organic removal. The traditional way to remove these constituents is to raise pH, add a flocculent, and use the clarification process to allow the floc and suspended material to settle out. He indicated that electrocoagulation can also be used as can certain membrane processes with varying filtration pore sizes.
- Salt removal. Reverse osmosis is commonly used to remove salts, but above about 50,000 parts per million TDS reverse osmosis loses effectiveness and thermal processes are a better option. Forward osmosis and membrane distillation are methods that are beginning to enter the marketplace, Veil said.
- Oil, grease, and other organic chemical removal. The most common treatment for these constituents is simple gravity settling through separators or filtration.
Reusing Produced Water
Veil suggested the technique for reusing water that is not receiving enough attention is the 45 percent of produced water that is being injected back into geologic formations to help produce more oil. That water serves a very valuable purpose, he said, because without it, the incremental oil would not be produced. If produced water cannot be used for this purpose then surface and
groundwater supplies would be used instead. In many states, flowback and produced waters are being used to make new hydraulic fracturing fluids and other drilling fluids. He showed an example from Pennsylvania in 2012 with volume and percent data illustrating the different categories of flowback and produced water management practices (see Table 2.2).
The centralized approach for use of produced water in Pennsylvania is to transport the water off site, treat it, and then transport it back to the well sites. About 98 percent of all flowback water and about 78 percent of the produced water in Pennsylvania were being used in the oil field in 2012, Veil said. He stressed that the driving factor for this high degree of produced water use for other applications was economic more so than regulatory. However, similar economic conditions do not necessarily apply in other fields across the country. Veil then described additional potential uses of produced waters.
Industrial Use
A variety of ways exist to use produced water for industry. Veil indicated that one example is the use of produced water to wash the trucks leaving production sites; another is the use of produced water as cooling water for industrial purposes, although he said this is done infrequently.
Roadway Use
Some states allow spraying of produced water onto roads to keep dust down on unpaved roads or for ice and snow control during winter.
Agricultural Use
In most cases, produced water is very salty. In some circumstances, produced water may have low or moderate salinity and, when this occurs, salt can be removed economically and the waters then used for irrigating agricultural crops or watering livestock or wildlife.
TABLE 2.2 Flowback and Produced Water Management Practices in the Pennsylvania Portion of the Marcellus Shale During 2012
| Practice | Flowback Water Volume (bbl/year) | Produced Water Volume (bbl/year) | Total Water Volume (bbl/year) | Percent of Total Water Volume Managed by That Practice |
|---|---|---|---|---|
| Centralized treatment for reuse | 1,398,438 | 2,131,496 | 3,529,934 | 13 |
| Injection-disposal | 70,679 | 3,493,527 | 3,564,206 | 13 |
| Residual waste processing and reuse | 30,612 | 105,358 | 135,970 | 0.5 |
| Reuse other than road spreading | 8,149,339 | 11,418,150 | 19,567,489 | 72 |
| Storage waiting for disposal or reuse | 63,981 | 256,948 | 320,929 | 1.2 |
| Landfill | 6,366 | 278 | 6,644 | <0.1 |
| Discharge | 105 | 105 | 210 | <0.1 |
| Road spreading | 425 | 425 | 850 | <0.1 |
| Total | 9,719,945 | 17,406,287 | 27,126,232 | 100 |
NOTE: bbl = billion barrels.
SOURCE: Veil, slide 20. Note that Veil employed the term “reuse” when presenting this table.
Mobile Technologies
Veil outlined research and applications being undertaken by a researcher at Texas A&M University who has investigated different types of mobile treatment technology that could be brought to an oil well to clean produced water onsite. Veil was not aware of anyone in Texas actually using that treated water for drinking water supplies as yet, but he suggested that the technology exists to do so.
Secondary Use
Veil has discussed this type of use for several years. He said that produced water at the land surface contains dissolved minerals and thus may have heat associated with it. Therefore, the water may have a secondary value, for example, to generate geothermal electricity from hot produced water. In other situations, he suggested, produced water may have very high concentrations of dissolved minerals with economic value if they can be extracted.
Why Produced Water Is Not Used More: Barriers and Possible Solutions/Opportunities
One main barrier to increasing the use of produced water, Veil said, is an economic one. Removing salt from produced water is currently expensive, although the technology exists to do so and, in many applications, salt has to be removed from produced water before the water can be used. In addition, water is heavy and moving large amounts over any distance incurs energy and transport costs, he said. Another barrier is a social one because of the concerns many people may have about drinking water that began as produced water, even after treatment. Veil said he did not have a simple way to address the social barrier other than perhaps creating case study examples and making that information broadly available. To share the results of case study examples, intermediate parties, whether academics, national laboratories, or others, would be necessary to carry out the work. Finally, Veil discussed policy barriers, which he said he has highlighted for about a decade. Policy barriers include water rights and liability. Every state has the ability to set its own water rights laws and regulations, and as long as produced water is considered a waste product, he said, the water rights holder may not be concerned. However, if produced water is treated with a plan to sell to an end user, the water attains an economic value which may change the approach to produced water by the water rights holder and other parties.
In the past, Veil said he has asked questions of the major oil and gas companies about the liability of using produced water for a greater array of secondary purposes. His question is “If you could find a way to treat produced water at a very low cost, would your attorneys allow you to sell it or distribute it to end users?” He indicated that the companies generally respond that they would not be able to sell or distribute the treated water because of legal concerns. Veil is aware that some companies are examining this kind of approach, but he suggested that those who try it may often be the small- or medium-sized companies.
In terms of opportunities and solutions, Veil emphasized access to databases and clearinghouses for information, which could provide opportunities to match generators of produced water with potential water users. He knows of one company that has started a business following this approach. Veil also indicated that he would like to see movement toward involving third parties that are not the producers or end users to take the water, make sure it is clean, and distribute it to the end water user. In this scenario, the liability for the oil and gas companies might be removed.
Veil concluded by stating that a lot of produced water is generated on a daily basis, with a million oil and gas wells in the country producing about 2.3 billion gallons of water per day. Currently, the majority of produced water is injected back into the ground, while a very small percentage is being used for subsequent applications. However, he believes use of produced water is increasing.
BENEFICIAL USE OF PRODUCED WATER FROM THE OIL AND GAS INDUSTRY: APPROACHES TO MANAGE, TREAT, AND TRANSPORT FLOWBACK AND PRODUCED WATER
Jill Cooper, Anadarko Petroleum Corporation
Cooper opened her presentation by asking a question: Why are oil and gas companies present at a meeting discussing potential beneficial uses of produced water? She suggested that factors such as risk, cost, and liability have made the practice of managing produced water by injection into deep disposal wells the most common approach. However, she said that about 3 or 4 years ago the industry engaged in conversations about other ways to manage produced water because Secretary Teague (the Oklahoma Secretary of Energy and Environment) and others were asking what might be done to keep water at the surface for other uses. She noted different kinds of water rights implications for different types of water associated with oil and gas production. The oil and gas producer owns flowback water, she said. However, Cooper mentioned that geologic formation water and produced water are a little different.
If produced water can be a usable byproduct, a cost and benefit analysis has to be undertaken to understand how much energy it takes to treat the water and make it useful for a given purpose. She noted that over-treating the water is not efficient because it can waste energy and other resources. A critical aspect of evaluating potential beneficial uses, she said, is to understand the eventual purpose of the treated water; therefore, analyzing the water and treating it for the appropriate purpose is important. For example, use of produced water for agriculture is different than use of produced water for drinking water. Each would require different levels of treatment.
She described the collaborative work of a group of 18 companies to produce a drilling and completion production water life cycle (see Figure 2.3). Details of the cycle include production, recovery of water, storage, disposal, treatment, recycling, and use in predrill construction. She said that when water leaves industrial operations and is released into the environment as a discharge, regulators and stakeholders are concerned. Regulators work very hard with industry, she said, to identify the appropriate permit limits for water that leaves the operation cycle. Cooper then asked a question of the audience: In terms of the water life cycle, where are the key risks, costs, and liabilities located?
Cooper noted that the oil and gas industry is nimble, having learned how to use produced water, brackish water, and nonfreshwater in operations. For example, in Colorado, the oil and gas industry uses less than 0.08 percent of the total water used in the state (see Figure 2.4). This figure may be even less now because not as much hydraulic fracturing is presently occurring in the state, she said. Although this percentage is not high, she indicated that representing the number on a county-by-county basis could highlight regional differences in water use. In Pennsylvania, for example, the oil and gas industry uses 0.2 percent of all water used in the state, and in the Environmental Protection Agency’s draft hydraulic fracturing report (EPA, 2015), water use is less than 1 percent of total water use across the United States on an annual basis, she said. Despite these low relative volumes, industry still has a role to play in reducing the overall use of water, Cooper emphasized.
In her discussion of the movement and management of water, Cooper said that as the price of oil and gas has decreased in recent years, industry has become more cost effective in drilling and fracturing wells. In such a situation, the relative cost of water management increases. Thus, motivation exists to reduce the costs associated with produced water and water management, in general. She noted that produced water is generated from most active wells, although every oil or gas play has a different water profile and a different quantity of water produced depending on the life of the well. The variability among plays is challenging for water recycling efforts, as it really depends on the specific site, she said.
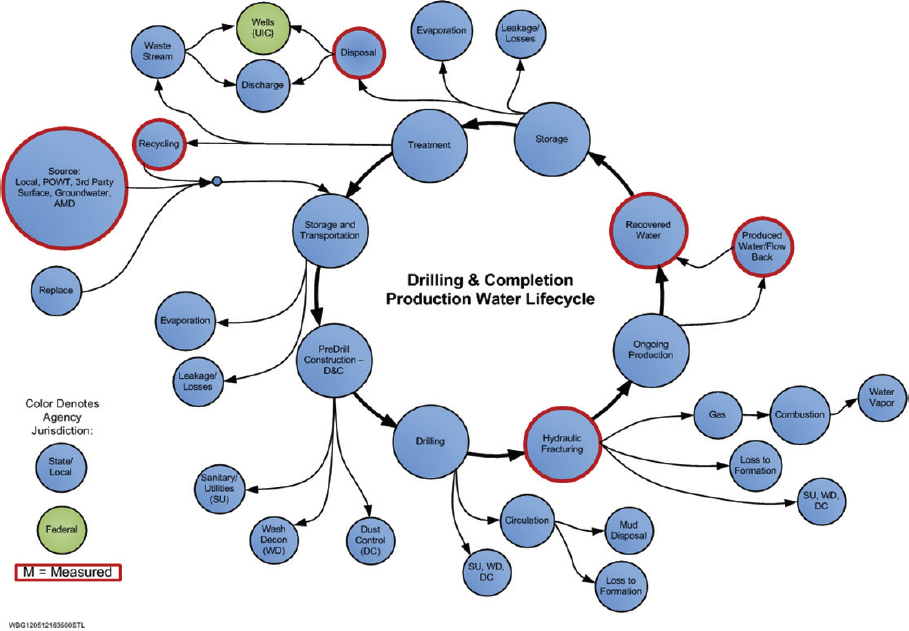
NOTE: AMD = abandoned mine drainage; D&C = drilling and completion; DC = dust control; POWT = publicly owned wastewater treatment plant; SU = sanitary utility; UIC = underground injection control; WD = wash decontamination.
SOURCE: Cooper, slide 3.
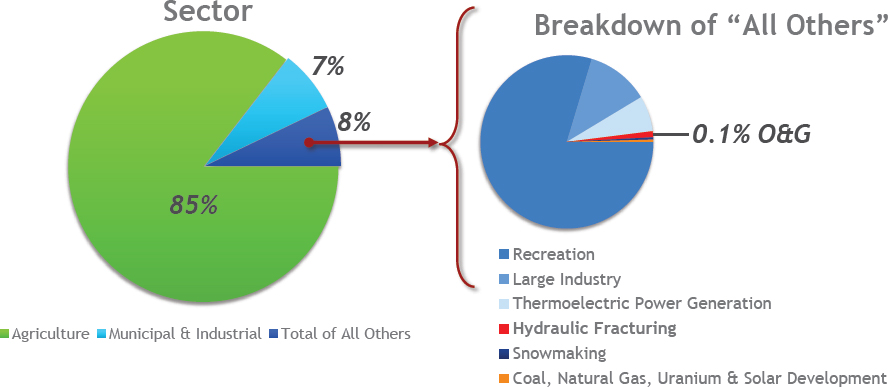
SOURCE: Cooper, slide 4.
Cooper highlighted that the oil and gas industry is one of the few industries that can bring water to the surface as a byproduct of operations. The industry is not drilling groundwater wells for water; rather, a well is drilled for natural gas and oil, and water that had been trapped underground together with the oil and gas is brought to the surface in the process. This could be viewed as a net gain of water at the surface and thus as a potential benefit, she said. Because water profiles differ from one oil or gas play to another, water can be produced in large amounts initially and then can drop off with time. Thus, it may not be economical for a municipality to invest money in a water system if the source has a short time frame and is one of the reasons why agriculture is seen as a potential partner with the oil and gas industry in terms of potential end users for treated, produced water. The agricultural sector has somewhat greater flexibility than a municipality and agriculture often operates near the locations of oil and gas operations.
Cooper then discussed ways to identify and maximize opportunities for potential uses of produced water. The Energy Water Initiative—a collaboration within the oil and natural gas industry to study, describe, and improve produced water use and management in unconventional oil and natural gas exploration and production—has worked together for over 4 years. She said the group meets four times per year to discuss technical issues and recently released a report on produced water management case studies (EWI, 2015). Twelve of the 18 companies involved in the collaborative effort undertook site visits to see one another’s water treatment systems. The experience was valuable and an outcome of the site visits was an insight into industry trends that suggested the industry is developing new innovations for water treatment.
Cooper then referred to an effort by Anadarko, also a member of the collaborative project, to replicate the collaborative group’s effort. One outcome was the development of a five-part strategy for potential produced water use:
- Assurance,
- Prudent use,
- Technology development,
- Communication, and
- Advocacy.
Information on what Anadarko is learning from their effort is shared on a regular basis and is included in their annual report, she noted.2 An important component of Anadarko efforts is community and stakeholder engagement, including, for example, a strong ambassador program in Colorado. Cooper mentioned that they have trained more than 1,200 people to communicate with the public and work with the company’s stakeholders and answer questions about produced water and other topics.
Cooper closed by highlighting a case study that described collaborative efforts on a freshwater transport system that Anadarko built in Colorado. Anadarko worked closely with agricultural partners because Anadarko was operating on agricultural lands. They designed and built infrastructure with the agricultural partners in the operating area and, when industry operations are complete, they will give the system to their agricultural partners. She noted that the agricultural partners know a lot about moving freshwater and both parties benefited from working together.
___________________
2 Available at http://www.anadarko.com/Responsibility/Sustainable-Development/HSE/Water-Management (accessed August 29, 2016).
MODERATED DISCUSSION
Following Cooper’s presentation, George King opened the floor for questions and discussion. A workshop participant asked about the implications of moving water at the surface and the potential for unintended impacts. Bauer commented that a better collective understanding of the extent of water movement at the surface and unintended impacts, as well as an array of solutions, is needed. Creating a dialogue with decision makers and engaging with various stakeholders at a broader scale would be helpful to advance the possibility for further use of treated produced water, Bauer said. Another participant commented that they found the oil-to-water ratio, raised by Veil in his presentation, to be interesting and asked if data exist to look at the ratios in further detail and undertake analysis. If not, are additional data needed? Veil responded by indicating that good analytical insight exists about produced water and that industry generally has these numbers.
Another participant noted a technology challenge in treating the water appropriately for a given use and the potential need for storage of water for later use. A follow-on question was raised about recharging groundwater aquifers with produced water. Cooper mentioned that it is possible to recharge a groundwater aquifer that is being used for public use or multiple uses; however, the water used for recharge has to meet drinking water quality standards. Veil cited an example in Wellington, Colorado, where an agreement was brokered between a small community and an oil and gas company. For some period, the oil and gas company provided the community with treated produced water. The treated water was then injected into a shallow aquifer to serve as a future water supply for the community.
Another question raised by a participant related to whether DOE had any projects that look at alternatives to hydraulic fracturing fluids. Bauer responded that there is at least one project at Berkley National Laboratories that DOE is supporting.
Directing a question to King and Veil, a participant asked if they could give any range of the costs to process produced water (not including the transportation cost) using today’s technologies? Veil disagreed that one could exclude transportation costs because they are a substantial part of managing and treating produced water. Veil suggested processing costs to treat and manage produced water, including transport, can range from $5 to $10 per barrel of water. This depends on the initial quality of the water and the desired quality of treated water. King followed by mentioning that costs vary from cents on the barrel for simple filtration projects, to options such as desalination, which can range up to $15 per barrel of water. He further elaborated that in the Barnhart area of Texas, Apache Corporation has produced water recycling operations in the middle of their densest well development program. One hundred percent of the water used in hydraulic fracturing in that area is recycled. This has advantages, he said, in terms of recycling water onsite and having a short transportation distance and adequate pipeline capacity to transport the water to the wells. At the Apache site, 80,000 semi-truck loads of water were removed from the road in 1 year and they were successful in getting the cost of recycled water below the cost of purchasing freshwater. Cooper followed up by indicating that the cost of treatment is beginning to decline in comparison to the cost of downhole injection. Over the entire life cycle of water management, she said, the cost may be anywhere from $1.50 to $15 per barrel of water.
Another participant brought forward the idea of groundwater banking and the case of California, which is presently using treated produced water to supplement groundwater supplies in some areas. The participant noted interest in recycling produced water into groundwater banking projects although significant data about the quantity and quality of produced water would be required to manage availability. The participant commented that a role may exist for some organization to become a data clearinghouse for this kind of information.
Regarding the use of produced water in agriculture, one participant remarked on the importance of case studies. An example mentioned was the field-scale irrigation of nonfood crops such as bio-
fuel crops. Many companies are presently treating produced water and using it for agricultural and other purposes, the participant suggested, and the process is very well permitted. California is one example, the participant noted, and the state has stringent permit programs.
Another participant commented on the chemistry of produced waters and that potential long-term impacts of the chemical constituents are not understood. We do not have a set of common definitions for what “clean” water is for different uses, the participant said. In terms of determining water quality, no reference materials exist for testing, the analyses can be very expensive, and no common agreement exists regarding laboratory approaches or standards. At present, the participant noted, the full chemistry of these waters is not understood. King followed with a comment on the water quality of natural systems which changes during the year because of issues such as seasonal variations and recharge sites. Thus, water quality is a moving target and needs to be evaluated in the context of a specific use, he said. Veil suggested that the degree of water treatment depends upon the final use, with most treatments designed to remove one ideal pollutant but which may also remove additional ones.
A participant asked about the potential added value of particular salts in the water and whether work is ongoing in this area of research beyond the conceptual stage. Veil was not aware that this kind of work has taken place commercially, but has heard of experiments. Bauer also said that DOE is supporting some research in this area. Another participant noted that one commercially profitable operation is iodine extraction. In the state of Oklahoma there are several operations that are taking produced water, selectively extracting iodine, and returning the water back to the operator. There was a follow-on question regarding building a business case to view water as a product. King responded that in the Barnhart area, for example, Apache targeted waters with salt content of 30,000 to 50,000 parts per million to use as fracturing fluid. Veil further elaborated on trying to use produced water as a product for agricultural use or for drinking water. Regulation standards will be needed at every application level, he said. Regulatory standards, such as discharge standards for the National Pollution Discharge Elimination System (NPDES), have to be taken into account. Operational standards also exist that are not driven by regulation but set by companies to protect their assets. In an agricultural context, the agricultural community or the farmer will have to be part of the standard development.
A participant outlined a study on hydraulic fracturing that was done for the state of California. The report3 yields 25 recommendations that are being adopted by the state. The report was done by the California Council on Science and Technology and the Lawrence Berkeley National Laboratory Pacific Institute (CCST and LBNLPI, 2014). The recommendations included one that suggested that no chemicals should be used in hydraulic fracturing fluids unless there is a basic environmental profile of those chemicals. Finally, the participant asked the panel to comment on a specific recommendation in the CCST and LBNLPI (2014) report, which suggested that the state work with industry to reduce the number of chemicals that are being used in hydraulic fracturing fluids. King responded by indicating that Apache Corporation is undertaking efforts to source safe chemicals in its fluids.
In discussion with another participant, Cooper noted that different legal constraints exist for various stakeholders in terms of using and treating produced water. Industry is constrained by the definition of “clean” water, for example, and water quantity is viewed as a state purview while water quality is viewed as a mixed federal and state responsibility.
___________________
3 Available at https://ccst.us/publications/2014/2014wst.pdf (accessed August 30, 2016).
This page intentionally left blank.


