
2
The State of Health Disparities in the United States
As part of its statement of task, the committee was asked to review the state of health disparities in the United States and to explore the underlying conditions and root causes contributing to health inequities and the interdependent nature of the factors that create them (drawing from existing literature and syntheses on health disparities and health inequities). In this chapter the committee reviews the state of health disparities in the United States by race and ethnicity, gender, sexual orientation and gender identity, and disability status, highlighting populations that are disproportionately impacted by inequity. In addition, this chapter summarizes data related to military veterans as well as rural versus urban-area differences. The committee drew on existing literature, comprehensive reviews (AHRQ, 2016; NCHS, 2016), and recent studies. In Chapters 2 and 3, the report features examples of communities that are taking action to address the root causes of health inequity. These brief examples are meant to be illustrative of the work being undertaken by communities throughout the country. In Chapter 5 the report takes a more in-depth look into nine examples of community-driven solutions to promote health equity.
HEALTH DISPARITIES
For the purposes of this report, health disparities are differences that exist among specific population groups in the United States in the attainment of full health potential that can be measured by differences in incidence, prevalence, mortality, burden of disease, and other adverse health
conditions (NIH, 2014). While the term disparities is often used or interpreted to reflect differences between racial or ethnic groups, disparities can exist across many other dimensions as well, such as gender, sexual orientation, age, disability status, socioeconomic status, and geographic location. According to Healthy People 2020, all of these factors, in addition to race and ethnicity, shape an individual’s ability to achieve optimal health (Healthy People 2020, 2016). Indeed, the existing evidence on health disparities does reveal differential health outcomes across and within all of the aforementioned identity groups. Health disparities can stem from health inequities—systematic differences in the health of groups and communities occupying unequal positions in society that are avoidable and unjust (Graham, 2004). These are the type of disparities that are reflected in the committee’s charge and that will be addressed for the remainder of this report. In this section, we describe health disparities affecting populations across multiple dimensions.
Racial and Ethnic Disparities
Race and ethnicity are socially constructed categories that have tangible effects on the lives of individuals who are defined by how one perceives one’s self and how one is perceived by others. It is important to acknowledge the social construction (i.e., created from prevailing social perceptions, historical policies, and practices) of the concepts of race and ethnicity because it has implications for how measures of race have been used and changed over time. Furthermore, the concept of race is complex, with a rich history of scientific and philosophical debate as to the nature of race (James, 2016). Racial and ethnic disparities are arguably the most obstinate inequities in health over time, despite the many strides that have been made to improve health in the United States. Moreover, race and ethnicity are extremely salient factors when examining health inequity (Bell and Lee, 2011; Smedley et al., 2008; Williams et al., 2010). Therefore, solutions for health equity need to take into account the social, political, and historical context of race and ethnicity in this country.
The criteria people use to classify themselves and others racially and ethnically and the attitudes that people hold about race and ethnicity have been changing significantly in the early 21st century. According to the U.S. Census Bureau, 37.9 percent of the population was identified to be racial or ethnic minorities in 2014 (NCHS, 2016). “Minority” populations, which already constitute majorities in some cities and states (e.g., California), will become the majority nationwide within 30 years. By the year 2044, they will account for more than half of the total U.S. population, and by 2060, nearly one in five of the nation’s total population will be foreign born (Colby and Ortman, 2014).
For racial and ethnic minorities in the United States, health disparities take on many forms, including higher rates of chronic disease and premature death compared to the rates among whites. It is important to note that this pattern is not universal. Some minority groups—most notably, Hispanic immigrants—have better health outcomes than whites (Lara et al., 2005). This “immigrant paradox” appears to diminish with time spent in the United States, however (Lara et al., 2005). For other indicators, disparities have shrunk, not because of improvements among minorities but because of declines in the health of majority groups. For example, white females have experienced increased death rates due to suicide and alcohol-related diseases. Research suggests that the recent drug overdose epidemic, along with the rise of suicide and alcohol-related diseases, has contributed to the first increase in the national death rate in decades and to the unusual recent decline in life expectancy for white females (Arias, 2016; Case and Deaton, 2015; NCHS, 2016).1
Although significant progress has been made in narrowing the gap in health outcomes (NCHS, 2016), the elimination of disparities in health has yet to be achieved. Furthermore, this narrowing of health gaps does not hold true for a number of outcomes. Rather, despite overall improvements in health over time, some health disparities persist. This is true with many human immunodeficiency virus (HIV)-related outcomes. For instance, the magnitude of the African American–white disparity in acquired immunodeficiency syndrome (AIDS) diagnoses and mortality has actually grown substantially over time (Levine et al., 2001, 2007).
Infant gestational age, which is an important predictor of morbidity and infant mortality, differs among racial and ethnic groups. The National Center for Health Statistics (NCHS) reports that among the five racial and ethnic groups2 measured in the National Vital Statistics Survey (NVSS) in 2014, African American women had the highest percentage of preterm singleton births at 11.1 percent, while Asian or Pacific Islander women had the lowest at 6.8 percent (NCHS, 2016). Within the Hispanic ethnic group, there is considerable variation in health outcomes based on country of origin. For example, the 2014 NVSS findings revealed that Puerto Rican mothers had the highest percentage of preterm singleton births at 9.1 percent, and Cuban mothers the lowest at 7.2 percent (NCHS, 2016).
___________________
1 At the time this report was being finalized in December 2016, the U.S. Centers for Disease Control and Prevention’s National Center for Health Statistics published a new data brief on 2015 data from the National Vital Statistics System, indicating that U.S. life expectancy decreased 0.1 year between 2014 (78.9 years) and 2015 (78.8 years), and that “the age-adjusted death rate increased 1.2 percent from 724.6 deaths per 100,000 standard population in 2014 to 733.1 in 2015” (Xu et al., 2016, p. 1).
2 These groups include African American; American Indian or Alaska Native; Hispanic; white; and Asian or Pacific Islander.
While national infant mortality rates decreased overall by 14 percent from 2004 to 2014, disparities among racial and ethnic groups persisted (NCHS, 2016). For indigenous populations, infant mortality rates are staggering. Native Americans and Alaska Natives have an infant mortality rate that is 60 percent higher than the rate for their white counterparts (HHS, 2014). In 2013, infants born to African American mothers experienced the highest rates of infant mortality (11.11 infant deaths per 1,000 births), and infants born to Asian or Pacific Islander mothers experienced the lowest rates (3.90 infant deaths per 1,000 births) (NCHS, 2016). In 2015 the percentage of low-birthweight infants rose for the first time in 7 years. For white infants, the rate of low-birthweight infants was essentially unchanged, but for African American and Hispanic infants, the rate increased (Hamilton et al., 2016).
Obesity, a condition which has many associated chronic diseases and debilitating conditions, affects racial and ethnic minorities disproportionately as well. This has major implications for the quality of life and wellbeing for these population groups and their families. From 2011 to 2014, Hispanic children and adolescents ages 2 to 19 had the highest prevalence of obesity in the United States (21.9 percent), and Asians had the lowest (8.6 percent) (NCHS, 2016). Again, there is variation among Hispanics; Mexican Americans suffer disproportionately from diabetes (HHS, 2015).
Heart disease and cancer are the leading causes of death across race, ethnicity, and gender (see Table 2-1). African Americans were 30 percent more likely than whites to die prematurely from heart disease in 2010, and African American men are twice as likely as whites to die prematurely from stroke (HHS, 2016b,d). The U.S. Centers for Disease Control and Prevention (CDC) reports that nearly 44 percent of African American men and 48 percent of African American women have some form of cardiovascular disease (CDC, 2014a). Moreover, African American and American Indian/Alaska Native females have higher rates of stroke-related death than Hispanic and white women (Blackwell et al., 2014).
Homicide-related deaths, another instance of health disparities, are highest for African American men (4.5 percent) and are at least 2 percent for American Indian/Alaska Native and Hispanic men. The rate of suicide is highest for male American Indians/Alaska Natives, who are also more likely than other racial and ethnic groups to die by unintentional injury (12.6 percent of all deaths) (CDC, 2013d).
It is important to be cautious with data on disparities in poverty, obesity, and diabetes for several reasons. First, surveillance and other data are adequate at capturing black–white disparities in part because of their large sample sizes. Other groups, however, are not studied in as much detail because their sample sizes can be small. Moreover, heterogeneous groups may be folded together—for example, Native Americans
TABLE 2-1 Leading Causes of Death by Race, Ethnicity, and Gender, 2013
| Rank | Gender | All | African American | American Indian/Alaska Native | Asian/Pacific Islander | Hispanic | White |
|---|---|---|---|---|---|---|---|
| 1 | Female | Heart disease 22.4% | Heart disease 23.6% | Cancer 18.9% | Cancer 26.4% | Cancer 22.6% | Heart disease 22.4% |
| Male | Heart disease 24.6% | Heart disease 24.0% | Heart disease 19.8% | Cancer 26.1% | Heart disease 20.7% | Heart disease 24.8% | |
| 2 | Female | Cancer 21.5% | Cancer 22.5% | Heart disease 16.8% | Heart disease 20.8% | Heart disease 20.0% | Cancer 21.2% |
| Male | Cancer 23.5% | Cancer 22.4% | Cancer 17.74% | Heart disease 23.6% | Cancer 20.7% | Cancer 23.7% | |
| 3 | Female | Chronic lower respiratory diseases 6.1% | Stroke 6.0% | Unintentional injuries 8.5% | Stroke 8.0% | Stroke 5.8% | Chronic lower respiratory diseases 6.6% |
| Male | Unintentional injuries 6.3% | Unintentional injuries 5.8% | Unintentional injuries 12.6% | Stroke 6.1% | Unintentional injuries 9.9% | Unintentional injuries 6.3% | |
| 4 | Female | Stroke 5.8% | Diabetes 4.7% | Diabetes 6.1% | Diabetes 3.7% | Diabetes 5.0% | Stroke 5.8% |
| Male | Chronic lower respiratory diseases 5.4% | Stroke 4.7% | Chronic liver disease 5.5% | Unintentional injuries 5.0% | Diabetes 4.4% | Chronic lower respiratory diseases 5.7% |
| Rank | Gender | All | African American | American Indian/Alaska Native | Asian/Pacific Islander | Hispanic | White |
|---|---|---|---|---|---|---|---|
| 5 | Female | Alzheimer’s disease 4.6% | Chronic lower respiratory diseases 3.3% | Chronic liver disease 5.6% | Influenza and pneumonia 3.5% | Unintentional injuries 4.4% | Alzheimer’s disease 4.9% |
| Male | Stroke 4.1% | Homicide 4.5% | Diabetes 5.3% | Diabetes 4.0% | Stroke 4.3% | Stroke 4.0% | |
| 6 | Female | Unintentional injuries 3.8% | Kidney disease 3.0% | Chronic lower respiratory diseases 5.0% | Alzheimer’s disease 3.4% | Alzheimer’s disease 3.8% | Unintentional injuries 3.9% |
| Male | Diabetes 3.1% | Diabetes 4.1% | Suicide 4.3% | Chronic lower respiratory diseases 3.6% | Chronic liver disease 4.0% | Diabetes 2.9% | |
| 7 | Female | Diabetes 2.8% | Unintentional injuries 3.0% | Stroke 4.4% | Unintentional injuries 3.3% | Chronic lower respiratory diseases 3.1% | Diabetes 2.5% |
| Male | Suicide 2.5% | Chronic lower respiratory diseases 3.3% | Chronic lower respiratory diseases 4.0% | Influenza and pneumonia 3.3% | Chronic lower respiratory diseases 2.9% | Suicide 2.6% |
| 8 | Female | Influenza and pneumonia 2.3% | Alzheimer’s disease 2.7% | Influenza and pneumonia 2.4% | Chronic lower respiratory diseases 2.5% | Influenza and pneumonia 2.4% | Influenza and pneumonia 2.4% |
| Male | Influenza and pneumonia 2.1% | Kidney disease 2.6% | Stroke 2.7% | Suicide 2.6% | Suicide 2.6% | Alzheimer’s disease 2.1% | |
| 9 | Female | Kidney disease 1.8% | Septicemia 2.3% | Alzheimer’s disease 2.1% | Kidney disease 2.0% | Chronic liver disease 2.1% | Kidney disease 1.7% |
| Male | Alzheimer’s disease 2.0% | Septicemia 1.9% | Influenza and pneumonia 2.0% | Kidney disease 1.9% | Homicide 2.4% | Influenza and pneumonia 2.1% | |
| 10 | Female | Septicemia 1.6% | Hypertension 2.0% | Kidney disease 2.1% | Hypertension 1.9% | Kidney disease 2.0% | Septicemia 1.5% |
| Male | Chronic liver disease 1.8% | Influenza and pneumonia 1.7% | Homicide 2.0% | Alzheimer’s disease 1.4% | Influenza and pneumonia 2.0% | Chronic liver disease 1.9% |
SOURCES: CDC, 2013b,c.
across tribes, rural and urban areas, or Pacific Islanders and Asians as one group—which may mask differences in poverty, obesity, and diabetes (Bauer and Plescia, 2014; Holland and Palaniappan, 2012). For Hispanics, an ethnic group among which there is substantial heterogeneity by country of origin, many data sources report health outcomes for the entire population, despite evidence for within-group variation on important outcomes such as HIV (Garcia et al., 2015). Relative to black–white disparities, the literature examining disparities across other racial and ethnic populations is extremely limited. Considering the significant growth of minority populations in the United States, the insufficient knowledge base to date about the health conditions of a number of these groups presents a serious challenge to understanding and addressing health disparities among specific populations.
ADDRESSING HEALTH INEQUITY IN UNIQUE POPULATIONS
In the sections that follow, the committee discusses in some detail health disparities that affect several populations unique for various reasons ranging from data challenges (e.g., one group is severely underrepresented in public health data collection) to mental health considerations (e.g., one group experiences posttraumatic stress disorder (PTSD) at a rate much higher than the average). Community-based solutions for these population groups—Native Americans; female gender; lesbian, gay, bisexual, transgender (LGBT) individuals; individuals with disabilities; and veterans—will require attention to unique needs and assets identified by members of those communities. For example, communities that are focusing on addressing health disparities among people with disabilities, could include such approaches as universal design (accessible to all) and maximizing the opportunities offered by technologic innovations, such as telemedicine.
Native American Health
Why Are Native Americans a Unique Population for Health Equity?
Native Americans, or American Indians and Alaska Natives, are a significant population for health equity considerations, especially at the community level. An extremely heterogeneous population, the 5.4 million Native Americans make up about 2 percent of the total population living in the United States, with 44 percent identifying as at least one other race (Norris et al., 2012). There are 567 federally recognized Native American tribes in the United States (GPO, 2016a) and many more that are not recognized by the government. U.S. Census estimates reveal that
the majority of people who identify as Native American (78 percent) live outside of regions that are considered traditional Native American areas3 (Norris et al., 2012).
Native Americans have a unique historical and legal background in the United States (see Appendix A for more detail on the historical and legal context), which provides the basis for the federal government’s trust obligation to Native American tribes. Unlike other racial and ethnic minority groups in this country, Native Americans possess legal rights to federal health care services. Despite these legal rights, the current state of health among this population is starkly worse than its counterparts in large part due to historical and legal contexts and the subsequent conditions of Native American communities. Furthermore, the body of literature on Native Americans has not been sufficient for a number of reasons, including small sample sizes, the heterogeneity of the population, and racial misclassification on disease registries and death certificates (Jim et al., 2014).
Health Disparities Among Native Americans
Although the creation of the Indian Health Service (IHS) and a trend toward self-determination have contributed to improvement of Native American health across many areas, including infectious disease prevention and sanitation (Rhoades and Rhoades, 2014), racial and ethnic health disparities have persisted for this population. The National Interview Health Survey revealed that 13.2 percent of Native Americans report being in fair or poor health, compared to only 9.8 percent of the total population (Adams and Benson, 2015).
Mortality Overall, mortality rates for Native Americans are almost 50 percent higher than that of their white counterparts (Bauer and Plescia, 2014). Additionally, Native Americans have an infant mortality rate that is 1.5 times the rate of whites (Mathews et al., 2015). While research shows that whites experienced a significant decline in all-cause mortality rates from 1990 to 2009, Native Americans did not (Espey et al., 2014).
Burden of diseases The health and overall well-being of Native Americans reflect a higher risk and higher rates of chronic diseases when compared to other racial and ethnic groups. For example, Native Americans are twice as likely to have diabetes as whites (HHS, 2016c). This is especially
___________________
3 This includes federal American Indian reservations and off-reservation trust lands, Oklahoma tribal statistical areas, tribal designated statistical areas, state American Indian reservations, and state-designated American Indian statistical areas.
true for specific subgroups of Native Americans, such as the Pima Indians, who have historically been identified as having the world’s highest recorded prevalence and incidence of type 2 diabetes (HHS, 2016c; Schulz et al., 2006). While overall population rates of diabetes as an underlying cause of death have been decreasing over time, the rates of diabetes as an underlying cause of death and a multiple cause of death have remained 2.5 to 3.5 times higher for Native Americans than for whites of all ages 20 and older, for every IHS region except Alaska (Cho et al., 2014).
A 10-year analysis revealed that Native Americans were 1.21 times as likely to die from heart disease as an underlying cause of death than were whites (Veazie et al., 2014). In 2012 the tuberculosis rate for Native Americans was 6.3 percent, as compared with 0.8 percent for the white population (HHS, 2016c). This disparity is especially striking when examined against the backdrop of successful infectious disease prevention efforts that have almost eliminated the burden of tuberculosis in other racial and ethnic populations.
While overall rates of cancer are lower for Native Americans than for other racial and ethnic groups, there are specific cancers for which this population is at high risk. These include stomach, liver, cervix, kidney, gallbladder, and colorectal cancer (Espey et al., 2014; White et al., 2014). Research suggests that the burden of disease from these types of cancer is in large part attributable to the high rates of alcohol consumption among Native Americans (Landen et al., 2014). From 1990 to 2009, overall cancer death rates increased significantly for Native Americans, whereas these rates declined for white men during the entire period, and for white women during most of the 19-year period (White et al., 2014).
Mental health Native Americans have had a complex and tumultuous history in the United States. The resulting historical trauma is an important context for the discourse on mental health issues that are faced by Native American communities today. Although research on mental health is limited because of the size and heterogeneity of this population, there is literature that suggests that Native Americans disproportionately suffer from mental health disorders and related conditions. These include, but are not limited to, increased prevalence and risk factors for depression, suicide, drug and alcohol abuse, and PTSD (Berman, 2014; Herne et al., 2014; HHS, 2016c; Landen et al., 2014). When compared to the general U.S. population, Native Americans experience PTSD more than twice as often and experience psychological distress 1.5 times more often (APA, 2010). These experiences have major implications for suicide rates in Native American communities. A 10-year analysis of death certificate data linked with IHS health data found that death rates from suicide were
approximately 50 percent higher among Native Americans than among whites (Herne et al., 2014). Recently, suicide has replaced homicide as the second leading cause of death among U.S. teenagers, and the highest rates are among Native American youth (VanOrman and Jarosz, 2016).
A Shift in the Narrative
Despite the barriers to achieving health and well-being that Native Americans face, there have been positive advancements by communities and community partners toward improving the health of this population. For example, the emergence of tribal health research infrastructures has been supported by National Institutes of Health funding of the Native American Research Centers for Health, which started in 2001 (Jernigan et al., 2015; Kelley et al., 2013). Furthermore, resilient Native American communities have followed the trend toward self-governance and have taken the initiative to create community-driven solutions to address the severe health conditions discussed in this section. Box 2-1 briefly introduces one of these communities and its path to health (see Chapter 4 for a more in-depth discussion of another Native American community that is taking action on health inequity).
Gender Disparities
When discussing health disparities across gender groups, it is important to acknowledge that while the basis of some disparities is biological (e.g., rates of ovarian and prostate cancers), the majority of the disparities discussed in this section are not based in biological mechanisms unless otherwise stated. Nonbiological health disparities stem from socioeconomic conditions that can shape gender differences in health outcomes such as mortality rates, alcohol and substance abuse, mental health disorders, and violence victimization.
In 2014 life expectancy at birth was 81.2 years for women and 76.4 years for men (NCHS, 2016). From 2004 to 2014, the gap in life expectancy between men and women decreased from 5.1 years to 4.8 years (NCHS, 2016). While the narrowing of the life expectancy gap could be considered a positive trend, it is in fact a troubling trend because it stems from a rise in mortality rates among women over the past two decades in many areas (Arias, 2016). Kindig and Cheng found that from 1992 to 2006, as mortality decreased in most U.S. counties, female mortality rates increased in 42.8 percent of counties. During this same period, only 3.4 percent of counties saw an increase in male mortality rates (Kindig and Cheng, 2013).
More specifically, recent evidence reveals an unprecedented increase in the death rates among white women and a decline in life expectancy, changes that white men did not experience (Arias, 2016). Findings on the causes of death among white women point to accidental poisoning (related to the rise in prescription opioid use), suicide, obesity, and smoking-related diseases (Astone et al., 2015). Figure 2-1 shows that across multiple racial groups, women—particularly white women—have been more affected than men by the increasing rates of drug poisonings (NASEM, 2016a).
In terms of alcohol and illicit drug use, men ages 12 and older report higher usage rates than women (SAMHSA, 2015a,b). While women have lower rates of alcohol and substance use, they are more likely to have a serious mental illness than men (SAMHSA, 2015a). Research shows that women are more likely to be diagnosed with anxiety or depression (including post-partum depression) and men are more likely to have substance abuse or antisocial disorders (Eaton, 2012). In fact, depression is the number one cause of women’s disability in the United States (NASEM, 2016a).
Gender disparities are present across all social determinants of health, with some more prominent than others. In education, the historical gender gap has narrowed over the past 50 years, with the percentage of men and women older than 25 years with bachelor’s degrees roughly equal now (32 percent and 33 percent, respectively), and the percentage of women
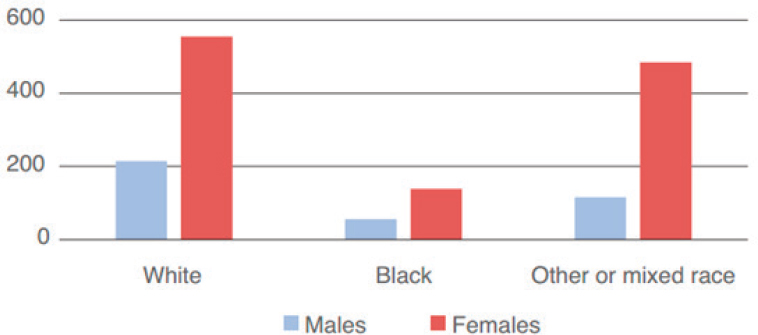
SOURCE: NASEM, 2016a.
ages 25–29 with a bachelor’s degree exceeds that of men. However, men still outnumber women in the attainment of degrees beyond a bachelor’s degree (Ryan and Bauman, 2016). The gender pay gap, a widely reported disparity in income, has implications for health inequities because income is closely tied to health. A report by the National Academies of Sciences, Engineering, and Medicine examined gains in life expectancy across different income groups over time and found that while men in the top 60 percent of the income distribution were making gains in life expectancy at age 50, women were experiencing losses in expected life expectancy at age 50 in the bottom two income quintiles and no progress in the third or fourth quintiles (NASEM, 2015).
Access to routine, quality health care is essential for both men and women. The uninsured rate is higher for men, even after the passage of the Patient Protection and Affordable Care Act (ACA), in part because men have not historically qualified for Medicaid (NASEM, 2016a). Reproductive and sexual health services are an especially important consideration for women because of their ability to bear children. Unintended pregnancy can have an impact on the overall health and well-being of women. From 2007 to 2010 teenage pregnancy rates in the United States declined 17 percent (Hamilton and Ventura, 2012).
For women, experiencing violence is a strong predictor of health, and violence against women is primarily in the form of intimate partner violence (IOM, 2010; Tjaden and Thoennes, 2000). Living in low-income neighborhoods is associated with an increased risk of intimate partner violence for African American and white women (Cunradi et al., 2000). Women are more likely than men to sustain injuries from an assault
(Tjaden and Thoennes, 2000). In addition to injury, research suggests that women’s health can be greatly affected over time after experiencing violence. For example, women who experience violence are at increased risk of arthritis, asthma, heart disease, gynecological problems, and risk factors for HIV or sexually transmitted diseases (STDs) than those who do not experience violence (Campbell and Boyd, 2000; IOM, 2010). For men, community violence is likely to affect their health, and this is particularly true for men of color, who experience disproportionate amounts of violence (Prevention Institute, 2011). Men are also much more likely to commit suicide than women, regardless of age, race, or ethnicity, with overall rates at almost four times those of women (CDC, 2013a).
Lesbian, Gay, Bisexual, and Transgender Health Disparities
Who Are LGBT Persons?
LGBT persons are considered sexual minorities because of their non-heterosexual sexual orientation (i.e., lesbian, gay, or bisexual) or their gender identity (i.e., transgender).4 Sexual orientation and gender identity minorities are often referred to using the acronym LGBT (i.e., lesbian, gay, bisexual, and transgender persons) as an umbrella term even though the forms of sexual and gender expression that exist within this population are greater than the acronym suggests. For instance, intersex persons who have both male and female sex characteristics are also considered under this rubric (Makadon et al., 2008). Until recently, LGBT populations were excluded from many of the rights and social advantages of our society and were routinely targeted for hate crimes. A 2011 Institute of Medicine (IOM) report assessed the state of the evidence and determined it was lacking with respect to demography research, evidence on social influences for LGBT people, inequities in health care, intervention research, and transgender-specific health needs. The report defined LGBT populations and outlined needs for advancing a research agenda on LGBT health disparities (IOM, 2011).
Both sex and gender are relevant to sexual orientation and gender identity. “Sex” is a biological construct that has at least two categories, male and female. Gender is a social construct reflecting one’s social sense of self. It exists on a continuum ranging from masculine to feminine and has at least two categories, man and woman. Gender identity combines the biological construct of sex and the social construct of gender. It
___________________
4 For a more detailed discussion of LGBT populations and how to define them, see the IOM report The Health of Lesbian, Gay, Bisexual, and Transgender People: Building a Foundation for Better Understanding (IOM, 2011).
has two categories, cis gendered and trans gendered. As implied by the Diagnostic and Statistical Manual of Mental Disorders (DSM-5) definition of gender dysphoria, transgender persons are those for whom the sex (male versus female) and gender (masculine versus feminine) categories do not align, leading a person of one gender to feel trapped in the body of the opposite sex. The LGBT population is a microcosm of the broader society and, therefore, reflects its demographic and social diversity as well as its socioeconomic and racial and ethnic inequities.
Challenges to achieving LGBT health equity stem primarily from the “invisibility” of LGBT individuals and communities, the forms of stigma and social and legal discrimination to which they are susceptible, and the paucity of data on the factors influencing LGBT health (HHS, 2011). Recent civil rights gains have helped to increase LGBT visibility, reduce stigma, and facilitate access to health insurance and health care; however, standardized competencies on LGBT health for health professionals and health care organizations are not yet required nationally. Therefore, the care that LGBT persons receive may not yet reflect an awareness of LGBT-specific concerns.
Health Disparities
Overall LGBT population The LGBT population experiences all of the same diseases and conditions that are prevalent in the broader society (e.g., cardiovascular disease) as well as other conditions such as HIV/AIDS that affect the LGBT population disproportionately. The social determinants of health are particularly influential drivers of LGBT health disparities. High rates of unemployment or underemployment, limited access to appropriate health care, and social discrimination affect the behaviors in which LGBT people engage and the strategies needed to improve the health of this population.
LGBT health disparities occur across the life course. LGBT youth are more likely than their non-LGBT peers to be bullied, commit suicide, engage in sexual risk behaviors, and run away or be forced to leave home (Robinson and Espelage, 2013). The social challenges that accompany their high rates of homelessness include mental health issues, violence, HIV and other STDs, poverty, substance abuse, and food insecurity (Garofalo and Bush, 2008). LGBT seniors are more likely than non-LGBT seniors to live alone. They are also less likely to have children, which can limit their access to sources of social support for assistance with the activities of daily living and with chronic or acute medical needs (Henning-Smith et al., 2015; Wallace et al., 2011).
Social discrimination and inadequate legal protections directly affect health behaviors (e.g., substance use) and access to health care; the data
on mental health disparities are mixed. Violence, including bias crimes, remains a major public health issue for LGBT persons, although the levels and types of violence differ across LGBT subpopulations. In a rare national study, an estimated 39 percent of gay men, 15 percent of lesbians, 20 percent of bisexual men, and 15 percent of bisexual women reported having ever experienced physical violence, property crime, or attempted crime due to anti-LGBT bias (Herek, 2009). LGBT youth and transgender women are particularly susceptible to physical assault, sexual assault, and murder (Grant et al., 2011; Office for Victims of Crime, n.d.). Though sexual forms of victimization are poorly documented, the available data suggest that the lifetime prevalence is higher among lesbian and bisexual women (43.4 percent) than among gay and bisexual men, and that bias-related victimization, including murder, is higher among transgender women than among any other group (Grant et al., 2011; Rothman et al., 2011). Stark racial and ethnic disparities exist; transgender women of color experience higher levels of such violence than members of any other group (Grant et al., 2011).
Lesbian women Timely and appropriate health screenings for preventable diseases can prevent many of the health issues affecting lesbians. Lesbians have higher rates of alcohol, tobacco, and other drug use, which are associated with cardiovascular disease and obesity (O’Hanlan and Isler, 2007). On average, lesbians have greater body mass index than heterosexual women, and they are less responsive to social pressures to lose weight (Roberts et al., 2010). Lesbians also have an elevated risk for some cancers because of a combination of lifestyle factors and other risk factors. They experience disparities in breast, colon, and lung cancers due to obesity and tobacco and alcohol use. They have an elevated risk for gynecological cancers, such as ovarian and breast cancer, because of such risk factors as a lower likelihood of ever being pregnant and delayed or inadequate gynecological screenings (O’Hanlan and Isler, 2007).
Gay men Among gay men, HIV and AIDS remain major threats to health. In 2013, 81 percent of all new diagnoses of HIV (30,689 new cases) infection in the United States occurred among gay and bisexual men, with African American men having the highest rates (AHRQ, 2015). The high prevalence of HIV in this population means that any member of this population who engages in HIV-risk behaviors has an elevated risk of acquiring it. Based on 2008 surveillance data among gay and bisexual men screened for HIV infection, the CDC estimates that HIV prevalence among gay and bisexual men to be 19 percent (CDC, 2010a). An emerging set of concerns pertain to negative body image, eating disorders such
as anorexia, and related mental health disorders, especially among white men; however, large population-based studies have yet to confirm this (Burns et al., 2015; Ruble and Forstein, 2008).
Bisexual persons Except for the disproportionate burden of HIV/AIDS among bisexual men, health disparities uniquely affecting bisexual men and women are poorly understood, as studies often add bisexual persons to the homosexual category. One issue that appears to affect bisexual men and women disproportionately is intimate partner violence (Brown and Herman, 2015). Estimates from the National Intimate Partner and Sexual Violence Survey document that in 2010, 61 percent of bisexual women, as compared with 44 percent of lesbians and 35 percent of heterosexual women, experienced intimate partner violence–related physical violence, stalking, or rape; 37 percent of bisexual men, as compared with 29 percent of heterosexuals and 26 percent of gay men, experienced these outcomes (Walters et al., 2013).
Transgender persons Transgendered persons, especially transgendered women, experience particularly dire disparities, which are driven primarily by the social determinants of health. The inability to secure employment as an openly transgendered person or to maintain employment while transitioning from one sex to the other helps to explain why the occurrence of annual household incomes of $10,000 or less is nearly four times higher in this population than in the overall U.S. population (Grant et al., 2011). Poverty leads many transgender women to engage in sex work, which places them at risk for incarceration, violence, substance abuse, and HIV as well as other sexually transmitted infections. African American and Hispanic transgender women are disproportionately impacted (Reisner et al., 2014). Other health disparities affecting this subpopulation include depression, self-harm, suicide, and complications due to the use of cross-sex hormones, some of which may be obtained illegally or of poor quality (Kaufman, 2008; Lawrence, 2007).
Some of the disparities that LGBT persons experience reflect the ways that LGBT status may intersect with other minority statuses. For instance, among transgender women, racial and ethnic minorities report disproportionately higher levels of incarceration than their nonminority peers, and qualitative findings suggest that concerns about racism may be at least as salient as those of sexual orientation and gender identity (Sausa et al., 2007).
Health Care Disparities
Sexual minorities face several barriers to care, including their exclusion from a partner’s health insurance, provider-related discrimination, psychosocial barriers (e.g., fear of disclosing sexual orientation and gender identity or illegal behaviors), and poor matches between the needs of LGBT people and the kinds of services that are available (HHS, 2011).
Poor matches typically occur if the available services are intentionally (e.g., obstetric/gynecologic) or unintentionally (e.g., intimate partner violence) developed and provided with a particular gender in mind. For instance, both providers and transgender persons may fail to pursue the standard screening for breast cancer for transgender men, even though they may continue to be at risk. With respect to intimate partner violence, while some of the challenges faced by survivors are universal to all survivors (e.g., physical and emotional pain, the need for shelter), other issues (e.g., distinguishing perpetrators and victims in same-sex couples) affect the LGBT population specifically. Most intimate partner violence–related services are typically designed to assist heterosexual women battered by male partners (Ford et al., 2013), so providers and social service agencies may not know how to address the issues uniquely affecting LGBT survivors, though trainings are available to address this.
Perhaps the greatest challenges faced by transgendered persons and their providers involve the need for multiple surgeries and the long-term administration of sex hormones. Both require substantial reliance on the health care system, and some insurers may not reimburse the expenses fully. The need for these services is compounded by the particularly low levels of income and health insurance in this population (Center for American Progress and Movement Advancement Project, 2015; dickey et al., 2016).
Disability Status and Health Disparities
Disabilities,5 whether present or acquired at birth or developed later in the life course, can manifest as physical, cognitive, or mental health-related impairments, which can affect health outcomes. People with disabilities represent about 18.7 percent of the U.S. population (Brault, 2012). Although there is ample evidence to suggest that people with disabilities are at increased relative risk for poor well-being (see Figure 2-2), until recently this population has been overlooked in population health data collection, analyses, and reports (Krahn et al., 2015). One of the major
___________________
5 The WHO International Classification of Functioning, Disability, and Health (ICF) defines disability as an umbrella term for impairments, activity limitations, and participation restrictions (WHO, 2001).

SOURCE: CDC, 2015.
challenges in data collection has been the lack of consensus on a clear and specific definition of disability (Oreskovich and Zimmerman, 2012). There has been an emerging effort to document and address health disparities among people with disabilities (CDC, 2013a; HHS, 2016a; NASEM, 2016b), in addition to the ACA requirement to improve data collection and reporting on disability, among other factors.
Adults with disabilities are four times as likely as adults with no disabilities to report having fair or poor health (40.3 percent versus 9.9 percent) (Krahn et al., 2015). People with disabilities also report higher rates of obesity, lack of physical activity, smoking, and three to four times the rate of cardiovascular disease versus people without disabilities (CDC, 2014b, 2016c; Reichard and Stolzle, 2011; Reichard et al., 2011). For specific subgroups of this population, factors such as race and ethnicity, age, language, sex or gender, poverty, and low education can compound the effects of having a disability (Krahn et al., 2015). Furthermore, living with a disability shapes one’s experiences of the social, economic, and environmental determinants of health. For instance, having a disability is associated with an increased likelihood of not having a high school education, less likelihood of employment, less access to the Internet, an increased likelihood of having an annual income less than $15,000, and inadequate access to transportation (Krahn et al., 2015).
Living with a disability can present barriers to accessing health care services and navigating the health care system (WHO, 2016). People with disabilities, including those with health insurance and those without, were more than twice as likely as people without disabilities to not receive medical care because of cost in 2009 (CDC, 2010b). While they experience higher rates of chronic disease than the general population, people with disabilities are significantly less likely to receive preventive care (Krahn et al., 2015). Additional barriers include common misconceptions, stigma, and attitudes among providers (CDC, 2016b).
Disability types vary in prevalence and in how they are associated with health disparities. In the United States, disabilities in mobility and cognition are the most commonly reported types (Courtney-Long et al., 2015). People with cognitive limitations are up to five times more likely to have diabetes than the general population (Reichard and Stolzle, 2011). Disability severity also has implications for the economic factors that shape health. According to U.S. Census data, in 2010 approximately 28.6 percent of people ages 15 to 64 with severe disabilities were in poverty, compared with 17.9 percent of adults with non-severe disabilities and only 14.3 percent of adults with no disability (Brault, 2012).
Veterans Health
As a vulnerable and growing population, military veterans are an important focus of many ongoing efforts to promote health equity. Many veterans experience lasting trauma from their military service as well as socioeconomic disadvantages post-deployment that can significantly influence their physical and mental well-being. These conditions have resulted in health and health care disparities both relative to the general population and among certain veteran subpopulations. For the purposes of this report, veterans are defined as those “who served in the active military, naval, or air service, and who [were] discharged or released therefrom under conditions other than dishonorable,”6 who receive health care from the Veterans Health Administration (VHA) as well as those who are not enrolled.
Many conditions and factors contribute to premature mortality among veterans, including higher rates of suicide risk, homelessness, and mental health issues. The risk of suicide in the veteran population is higher than in the general population and has become an increasingly serious problem among younger veterans. A study of 1.3 million veterans who served in Iraq and Afghanistan between 2001 and 2007 found that non-deployed and deployed veterans had 61 and 41 percent higher
___________________
6 38 U.S. Code § 101.
risks of suicide, respectively, than members of the general population (Kang et al., 2015). The U.S. Department of Veterans Affairs (VA) recently examined suicide rates among VA-enrolled veterans from all states and found that in 2014, VA-enrolled veterans accounted for 17.9 percent of suicide deaths among U.S. adults and had a 21 percent higher risk of suicide relative to the general adult population (VA, 2016). The higher risk of suicide among younger veterans has also drawn significant attention. Specifically, between 2006 and 2011, the suicide rate among young California veterans (a yearly average of 27 suicides per 100,000 veterans) was 57 percent higher than the rate among active duty military personnel (Zarembo, 2013).
Mental illness and related psychopathological problems, including PTSD, depression, substance abuse, and sexual trauma, are significantly more prevalent among the veteran population. Despite the high burden, calculated prevalence rates have varied significantly because of substantial variations in many components of study design. The prevalence of these disorders among veterans who receive care from the VA and among those who do not can be even more difficult to discern. The prevalence of PTSD in veterans who were deployed to Afghanistan and Iraq is two to three times greater than in the overall population, with many studies estimating that the prevalence among this veteran cohort ranges from 13 to 20 percent (IOM, 2012). PTSD is closely linked to military sexual trauma (MST), which federal law defines as “psychological trauma, which in the judgment of a mental health professional employed by the VA, resulted from a physical assault of a sexual nature, battery of a sexual nature, or sexual harassment which occurred while the veteran was serving on active duty, active duty for training, or inactive duty training.”7 Sexual trauma is far more prevalent among veterans and military personnel than in the general population and is likely to be considerably underreported. Recently, data from the National Health and Resilience in Veterans Study collected in 2013 revealed a prevalence rate of 7.6 percent, with 32.4 percent of female veterans and 4.8 percent of male veterans reporting MST (Klingensmith et al., 2014). MST disproportionately affects female veterans but is also a pervasive problem among male veterans, and it detrimentally affects both mental and physical health. It has been linked to suicidal ideation, substance abuse, PTSD, depression, anxiety, eating disorders, and impaired mental and cognitive functioning (Klingensmith et al., 2014; Mondragon et al., 2015; O’Brien and Sher, 2013). It has also been linked to greater symptoms of physical pain (Mondragon et al., 2015; O’Brien and Sher, 2013). Sexual trauma suffered during military service may also affect the social well-being of veterans after they are deployed,
___________________
7 38 U.S. Code § 1720D. Counseling and treatment for sexual trauma.
as MST has been negatively correlated with emotional and social support post-deployment (Mondragon et al., 2015).
Disparities related to access to and use of health care as well as higher prevalence of certain chronic diseases are also present in the veteran population. A review of studies examining racial and ethnic health care disparities in the VA found that relative to white veterans, African American veterans experience lower levels of arthritis and cardiovascular disease management, lower levels of participation in surgery related to cancer and cardiovascular disease, and a lower quality of diabetes care (Saha et al., 2007). Prevalence rates for certain chronic diseases are also disproportionately high in the veteran population. Among African American male veterans born between 1945 and 1965, the prevalence of hepatitis C virus was 17.7 percent, a fivefold greater rate than the 3.5 percent prevalence found in the same birth cohort of the general population between 2001 and 2010 (Backus et al., 2014).
Veteran homelessness is one of the most staggering and urgent issues affecting veteran health; although the number of homeless veterans has decreased in recent years, veterans remain at significantly higher risk than members of the general population for becoming homeless (Tsai and Rosenheck, 2015). Point-in-time counts by the U.S. Department of Housing and Urban Development across all states estimated 47,725 homeless veterans in 2015 and 39,471 homeless veterans in 2016, a decrease of 17.3 percent between the 2 years8 (HUD, 2016). Studies with more geographically focused sampling also illustrate the continuing pervasiveness of veteran homelessness. In a study of homeless veterans 65 years and older in Los Angeles between 2003 and 2005, 56 percent were found to be chronically homeless, with African American veterans accounting for 42 percent of this number (van den Berk-Clark and McGuire, 2013). Additionally, female veterans are at higher risk of homelessness than both male veterans and females in the civilian population and account for an increasing proportion of homeless veterans, as the number of female veterans increases (Balshem et al., 2011; Byrne et al., 2013). Box 2-2 briefly describes a community-based program that was designed to address a few of the barriers that veterans face.
___________________
8 Note: Comparison of prevalence estimates over time is flawed due to differences in counting and estimation methods.
PLACE MATTERS
In the following section, the committee discusses the relationship between people and place and implications for health disparities. One of the most consistent findings in the health disparities literature is that place matters. Research shows that there are systematic disparities in morbidity,
mortality, and other measures of well-being across different areas of the country, even across small areas that lie relatively close together. At a larger level of analysis, life expectancy varies between states by up to 7.0 years for males and 6.7 years for females (NRC and IOM, 2013). Historically, many analyses compared health and life expectancy rates across wide areas, such as regions or states. Thus, it can be stated that obesity—a condition associated with chronic disease, mortality, and decreased overall well-being—is concentrated in the South and Midwest (Levi et al., 2015b). Likewise, people living in the South are more likely to be diagnosed with HIV over the course of their lifetime than other Americans, with the highest risk in Washington, DC (1 in 13), Maryland (1 in 49), Georgia (1 in 51), Florida (1 in 54), and Louisiana (1 in 56) (CDC, 2016d).
However, the availability of more granular data has allowed for the observation of even larger disparities across smaller geographic regions such as zip codes, counties, and census tracts (see Figures 2-3 and 2-4) (Kulkarni et al., 2011; UWPHI, 2016; Zimmerman and Woolf, 2014). In some cities, for example, life expectancy can differ by as much as 25 years
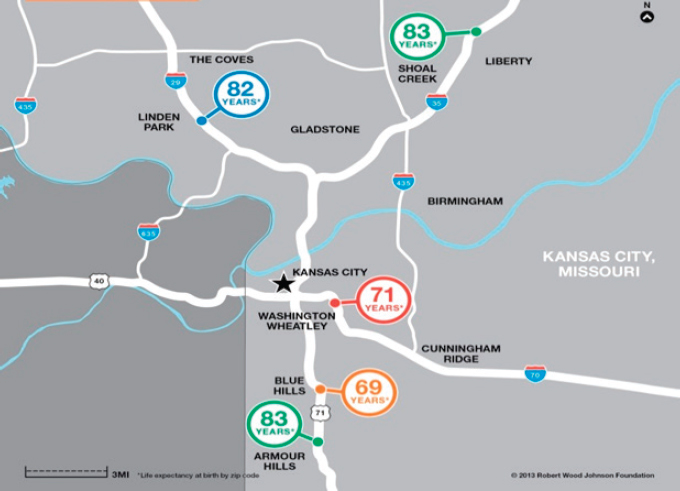
NOTE: The average life expectancy gap for babies born to mothers in Kansas City can reach up to 14 years.
SOURCE: RWJF, 2013a. Used with permission from the Robert Wood Johnson Foundation.
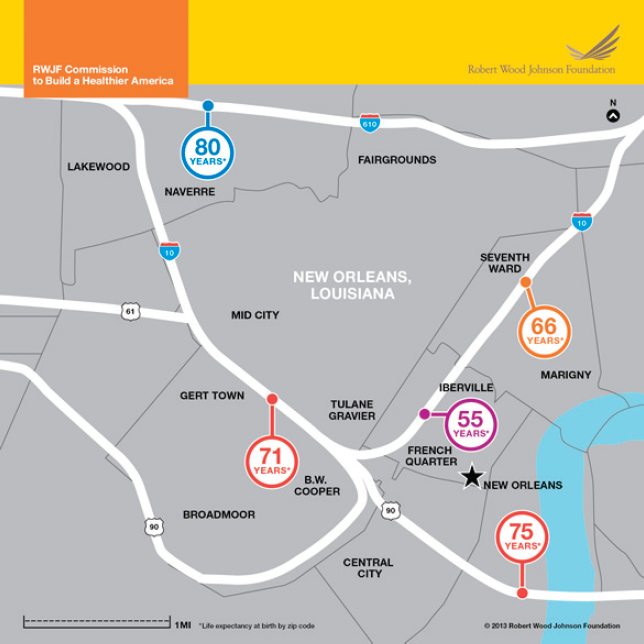
NOTE: The average life expectancy gap for babies born to mothers in New Orleans can reach up to 25 years.
SOURCE: RWJF, 2013b. Used with permission from the Robert Wood Johnson Foundation.
from one neighborhood to the next (Figure 2-4 illustrates this disparity between New Orleans neighborhoods) (Evans et al., 2012; Zimmerman and Woolf, 2014). Life expectancy is but one measure of these disparities. Similar gaps in health-related outcomes across geographic areas can be found for infant mortality, obesity, violence, and chronic diseases (UWPHI, 2016). There is also research suggesting that African Americans and whites living in similar neighborhood conditions do not experience the racial disparities in health that national data reflect (LaVeist et al., 2011).
Health Disparities in Rural Places
Health equity for rural communities brings considerations that may not be as prevalent in urban and suburban communities. Singh and Siahpush found that rural areas have not made the same strides in improving life expectancy as urban areas have, with the gap between rural and urban areas widening from 0.4 years in 1969–1971 to 2.0 years in 2005–2009 (Singh and Siahpush, 2014). Rural counties9 have always had the highest premature death rates among the various types of counties. However, the County Health Rankings Report revealed that after a period of steady decline over decades, rural counties are experiencing an increase in the number of premature deaths (UWPHI, 2016). The evidence also shows that, compared with their urban counterparts, rural communities have higher rates of preventable conditions (such as obesity, diabetes, cancer, and injury), and higher rates of related high-risk health behaviors (such as smoking, physical inactivity, poor diet, and limited use of seatbelts) (Crosby et al., 2012).
Appalachian Health
In Appalachia10 the proportion of the population living in rural communities is double that of the population in the nation living in rural areas (42 percent and 20 percent, respectively) (CREC and WVU, 2015). Mortality measures show that in Appalachia, mortality rates have increased, particularly in central and southern Appalachian counties, while they have been decreasing in the country overall (CREC and WVU, 2015). Yao et al. (2012) analyzed spatial disparities in white infant mortality rates over time and found that disparities in infant mortality rates between Appalachian counties and non-Appalachian counties have persisted since the 1970s. High infant mortality in Appalachia is associated with high poverty rates, residence in more rural areas, and lower physician density (Yao et al., 2012). Health perception has also been shown to be worse among residents who live in communities in Appalachian counties when compared to other residents living in the same state, but in non-Appalachian counties (McGarvey et al., 2011). This association persisted even among those with health insurance.
This region has historically been affected by poverty and lack of opportunities for achieving optimal health, including factors such as
___________________
9 Rural classification here is adapted from the National Center for Health Statistics’ urban–rural classification based on Metropolitan Statistical Area designations.
10 The Appalachian region includes the entire state of West Virginia and parts of the following states: Alabama, Georgia, Kentucky, Maryland, Mississippi, New York, North Carolina, Ohio, Pennsylvania, South Carolina, Tennessee, and Virginia (CREC and WVU, 2015).
employment, education, housing, and access to transportation. From 2010–2014, in the region’s most rural counties, 15 percent of residents were not covered by health insurance, compared to 14 percent in the nation (Pollard and Jacobsen, 2016). Unemployment rates among the population in Appalachia suggest that this population has not rebounded from the economic downturn in 2007–2009. The labor force participation rate was almost a full percentage point lower in 2010–2014 than its rate in 2005–2009 (Pollard and Jacobsen, 2016).
Limited timely access to a health care provider, poor management of chronic disease, and limited subspecialty availability are very real concerns for rural communities (Wong and Regan, 2009). Health systems in rural communities are often under-resourced, understaffed, and of small scale, and in recent years many rural hospitals have closed. The small scale may make it easier for health care providers to discriminate, as a single provider may be able to dictate the treatment, cost, and quality of service (Bull et al., 2001) and there may be little recourse for the rural resident. Transportation challenges also pose a problem for rural health care delivery systems.
Despite these challenges, rural communities may not suffer disadvantages in all areas of health when compared to urban and suburban communities. Both rural and urban areas tend to have higher rates of adverse health outcomes than suburban areas (Eberhardt and Pamuk, 2004).
The nature of racial and ethnic disparities in rural areas is rather complex and intersectional. It appears to vary depending in part on the region of the country and the racial and ethnic groups being considered (e.g., rural Native American reservations; Hispanic farm workers; African Americans residing in rural parts of the South, which may include historically African American municipalities as well as those in which African Americans constitute a minority of the population; and rural communities with large immigrant or Hispanic populations). For migrant and seasonal farmworkers, 78 percent of whom are foreign born, there are many unique health concerns that stem from occupational hazards, poverty, substandard living conditions, language and cultural barriers, and inadequate preventive care (Hansen and Donohoe, 2003; NCFH, 2009).
The health issues facing U.S. rural communities are not necessarily due to rurality per se. In part these place-based health disparities are driven by
- demographic shifts in which rural areas are losing population as young people migrate to cities for work, school, etc.;
- inefficiency associated with providing health care services, which leads to, for instance, hospital closures in rural areas;
- a primary focus on and allocation of resources for interventions to address issues facing urban populations;
- a lack of the necessary technological infrastructure (e.g., a lack of reliable Internet service), which limits the possible alternative strategies for health promotion; and
- place-specific exposures such as those associated with mining and farming (pesticide exposures, etc.).
Health Disparities in Urban Places
There are unique features of urban regions as well as unique population characteristics and barriers to health that shape urban disparities. The food environment is a widely examined feature of urban areas that shapes health outcomes. When examining the 10 counties with the highest number of food-insecure individuals in the country, all of the 10 counties spanned over large urban cities (e.g., Chicago, Illinois; Houston, Texas; Los Angeles, California; New York, New York; Phoenix, Arizona) (Gundersen, 2015). In addition to the nutritional impact of urban food deserts, there is a social dynamic process that affects health disparities in these urban environments. The processes involved in the growth, purchase, preparation, consumption, and sharing—or absence—of food within communities can shape how residents in urban food deserts interact with food (Cannuscio et al., 2010).
Violence, in addition to the resulting injuries and trauma, affects urban regions at higher rates than in other regions. Approximately two-thirds of all U.S. firearm homicides occur in large urban areas, with inner cities as the most affected by firearm homicide (Prevention Institute, 2011). Youth violence is highest in cities (469 per 100,000) and less in metropolitan counties (259 per 100,000) and suburban areas (252 per 100,000) (Levi et al., 2015a). One of the downstream effects of violence is the chronic stress that is associated with living in an unsafe community. In urban areas where violence is pervasive, community-level trauma can manifest in which residents experience psychological trauma, with some exhibiting signs of PTSD (Pinderhughes et al., 2015). According to the Prevention Institute, 35 percent of urban youth exposed to community violence develop PTSD, a rate higher than that among soldiers deployed to combat (Prevention Institute, 2011). Unsafe neighborhoods can also lead to anxiety, depression, and stress, all of which are in turn associated with preterm births and low birth weight (Egerter et al., 2011).
Urban communities have been characterized by a high burden of asthma for decades. For children, specifically, the data reveal higher rates of morbidity due to asthma for those living in crowded, urban neighborhoods (Gern, 2010). This association has been attributed to the presence
of environmental hazards such as pollution, pest allergens, and exposure to indoor and outdoor smoke (Kozyrskyj et al., 2004). However, findings suggest that other factors, such as race, ethnicity, and income, may have more important roles in shaping risk of asthma in children than their physical environment (Keet et al., 2015).
EVIDENCE GAPS
Since the publication of Heckler’s 1985 Report of the Secretary’s Task Force on Black & Minority Health (the Heckler Report) and even the IOM’s 2003 Unequal Treatment: Confronting Racial and Ethnic Disparities in Health Care report, significant progress has been made in the science of health inequities. Scientific progress is evident in the development of conceptual models of the multilevel factors that shape health inequities, a greater standardization and collection of data on race and ethnicity, more sophisticated data analytic tools and methods, and the exponential growth of published studies on health inequities. Adler and colleagues provided a review of progress to date in the field of health inequities and note in detail the scientific advances, challenges, and future directions for research (Adler and Stewart, 2010).
Yet, compared to other fields of health research, health inequities is still a relatively new field. It faces significant research and practical application challenges that need to be addressed in order to offer knowledge that can strategically and accurately inform interventions aimed at reducing or eliminating health inequities.
First, the collection and use of data on race, ethnicity, and language are key parts of the process of identifying health and health care needs and eliminating disparities. Yet, work remains to be done in ensuring that our current data systems capture the appropriate categories and that these are consistently collected across studies and data systems. Toward this aim, in 2009, the IOM report Race, Ethnicity, and Language Data: Standardization for Health Care Quality Improvement proposed templates of granular ethnicity and language categories for national adoption so that entities wishing to collect detailed data can do so in systematic, uniform ways. The Office of Management and Budget (OMB) is currently undertaking a review of the current classifications for race and ethnicity and has issued a call for comments, including on the salience of the terminology used for race and ethnicity classifications and other language in the standard (GPO, 2016b).
Beyond the collection of data on race and ethnicity, a significant challenge has been the lack of sufficiently large samples of some racial and ethnic groups and their subgroups in population-level epidemiological studies such as the National Health and Nutrition Examination Survey
and the National Survey on Drug Use and Health. Insufficiently large samples of some groups (e.g., Native Americans/American Indians, Hispanics and subgroups, and Asian and Pacific Islanders and subgroups) result in unreliable estimates of health indicators and resulting limitations on studies to investigate the factors that contribute to disparities within and across groups. Oversampling of these groups in national epidemiological studies is needed to yield appropriate estimates of health conditions.
Reliable estimates of health indicators can sometimes be derived by collapsing data across years, but this also poses some limitations on tracking health changes over time and providing up-to-date estimates. For smaller and geographically concentrated racial and ethnic groups (which are not well represented in national studies), specialized ongoing periodic studies are needed to track health conditions and the progress in reducing health inequities. For example, the National Latino and Asian American Study, while limited to one administration, provided previously unavailable but highly valuable data on Hispanic and Asian populations (Burnham and Flanigan, 2016).
Beyond race and ethnicity, the 2011 IOM report, The Health of Lesbian, Gay, Bisexual, and Transgender People: Building a Foundation for Better Understanding made recommendations regarding data collection about sexual orientation and gender identity in federal surveys and in electronic health records; implementation of the recommendations will provide essential data to document and monitor progress on LGBT health. For example, questions on sexual orientation and gender identity are included in recent versions of the Behavioral Risk Factor Surveillance Survey (CDC, 2016a).
Second, one of the important areas of knowledge advancement in health disparities research has been the integration of neighborhood-level factors that contribute to or are associated with health inequities. For example, measures of neighborhood-level segregation (e.g., the Diversity Index [National Equity Atlas, 2016], public school segregation [JSRI, 2016], and community diversity and distances between communities with different racial or ethnic profiles [VDH, 2016]); income inequality (National Equity Atlas, 2016; RWJF, 2016a; United Health Foundation, 2016), health equity (e.g., National Equity Atlas: Economic Vitality, Readiness, Connectedness, Economic Growth [National Equity Atlas, 2016]), social cohesion and social capital (e.g., group membership, volunteerism [Opportunity Index, 2016], linguistic isolation [Brandeis University, 2016]), gentrification (e.g., change in median income [United Health Foundation, 2016]), and housing affordability (Brandeis University, 2016) have been developed and used to document the associations and effects of these features of neighborhoods on health and health equity. The integration of these and other neighborhood-level features, if added to existing
epidemiological health studies, could facilitate researchers’ use of these measures in studies of health equity.
An additional challenge is that most studies of the features of the neighborhood environment and their impacts on health and health equity have been cross-sectional and are thus limited in establishing causal relationships (Diez Roux and Mair, 2010). As noted by Diez-Roux and Mair, the field needs longitudinal studies of neighborhood features and their relationships to health outcomes that use statistical controls for baseline differences and longitudinal analyses relating changes in outcomes to changes in predictors. While such studies are still observational, they can employ a number of statistical approaches that are preferable to cross-sectional analyses as they build a case for experimental studies and for rigorous intervention evaluations. Similarly, longitudinal studies of life-course processes on the impacts of neighborhood level factors on health and health equity are needed. For example, in considering residential mobility, Diez Roux and Mair note the limited work on characterizing neighborhood environments across the life course and the need to develop strategies to link cohort data to historical neighborhood data (Diez Roux and Mair, 2010).
Third, health disparity research has developed from a description of associations (e.g., socioeconomic status and health) to mechanisms linking socioeconomic status and health and multilevel influences to more recent work on the interactions among factors (Adler and Stewart, 2010). Yet, epidemiological studies on the factors that contribute to health and health inequities have not yet consistently provided clear answers regarding the most powerful and promising candidate levers to be targeted in community interventions. Although we cannot wait for the science to develop to the point of being able to provide exact answers, pilot interventions need to be based on the best available evidence and to be carefully evaluated with the most rigorous methods possible. However, in order to have a more definitive scientific basis for intervention approaches in this complex arena—with the myriad factors and ways that neighborhood and other factors affect health—a combination of research strategies, including rigorous observation studies, natural experiences or feasible experiments, and simulation studies, is needed (Diez Roux and Mair, 2010). Based on the data presented in this chapter and the current gaps in the evidence, the committee concludes the following:
Conclusion 2-1: To enable researchers to fully document and understand health inequities, to provide the foundation for solution development, and to measure solution outcomes longitudinally, the following are needed:
-
An expansion of current health disparity indicators and indices to include other groups beyond African Americans and whites, such as Hispanics and their major subgroups, Native Americans, Asians, Pacific Islanders, and mixed race, in addition to LGBT individuals, people with disabilities, and military veterans.
- Including consideration of methods to generate stable estimates of disparities through oversampling certain populations where necessary.
- An expansion of metrics and indicators capturing the broader definition of health, including health equity and the social determinants of health.
- Longer-term studies, as many health outcomes take years (or decades) to see quantifiable changes in health outcomes related to the social determinants of health.
- Studies examining the ways in which a single structural factor may influence multiple health outcomes.
- Increased funding opportunities dedicated to developing and testing relevant theory, measures, and scientific methods, with the goal of enhancing the rigor with which investigators examine structural inequities such as structural racism and health disparities.
REFERENCES
Adams, P., and V. Benson. 2015. Tables of summary health statistics for the U.S. population: 2014 National Health Interview Survey: U.S. Centers for Disease Control and Prevention.
Adler, N. E., and J. Stewart. 2010. Health disparities across the lifespan: Meaning, methods, and mechanisms. Annals of the New York Academy of Sciences 1186:5–23.
AHRQ (Agency for Healthcare Research and Quality). 2015. HIV and AIDS: Chartbook on effective treatment. http://www.ahrq.gov/research/findings/nhqrdr/2014chartbooks/effectivetx/eff-hiv.html (accessed October 24, 2016).
AHRQ. 2016. 2015 National Healthcare Quality and Disparities Report and 5th Anniversary Update on the National Quality Strategy. Rockville, MD: Agency for Healthcare Research and Quality. April 2016. AHRQ Pub. No. 16-0015.
American Psychological Association (APA). 2010. APA fact sheet: Mental health disparities: American Indians and Alaska Natives. http://www.integration.samhsa.gov/workforce/mental_health_disparities_american_indian_and_alaskan_natives.pdf (accessed October 21, 2016).
Archi’s Acres Inc. 2016. Cal Poly’s sustainable agriculture training at Archi’s Acres. http://archisacres.com/page/sat-program (accessed October 21, 2016).
Arias, E. 2016. Changes in life expectancy by race and Hispanic origin in the United States, 2013-2014. Hyattsville, MD: National Center for Health Statistics.
Astone, N. M., S. Martin, and L. Aron. 2015. Death rates for U.S. women ages 15–54. Washington, DC: Urban Institute.
Backus, L. I., P. S. Belperio, T. P. Loomis, and L. A. Mole. 2014. Impact of race/ethnicity and gender on HCV screening and prevalence among US veterans in Department of Veterans Affairs care. American Journal of Public Health 104(S4):S555–S561.
Balshem, H., V. Christensen, A. Tuepker, and D. Kansagara. 2011. VA evidence-based synthesis program reports. In A critical review of the literature regarding homelessness among veterans. Washington, DC: U.S. Department of Veterans Affairs. VA-ESP Project #05-225.
Bauer, U. E., and M. Plescia. 2014. Addressing disparities in the health of American Indian and Alaska Native people: The importance of improved public health data. American Journal of Public Health 104(Suppl 3):S255–S257.
Bell, J., and M. M. Lee. 2011. Why place and race matter: Impacting health through a focus on race and place. Oakland, CA: PolicyLink.
Berman, M. 2014. Suicide among young Alaska Native men: Community risk factors and alcohol control. American Journal of Public Health 104(S3):S329–S335.
Blackwell, D. L., J. W. Lucas, and T. C. Clarke. 2014. Summary health statistics for U.S. adults: National Health Interview Survey, 2012. Vital and Health Statistics 10(260). February 2014. National Center for Health Statistics.
Brandeis University. 2016. Diversitydatakids.org. http://www.diversitydatakids.org (accessed October 21, 2016).
Brault, M. W. 2012. Americans with disabilities: 2010. Current Population Reports. July 2012. http://www.census.gov/prod/2012pubs/p70-131.pdf (accessed October 21, 2016).
Brown, T. N. T., and J. L. Herman. 2015. Intimate partner violence and sexual abuse among LGBT people: A review of existing research. Los Angeles, CA: The Williams Institute.
Bull, C. N., J. A. Krout, E. Rathbone-McCuan, and M. J. Shreffler. 2001. Access and issues of equity in remote/rural areas. Journal of Rural Health 17(4):356–359.
Burnham, W. D., and W. Flanigan. 2016. State-level presidential election data for the United States, 1824-1972 (icpsr 0019). http://www.icpsr.umich.edu/icpsrweb/ICPSR/studies/0019 (accessed October 21, 2016).
Burns, M. N., D. T. Ryan, R. Garofalo, M. E. Newcomb, and B. Mustanski. 2015. Mental health disorders in young urban sexual minority men. Journal of Adolescent Health 56(1):52–58.
Byrne, T., A. E. Montgomery, and M. E. Dichter. 2013. Homelessness among female veterans: A systematic review of the literature. Women & Health 53(6):572–596.
Campbell, J. C., and D. Boyd. 2000. Violence against women: Synthesis of research for health care professionals. NCJ 199761. December 2000. Washington, DC: National Institute of Justice.
Cannuscio, C. C., E. E. Weiss, and D. A. Asch. 2010. The contribution of urban foodways to health disparities. Journal of Urban Health 87(3):381–393.
Case, A., and A. Deaton. 2015. Rising morbidity and mortality in midlife among white non-Hispanic Americans in the 21st century. Proceedings of the National Academy of Sciences of the United States of America 112(49):15078–15083.
CDC (U.S. Centers for Disease Control and Prevention). 2010a. Prevalence and awareness of HIV infection among men who have sex with men—21 cities, United States, 2008. Morbidity and Mortality Weekly Report 59(37):1201–1207.
CDC. 2010b. Quickstats: Delayed or forgone medical care because of cost concerns among adults aged 18–64 years, by disability and health insurance coverage status—National Health Interview Survey, United States, 2009. Morbidity and Mortality Weekly Report 59(44). http://www.cdc.gov/mmwr/preview/mmwrhtml/mm5944a7.htm (accessed December 7, 2016).
CDC. 2013a. CDC health disparities and inequalities report: United States, 2013. Morbidity and Mortality Weekly Report 62(Suppl 3).
CDC. 2013b. Leading causes of death by age group, race/ethnicity males, United States, 2013. http://www.cdc.gov/men/lcod/2013/Race_ethnicityMen2013.pdf (accessed October 21, 2016).
CDC. 2013c. Leading causes of death by race/ethnicity, all females, United States, 2013. https://www.cdc.gov/women/lcod/2013/womenrace_2013.pdf (accessed October 21, 2016).
CDC. 2013d. Leading causes of death by race/ethnicity, all males, United States, 2013. http://www.cdc.gov/men/lcod/2013/Race_ethnicityMen2013.pdf (accessed November 2, 2016).
CDC. 2014a. African Americans heart disease and stroke fact sheet. http://www.cdc.gov/dhdsp/data_statistics/fact_sheets/fs_aa.htm (accessed December 7, 2016).
CDC. 2014b. Cigarette smoking among adults with disabilities. http://www.cdc.gov/ncbddd/disabilityandhealth/smoking-in-adults.html (accessed December 7, 2016).
CDC. 2015. Common barriers to participation experienced by people with disabilities. http://www.cdc.gov/ncbddd/disabilityandhealth/disability-barriers.html (accessed October 21, 2016).
CDC. 2016a. BRFSS questionnaires. http://www.cdc.gov/brfss/questionnaires (accessed October 21, 2016).
CDC. 2016b. Common barriers to participation experienced by people with disabilities. http://www.cdc.gov/ncbddd/disabilityandhealth/disability-barriers.html (accessed December 7, 2016).
CDC. 2016c. Disability and obesity. http://www.cdc.gov/ncbddd/disabilityandhealth/obesity.html (accessed December 7, 2016).
CDC. 2016d. Half of black gay men and a quarter of Latino gay men projected to be diagnosed within their lifetime. http://www.cdc.gov/nchhstp/newsroom/2016/croi-press-release-risk.html (accessed October 21, 2016).
Center for American Progress and Movement Advancement Project. 2015. Paying an unfair price: The financial penalty for being transgender in America. Washington, DC: Center for American Progress; Denver, CO: Movement Advancement Project.
Cho, P., L. S. Geiss, N. Rios Burrows, D. L. Roberts, A. K. Bullock, and M. E. Toedt. 2014. Diabetes-related mortality among American Indians and Alaska Natives, 1990–2009. American Journal of Public Health 104(S3):S496–S503.
Colby, S. L., and J. M. Ortman. 2014. Projections of the size and composition of the U.S. population: 2014 to 2060. Washington, DC: U.S. Census Bureau.
Courtney-Long, E. A., D. D. Carroll, Q. C. Zhang, A. C. Stevens, S. Griffin-Blake, B. S. Armour, and V. A. Campbell. 2015. Prevalence of disability and disability type among adults—United States, 2013. Morbidity and Mortality Weekly Report 64(29):777–783.
CREC and WVU (Center for Regional Economic Competitiveness and West Virginia University). 2015. Appalachia then and now: Examining changes to the Appalachian region since 1965. Appalachian Regional Commission.
Crosby, R. A., M. L. Wendel, R. C. Vanderpool, and B. R. Casey. 2012. Rural populations and health: Determinants, disparities, and solutions. San Francisco, CA: Jossey-Bass.
Cunradi, C. B., R. Caetano, C. Clark, and J. Schafer. 2000. Neighborhood poverty as a predictor of intimate partner violence among white, black, and Hispanic couples in the United States: A multilevel analysis. Annals of Epidemiology 10(5):297–308.
dickey, l. m., S. L. Budge, S. L. Katz-Wise, and M. V. Garza. 2016. Health disparities in the transgender community: Exploring differences in insurance coverage. Psychology of Sexual Orientation and Gender Diversity 3(3):275–282.
Diez Roux, A. V., and C. Mair. 2010. Neighborhoods and health. Annals of the New York Academy of Sciences 1186(1):125–145.
Eaton, N. R. 2012. Testing gender and ethnicity invariance of the comorbidity structure of common mental disorders. PhD diss. University of Minnesota, Minneapolis. http://conservancy.umn.edu/bitstream/handle/11299/136815/Eaton_umn_0130E_12995.pdf?sequence=1 (accessed October 21, 2016).
Eberhardt, M. S., and E. R. Pamuk. 2004. The importance of place of residence: Examining health in rural and nonrural areas. American Journal of Public Health 94(10):1682–1686.
Egerter, S., C. Barclay, R. Grossman-Kahn, and P. A. Braveman. 2011. Violence, social disadvantage and health. Princeton, NJ: Robert Wood Johnson Foundation.
Espey, D. K., M. A. Jim, N. Cobb, M. Bartholomew, T. Becker, D. Haverkamp, and M. Plescia. 2014. Leading causes of death and all-cause mortality in American Indians and Alaska Natives. American Journal of Public Health 104(Suppl 3):S303–S311.
Evans, B. F., E. Zimmerman, S. H. Woolf, and A. D. Haley. 2012. Social determinants of health and crime in post-Katrina Orleans Parish: Technical report. Richmond, VA: Center on Humans Needs, Virginia Commonwealth University. http://www.societyhealth.vcu.edu/media/society-health/pdf/PMReport_Orleans_Parish.pdf (accessed October 21, 2016).
Ford, C. L., T. Slavin, K. L. Hilton, and S. L. Holt. 2013. Intimate partner violence prevention services and resources in Los Angeles: Issues, needs, and challenges for assisting lesbian, gay, bisexual, and transgender clients. Health Promotion Practice 14(6):841–849.
Garcia, D., G. Betancourt, and L. Scaccabarrozzi. 2015. The state of HIV/AIDS among Hispanics/Latinos in the U.S. and Puerto Rico. New York: Latino Commission on AIDS. https://www.fpcouncil.com/sites/fpcouncil.com/files/files/HIVbrief2015_Eng.pdf (accessed October 21, 2016).
Garofalo, R., and S. Bush. 2008. Addressing LGBTQ youth in the clinical setting. In Fenway guide to lesbian, gay, bisexual, and transgender health, edited by H. Makadon, K. H. Mayer, J. Potter, and H. Goldhammer. Philadelphia, PA: American College of Physicans. Pp. 75–99.
Gern, J. E. 2010. The urban environment and childhood asthma study. The Journal of Allergy and Clinical Immunology 125(3):545–549.
GPO (Government Publishing Office). 2016a. Indian entities recognized and eligible to receive services from the United States Bureau of Indian Affairs. Federal Register 81(86). https://www.gpo.gov/fdsys/pkg/FR-2016-05-04/pdf/2016-10408.pdf (accessed October 21, 2016).
GPO. 2016b. Standards for maintaining, collecting, and presenting federal data on race and ethnicity. Federal Register 81(190):67398-67401. https://www.whitehouse.gov/sites/default/files/omb/inforeg/directive15/race-ethnicity_directive_2016FRN1.pdf (accessed October 21, 2016).
Graham, H. 2004. Social determinants and their unequal distribution: Clarifying policy understandings. Milbank Q 82(1):101–124.
Grant, J., L. Mottet, and J. Tanis. 2011. National transgender discrimination survey report on health and health care. Washington, DC: National Center for Transgender Equality and National Gay and Lesbian Task Force.
Gundersen, C. 2015. Map the meal gap 2016: Highlights and findings for overall and child food security. Chicago, IL: Feeding America.
Hamilton, B. E., and S. J. Ventura. 2012. Birth rates for U.S. teenagers reach historic lows for all age and ethnic groups. NCHS data brief 89. http://www.cdc.gov/nchs/data/databriefs/db89.pdf (accessed October 21, 2016).
Hamilton, B. E., J. A. Martin, and M. J. K. Osterman. 2016. Births: Preliminary data for 2015. National Vital Statistics Reports 65(3). http://www.cdc.gov/nchs/data/nvsr/nvsr65/nvsr65_03.pdf (accessed October 21, 2016).
Hansen, E., and M. Donohoe. 2003. Health issues of migrant and seasonal farmworkers. Journal of Health Care for the Poor and Underserved 14(2):153–164.
Healthy People 2020. 2016. Healthypeople 2020. https://www.healthypeople.gov (accessed October 21, 2016).
Heckler, M. M. 1985. Report of the Secretary’s Task Force on Black & Minority Health. Volume 1: Executive summary. Washington, DC: U.S. Department of Health and Human Services.
Henning-Smith, C., G. Gonzales, and T. P. Shippee. 2015. Differences by sexual orientation in expectations about future long-term care needs among adults 40 to 65 years old. American Journal of Public Health 105(11):2359–2365.
Herek, G. M. 2009. Hate crimes and stigma-related experiences among sexual minority adults in the United States: Prevalence estimates from a national probability sample. Journal of Interpersonal Violence 24(1):54–74.
Herne, M. A., M. L. Bartholomew, and R. L. Weahkee. 2014. Suicide mortality among American Indians and Alaska Natives, 1999-2009. American Journal of Public Health 104(Suppl 3):S336–S342.
HHS (U.S. Department of Health and Human Services). 2011. Lesbian, gay, bisexual, and transgender health. https://www.healthypeople.gov/2020/topics-objectives/topic/lesbian-gay-bisexual-and-transgender-health?topicid=25 (accessed October 21, 2016).
HHS. 2014. Infant mortality disparities fact sheets. http://minorityhealth.hhs.gov/omh/content.aspx?ID=6907&lvl=3&lvlID=8 (accessed October 21, 2016).
HHS. 2015. Profile: Hispanic/Latino Americans. http://minorityhealth.hhs.gov/omh/browse.aspx?lvl=3&lvlid=64 (accessed October 24, 2016).
HHS. 2016a. Disability and health. https://www.healthypeople.gov/2020/topics-objectives/topic/disability-and-health (accessed October 21, 2016).
HHS. 2016b. Heart disease and African Americans. http://minorityhealth.hhs.gov/omh/browse.aspx?lvl=4&lvlid=19 (accessed October 24, 2016).
HHS. 2016c. Profile: American Indian/Alaska Native. http://minorityhealth.hhs.gov/omh/browse.aspx?lvl=3&lvlid=62 (accessed August 25, 2016).
HHS. 2016d. Stroke and African Americans. http://minorityhealth.hhs.gov/omh/browse.aspx?lvl=4&lvlid=28 (accessed December 7, 2016).
Holland, A. T., and L. P. Palaniappan. 2012. Problems with the collection and interpretation of Asian-American health data: Omission, aggregation, and extrapolation. Annals of Epidemiology 22(6):397–405.
HUD (U.S. Department of Housing and Urban Development). 2016. 2016 PIT Estimate of veteran homelessness in the U.S. https://www.hudexchange.info/resource/5114/2016-pit-estimate-of-veteran-homelessness-in-the-us/ (accessed September 7, 2016).
IOM (Institute of Medicine). 2003. Unequal treatment: Confronting racial and ethnic disparities in health care. Washington, DC: The National Academies Press.
IOM. 2009. Race, ethnicity, and language data: Standardization for health care quality improvement. Washington, DC: The National Academies Press.
IOM. 2010. Women’s health research: Progress, pitfalls, and promise. Washington, DC: The National Academies Press.
IOM. 2011. The health of lesbian, gay, bisexual, and transgender people: Building a foundation for better understanding. Washington, DC: The National Academies Press.
IOM. 2012. Treatment for posttraumatic stress disorder in military and veteran populations: Initial assessment. Washington, DC: The National Academies Press.
James, M. 2016. Race. In The Stanford encyclopedia of philosophy, edited by E. N. Zalta. Stanford, CA: Stanford University.
Jernigan, V. B. B., M. Peercy, D. Branam, B. Saunkeah, D. Wharton, M. Winkleby, J. Lowe, A. L. Salvatore, D. Dickerson, A. Belcourt, E. D’Amico, C. A. Patten, M. Parker, B. Duran, R. Harris, and D. Buchwald. 2015. Beyond health equity: Achieving wellness within American Indian and Alaska Native communities. American Journal of Public Health 105(S3):S376–S379.
Jim, M. A., E. Arias, D. S. Seneca, M. J. Hoopes, C. C. Jim, N. J. Johnson, and C. L. Wiggins. 2014. Racial misclassification of American Indians and Alaska Natives by Indian Health Service contract health service delivery area. American Journal of Public Health 104(Suppl 3):S295–S302.
JSRI (Jesuit Social Research Institute). 2016. Inaugural JustSouth index 2016. http://www.loyno.edu/jsri/news/inaugural-justsouth-index-2016 (accessed October 21, 2016).
Kang, H. K., T. A. Bullman, D. J. Smolenski, N. A. Skopp, G. A. Gahm, and M. A. Reger. 2015. Suicide risk among 1.3 million veterans who were on active duty during the Iraq and Afghanistan Wars. Annals of Epidemiology 25(2):96–100.
Kaufman, R. 2008. Introduction to transgender identity and health. In Fenway guide to lesbian, gay, bisexual, and transgender health, edited by H. J. Makadon, K. H. Mayer, J. Potter, and H. Goldhammer. Philadelphia, PA: American College of Physicans.
Keet, C. A., M. C. McCormack, C. E. Pollack, R. D. Peng, E. McGowan, and E. C. Matsui. 2015. Neighborhood poverty, urban residence, race/ethnicity, and asthma: Rethinking the inner-city asthma epidemic. Journal of Allergy and Clinical Immunology 135(3):655–662.
Kelley, A., A. Belcourt-Dittloff, C. Belcourt, and G. Belcourt. 2013. Research ethics and indigenous communities. American Journal of Public Health 103(12):2146–2152.
Kindig, D. A., and E. R. Cheng. 2013. Even as mortality fell in most U.S. counties, female mortality nonetheless rose in 42.8 percent of counties from 1992 to 2006. Health Affairs 32(3):451–458.
Klingensmith, K., J. Tsai, N. Mota, S. M. Southwick, and R. H. Pietrzak. 2014. Military sexual trauma in U.S. veterans: Results from the National Health and Resilience in Veterans Study. Journal of Clinical Psychiatry 75(10):e1133–e1139.
Kozyrskyj, A. L., C. A. Mustard, and A. B. Becker. 2004. Identifying children with persistent asthma from health care administrative records. Canadian Respiratory Journal 11(2):141–145.
Krahn, G. L., D. K. Walker, and R. Correa-De-Araujo. 2015. Persons with disabilities as an unrecognized health disparity population. American Journal of Public Health 105(Suppl 2):S198–S206.
Kulkarni, S. C., A. Levin-Rector, M. Ezzati, and C. J. Murray. 2011. Falling behind: Life expectancy in U.S. counties from 2000 to 2007 in an international context. Population Health Metrics 9(1):16.
Landen, M., J. Roeber, T. Naimi, L. Nielsen, and M. Sewell. 2014. Alcohol-attributable mortality among American Indians and Alaska Natives in the United States, 1999-2009. American Journal of Public Health 104(S3):S343–S349.
Lara, M., R. Health, and C. Rand. 2005. Acculturation and Latino health in the United States: A review of the literature and its sociopolitical context. Santa Monica, CA: RAND Corporation.
LaVeist, T., K. Pollack, R. Thorpe, Jr., R. Fesahazion, and D. Gaskin. 2011. Place, not race: Disparities dissipate in southwest Baltimore when blacks and whites live under similar conditions. Health Affairs 30(10):1880–1887.
Lawrence, A. A. 2007. Transgender health concerns. In The health of sexual minorities: Public health perspectives on lesbian, gay, bisexual and transgender populations, edited by I. H. Meyer and M. E. Northridge. New York: Springer. Pp. 355–374.
Levi, J., L. M. Segal, and A. Martin. 2015a. The facts hurt: A state-by-state injury prevention policy report. Washington, DC: Trust for America’s Health.
Levi, J., L. M. Segal, J. Rayburn, and A. Martin. 2015b. The state of obesity: Better policies for a healthier America 2015. Washington, DC: Trust for America’s Health and Robert Wood Johnson Foundation.
Levine, R. S., J. E. Foster, R. E. Fullilove, M. T. Fullilove, N. C. Briggs, P. C. Hull, B. A. Husaini, and C. H. Hennekens. 2001. Black-white inequalities in mortality and life expectancy, 1933-1999: Implications for Healthy People 2010. Public Health Reports 116:474–483.
Levine, R. S., N. C. Briggs, B. S. Kilbourne, W. D. King, Y. Fry-Johnson, P. T. Baltrus, B. A. Husaini, and G. S. Rust. 2007. Black-white mortality from HIV in the United States before and after introduction of highly active antiretroviral therapy in 1996. American Journal of Public Health 97(10):1884–1892.
Makadon, H. J., K. H. Mayer, J. Potter, and H. Goldhammer. 2008. Fenway guide to lesbian, gay, bisexual, and transgender health. Philadelphia, PA: American College of Physicians.
Mathews, T. J., M. F. MacDorman, and M. E. Thoma. 2015. Infant mortality statistics from the 2013 period linked birth/infant death data set. National Vital Statistics Reports 64(9). Hyattsville, MD: National Center for Health Statistics.
McGarvey, E. L., M. Leon-Verdin, L. F. Killos, T. Guterbock, and W. F. Cohn. 2011. Health disparities between Appalachian and non-Appalachian counties in Virginia USA. Journal of Community Health 36(3):348–356.
Mondragon, S. A., D. Wang, L. Pritchett, D. P. Graham, M. L. Plasencia, and E. J. Teng. 2015. The influence of military sexual trauma on returning OEF/OIF male veterans. Psychological Services 12(4):402–411.
NASEM (National Academies of Sciences, Engineering, and Medicine). 2015. The growing gap in life expectancy by income: Implications for federal programs and policy responses. Washington, DC: The National Academies Press.
NASEM. 2016a. Improving the health of women in the United States: Workshop summary. Washington, DC: The National Academies Press.
NASEM. 2016b. Workshop on the intersections among health disparities, disabilities, health equity, and health literacy. http://www.nationalacademies.org/hmd/Activities/PublicHealth/HealthLiteracy/2016-JUN-14.aspx (accessed October 21, 2016).
National Equity Atlas. 2016. National Equity Atlas. http://nationalequityatlas.org (accessed October 21, 2016).
NCFH (National Center for Farmworker Health). 2009. Migrant and seasonal farmworker demographics. http://www.unctv.org/content/sites/default/files/0000011508-fs-Migrant%20Demographics.pdf (accessed October 21, 2016).
NCHS (National Center for Health Statistics). 2016. Health, United States, 2015: With special feature on racial and ethnic health disparities. Hyattsville, MD: National Center for Health Statistics.
NIH (National Institutes of Health). 2014. Health disparities. http://www.nhlbi.nih.gov/health/educational/healthdisp (accessed November 2, 2016).
Norris, T., P. L. Vines, and E. M. Hoeffel. 2012. The American Indian and Alaska Native population: 2010 census brief. Washington, DC: U.S. Census Bureau.
NRC and IOM (National Research Council and Institute of Medicine). 2013. U.S. health in international perspective: Shorter lives, poorer health. Washington, DC: The National Academies Press.
O’Brien, B. S., and L. Sher. 2013. Military sexual trauma as a determinant in the development of mental and physical illness in male and female veterans. International Journal of Adolescent Medicine and Health 25(3):269–274.
Office for Victims of Crime. n.d. Responding to transgender victims of sexual assault. https://www.ovc.gov/pubs/forge/sexual_numbers.html (accessed December 7, 2016).
O’Hanlan, K. A., and C. M. Isler. 2007. Health care of lesbian and bisexual women. In The health of sexual minorities: Public health perspectives on lesbian, gay, bisexual and transgender populations, edited by I. H. Meyer and M. E. Northridge. New York: Springer. Pp. 506–522.
Opportunity Index. 2016. Opportunity Index. http://opportunityindex.org (accessed October 21, 2016).
Oreskovich, J., and H. Zimmerman. 2012. Defining disability: A comparison of disability prevalence estimates produced by BRFSS and other data sources. Montana Fact[or]s (1). https://dphhs.mt.gov/Portals/85/publichealth/documents/BRFSS/Factors/2012Factors1.pdf (accessed Ocrober 21, 2016).
Pinderhughes, H., R. A. Davis, and M. Williams. 2015. Adverse community experiences and resilience: A framework for addressing and preventing community trauma. Oakland, CA: Prevention Institute.
Pollard, K., and L. A. Jacobsen. 2016. The Appalachian region: A data overview from the 2010–2014 American Community Survey chartbook. Appalachian Regional Commission and Population Reference Bureau.
Prevention Institute. 2011. Fact sheet: Links between violence and health equity. Oakland, CA: Prevention Institute. https://www.preventioninstitute.org/sites/default/files/publications/Fact%20Sheet--Links%20Between%20Violence%20and%20Health%20Equity.pdf (accessed October 12, 2016).
Reichard, A., and H. Stolzle. 2011. Diabetes among adults with cognitive limitations compared to individuals with no cognitive disabilities. Intellectual and Developmental Disabilities 49(3):141–154.
Reichard, A., H. Stolzle, and M. H. Fox. 2011. Health disparities among adults with physical disabilities or cognitive limitations compared to individuals with no disabilities in the United States. Disability and Health Journal 4(2):59–67.
Reisner, S. L., Z. Bailey, and J. Sevelius. 2014. Racial/ethnic disparities in history of incarceration, experiences of victimization, and associated health indicators among transgender women in the U.S. Women’s Health 54(8):750–767.
Rhoades, E. R., and D. A. Rhoades. 2014. The public health foundation of health services for American Indians and Alaska Natives. American Journal of Public Health 104(S3): S278–S285.
Roberts, S. J., E. M. Stuart-Shor, and R. A. Oppenheimer. 2010. Lesbians’ attitudes and beliefs regarding overweight and weight reduction. Journal of Clinical Nursing 19(13–14): 1986–1994.
Robinson, J. P., and D. L. Espelage. 2013. Peer victimization and sexual risk differences between lesbian, gay, bisexual, transgender, or questioning and nontransgender heterosexual youths in grades 7–12. American Journal of Public Health 103(10):1810–1819.
Rothman, E. F., D. Exner, and A. L. Baughman. 2011. The prevalence of sexual assault against people who identify as gay, lesbian, or bisexual in the United States: A systematic review. Trauma, Violence & Abuse 12(2):55–66.
Ruble, M. W., and M. Forstein. 2008. Mental health: Epidemiology, assessment and treatment. In Fenway guide to lesbian, gay, bisexual, and transgender health, edited by H. J. Makadon, K. H. Mayer, J. Potter, and H. Goldhammer. Philadelphia, PA: American College of Physicians. Pp. 75–99.
RWJF (Robert Wood Johnson Foundation). 2013a. Metro map: Kansas City, Missouri. http://www.rwjf.org/en/library/infographics/kansas-city-map.html (accessed October 21, 2016).
RWJF. 2013b. Metro map: New Orleans, Louisiana. http://www.rwjf.org/en/library/infographics/new-orleans-map.html (accessed October 21, 2016).
RWJF. 2015. Menominee Nation, WI: 2015 culture of health prize winner. http://www.rwjf.org/en/library/articles-and-news/2015/10/coh-prize-menominee-wi.html (accessed October 21, 2016).
RWJF. 2016a. County Health Rankings & Roadmaps: Our approach. http://www.countyhealthrankings.org/our-approach (accessed October 21, 2016).
Ryan, C. L., and K. Bauman. 2016. Educational attainment in the United States: 2015. Current Population Reports. P20-578. March 2016. http://www.census.gov/content/dam/Census/library/publications/2016/demo/p20-578.pdf (accessed October 21, 2016).
Saha, S., M. Freeman, J. Toure, K. M. Tippens, and C. Weeks. 2007. VA evidence-based synthesis program reports. In Racial and ethnic disparities in the VA healthcare system: A systematic review. Washington, DC: U.S. Department of Veterans Affairs.
SAMHSA (Substance Abuse and Mental Health Services Administration). 2015a. 2014 National Survey on Drug Use and Health: Detailed tables: Prevalence estimates, standard errors, p values, and sample sizes. Rockville, MD: Center for Behavioral Health Statistics and Quality, Substance Abuse and Mental Health Services Administration.
SAMHSA. 2015b. Behavioral health trends in the United States: Results from the 2014 National Survey on Drug Use and Health (HHS publication no. SMA 15-4927, NSDUH series H-50). Rockville, MD: Center for Behavioral Health Statistics and Quality, Substance Abuse and Mental Health Services Administration.
Sausa, L. A., J. Keatley, and D. Operario. 2007. Perceived risks and benefits of sex work among transgender women of color in San Francisco. Archives of Sexual Behavior 36(6):768-777.
Schulz, L. O., P. H. Bennett, E. Ravussin, J. R. Kidd, K. K. Kidd, J. Esparza, and M. E. Valencia. 2006. Effects of traditional and western environments on prevalence of type 2 diabetes in Pima Indians in Mexico and the U.S. Diabetes Care 29(8):1866–1871.
Singh, G. K., and M. Siahpush. 2014. Widening rural-urban disparities in life expectancy, U.S., 1969–2009. American Journal of Preventive Medicine 46(2):e19–e29.
Smedley, B., M. Jeffries, L. Adelman, and J. Cheng. 2008. Race, racial inequality and health inequities: Separating myth from fact. http://www.unnaturalcauses.org/assets/uploads/file/Race_Racial_Inequality_Health.pdf (accessed October 21, 2016).
Stand for the Troops Inc. 2016. Stand for the troops: Archi’s Acres—sustainable employment for veterans through sustainable agriculture. http://sftt.org/blog/ptsd/archis-acres-sustainable-employment (accessed October 21, 2016).
Tjaden, P., and N. Thoennes. 2000. Extent, nature, and consequences of intimate partner violence: Findings from the National Violence Against Women Survey. NCJ 181867. https://www.ncjrs.gov/pdffiles1/nij/181867.pdf (accessed October 21, 2016).
Tsai, J., and R. A. Rosenheck. 2015. Risk factors for homelessness among U.S. veterans. Epi-demiologic Reviews 37:177–195.
United Health Foundation. 2016. America’s health rankings: Health of those who have served report: 2016. Minneapolis, MN: United Health Foundation. http://assets.americashealthrankings.org/app/uploads/htwhs_report_r3.pdf (accessed October 21, 2016).
UWPHI (University of Wisconsin Population Health Institute). 2016. County Health Rankings & Roadmaps. http://www.countyhealthrankings.org (accessed October 21, 2016).
VA (U.S. Department of Veterans Affairs). 2016. Suicide among veterans and other Americans 2001–2014. http://www.mentalhealth.va.gov/docs/2016suicidedatareport.pdf (accessed December 20, 2016).
van den Berk-Clark, C., and J. McGuire. 2013. Elderly homeless veterans in Los Angeles: Chronicity and precipitants of homelessness. American Journal of Preventive Medicine 103(Suppl 2):S232–S238.
VanOrman, A., and B. Jarosz. 2016. Suicide replaces homicide as second-leading cause of death among U.S. teenagers. Washington, DC: Population Reference Bureau.
VDH (Virginia Department of Health). 2016. Virginia health opportunity index (HOI). https://www.vdh.virginia.gov/OMHHE/policyanalysis/virginiahoi.htm (accessed October 21, 2016).
Veazie, M., C. Ayala, L. J. Schieb, S. Dai, J. Henderson, and P. Cho. 2014. Trends and disparities in heart disease mortality among American Indians/Alaska Natives, 1990–2009. American Journal of Public Health 104(S3):S359–S367.
Wallace, S. P., S. D. Cochran, E. M. Durazo, and C. L. Ford. 2011. The health of aging lesbian, gay and bisexual adults in California. Health policy research brief. UCLA Center for Health Policy Research (March):1–8.
Walters, M. L., J. Chen, and M. J. Breiding. 2013. The National Intimate Partner and Sexual Violence Survey (NISVS): 2010 findings on victimization by sexual orientation. Atlanta, GA: National Center for Injury Prevention and Control Division of Violence Prevention, U.S. Centers for Disease Control and Prevention.
White, M. C., D. K. Espey, J. Swan, C. L. Wiggins, C. Eheman, and J. S. Kaur. 2014. Disparities in cancer mortality and incidence among American Indians and Alaska Natives in the United States. American Journal of Public Health 104(S3):S377–S387.
WHO (World Health Organization). 2001. International classification of functioning, disability, and health. http://www.who.int/classifications/icf/en (accessed November 2, 2016).
WHO. 2016. Disability and health. http://www.who.int/mediacentre/factsheets/fs352/en (accessed December 7, 2016).
Williams, D. R., S. A. Mohammed, J. Leavell, and C. Collins. 2010. Race, socioeconomic status, and health: Complexities, ongoing challenges, and research opportunities. Annals of the New York Academy of Sciences 1186:69–101.
Wong, S. T., and S. Regan. 2009. Patient perspectives on primary health care in rural communities: Effects of geography on access, continuity and efficiency. Rural and Remote Health 9(1):1142.
Xu, J. Q., S. L. Murphy, K. D. Kochanek, and E. Arias. 2016. Mortality in the United States, 2015. NCHS data brief, no. 267 Hyattsville, MD: National Center for Health Statistics.
Yao, N., S. A. Matthews, and M. M. Hillemeier. 2012. White infant mortality in Appalachian states, 1976-1980 and 1996-2000: Changing patterns and persistent disparities. Journal of Rural Health 28(2):174–182.
Zarembo, A. 2013. Death rate unusally high for young veterans. Los Angeles Times, December 17, 2013. http://www.latimes.com/local/la-me-veteran-deaths-20131217-dto-htmlstory.html (accessed December 20, 2016).
Zimmerman, E., and S. H. Woolf. 2014. Understanding the relationship between education and health. National Academy of Medicine Discussion Paper. https://nam.edu/perspectives-2014-understanding-the-relationship-between-education-and-health (accessed October 21, 2016).
This page intentionally left blank.


