
5
Data Sources and Methods
INTRODUCTION
We can be confident that technologies and applications for digitization and automation will continue to advance. However, it is difficult to predict the exact nature of these advances, much less their myriad effects on the U.S. workforce. This underscores the need for careful and timely evaluation and monitoring of trends in technology and the workforce, and for an improved understanding of the relationship between the two. Such analyses will rely heavily on data, and new data sets and analyses may be needed or become available as the landscape continues to change.
Today, a variety of data sets exist that contain important information about technology, workers, employment, and the national economy. In particular, federal statistical agencies have been the predominant source for national-level collection of economic, employment, and demographic data about individuals and businesses. Additional data are increasingly being collected by other means, both in the private sector and by academic researchers. Such data range from “naturally occurring” data, created and saved as a byproduct of digital transactions, to detailed case studies of a work process or environment, obtained by methodical, scientific observation of employees at work. All of these categories of information present both advantages and challenges.
In this chapter, the committee discusses (1) key existing federal data sets and how they inform understanding of the impact of technology on the U.S. labor market and the economy at large; (2) emerging data sources
and analytical tools that are increasingly enabled by the Internet and digitization of information; (3) the use of ethnographic and other qualitative data for understanding causality, and (4) strategies for quantifying technological advancement and its ability to automate work functions. The committee then addresses the value of integrating these diverse data sets to better understand the implications of technology in the changing workforce, both from the top down and the bottom up.
DATA FROM FEDERAL STATISTICAL AGENCIES
The U.S. government collects important economic and employment data that have been critical for understanding workforce trends and the changing nature of firms and workplaces.
There are three primary and general federal statistical agencies: the Bureau of the Census, the Bureau of Economic Analysis (BEA), and the Bureau of Labor Statistics (BLS); additional federal statistical agencies are dedicated to particular sectors or activity of specific types, such as the National Center for Health Statistics (NCHS).
The agencies collect data via surveys on both households and businesses, yielding statistics that are made available to the public and aggregated at the national, state, local, and industry levels. Tabulations at these levels are further classified by worker characteristics, such as demographics and education, and firm characteristics, such as firm size and firm age. Individual-level data from household surveys are also released to the public in aggregate to protect privacy and confidentiality. The data collected and statistics produced from these surveys are used to generate key national economic indicators such as gross domestic product (GDP), productivity, employment, unemployment, and inflation.
In addition, federal agencies obtain administrative data as byproducts of various programs and activities, such as household and business tax collection and related filings or other transactions or record keeping. Core administrative data are housed at the Internal Revenue Service and Social Security Administration, both of which have statistical arms that provide important measures of economic activity; much of these data are also provided to the Census Bureau.
The Confidential Information Protection and Statistical Efficiency Act of 2002 (44 U.S.C. § 101) standardized the privacy and confidentiality protections of data collected by the three major federal statistical agencies and enabled limited data sharing. However, this legislation does not permit the business tax data used by the Census Bureau to be shared with BLS and BEA, and thus impedes the integration of these data into a common framework to improve the quality of key indicators, such as the GDP,
and enable new discoveries. Furthermore, researchers must query these organizations individually and may encounter data gaps.
In recent years, some repositories of key administrative data have been made available to the research community on a restricted-use basis. For example, the Federal Statistical Research Data Centers, funded jointly by the Census Bureau and the National Science Foundation, allow approved research institutions to access census and NCHS data for statistical use; other agencies, such as BLS, are scheduled to join this system. Studying restricted-use data at the household and business level has already proven essential for improving understanding of changing workforce trends and the changing nature of employer-employee relationships. Further integration of these and other alternative data sources on workers and firms has great promise for enabling future research, as discussed in research theme 8 in Chapter 6. The goals for and benefits of reuse of federal administrative data for statistical purposes are discussed extensively in Fiscal Year 2016: Analytical Perspectives of the U.S. Government, a deeper analysis of content in the 2016 budget request.1
Changes in technology and automation are both facilitating and generating new challenges for collecting and producing core economic indicators from the U.S. statistical system. IT enables processing and integration of large-scale administrative data with traditional survey data in unprecedented ways. In addition, data can be collected from households and businesses electronically rather than simply through paper forms. However, response rates on surveys by both households and businesses are declining, even when respondents use digital methods. Given these challenges, the statistical agencies are beginning to explore naturally occurring data from the private sector (e.g., transactions or scanner data in the retail trade sector). Fortuitously, the digital data revolution is creating a wealth of such naturally occurring data and providing new opportunities for more timely and comprehensive data for tracking economic activity. The future of economic statistics is likely to involve partnerships between the public and private sector.
For the purposes of this study, while current surveys and administrative data provide a wealth of information for tracking workforce trends and the changing nature of firms and the workplace, this information does not provide much contextual information about the evolving workplace. In the discussion of data sources below, the committee addresses how contextual information could be acquired and integrated into these sources. Sometimes this is through supplemental modules on surveys,
___________________
1 Office of Management and Budget, Fiscal Year 2016: Analytical Perspectives of the U.S. Government, 2015, https://www.whitehouse.gov/sites/default/files/omb/budget/fy2016/assets/spec.pdf, Chapters 7 and 16.
and sometimes it is by integrating data from other sources, including the private sector.
The following sections describe key federal databases, the types of data they contain and how they were collected, their curation and access models, and the infrastructure that supports them. The utility of each data set as well as the challenges faced by researchers using the data are discussed.
Current Establishment Survey and the Quarterly Census of Employment and Wages
The Current Establishment Survey (CES), often called the “payroll survey,” is the core source of key national, industry, and regional indicators of earnings and employment for the United States. It is a monthly survey of approximately 300,000 establishments tracking earnings, hours, and employment statistics for wage and salary workers, administered by BLS. Survey enrollment is conducted over the phone, with data subsequently collected each month via computer-assisted telephone interviewing or self-reporting via touch-tone phone entry, fax, Web collection, or electronic data interchange.2 The CES provides a monthly picture of wage and salary earnings and employment dynamics for the U.S. private, nonfarm sector, to supplement the Quarterly Census of Employment and Wages (QCEW), a comprehensive data set (or “universe file”) generated from administrative data on all private, nonfarm establishments in the United States. CES data are generally used to evaluate monthly employment and earnings growth rates, rather than absolute levels, and are annually benchmarked (or normalized) to the more comprehensive QCEW.
The CES, the QCEW, and related sources (such as county business patterns) are used to track the changing industrial structure of employment activity in the United States. For example, these data have been used to track the shift away from goods production to services in detail by sector and location.
Current Population Survey, Decennial Censuses, and the American Community Survey
The Current Population Survey (CPS) is the primary household survey used to track the monthly labor market activity of individuals. The survey is conducted in person or by phone by the Census Bureau on behalf of the BLS, reaching approximately 60,000 households every month. The
___________________
2 Bureau of Labor Statistics, 2016, “Current Employment Statistics—CES (National),” http://www.bls.gov/web/empsit/cesfaq.htm, accessed April 2016.
CPS is used to produce key indicators such as the unemployment rate, the employment-to-population ratio, measures of wages, and hours per worker. The CPS covers all forms of work, including workers engaged in wage and salary employment as well as those who are self-employed and those who are unemployed but actively seeking employment, in contrast to the CES, which only covers employees of industries that are covered by unemployment insurance. Results from the CPS are made publicly available online in the form of aggregated statistics and as “public-use microdata” (individual-level responses about which additional information, such as geographic location, has been suppressed for anonymization purposes). These data play a critical role in tracking workforce trends in employment, unemployment levels, the employment-to-population ratio, and working hours and wages; these data are also tracked by demographic information (such as an individual’s race or marital status) and job characteristics (such as industry and occupation).
The CPS is one of the primary sources for tracking self-employment activity. As noted in the section “The On-Demand Economy” in Chapter 4, the CPS shows no recent increase in the share of workers having at least some self-employment activity, nor does it show any increase in the share of workers with multiple jobs. Both of these findings raise questions about the quantitative importance of the growth of the on-demand or “gig” economy. However, as noted, there is some question as to whether changing workforce arrangements are appropriately captured via the current interview process (e.g., workers may identify differently than researchers would have classified them). It is also possible that new uses of technology for organizing such work are not creating a new growth sector, but rather centralizing existing informal work patterns. Existing data do not allow for a definitive interpretation.
The Census Bureau conducts an annual supplement to the CPS that it uses for tracking key trends in the U.S. economy. The CPS and other household surveys also include additional, periodic supplements designed to capture changing workforce trends. For example, the CPS has had periodic supplements focused on the contingent workforce, the last of which was conducted in 2005. An updated “Contingent Worker Supplement” is planned to be included in the May 2017 CPS.3
Related household-based sources for tracking the evolution of the workforce include the long form of the Decennial Census through 2000 and the more recent American Community Survey (ACS), both collected by the Census Bureau. The much larger samples in the Decennial Census and the ACS permit cross-classifying workforce trends by demographics,
___________________
3 T. Perez, 2016, “Innovation and the Contingent Workforce,” U.S. Department of Labor blog, January 25, https://blog.dol.gov/2016/01/25/innovation-and-the-contingent-workforce/.
occupations, industries, and locations in a manner not possible for the CPS due to factors such as CPS sample size and location suppression in its public-use microdata.
Data Sources Tracking Workforce and Employer Dynamics: JOLTS, BED, BDS, and QWI
The CES and CPS are invaluable sources for tracking core indicators of the labor market, but they should primarily be interpreted as providing information about the changing characteristics of workers and firms over time. To understand the changing nature of the labor market, it is also critical to track workforce and employer dynamics and transitions.
Measures of vacancy postings, hires, and separations from the BLS Job Openings and Labor Turnover Survey (JOLTS) enables the tracking of workers engaged in labor market transitions. The JOLTS survey is establishment-based and provides these statistics at the national, regional, and industry level along with statistics by employer characteristics, like employer size.
BLS Business Employment Dynamics (BED) data track establishment expansions and contractions and establishment openings and closings on a quarterly basis, using administrative data about private, nonfarm-sector establishments. Similarly, the Business Dynamic Statistics (BDS) data at Census Bureau tracks job creation and destruction statistics annually using administrative data on U.S. businesses in the private, nonfarm sector. A highlight of the BDS is that it permits the tracking of business formation and business failure at the firm level. Entrepreneurship has historically played a critical role in the innovation, growth, and job creation dynamics of the United States. The BDS has shown that business formation rates have declined in the United States even in the high-tech sector in the post-2000 period. The BED and BDS data are available in the public domain at the national, industry, and local levels and by a variety of firm and establishment characteristics. These data are also available for restricted-use analysis in the Federal Statistical Research Data Centers.
JOLTS, BED, and BDS provide rich information tracking labor market dynamics but are limited in that they are based on establishment- and firm-level information alone. The Longitudinal Employer Household Dynamics (LEHD) project at the Census Bureau has created a longitudinal employer-employee matched data infrastructure for studying labor market dynamics from both the worker and business perspective. Key data products from the LEHD project are the Quarterly Workforce Indicators (QWI), which provide information on labor market transitions, including both worker and firm characteristics. Indicators of job-to-job flows that track workers transiting directly from one job to another, even
without first being unemployed, are a novel component of the QWI that has recently been released. As discussed in Chapter 4, job-to-job flows have been a critical way for young workers to build careers and also show how workers impacted by changing technologies have adapted by changing employers. The new job-to-job flow statistics show there has been a decline in the pace of such transitions, posing concerns about workers getting caught up in the changing nature of work.
These household surveys and censuses are increasingly being integrated with administrative data to yield new statistical products. For example, all of these data have been integrated in the LEHD data infrastructure, discussed in the next subsection. Such data integration enables researchers to combine information on firm-level measures of changing technology with what happens to the workers caught up in such changes.
The business-level and person-level data underlying the JOLTS, BED, BDS, and QWI are increasingly being used in restricted-use environments to track workforce trends. Development and access to the longitudinal microdata are critical for capturing the changing nature of work. For example, Abraham et al.4 use the integration of the person-level CPS and the LEHD-matched employer-employee data to study changing labor market trends. They find, for example, that many individuals in the CPS state that they are working as wage and salary workers, but the administrative data underlying the QWI and other related sources at the Census Bureau show that they are working as independent contractors. It is such discrepancies that may in part underlie the difficulty of identifying the impact of the on-demand economy on the workforce.
As discussed further in the following subsection, the longitudinal business data and longitudinal employer-employee matched data have great promise for tracking the impact of changing technology on workers. Workers who find themselves at firms engaged in changing the nature of the workplace can be tracked over the course of their career. If displaced, the outcomes in terms of employment and earnings can be tracked. Alternatively, the changing nature of the workplace at some firms may lead to new opportunities that can be tracked.
Given the interest in and possible growth of the on-demand economy, the matched employer-employee data need to be supplemented to include workers who are independent contractors. Fortunately, the statistical agencies, as well as Internal Revenue Service and Social Security Administration, have administrative data sources that track such activity already—although for the most part these sources have not yet been integrated into
___________________
4 K.G. Abraham, J. Haltiwanger, K. Sandusky, and J.R. Spletzer, 2013, Exploring differences in employment between household and establishment data, Journal of Labor Economics 31(2,part 2):S129-S172.
the LEHD data infrastructure.5 Integrating alternative types of workforce arrangements should be a high priority for the future.
Tracking Changes in Technology Using U.S. Federal Data Sources
The federal statistical agencies have a wide array of business surveys that provide information on the changing nature of technology and workplace organization at U.S. firms. At the core, the business surveys and economic censuses yield the data that permit constructing indicators of productivity (such as labor productivity or total factor productivity). Productivity measures are commonly used to make inferences about the pace of technological change in the economy. As discussed in Chapter 3, productivity growth in the United States surged during the tech boom in the 1990s through the early 2000s but has slowed since the mid-2000s.
Direct measures of changing technology and innovation stem from survey and administrative sources. The Census Bureau conducts the Business Research and Development and Innovation Survey on behalf of the National Science Foundation. This survey tracks research and development (R&D) activity and innovation activity at the firm-level. It provides invaluable information about the sectors where R&D and innovative activity are concentrated, which is disproportionately in manufacturing. The data have been integrated into the wide range of business survey and administrative data to study the impact of R&D and innovation on productivity and job creation.
Modules and supplements are periodically added to business surveys to track changes in technology. For example, in some sectors and firms, the design of new products is conducted in the United States, but all or much of the actual production is outsourced. As a result, some firms are considered producers of goods even though they conduct little or no production activity. To capture such activity, the Census Bureau has added a series of modules to the U.S. economic censuses since 2002 on the contraction of manufacturing services.6
Household surveys conducted by the Census Bureau have been collecting data on computers and Internet use periodically since the 1980s. The CPS has had periodic modules about computer use at the household level through the early 1990s and about both computer and Internet use
___________________
5 See, however, the NBER/CRIW paper by Goetz et al. (2015) that discusses integrating the self-employed including independent contractors into the LEHD data infrastructure (C. Goetz, H. Hyatt, E. McEntarfer, and K. Sandusky, 2015, “The Promise and Potential of Linked Employer-Employee Entrepreneurship Research,” NBER Working Paper w21639, doi: 10.3386/w21639).
6 A.B. Bernard and T.C. Fort, 2015, Factoryless goods producers in the US, American Economic Review 105(5):518-523.
from the late 1990s through the present. The ACS has collected data about computers and Internet use annually since 2013. Such household data does not provide much detail about the specific nature of technological innovation, but it is important for quantifying the penetration of the use of IT across the population.
The U.S. Patent and Trademark Office tracks all patents in the United States, including information on the firms and inventors for the patents as well as the nature of the patents. The research community has been using this as an important source for tracking technological change for years, but these data are now increasingly being integrated into the other survey and administrative data discussed above. Research projects with participants from the academic community, the patent office, and the statistical agencies are integrating patent and other related data on innovation to longitudinal business data (i.e., the microdata underlying the BDS) and the longitudinal, matched employer-employee data (i.e., the LEHD data infrastructure).7 Such data integration permits tracking of the outcomes of innovative activity in unprecedented ways as well as tracking of the careers of innovators. Along with patent citation data, integration with matched employer-employee data enables the study of the networks and clustering activity of innovation in unprecedented ways.
Integration of data tracking changes in technology at the firm level with matched employer-employee data also has the potential to permit study of the impact of changing technology on the workers caught up in such changes. This would allow tracking of employment, earnings, and career paths for those workers who find themselves at firms that are replacing production workers with machines or with globalized production.
Tracking Changing Occupational and Skill Requirements
Changes in the demand for different types of skills are a critical aspect of the changing nature of work. Data on the changing occupational mix and the skill requirements of these occupations are a vital source for tracking these changes. As noted above, household surveys such as the CPS, ACS, and the Decennial Census are useful sources for characterizing the changing occupational mix of the U.S. workforce over time.
The Occupational Employment Statistics survey, administered cooperatively by the Bureau of Labor Statistics and state workforce agencies, collects information about employees at nonfarm establishments. These
___________________
7 D. Acemoglu, U. Akcigit, N. Bloom, and W. Kerr, 2013, “Innovation, Reallocation, and Growth,” Massachusetts Institute of Technology Department of Economics, April 12, http://economics.mit.edu/files/8790.
data complement the household-based surveys by providing data on wages by detailed occupation and location as reported by employers. These data are actively used for occupational projections.
In order to classify jobs by their types, functions, conditions, and associated competency requirements, the U.S. Department of Labor’s Employment and Training Administration established the Dictionary of Occupational Titles (DOT), in use from 1938 through the late 1990s. The DOT details a taxonomy of occupations and the associated competencies (cognitive and noncognitive) required for success in those occupations. Autor et al. used elements of the DOT data in their discussion of how IT relates to a decline in the demand for routine-intensive occupations.8
In 1992, the Employment and Training Administration established the Occupational Information Network (O*NET) online database, which describes the detailed competencies and characteristics of occupations required for success on the job; it ultimately replaced the DOT. Whereas the DOT offered detailed information on more than 10,000 occupations, O*NET consolidated and grouped these occupational titles and now covers about 1,000 occupations. The content model contains information on 33 knowledge bases, 35 skills, and 52 abilities, among other competencies. The profiles are periodically updated based on results from the O*NET Data Collection Program’s worker questionnaire, which is sent to a sampling of workers and occupational experts.
While O*NET is quite valuable for understanding current jobs and associated requirements, researchers face some challenges when aiming to use its content to help assess changing skills requirements and the likely impacts of technology on a given occupational field. First, the database is not intended to be longitudinal; O*NET 20.2 (released in February 2016) is not directly compatible with previous versions of O*NET. Both the O*NET questionnaire and associated occupational codes have changed significantly over time in such a way that O*NET classifications are not directly comparable from year to year. Furthermore, the system is updated on a rolling basis, with competency requirements for some fraction of all occupations updated every year. The census occupational coding system was significantly altered between the 1990 and 2000 censuses to account for technological advances in occupational structure and structural changes in the economy overall, representing a further challenge to monitoring changes within a given field.
It has also been noted that the degree of variability in the responses between occupations is lower than expected. For example, one might expect an engineer to use critical thinking skills more intensely or at a
___________________
8 D.H. Autor, F. Levy, and R.J. Murnane, 2003, The skill content of recent technological change: An empirical exploration, Quarterly Journal of Economics 118(4):1279-1333.
higher level than, for example, a baker. However, worker survey responses might show similar required levels or intensity of use of critical thinking between these two different occupational categories. The sheer number of competencies identified for each occupation can be overwhelming, with 120 identified skills, knowledge areas, and abilities used as classifiers; consolidating to a more manageable number of factors proves challenging. The classifiers themselves are not necessarily directly linkable to requirements for using technology, making it difficult to assess the diffusion of technology into the corresponding occupational fields.
In addition, the knowledge provided by O*NET about which occupational competencies are required for success in a given occupation is not accompanied by information about how to teach or attain these competencies. There is also little guidance on attainment levels required to meet the demands of the occupation, although the data set does separately identify “job zones,” or groups of occupations with similar requirements.
Despite these challenges, this information has been valuable to labor market analysts and workforce participants and has also proven critical for use by the research community to help quantify and address the nature of work. For example, MacCrory et al. have identified and tracked changes in seven orthogonal dimensions of skill in the O*NET data set,9 and O*NET classifications have been used in several recent studies aiming to examine what current jobs or work functions could potentially be automated, as discussed in the section “Evaluating Job Susceptibility to Automation” below.10
WEB-BASED AND PRIVATE-SECTOR DATA
Government statistics are invaluable sources of longitudinal, large-scale, and standardized data. However, such data can be costly and time-consuming to collect, especially from offline surveys. However, the digitization of economic and labor market transactions has created new opportunities for tracking and evaluating workforce trends. In particular, the rise of the Internet, enterprise software systems, mobile devices,
___________________
9 F. MacCrory, G. Westerman, and E. Brynjolfsson, 2015, “Identifying the Multiple Skills in Skill-Biased Technical Change,” Thirty Sixth International Conference on Information Systems, http://aisel.aisnet.org/cgi/viewcontent.cgi?article=1655&context=icis2015.
10 S.W. Elliott, 2014, Anticipating a Luddite revival, Issues in Science and Technology 30(3):27-36; C.B. Frey and M.A. Osborne, 2013, “The Future of Employment: How Susceptible Are Jobs to Computerization,” Oxford Martin School, September 17, http://www.oxfordmartin.ox.ac.uk/downloads/academic/The_Future_of_Employment.pdf; McKinsey Global Institute, 2015, “Four Fundamentals of Work-place Automation,” McKinsey Quarterly, http://www.mckinsey.com/business-functions/business-technology/our-insights/four-fundamentals-of-workplace-automation.
and computational and data storage capacity have led to unprecedented amounts of data being “born digital,” including some of the administrative data discussed in the Introduction to this chapter. Much as advances in analytical methods have enabled new products, services, and tools for research and business (with implications for the workforce), such methods also present new opportunities for identifying and understanding changes in the labor economy.
For example, consider the rise of “big data” and associated analytics. Digital data are now being created at vastly greater quantities than ever before. They are available more quickly, often in real time, and they are available in many forms and types.11 Big data are commonly described as differing from traditional data sources due to the volume, velocity, and variety of these data.12
The following types of naturally occurring data—that is, data that would exist in digital form whether or not someone sought them—provide key examples of analytical opportunities for researchers.
- Individual worker profiles. Online networking platforms, especially professional networking or job-seeking platforms such as LinkedIn or Monster.com, enable individuals to create and maintain personalized profiles and help to match individuals with potential job prospects. Users may input their employment status, current and past employers, job titles, certifications, and skills, as well as their educational background, geographical location, professional interests, relevant experience, and the type of job they are seeking (if applicable). Some of these data are publicly searchable online—for example, if a user chooses to make his or her profile visible to the public. Some of it is kept private or confidential, either to protect the personal information of the individual or to be used exclusively by the platform owner for its own analytics—to generate revenue by selling targeted advertising or to enhance its service or product. Analysis of privately held data can also enable a company to conduct its own research about the labor market to inform future business models, or the data could be made available to outside researchers.
- Job listings. Companies seeking to hire may post vacancy announcements on a range of websites, including their own and those of professional societies, local news outlets, employment services, and online professional networking platforms. Again, much of this information is
___________________
11 See also E. Brynjolfsson and A. McAfee, 2012, Big data: The management revolution, Harvard Business Review 90(10):60-68.
12 META Group, 2001, “3D Data Management: Controlling Data Volume, Velocity, and Variety,” February 6, https://blogs.gartner.com/doug-laney/files/2012/01/ad949-3D-DataManagement-Controlling-Data-Volume-Velocity-and-Variety.pdf.
publicly accessible and searchable. Advances in big data approaches and computational and storage capacity make it possible to monitor, track, and analyze job openings over time, including key elements such as position title, industry sector, listed skills and educational requirements for a given job title, and how long the posting persists before it is removed. Factors that must be taken into account during aggregation and interpretation of these data include the existence of multiple postings for the same position, delayed updates or removal of advertisements for filled positions, a lack of information about jobs not posted on publicly searchable sites, and other incomplete or inaccurate information. Analysis of these and other data mined from the Web present opportunities for close monitoring and dynamic analysis of the labor market. For example, Burning Glass Technologies analyzes millions of job postings to track skills gaps in real time.13 Real Time Macroeconomics works similarly, making use of Google Trends and scraping online data from job postings, layoff announcements, and wage reports to develop economic indicators that supplement government data.14
Additional information, such as retail or online purchasing trends (tracked via bar-code scanners in brick-and-mortar stores or product numbers in online purchases), search queries (inputs into online search engines), social media content, and related data, may contain useful evidence of technology diffusion, economic change, and employment or business trends.
A wealth of information (including from some of the categories identified above) is held or generated by the private sector, such as corporations with large employment numbers, employment services, and others whose business practices would shed light on how technology is changing the U.S. and global economies and workforce. However, much of this is not publicly available for reasons such as the need to protect individual privacy or proprietary business information.
Overall, Web-based and private-sector data present great potential for enabling new insights into the changing nature of work and workforce trends. For example, in 2009, Hyunyoung Choi and Hal Varian developed a model that predicted initial claims for unemployment benefits using data from Google Trends.15 They created two variables to account for the frequency of job-related as well as welfare and unemployment search
___________________
13 Burning Glass Technologies, 2016, “About Burning Glass Technologies,” http://burning-glass.com/about/, accessed April 2016.
14 Real Time Macroeconomics, 2016, “Real Time Online Economic Data,” http://www.realtimemacroeconomics.com/#real-time-online-economic-data, accessed April 3, 2016.
15 H. Choi and H. Varian, 2012, Predicting the present with Google Trends, Economic Record 88(s1):2-9.
terms. After adding the variables to the standard forecasting model, Choi and Varian found their Google Trends model outperformed other models of the Department of Labor’s initial claims data. Wu and Brynjolfsson16 also used Google Trends to predict housing-price changes. Although they constructed the model to be simpler than the one used by the National Association of Realtors, by using real-time data, they were able to make predictions more accurately than the experts.17
Federal statistical agencies have begun to use big data sources in their evaluations. For example, the BLS currently uses “web-scrape characteristics for hedonics” to help calculate the Consumer Price Index (CPI).18 Meanwhile, the BEA also uses various digital data sources, including QuickBooks, Mint Bills, PayCycle, credit card data, and the Consumer Financial Protection Bureau Consumer Credit Panel as well as “billions of claims from both Medicare and private commercial insurance to determine the spending for over 250 diseases.”19
A very promising example of analytics using web-based data is the Billion Prices Project (BPP), which includes a daily price index to extend the monthly CPI.20 The BPP collects and aggregates the prices of approximately 15 million products and calculates a daily, not annual, inflation index for 20 countries. It is considered more accurate than the official price indexes of some governments and enables analysis of other trends, such as premiums paid for green products, adjustment of prices to shocks, and price “stickiness.”21 It is important to note that the BPP is not meant to be treated as a substitute for official statistics, but rather as a complement, in part because BPP and the CPI do not always measure the same
___________________
16 L. Wu and E. Brynjolfsson, 2009, The future of prediction: how Google searches foreshadow housing prices and quantities, p. 147 in ICIS 2009 Proceedings; L. Wu and E. Brynjolfsson, 2014, “The Future of Prediction: How Google Searches Foreshadow Housing Prices and Sales,” paper presented at the meeting Economics of Digitization: An Agenda, June 6-7, 2013, http://conference.nber.org/confer//2013/DIGs13/Wu_Brynjolfsson.pdf.
17 Ibid.
18 E. Groshen, Bureau of Labor Statistics, “Government and Big Data: What’s Our future?,” presentation at American Enterprise Institute for the Federal Statistical System in a Big Data world, March 12, 2015.
19 D. Johnson, “Commercial Big Data and Official Statistics,” Bureau of Economic Analysis—Federal Economic Statistics Advisory Committee presentation in BEA Expert Meeting on Exploiting Commercial Data for Official Economic Statistics on November 19, 2015; B.C. Moyer, “Big Data Landscape, 2015-2020,” Bureau of Economic Analysis, presentation at Global Conference on Big Data for Official Statistics, October 20, 2015.
20 A. Cavallo and R. Rigobon, 2016, The Billion Prices Project: Using online prices for measurement and research, Journal of Economic Perspectives 30(2):151-178.
21 A. Cavallo, 2013, Online and official prices indexes: Measuring Argentina’s inflation, Journal of Monetary Economics 60(2):152-165; N. DuVergne Smith, 2010, “Billion Prices Project: Introducing Real-Time Economics,” MIT News, December 1, http://news.mit.edu/2010/billion-prices-project.
prices. (For example, the BPP cannot easily account for services.) Similar complementary models could be developed to identify technology trends and advances, changing employment opportunities or skills demands for different occupational fields, and potential correlations between these trends.
Work is also under way to use social media to track economic trends. In particular, analysis of Twitter fields, conducted jointly by experts in computer science and economics, has been used to track and predict unemployment trends.22
Such successes demonstrate the potential for digital and web-based data to yield new insights into current and potential workforce changes. In general, these data could be uniquely useful to researchers and policy makers since they can be collected and searched in real time, at high granularity, and reveal unanticipated trends.
However, there are notable challenges associated with web-based and private-sector data sets. First, valuable data held by the private sector are not generally available to researchers; if they were, steps would likely be needed to protect proprietary business information. Pilot efforts testing the potential of public-private data sharing to yield more complete data sets while reducing costs are underway at BLS, the Census Bureau, and BEA (although details and results of these efforts are not available). Although private sector data sets are clearly of significant value to the companies that collect them, there may well be motivations on both sides to share and aggregate data and to make aggregate statistics available to researchers and the public.23
Second, large-scale collection and analysis of nonpublic information, such as credit-card transactions, or even some publicly available data, such as social media information, and much of the administrative data described above could have significant privacy or ethical implications, which will not be explored here. Finally, big data and data-mining-based approaches to uncovering important trends also have the potential to surface spurious correlations, and decisions about how to sort or filter input data prior to analysis may be subjective and yield skewed results. Even if trends and correlations are accurately identified, analytics alone may not
___________________
22 D. Antenucci, M. Cafarella, M. Levenstein, C. Ré, and M.D. Shapiro, 2014, “Using social media to measure labor market flows,” NBER Working Paper No. 20010, National Bureau of Economic Research, doi: 10.3386/w20010.
23 Technical and policy issues associated with such partnerships for aggregating diverse data for the enhancement of federal statistics are currently being explored as part of another study of the National Academies of Sciences, Engineering, and Medicine. See the website for the Panel on Improving Federal Statistics for Policy and Social Science Research Using Multiple Data Sources and State-of-the-Art Estimation Methods, at http://sites.nationalacademies.org/DBASSE/CNSTAT/DBASSE_170268.
provide insight into the underlying causes of or meaning behind such trends—even if they also yield accurate predictions.24 More qualitative or in-depth examination of workforce and technology trends, along with hypothesis-driven research grounded in established scientific theory, will be needed to unravel the bigger picture.
QUALITATIVE METHODS
Macroeconomic and quantitative analytical approaches are invaluable for identifying and understanding overall trends and indicators, but they may not provide a clear picture of what is occurring at the level of individual workers or families. As mentioned in the previous section, these methods may also fail to reveal causality.
For these insights, the committee may turn to microdata and qualitative social science methods. These methods include case studies, participant observation, ethnographic interviewing, life histories, and the analysis of textual data. Of these methods, participant observation and ethnographic interviewing have contributed the most to an understanding of the changing nature of work. Participant observation (or fieldwork) involves long periods of immersion in setting, a subculture, an occupation, or a workplace.25 Indeed, much of what is known about the social organization of work as it existed in the mid-20th century derives from fieldwork con-
___________________
24 See, for example, D. Boyd and K. Crawford, 2012, Critical questions for big data: Provocations for a cultural, technological, and scholarly phenomenon, Information, Communication and Society 15(5):662-679.
25 There are numerous texts that cover how to do fieldwork and ethnographic interviewing. Some of the most widely used include the following: A.L. Strauss and J. Corbin, 1990, Basics of Qualitative Research: Grounded Theory Procedures and Techniques, SAGE Publications, Thousand Oaks, Calif.; J.P. Spradley, 1979, The Ethnographic Interview, Holt, Rinehardt and Winston, New York; J. Lofland and L.H. Lofland, 1984, Analyzing Social Settings: A Guide to Qualitative Observation and Analysis, Wadsworth, Belmont, Calif.; J. Van Maanen, 1988, Tales of the Field: On Writing Ethnography, University of Chicago Press, Chicago, Ill.; M. Agar, 1980, The Professional Stranger, Academic Press, New York.
ducted in mines,26,27 factories,28,29 offices,30 construction sites,31,32 and other work settings.33,34 In fact, field studies such as these provided the situated, contextual insights that enabled sociologists to elaborate on theories of bureaucratic organizing as well as the grounding for large-scale survey research on the nature of work and work life throughout the remainder of the century. Ethnographic research continues to provide grounded understandings of the changing nature of work in the 21st century. Examples include studies of finite element analysis and other mathematical simulation tools in automobile engineering,35 the work and careers of financial analysts on Wall Street,36 the work of technicians in a variety of settings,37,38 and the work of personal service workers39 and contract workers.40,41 These and other ethnographies offer considerable fodder for developing a more macro-oriented understanding of the variety of trends characteristic of changes in the nature of work and the structure of the workforce. Moreover, data from field studies and related methods are likely to raise questions that will fruitfully guide more macro-level research.
When carefully coupled, mixed-methods research can help to address
___________________
26 E.L. Trist and K.W. Bamforth, 1951, Some social psychological consequences of the Longwall method of coal getting, Human Relations 4(1):3-38.
27 A.W. Gouldner, 1954, Industrial Bureaucracy, Free Press, New York.
28 C.R. Walker and W.H. Guest, 1952, The Man on the Assembly Line, Harvard University Press, Cambridge, Mass.
29 F.C. Mann and R.C. Hoffman, 1960, Automation and the Worker, Henry Holt and Company, New York.
30 P.M. Blau, 1955, The Dynamics of Bureaucracy, Chicago University Press, Chicago, Ill.
31 R. Dubin, 1956, Industrial workers’ worlds: A study of the ‘central life interests’ of industrial workers, Social Problems 3(3):131-142.
32 J. Haas, 1977, Learning real feelings: A study of high steel ironworkers’ reactions to fear and danger, Sociology of Work and Occupations 4(4):147-170.
33 R.L. Gold, 1964, In the basement: The apartment building janitor, pp. 1-49 in The Human Shape of Work: Studies in the Sociology of Occupations (P.L. Berger, ed.), Macmillan, New York.
34 L. Braude, 1975, Work and Workers: A Sociological Analysis, Praeger Publishers, New York.
35 D.E. Bailey, P.M. Leonardi, and S.R. Barley, 2012, The lure of the virtual, Organization Science 23(5):1485-1504.
36 K. Ho, 2009, Liquidated: An Ethnography of Wall Street, Duke University Press, Durham, N.C.
37 S.R. Barley, 1996, Technicians in the workplace: Ethnographic evidence for bringing work into organization studies, Administrative Science Quarterly 41(3):404-441.
38 S.E. Zabusky and S.R. Barley, 1996, Redefining success: Ethnographic observations on the careers of technicians, in Broken Ladders (P. Osterman, ed.), Cambridge University Press, Cambridge, Mass.
39 A.R. Hochschild, 1983, The Managed Heart: Commercialization of Human Feeling, University of California Press, Berkeley, Calif.
40 S.R. Barley and G. Kunda, 2004, Gurus, Hired Guns and Warm Bodies: Itinerant Experts in a Knowledge Economy, Princeton University Press, Princeton, N.J.
41 V. Smith, 2001, Crossing the Great Divide: Worker Risk and Opportunity in the New Economy, Cornell University Press, Ithaca, N.Y.
important questions simultaneously from the bottom up and the top down, leading to more informed interpretations of data, deeper and more complete knowledge, and new, testable hypotheses.
EVALUATING JOB SUSCEPTIBILITY TO AUTOMATION
Until recently, it was generally accepted that routine tasks (whether manual or cognitive) were the most susceptible to automation (as opposed to nonroutine tasks).42,43,44 It is becoming clear that advances in artificial intelligence (AI), machine learning, and robotics are increasingly making the automation of some nonroutine tasks, such as writing news articles, answering questions, driving, and even navigating uneven terrain, practically feasible, as discussed in Chapter 3.
Recent approaches to analyzing the types of jobs subject to automation have involved matching current technological capabilities with the skills or tasks associated with common occupational fields, in particular, as identified in the O*NET system (see the section “Tracking Changing Occupational and Skill Requirements” above for a discussion of O*NET).45,46,47 This approach provides a systematic identification of human skills to be compared to or qualified in terms of technical capabilities, although it is limited to some extent due to the challenges of using O*NET classifications for longitudinal tracking, as outlined in the section.
The first such study,48 from 2013, estimated that approximately 47 percent of U.S. jobs are at high risk (≥70 percent probability) of being automated over the next few decades as a result of advances in AI, machine learning, and mobile robotics. This evaluation considered only the technological capability of completing the associated work tasks, to the exclusion of other economic, organizational, and social considerations. Authors Frey and Osborne used a machine-learning approach, classifying the suscep-
___________________
42 D.H. Autor, F. Levy, and R.J. Murnane, 2003, The skill content of recent technological change: An empirical exploration, Quarterly Journal of Economics 118(4):1279-1333.
43 M. Goos, A. Manning, and A. Salomons, 2009, Job polarization in Europe, American Economic Review 99(2):58-63.
44 D.H. Autor and D. Dorn, 2013, The growth of low-skill service jobs and the polarization of the US labor market, American Economic Review 103(5):1553-1597.
45 S.W. Elliott, 2014, Anticipating a Luddite revival, Issues in Science and Technology 30(3):27-36.
46 C.B. Frey and M.A. Osborne, 2013, “The Future of Employment: How Susceptible Are Jobs to Computerization,” Oxford Martin School, http://www.oxfordmartin.ox.ac.uk/downloads/academic/The_Future_of_Employment.pdf.
47 McKinsey Global Institute, 2015, Four Fundamentals of Work-place Automation, McKinsey Quarterly, http://www.mckinsey.com/business-functions/business-technology/our-insights/four-fundamentals-of-workplace-automation.
48 Frey and Osborne, 2013, “The Future of Employment.”
tibility of 70 specific jobs to automation by eye (assigning a “1” to jobs for which all tasks are automatable by a state-of-the art computer with sufficient availability of big data, and a “0” to those for which at least one task cannot be automated), then used this assessment as the training data for categorizing 703 jobs classified in O*NET on a probability spectrum from 0 to 1.
A related study in progress, preliminarily reported on in 2014,49 sampled a decade’s worth of articles from AI Magazine and IEEE Robotics & Automation Magazine, identifying specialized research of note in these fields and grouping the reported technical accomplishments into four categories (language, reason, vision, and moving). The capabilities of these top technologies were compared to the “anchoring tasks” provided as benchmarks for the O*NET ability-level rating system in relevant skills categories. This preliminary qualitative analysis suggested that the abilities of these leading-edge IT and robotics systems were analogous to the skill level required to successfully perform approximately 81 percent of current U.S. jobs. While, again, there are many additional factors to consider, including the costs and barriers to further develop these technologies and bring them to market, challenges associated with integrating these components into larger systems, and market demand for and societal acceptance of such automation practices, this evaluation suggests that automation of a vast number of jobs is becoming increasingly technically feasible. A full report of these results is currently in development for The Oxford Handbook of Skills and Training.50
Another analysis came from the McKinsey Global Institute, whose researchers evaluated which of 2,000 occupational activities characterized by the O*NET system could be automated through some application of current technologies. Their analysis suggested that 5 percent of jobs could currently be automated in their entirety, and that 60 percent of jobs could have at least 30 percent of their associated tasks automated by existing technologies. Overall, they estimate that 45 percent of work activities are currently automatable, although this number would rise to 58 percent if natural-language processing were to reach the median level of human performance. The researchers thus suggest that in the near term it is more appropriate to focus on the automation of specific work tasks than the automation of complete jobs—suggesting the potential for significant change to the structure of work.51
___________________
49 Elliott, 2014, Anticipating a Luddite revival.
50 Ibid.
51 McKinsey Global Institute, 2015, Four Fundamentals of Work-place Automation.
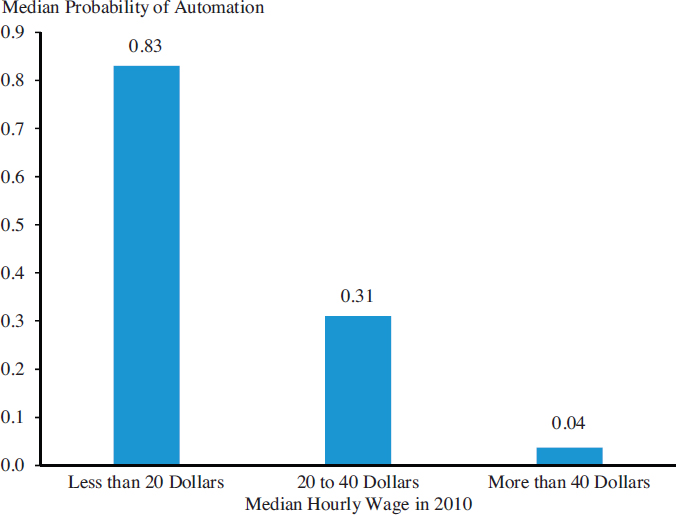
It is noteworthy that the 2016 Economic Report of the President52 addressed the question of automation of work. It contains an analysis by the Council of Economic Advisors that makes use of Frey and Osborne’s results to assess the probability of automation of jobs according to wage groups. Figure 5.1 shows their results, illustrating the estimate that lower-paying jobs are more likely to be automated.
While such evaluations of susceptibility of work to automation are relatively new and not without limitations, they are provocative and present systematic approaches for addressing the question of what
___________________
52 Council of Economic Advisors, 2016, Economic Report of the President, p. 249, https://www.whitehouse.gov/sites/default/files/docs/ERP_2016_Book_Complete%20JA.pdf.
jobs may become fully or partially automated. There is rich potential to expand upon this research, in particular by refining or augmenting these approaches; identifying strategies for testing the accuracy of such predictions; and incorporating other factors, such as societal acceptance of a given technology, that contribute to automation of particular work functions and jobs.
SUMMARY
Data collected by federal statistical agencies have been invaluable for understanding the status of the workforce and the economy at large, such as employment numbers and salaries, and for tracking technology-related values such as productivity. Many of these data sets are authoritative and comprehensive. However, collection and curation of such statistics is resource-intensive, and data sets must be updated periodically, while limited update frequencies can be a challenge for researchers. There is potential for technology to reduce some of these costs, for instance, via automated AI telephone interview systems, large-scale digital surveys, and more effective use of administrative data and the increasing amounts of digital data created for other purposes. In many cases, data are updated annually; other data sets are only updated periodically (e.g., it has been more than 10 years since the last Contingent Worker Supplement to the Current Population Survey). Additional challenges to using these data sets include the redefinition of certain classifiers or categories over time, which can make it challenging to track longitudinal trends, or the irregular updating of subsections of data sets (such as with O*NET); in the committee’s judgment, some data set (whether based on O*NET or otherwise) that enables longitudinal analysis of shifting job definitions and skills requirements for occupational fields would be beneficial.
Coupled with advances in tools for data mining and big data analytics, the digitization of myriad business, employment, and economic transactions as well as administrative and other born-digital data presents new opportunities for analyzing changing economic, workforce, technology, and societal trends. Academic researchers and private-sector organizations are already exploring these opportunities. These approaches could potentially augment or complement federal statistics and provide new ways of monitoring emerging workforce and technology trends. However, these approaches require rigorous privacy-protection measures, protection of confidential business information, and cognizance of the potential for intrinsic bias in mined data; such challenges extend broadly to all data-driven research.
While large-scale quantitative data sets are critical for understanding current trends and correlations, they do not always reveal causality and
may provide a picture that is somewhat removed from actual human experience. The use of microscale social science methods, such as interview, field work, and other ethnographic approaches, can help researchers bridge these critical gaps by testing conclusions from quantitative data and lead to new hypotheses and study, survey, or experiment design.
There are few methods for quantifying technological progress or foundational advances in science and engineering that can be used for developing indicators of impending changes to the labor economy.
There are a number of areas where useful data may be incomplete or unavailable. For example, there is currently no regular source of information about contingent workers (although another Contingent Work Supplement to the CPS is in the works). Other gaps include information about computer capital broken down at the firm and occupational levels; longitudinal information about skill changes over time by occupational field; information about organizational practices; and data on the diffusion and effectiveness of various educational practices for preparing individuals for work.
Moving forward, the research community would be well served by data collection designed to support longitudinal tracking and analysis of workforce trends and the role of advances in IT.


