
6
Discounting Module
Discounting is the process by which costs and benefits spread over current and future years can be compared in order to establish whether a particular choice leads to an overall net benefit. The discount rate refers to the reduction (“discount”) in value each year as a future cost or benefit is adjusted for comparison with a current cost or benefit. This chapter first discusses the IWG’s approach to discounting in the context of both broader government guidance and the academic literature on discounting, particularly regarding uncertainty about future economic growth. The second section looks broadly at approaches to discounting. The next two sections elaborate on likely correlations among climate damages, economic growth, and the appropriate discount rate and the idea that such correlations could be explicitly modeled in the SC-CO2 estimation. The final section considers other discounting issues. Throughout the chapter, guidance is offered on future SC-CO2 updates by providing examples of how they could be implemented and, more generally, how uncertainty about the discount rate could be handled.
IMPORTANCE OF DISCOUNT RATE ASSUMPTION FOR THE SC-CO2 ESTIMATES
The discount rate plays an important role in estimating the SC-CO2 because the impacts of today’s CO2 emissions persist and accumulate far into the future. The value today of avoiding those impacts depends heavily on how much society discounts those future impacts: small differences
in the discount rate can have large impacts on the estimated SC-CO2. This effect is highlighted in Table 1-1 (in Chapter 1), which shows the IWG estimated SC-CO2 for discount rates of 2.5, 3.0, and 5.0 percent. The ratio of SC-CO2 estimates based on 2.5 percent compared with 5 percent is a factor of up to five-fold (i.e., $10 versus $50 in 2010).
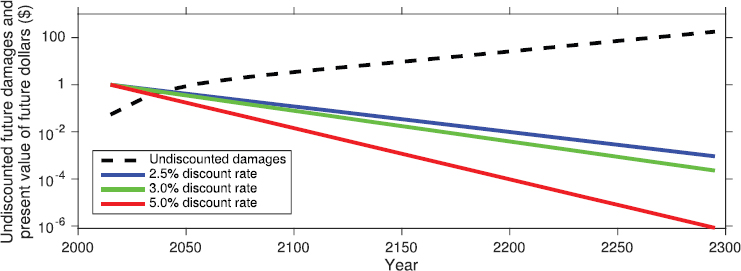
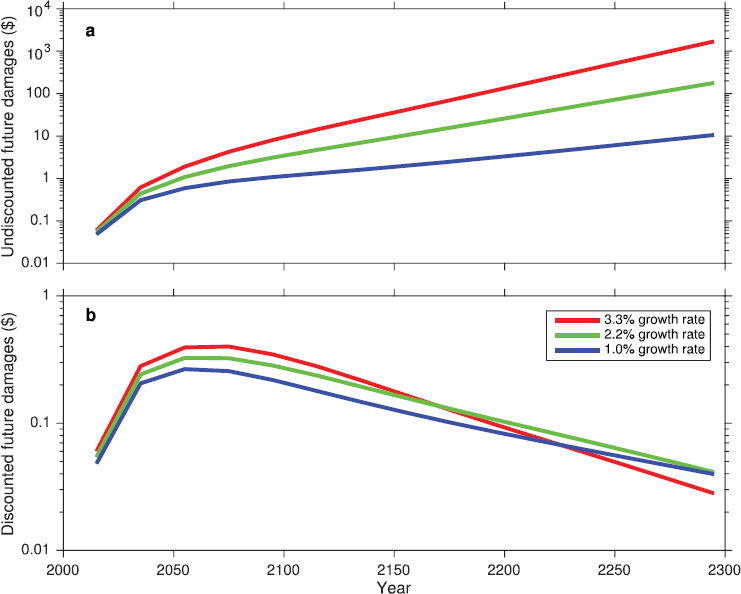
The underlying temporal trend of future discount factors and damages can be seen in Figure 6-1. This figure shows the committee’s calculated patterns over time of discounting and of damages associated with three discount rates and one example of a damage scenario from an integrated assessment model (discussed in detail below). It is important to note that the scale is logarithmic. The top line shows the time profile of damages from a single ton of CO2 emitted in 2015. The undiscounted damages rise from roughly 10 cents in 2015 to more than $100 in 2295. The discounted present value associated with $1 of future damages is indicated by the lower three lines for each of the three discount rates. For a 2.5 percent discount rate, this present value falls from $1 associated with $1 in damages in 2015 to less than one-tenth of 1 cent in 2295. For a 5 percent discount rate, $1 received in 2295 is valued at one-ten-thousandth of 1 cent today. This strikingly different result is due to the power of compounding discount rates over time.
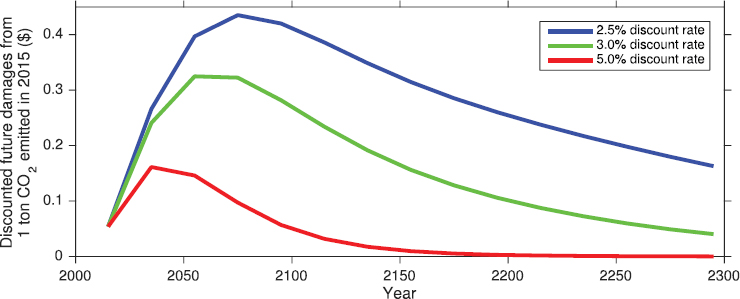
To understand how the discount rates and damage estimate combine to form different SC-CO2 estimates, Figure 6-2 shows the committee’s computation of the present value of damages shown in Figure 6-1 using
NOTE: See text for discussion.
NOTE: See text for discussion.
each of the three discount rates.1 The estimated SC-CO2 from this damage example for each discount rate would equal the area under each curve. Two observations are immediately evident. First, for a given pattern of damages, the SC-CO2 is much higher for low discount rates. Second, the modeling horizon needed to include most of the discounted damages varies with the discount rate. For this example time profile of damages, most discounted impacts are captured by 2150 when the discount rate is 5 percent. However, a significant amount of discounted damages may be missed even with a 300-year horizon when the discount rate is 2.5 percent. Another issue, though not apparent in Figure 6-2, is whether combining different discount rates with the same pattern of damages is always appropriate. As discussed in this chapter, the likely relationships between economic growth, discounting, and climate change damages is an important consideration.
The importance of the discount rate in benefit-cost analysis has not gone unnoticed. The U.S. Office of Management and Budget (OMB) has offered guidance on the use of particular discount rates dates for more than 40 years, and it has evolved over time (see, e.g., U.S. Office of Management and Budget, 1972). This guidance has been used in a wide range of regulatory analyses, ranging from food labeling to power plants.2
__________________
1 The committee refers to the present value of a dollar received in year t as the discount factor for year t. The present values are computed by multiplying damages in year t by the discount factor for year t, using each alternative discount rate.
2 See Food labeling: trans fatty acids in nutrition labeling, Nutrient content claims, and health claims, Federal Register, vol. 58, no. 133 (July 11, 2003) and U.S. Environmental Protection Agency (2015).
In order to present conclusions and recommendations about discounting applied to climate change damage estimates, the committee first discusses current OMB guidance and the scholarly literature on discounting. The IWG’s approach and the justification for it, as well as how agencies have used the IWG values in regulatory impact analyses (RIAs) is then reviewed. In the Phase 1 report (National Academies of Science, Engineering, and Medicine, 2016), the desire for consistency in the use of discount rates in RIAs is discussed (see also Box 1-2 in Chapter 1). The committee returns to this issue below.
APPROACHES TO DISCOUNTING AND THEIR APPLICATIONS
The U.S. government approach to discounting, including both those of the OMB and the IWG, has largely rested on observed market rates. Both OMB guidance and the IWG (see Interagency Working Group on the Social Cost of Carbon, 2010) also discuss “prescriptive” approaches derived from a social welfare framework (detailed below). These approaches are briefly reviewed before turning to the specific issue of growth uncertainty and discounting over the long term.
OMB Guidance on Discounting
In RIAs of federal rules, the rate at which future benefits and costs are discounted can determine whether the net present value of a regulation or project is positive or negative. In accordance with OMB Circular A-4, for rules with both intra- and intergenerational effects, agencies traditionally use constant discount rates of 3.0 and 7.0 percent, as well as a possible lower rate to reflect important intergenerational costs and benefits. The rationale for the 7.0 percent rate is that it is an estimate of the average before-tax rate of return to private capital in the U.S. economy. The 3.0 percent rate is intended to reflect the rate at which society discounts future consumption, or “social rate of time preference,” which is particularly relevant if a regulation is expected to affect private consumption directly (see U.S. Office of Management and Budget, 2003). A third, lower discount rate may be used as a sensitivity analysis if benefits or costs accrue to future generations over long time horizons.
OMB has provided more detailed rationales for these discount rates. In the return to capital approach, the discount rate is the rate of return on investment. This approach reflects the idea that, as long as the rate of return to capital is positive, society needs to invest less than $1 today to obtain $1 of benefits in the future. In the consumption approach, the discount rate reflects the rate at which consumers would be willing to trade
$1 of consumption today for a $1 of consumption in the future on the basis of the market tradeoffs that they face.
If all costs and benefits in an RIA are expressed in terms of their impacts on consumption, the appropriate discount rate is the consumption rate of interest.3 If there were no inefficiencies or distortions in the economy, the average risk-adjusted rate of return on investment would equal the consumption rate of interest. There are, however, reasons why the two differ. For example, taxes on investment income imply that the return to private investment exceeds what is received after taxes by the consumer. It is also the case that the costs and benefits of a project are not always expressed in consumption equivalents. These factors are why OMB requires projects involving intragenerational benefits and costs to be evaluated using discount rates that reflect both approaches, as a sensitivity analysis.
The choice of a discount rate applied over longer time horizons raises questions of intergenerational equity. Whether the benefits of climate policies, which can last for centuries, outweigh the costs, many of which are borne in the nearer term, is especially sensitive to the rate at which future benefits are discounted. Although the influence of the discount rate on damages in the future is well understood, there is no consensus about what rate to use in the context of estimating the SC-CO2 (Interagency Working Group on the Social Cost of Carbon, 2010).
Any rate used to estimate climate damages other than 3.0 or 7.0 percent presents complications in combining estimates of the SC-CO2 with other benefit and cost estimates in an RIA. Specifically, using a constant discount rate for intergenerational benefits and costs that is lower than the rate used to evaluate intragenerational benefits and costs can lead to inconsistencies in decision making: consistency requires that the same discount rate must be applied to all benefits and costs that occur in the same year (Arrow et al., 2013). When uncertain outcomes are considered, the discount rate applied to costs and benefits in a given year may vary across uncertain outcomes but, for a particular outcome, they ought to be the same for all costs and benefits. The committee returns to this possibility below.
Descriptive and Prescriptive Approaches in the Literature
In the economics literature, two approaches are used to determine the appropriate discount rate in climate change analyses. The positive,
__________________
3 “Interest rate” refers to measurable returns earned on various types of investment. As noted above, the discount rate refers to how one compares a dollar in the future with a dollar today—which may or may not equal various measurable returns.
“descriptive,” approach rests on observed behavior in savings and investment decisions that individuals make in the real world. The normative, “prescriptive,” approach takes the perspective of a social planner who prescribes weights to the welfare of future and current generations.
The descriptive approach focuses on setting the discount rate on the basis of actual market rates of return. That is, the discount rate is inferred from rates of return that reflect consumers’ actual choices—for example, savings versus consumption decisions or tradeoffs between more and less risky investments (Interagency Working Group on the Social Cost of Carbon, 2010). Three arguments are offered in favor of this approach: (1) mitigation expenditures displace other forms of investment; (2) if the return on mitigation investments is smaller than on other investments, allocating resources to mitigation efforts may make current and future generations worse off; and (3) it is preferable to base resource allocation on the tradeoffs that society actually makes (Arrow et al., 1996).
Whether the descriptive approach calls for using the pretax return on capital or the consumption rate of interest depends on whether benefits and costs are measured in consumption equivalents. If they are, then the theoretically correct discount rate is the rate at which consumers would trade consumption today for consumption in the future. In many cases, the benefits of avoiding climate change, such as health benefits, accrue directly to consumers or affect the prices consumers pay for goods and services. Even when climate damages do not directly affect consumers, damage estimates from the SC-IAMs are reported in consumption-equivalent units.
In contrast, the prescriptive approach is based on a social welfare function that reflects the weight that a policy maker attaches to the utility of current and future generations. The discount rate under the prescriptive approach is the rate at which $1 received by a future generation must be discounted to give the same marginal utility to the present generation as it gives to the future generation. This discount rate, r, is given by the following Ramsey formula,4
r = δ +η.g,
where δ is the discounting of the utility of future generations or “pure time preference” rate; η is the change in the value of an additional dol-
__________________
4 The approach was pioneered by Frank Ramsey (1928), with many extensions and elaborations. An important limitation of this approach is that η conflates risk aversion and the intertemporal elasticity of substitution. While the latter is our main focus here, future research could explore alternative formulations that relax this restriction, such as along the lines of the Epstein-Zin preferences (Epstein and Zin, 1989, 1991; Ackerman et al., 2013).
lar as society grows wealthier (the absolute value of the “elasticity of marginal utility of consumption”); and g is the growth rate of per capita consumption.5
An implication of the Ramsey equation is that the discount rate is inherently linked to the growth rate of the economy. This interdependence suggests that the rate used to discount future climate damages needs to be consistent with assumptions about the rate of economic growth that underlie the emissions path in the socioeconomic module and the calculation of climate damages in the damages module.
Arguments for adopting the Ramsey-based welfare approach to discounting include the notion that the discount rate ought to be derived from ethical considerations reflecting society’s views concerning consumption tradeoffs across generations. It is also true that there are few market interest rates that provide indicators of consumption tradeoffs over horizons longer than a few decades.6
In parameterizing the Ramsey formula, the Fifth Assessment Report (AR5) of the Intergovernmental Panel on Climate Change (IPCC) (Kolstad et al., 2014) and the IWG Technical Support Document (Interagency Working Group on the Social Cost of Carbon, 2010) provide a synthesis of the relevant literature, which suggests the following parameter values:
- Pure time preference rate, δ: Many papers in the climate change literature adopt values in the range of 0 to 3 percent per year (Interagency Working Group on the Social Cost of Carbon, 2010), although the largest value cited in the AR5 (Kolstad et al., 2014) is 2 percent, with the majority of values cited equaling zero or a number close to zero. One argument for a value of δ equal to 0 is that, holding consumption constant, all generations ought to be given equal weight in calculating social welfare.7
- Elasticity of marginal utility of consumption, η:8 Also referred to as intergenerational inequality aversion, the value of η typically falls in the range of 1 to 4 (Kolstad et al., 2014).
- Growth rate of per capita consumption, g: A commonly used
__________________
5 Note that while g is per capita consumption growth, the discount rate is applied to total (not per capita) benefits and costs because welfare depends on the total population.
6 For example, the longest terms for U.S. Treasury bonds and most home mortgages is 30 years. Very few private markets provide evidence about longer-term rates: (see Giglio et al., 2015).
7 Sometimes a small positive rate is used to account for the probability of human extinction due to causes unrelated to climate change (see, e.g., Stern, 2007).
8 The elasticity of the marginal utility of consumption with respect to consumption is negative; hence, η represents the absolute value of the elasticity of marginal utility with respect to consumption.
estimate in the recent literature for g is 2 percent per year, based on global growth over the past few decades (see Appendix D for a discussion of global growth data and projections).
While g is determined by the performance of the economy and is observable (ex post), δ and η are never observable, but require an ethical judgment. Some studies make judgments directly regarding the magnitude of δ and η (e.g., δ = 0). Other studies assume observed individual behavior can inform social preferences and proceed to estimate (or calibrate) either δ or η from empirical evidence. But even in the latter case, it is an ethical judgment to conclude that societal values are defined by individual behavior. Moreover, η can be associated with risk aversion, aversion to inequality across individuals in a given generation, and aversion to uneven consumption over time for an individual—as well as inequality aversion across generations. Furthermore, some studies take a descriptive approach and choose δ and η to calibrate the Ramsey equation to market rates. Estimates of η based on these different notions differ considerably (e.g., Atkinson et al., 2009). Thus, further judgement is required to choose among various estimates. The AR5 (Kolstad et al., 2014) summarizes a variety of such efforts spanning both academic research and government policy making. It identifies a range of implied discount rates from 1.4 to 6 percent: see Table 6-1.
Uncertainty about Future Discount Rates
Over long time horizons, the discount rate is uncertain. This is true under the descriptive approach because future market rates of interest are uncertain. It is also true under the prescriptive approach because future growth rates are inherently uncertain. In both approaches, discounting when rates are uncertain is more complex than simply using an expected or average discount rate.
Suppose under the descriptive approach that net benefits at time t, Z(t), are discounted to the present at a constant exponential rate r, so that the present value of net benefits at time t equals Z(t)exp(–rt).9 If the discount rate r is fixed over time but uncertain, then the expected value of net benefits is given by E(exp(–rt))Z(t).10 The certainty-equivalent discount rate, Rt, used to discount Z(t) to the present, is defined by
__________________
9 This assumes that Z(t) represents certain benefits. If benefits are uncertain we assume that they are uncorrelated with r and that Z(t) represents certainty-equivalent benefits. The case of uncertain benefits is further discussed below.
10 In this chapter, we use E[.] to represent the expectation operator: that is, it represents the mean value of the random variable in brackets.
TABLE 6-1 Values and Implied Social Discount Rates in Selected Studies
| Author | Rate of Pure Time Preference (in %) | Risk/Inequality Aversion | Anticipated Growth Rate (in %) | Implied Social Discount Rate (in %) |
|---|---|---|---|---|
| Cline (1992) | 0.0 | 1.5 | 1.0 | 1.5 |
| IPCC (1996) | 0.0 | 1.5-2.0 | 1.6-8 | 2.4-16 |
| Arrow (1999) | 0.0 | 2 | 2.0 | 4.0 |
| UK: Green Book (HM Treasury, 2003) | 1.5 | 1 | 2.0 | 3.5a |
| U.S. Office of Management and Budget (2003)b | 3-7 | |||
| France: Rapport Lebègue (2005) | 0.0 | 2 | 2.0 | 4.0a |
| Stern (2007) | 0.1 | 1 | 1.3 | 1.40 |
| Arrow (2007) | 2-3 | |||
| Dasgupta (2007) | 0.1 | 2-4 | ||
| Weitzman (2007) | 2.0 | 2 | 2.0 | 6.0 |
| Nordhaus (2008) | 1.0 | 2 | 2.0 | 5.0 |
NOTES: The table shows the calibration of the discount rate based on the Ramsey rule; see text for discussion.
aDecreasing with the time horizon.
bOMB uses a descriptive approach.
SOURCE: Adapted from Intergovernmental Panel on Climate Change (2014c, Table 3-2).
SOURCE: Committee generated.
![]()
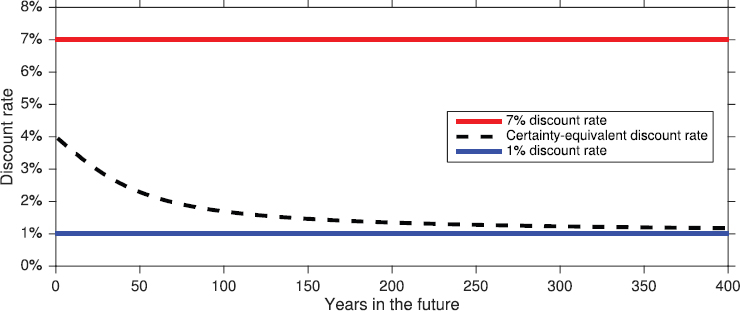
That is, Rt represents the certain discount rate that is equivalent to an uncertain discount rate in terms of the discount factor over a particular horizon (which is what matters for cost-benefit analysis).11 As shown in Figure 6-3, if r = 1 percent or 7 percent, each with probability 0.5, the certainty-equivalent discount rate decreases from 3.96 percent for a 1-year horizon to 1.69 percent for a 100-year horizon, to 1.17 percent for a 400-year horizon. The convexity of the discount factor guarantees that the certainty-equivalent discount rate is always less than E(r) and that it declines over time.12
In the more general case in which the discount rate is uncertain and varies over time, the expected discount factor is given by E[exp(–∑τ=1…t rτ)]. In this case, the shape of the Rt path depends on the distribution of the per-period discount rates, {rτ}. If {rτ} are independently and identically distributed, the certainty-equivalent discount rate is constant. There must be persistence in uncertainty about the discount rate for the certainty-
__________________
11 The literature sometimes refers to a certainty-equivalent “forward rate” equal to the appropriate rate to discount certain values between two adjacent future periods: that is, E(exp(–r(t + 1)))/E(exp(–rt)) = exp(–Rt+1(t + 1))/exp(–Rtt). This forward rate can thus be written in terms of our certainty-equivalent rate as (t + 1)Rt+1 – tRt.
12 This result is guaranteed by Jensen’s inequality, which states that the expectation of a convex function is always larger than the function of the expectation. Formally, E(exp(–rt)) > exp(–E(r)t)).
equivalent rate to decline. If, for example, shocks to the discount rate are correlated over time,
![]()
where π and a are fixed parameters and {ut} are independently and identically distributed random variables, then the certainty-equivalent discount rate will decline over time if a > 0 (Newell and Pizer, 2003).
In the Ramsey formula, uncertainty in the rate of growth in consumption can likewise lead to a declining certainty-equivalent discount rate. Arrow and colleagues (2014) note that the standard Ramsey formula for the consumption rate of discount can be extended to handle uncertainty about the rate of growth in consumption by subtracting a third “precautionary” term (Mankiw, 1981; Gollier, 2002). If growth is subject to independently and identically distributed shocks, this term will reduce the discount rate, but not cause it to decline.13
If random shocks to growth are positively correlated over time, however, the precautionary term in the Ramsey formula may become sizable in absolute value for long horizons, leading to a declining term structure of discount rates (see Gollier, 2012, for an extended survey).14 Uncertainty about the mean and variance of the rate of growth in consumption can also lead to a declining risk-free discount rate, rather than a constant exponential rate as used by the IWG (Weitzman, 2004, 2007; Gollier, 2008).
The IWG’s Approach
In estimating the SC-CO2, the IWG relies on guidance from OMB Circular A-4 and the economics literature to defend the use of a consumption rate of interest as the appropriate rate for discounting the net benefits of a marginal change in carbon emissions. The estimates that result from the SC-IAMs15 are measured in consumption-equivalent units: thus, a discount rate that reflects how individuals trade off current and future consumption is defensible in this setting.
The specific consumption rate of interest used to discount future
__________________
13 For independently and identically normally distributed shocks with variance σ2 and a mean growth rate of E(g), the certainty-equivalent discount rate r will be r = δ + ηE(g) – 0.5η2s2.
14 That is, the appropriate rate at which to discount a quantity at some future time t to the present declines as t grows.
15 These are the three integrated assessment models widely used to produce estimates of the SC-CO2: Dynamic Integrated Climate-Economy model (DICE), Framework for Uncertainty, Negotiation and Distribution model (FUND), and Policy Analysis of the Greenhouse Effect model (PAGE); see Chapter 1.
climate damages depends on the correlation between damages and consumption. The exact value of future climate damages is inherently uncertain. So long as these damages have little correlation with the growth of consumption, it is appropriate to discount expected damages at a risk-free rate. That is, one would use a discount rate associated with either the expected growth rate under a prescriptive, Ramsey approach or a relatively low-risk bond (e.g., U.S. government bonds) under a descriptive approach. Alternatively, if damages are positively correlated with consumption, the discount rate would be larger, and if they are negatively correlated with consumption, the discount rate would be smaller than the risk-free discount rate.
Existing OMB guidance on discounting does not fully address the issue of discounting over long horizons or the effect of uncertainty on discount rates, both of which directly influence the SC-CO2 estimates. The IWG made modifications to adapt the OMB guidelines to reflect these points. Specifically, the IWG chose three constant, exponential annual discount rates (2.5, 3.0, and 5.0%) and presented results conditional on each of these discount rates.
The central value of a 3.0 percent rate, consistent with the consumption rate of interest in OMB Circular A-4 guidance, is meant to reflect the post-tax, risk-free interest rate. The 5.0 percent rate is included to represent the possibility that climate damages are positively correlated with consumption growth. Uncertain investments with a high payoff in better times, and low payoff in worse times, are less valuable and require a higher rate of return than investments without such correlation. This would be the case if most of the impacts of climate change increase with the size of affected market sectors, such as real estate, agriculture and energy, or affect nonmarket sectors such as ecosystem quality or health, for which willingness to pay typically increases with consumption levels, thus leading to a positive correlation between the net benefits from climate policies and market returns (Interagency Working Group on the Social Cost of Carbon, 2010). Lastly, the 2.5 percent rate is intended to reflect uncertainty in the discount rate itself, as discussed in the previous section, as well as possible negative correlation between climate damages and consumption (i.e., the opposite of the rationale for 5.0%). The rate is based on the average certainty-equivalent rate of the random walk and mean-reverting models posited by Newell and Pizer (2003). This approach utilizes observed interest rates on Treasury notes to measure the risk-free consumption rate of interest (Interagency Working Group on the Social Cost of Carbon, 2010) and assumes no correlation between damages and the discount rate. Notably, the majority of climate change impacts studies cited in the AR5 use an implied social discount rate of no more than 5 percent (Kolstad et al., 2014).
In the executive summary of the Technical Support Document, the IWG presents results conditional on each of the three assumed discount rates for different years of emissions (see Figure 1-1 in Chapter 1). The SC-CO2 per metric-ton of CO2 emitted in 2020 is $12 using a 5.0 percent discount rate; $42 using a 3.0 percent discount rate; and $62 using a 2.5 percent discount rate (all in 2007 dollars). This comparison highlights the importance of the choice of discount rate on SC-CO2 estimates: the SC-CO2 estimate for the central discount rate (3.0 percent) is more than three times the magnitude of the estimate using largest discount rate (5.0 percent).
CONCLUSION 6-1 In the current approach of the Interagency Working Group, uncertainty about future discount rates motivates the use of both a lower 2.5 percent rate and higher 5.0 percent rate, relative to the central 3.0 percent rate. However, this approach does not incorporate an explicit connection between discounting and consumption growth that arises under a more structural (e.g., Ramsey-like) approach to discounting. Such an explicit analytic connection is especially important when considering uncertain climate damages that are positively or negatively associated with the level of consumption. The Ramsey formula provides a feasible and conceptually sound framework for modeling the relationship between economic growth and discounting uncertainty.
Discounting Climate Benefits in RIAs
In RIAs that use SC-CO2 estimates to quantify climate benefits, there are two typical approaches to discounting: a “snapshot” year and a cumulative net present value.16 A snapshot year approach calculates the change in CO2 emissions occurring in a given year (e.g., 2030) and discounts the reduction in future damages that accrue from those marginal emissions changes back to 2030. In practice, this means multiplying these emission changes by an SC-CO2 estimate for that year. Other costs and benefits are then computed for effects of other policy-induced changes in 2030, including benefits from non-CO2 emission reductions in 2030 that may accrue in future years. These benefits are combined with the estimated change in CO2 mitigation benefits. The result is a “snapshot” of net ben-
__________________
16 For an example of the snapshot year approach, see the RIA for the Clean Power Plan Final Rule from the U.S. Environmental Protection Agency (EPA): https://www.epa.gov/sites/production/files/2015-08/documents/cpp-final-rule-ria.pdf [January 2017], pp. ES-19 through ES-23. For an example of the net present value approach, see the RIA for EPA’s CAFE Standards Final Rule: https://www.regulations.gov/document?D=EPA-HQ-OAR-2009-0472-11578 [January 2017], pp. 7-127 through 7-134.
efits associated with all (CO2 and non-CO2) emission changes in 2030. With this approach, a series of snapshot years are often chosen, with CO2 mitigation benefits combined with other cost and benefit estimates for policy changes in each of those snapshot years. If this approach is used, costs and benefits in each snapshot year are not typically discounted back to present day and combined. In contrast, a net present value approach effectively does the same thing, but then computes a net present value of net benefits across snapshot years.
In most RIAs, different discount rates are used to compute the costs and benefits of different emission changes in each snapshot year. The discount rates applied to CO2 benefits from emission changes in a snapshot year are 2.5, 3.0, and 5.0 percent (plus the 95th percentile for the 3.0 percent rate), following guidance from the IWG Technical Support Document (Interagency Working Group on the Social Cost of Carbon, 2010). Meanwhile, the discount rates applied to benefits from other emission changes in a snapshot year are 3.0 and 7.0 percent, the standard rates from OMB Circular A-4. Estimates are calculated for each of these benefit-discount rate combinations in each snapshot year. Not all of these estimates, however, are presented in summary material for the RIAs. In the Clean Power Plan Final Rule, for example, only the CO2 benefits for a 3.0 percent discount rate are presented in the executive summary.
Similarly, when discounting climate and nonclimate benefits back to the present day under the cumulative net present value approach, discount rates remain consistent within benefits categories. That is, discounted damages for some future snapshot year are discounted back to the present using the same rates used to discount to the snapshot year. The choice of discount rates used is determined, essentially, by whether one is discounting climate or other benefits.
Both approaches illustrate the challenge of combining cost and benefit estimates when only some categories of cost and benefits have an intergenerational component. Absent an intergenerational component, OMB instructions to discount using 3.0 and 7.0 percent can be viewed as striking a balance between simplicity and analytical rigor. This intragenerational context represents the vast majority of applications. In an intergenerational context, however, OMB itself recognizes that the simple approach is insufficient and that additional ethical considerations arise. Confronting these issues and concerns in the SC-CO2 context leads to the use of generally lower discount rates, but it leaves unresolved how they might be combined with intragenerational costs and benefits.
LINKING UNCERTAINTY IN DISCOUNT RATES AND UNCERTAINTY IN ECONOMIC GROWTH
As noted in the above discussion, persistent uncertainty about future discount rates mathematically leads to a declining certainty-equivalent rate, which is the rate at which a certain benefit at time t would be discounted to the present. A considerable literature has grown up around this issue and demonstrated that such declining rates arise regardless of whether discounting uses a descriptive or prescriptive approach (Arrow et al., 2014; Cropper et al., 2014).
In the IWG approach, 3.0 percent has been used as a central value, motivated by the average risk-free rate measured over a very long period. An alternative low value of a 2.5 percent rate was largely motivated by this uncertainty and the declining rate argument. The IWG is not alone in this consideration. Both the United Kingdom and France have adopted declining discount rates for cost-benefit analysis based on these arguments.
As one confronts the reality that future discount rates are uncertain, an important complication is that the discussion of declining rates applies in its simplest form to a certain flow of costs and benefits. Alternatively, the costs and benefits being discounted may be uncertain but uncorrelated with any uncertainty about the discount rate. That is, suppose one is attempting to compute
E[exp(–rt)Xt],
where r is an uncertain discount rate, and Xt is an uncertain climate change impact. It is correct to rewrite that as
E[exp(–rt)]E[Xt]
if r and Xt are uncorrelated. But if they are correlated, a covariance term arises: it will be a negative effect in the case of positive correlation, lowering the expected net present value of damages, and positive in the case of a negative correlation, thus raising it. For a variety of reasons discussed below, uncertain future climate change impacts may well be correlated with uncertain future discount rates. Before discussing this point, we further explore why the IWG used a related line of thinking to argue for use of a 5.0 percent rate (and to provide an additional motivation for a 2.5 percent rate).
Correlation between Impacts and Discounting
One important reason for potential correlation between damages and discounting is that damages directly related to economic activity are tied to the overall size of the future economy, while the value of impacts on human health and mortality are likely tied to future per capita consumption levels. Both of these relationships exist in the current SC-IAM damage formulations (see Chapter 5). Even if future climate damages were relatively certain in terms of the fraction of pre-damage consumption levels, they would still be strongly correlated with uncertain economic growth (possible countervailing effects are discussed below).
Under a Ramsey approach to discounting, higher consumption per capita also implies greater discounting. Under a particular consumption growth scenario,
rt(gt) = δ + η.gt,
where rt is the discount rate over t periods, that is, the rate used to discount net benefits in period t to the present period 0. The formula highlights that this discount rate is a function of gt, the growth rate in consumption over the same t periods. As above, δ is the pure time preference rate and η measures how fast the marginal utility of consumption declines as consumption grows.
In perhaps the earliest integrated assessment under uncertainty, Nordhaus (1994b) explores alternative paths of economic growth rates. In this Ramsey-style model, the analysis implies both alternative magnitudes of climate impacts and alternative discount rates. In more recent work looking at the SC-CO2 estimates, Nordhaus (2011) found little impact of growth uncertainty (or other uncertainty) on the SC-CO2. He argues that low growth/low discounting scenarios are also low temperature/ low damage outcomes. Even more recently, Nordhaus (2014) reframes this result as emphasizing the importance of r – g (what one might call “growth-adjusted” discounting) for the SC-CO2 estimates when marginal damages scale directly with economic activity and growth. For η near 1 and climate damages roughly proportional to total consumption, (r – g) is relatively constant over various consumption growth rates, and so is the SC-CO2.17 As an alternative, one could imagine increased climate resilience at higher incomes leading to lower, possibly negative correlation between economic growth and damages. Without drawing conclusions about the specific relationship between damages and economic growth,
__________________
17 For η = 1 and damages exactly proportional to total consumption, as in DICE, the dependency of discounted damages on the size of the economy is removed entirely, and discounting is determined entirely by the pure time preference rate.
this argument makes clear the potential correlation between discounting and damages can make a difference in SC-CO2 estimates.
There is a second important reason to consider correlation of climate change impacts and discount rates. The potential for catastrophic impacts raises the possibility that some uncertain outcomes may involve much lower rates of economic growth and higher incremental damages because of climate change (Sandsmark and Vennemo, 2007; Kopp et al., 2012; Murphy and Topel, 2013). The implication would be a higher expected present value of damage than if the correlation is ignored. However, making this argument operational requires an integrated assessment model with a well-specified model of catastrophic damages.
It is less clear what relationship ought to exist between economic growth and discounting under a descriptive approach. One can write out the Ramsey relationship without interpreting the parameters in terms of welfare. That is, it is possible to imagine interest rates varying with the rate of per capita consumption growth without deriving the Ramsey equation from an optimal growth model. The historical evidence on the correlation between consumption growth and market interest rates is, however, difficult to interpret. Hall (1988) was one of the first to examine this question, and he found little correlation over time between short-term consumption growth and interest rates in the aggregate data. Examining term structures, however, Harvey (1988) noted that future growth is higher when longer-term rates exceed short-term rates, which suggests that long-term rates (or their difference from short-term rates) are correlated with future growth. Of course, there is only limited evidence on the term structure over multicentury time horizons (Giglio et al., 2015).
Gollier (2014) provides an alternative framework for considering the same set of issues through a standard consumption-based capital asset pricing model. In this framework, the appropriate rate for discounting future climate change impacts is
rt = rft + βπt,
where rt is the discount rate used to discount period t to the present, rft is the risk-free rate over this period, πt is a measure of uncertainty about future average consumption growth over this period, and β is a measure of how future climate impacts vary with consumption.18 As above, persistent uncertainty about consumption growth leads to a declining risk-free term structure, reflected in a declining value of rft over longer horizons. That same persistent uncertainty about consumption growth
__________________
18 Specifically, the Gollier (2014) model assumes climate impact at time t is proportional to cBt.
will also lead to a rising risk premium, reflected in a rising value of πt over longer horizons. The correlation between consumption growth and climate impacts reflected in β can lead to a rising or falling term structure, depending on the sign of the correlation. Specifically, Gollier (2014) shows that if b > η/2, the net effect is a rising term structure. As Gollier and Hammitt (2014) note, whether one effect or the other is dominant is “exploratory and controversial.”
RECOMMENDATION 6-1 The Interagency Working Group should develop a discounting module that explicitly recognizes the uncertainty surrounding discount rates over long time horizons, its connection to uncertainty in economic growth, and, in turn, to climate damages. This uncertainty should be modeled using a Ramsey-like formula, r = δ + η.g, where the uncertain discount rate r is defined by parameters δ and η and uncertain per capita economic growth g. When applied to a set of projected damage estimates that vary in their assumptions about per capita economic growth, each projection should use a path of discount rates based on its particular path of per capita economic growth. These discounted damage estimates can then be used to calculate an average SC-CO2 and an uncertainty distribution for the SC-CO2, conditional on the assumed parameters.
Practical Assessments of the SC-CO2 with Uncertain Outcomes, Economic Growth, and Correlation
Representation of the uncertainties and their interrelationships through Monte Carlo simulations allows explicit exploration of the implications of discount rate uncertainty for the discounting of future climate change impacts. Choosing particular values for δ and η leads to a particular value for the risk-free discount rate over a given time period conditional on economic growth (gt). Simulating uncertain pathways for economic growth can thus generate a term structure for the risk-free rate rft(gt). That is, it can produce the rate appropriate for a stream of certain climate impacts or for climate impacts that are uncorrelated with economic growth.
However, it is possible to do more: specifically, it is possible to simulate climate change outcomes for each gt pathway. For each Monte Carlo simulation, the discounted SC-CO2 contribution from each period can then be computed using the value of rft(gt) that corresponds to that gt pathway. Then, the SC-CO2 itself can be computed by averaging discounted SC-CO2 contributions across simulations and adding over periods. It is also possible to infer the discount rate term structure for climate change
NOTE: See text for discussion.
impacts by comparing the average discounted SC-CO2 contribution from each period to the average undiscounted contribution.19
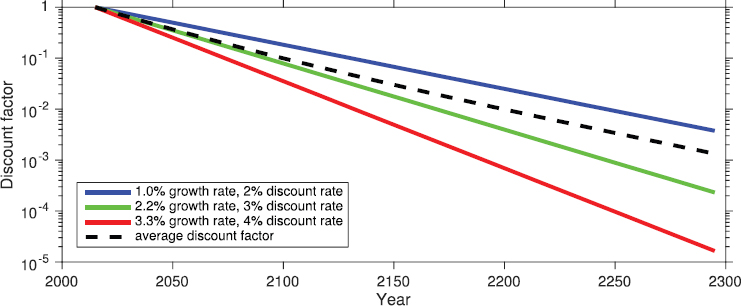
As an example, consider the following stylized model using the three, equal-probability economic growth scenarios described in Chapter 3, with constant per capita growth rates of 1.0 percent, 2.2 percent, and 3.3 percent. Also assume, for example, that δ = 1.1 percent and η = 0.88. Based on the Ramsey formula, the appropriate discount rates for the 1.0 percent, 2.2 percent, and 3.3 percent growth scenarios are, respectively, 2.0 percent, 3.0 percent, and 4.0 percent. With these assumptions, the committee calculated discount factors for each growth scenario, which are shown in Figure 6-4, along with the average discount factor for each future year assuming equal weights on the scenarios.
Importantly, representing uncertainty about the appropriate discount rate with multiple scenarios, each having a different constant discount rate, implies a declining discount rate. That is, in calculations of the present value of a future certain value (e.g., of damages) or an uncertain value that is uncorrelated with economic growth, the effective discount
__________________
19 If agencies continue to use the net present value (NPV) approach for RIAs, it requires discounting the SC-CO2 associated with emissions in each future year back to the current year. This could be accomplished in several ways. The IWG could present a table of the SC-CO2 for each future year to be used for calculations using the snapshot year approach, as well as a table of the SC-CO2 in current year dollars for calculations using the net present value approach. Alternatively, the IWG could present a table of appropriate discount factors derived from the discount rate term structure for climate impacts noted above. Yet another alternative is that the IWG could suggest using the near-term certainty-equivalent rate associated with each SC-CO2.
rate declines over longer horizons. This outcome can be seen by using the average discount factor from Figure 6-4 to compute the corresponding certainty-equivalent discount rate—the rate that would be used to discount damages in each period back to 2015.20 This is shown in Table 6-2 for the illustrative example in Figure 6-4.
The decline in the certainty-equivalent rate from 3.0 percent in 2015 to 2.4 percent in 2295 is a direct implication of allowing the rate of per capita consumption growth to be uncertain. Rather than using uncertain future discount rates to motivate a lower, fixed discount rate as the IWG did in its rationale for a 2.5 percent rate, allowing the rate of growth in consumption to be uncertain explicitly models that behavior. This approach implies a declining effective discount rate over long horizons for known future values or values uncorrelated with economic growth.
Consideration of Correlation of Discounting, Economic Growth, and Climate Damages
To incorporate climate change damages in the committee’s example, imagine that other assumptions about population, emissions, climate change, and impacts yield the pattern of incremental damages over time from 1 metric ton of CO2 emitted in 2015 for each of these three growth scenarios shown in Figure 6-4. Note that in this particular example, damages are positively related to economic growth: see Figure 6-5a.21
As noted throughout this report, there are many sources of variation in damages distinct from variation in economic growth. There may be many more scenarios than the three in Figure 6-5a, but each would have an associated path of economic growth rates. To illustrate how this discount rate schedule could be implemented in practice, each of these three projected damage estimates would be discounted on the basis of a discount rate defined by the assumed growth rate path in that projection. For the committee’s example, one would multiply each projection of the damages in Figure 6-5a by the corresponding projection of discounting Figure 6-4: the result is shown in Figure 6-5b.22
To construct a valid SC-CO2 estimate, the values for each scenario are then summed: in our purely illustrative example, this would yield
__________________
20 To illustrate, in Figure 6-4, the average discount factor for 2035 is 0.56. The certainty-equivalent discount rate rf20 is the solution to the equation: 0.56 = exp(–20* rf20); in this case, rf20 = 0.029.
21 The committee used a version of the DICE model to generate these damages: the key feature is that damages scale almost exactly with economic activity.
22 To illustrate, for each year, the damage based on a 1.0 percent growth rate in Figure 6-5a (the blue curve) is multiplied by the corresponding discount factor in Figure 6-4, given by the blue line.
TABLE 6-2 Expected Discount Factor Based on Example Scenarios and Corresponding Certainty-Equivalent Discount Rates
| Discount Factors and Discount Rates | 2015 | 2035 | 2055 | 2075 | 2095 | 2115 | 2135 | 2155 | 2175 | 2195 | 2215 | 2235 | 2255 | 2275 | 2295 |
|---|---|---|---|---|---|---|---|---|---|---|---|---|---|---|---|
| Average Discount Factor | 1.00 | 0.56 | 0.32 | 0.19 | 0.11 | 0.071 | 0.044 | 0.028 | 0.018 | 0.011 | 0.0074 | 0.0048 | 0.0032 | 0.0021 | 0.0014 |
| Certainty-Equivalent Rate (in %) | 3.0 | 2.9 | 2.9 | 2.8 | 2.8 | 2.7 | 2.6 | 2.6 | 2.6 | 2.5 | 2.5 | 2.5 | 2.4 | 2.4 | 2.4 |
NOTES: The three growth scenarios are shown in undiscounted dollars. The population projection is fixed for simplicity.
SOURCE: Committee generated.
SC-CO2 estimates in the range of $38, $47, and $52 per ton, respectively, for the 1.0, 2.2, and 3.3 percent economic growth scenarios. The average of these values (and others) would yield a central SC-CO2 estimate and the distribution used to describe a reasonable range of uncertain values. It is interesting to note that the estimates in each of the three scenarios are similar in this example. The lower discount factors (associated with higher discount rates) for high-growth scenarios largely offset the higher damages associated with those same high-growth scenarios.
Conversely, consider a case in which income is protective against climate damages. As an extreme example, suppose in the above case that, once global GDP reaches five times its current level, the world is sufficiently technologically advanced to eliminate all future climate damages. In this case, the SC-CO2 estimates for the three economic growth scenarios
would be $30, $19, and $15 per ton, respectively, for the 1.0, 2.2, and 3.3 percent economic growth scenarios; the lower discount factors (associated with higher discount rates) for high-growth scenarios would exaggerate the difference between the scenarios.
A more complicated scenario would occur if climate change damages were sufficiently large, with some probability, to alter the path of economic growth to an appreciable extent. As noted earlier, this would require a model of catastrophic damages that feed back to economic growth.
PARAMETERIZATION OF A RAMSEY-LIKE APPROACH FOR SC-CO2 DISCOUNTING
The preceding discussion describes how one might simulate the combined effects of uncertainty on discounting and damages in a consistent way, but it does not address the question of how the parameters of a Ramsey-like approach might be chosen. Motivated by the Ramsey model itself, one could look to empirical assessments of pure time preference and utility curvature. That is, one could make an ethical judgment that social preferences would reflect individual preferences revealed through individual behavior. For example, the Intergovernmental Panel on Climate Change (2014c) report suggested a range of possible values of 0-2 percent for pure time preference (δ) and of 1-4 for risk/inequality aversion (η) as noted in Table 6-1 (above), many of which were driven by such an approach.
It is worth noting that the simulations described in the preceding section with δ and η chosen as normative welfare parameters may not lead to rates that are comparable to observed discount rates. Alternatively, one could choose those parameters to match empirical features of observed interest rates and the long-term relationship between interest rates and economic growth (as in Nordhaus, 2014). For example, given an initial economic growth rate, it is possible to pick combinations of δ and η that match, for initial years of the SC-CO2 calculation, the central value of 3 percent used by the IWG. Among the locus of such values, there will be a range of resulting term structures for the risk-free rate describing how the discount rate changes after the initial years. That is, all would start at 3 percent, but would decline in the future based on the uncertainty surrounding future economic growth and the choice of parameters. For example, picking δ = 3 percent and η = 0 would yield a flat term structure.
One can use the above simulation framework (with equally probable growth rates of 1.0, 2.2, and 3.3 percent) to examine the implications of alternate values of δ and η for the term structure. The above simulation assumed δ = 1 percent and η = 0.88, yielding a 2015 certainty-
equivalent rate of 3 percent and a 2295 rate of 2.4 percent (see bottom row of Table 6-2). Note that δ = 3 percent and η = 0 yields a flat term structure with both the 2015 and 2295 rates being 3 percent. A few other experiments the committee calculated are shown in Table 6-3.
In the example in the preceding section, a key choice is what near-term rate to match. A potential guidepost is the regulatory framework in which the SC-CO2 will be used. OMB provides considerable guidance concerning discount rates and their use in regulatory analysis, particularly with respect to consumption-based impacts (e.g., the 3% rate).
In addition to choosing δ and η based on various considerations, there is a final consideration of how to present results. If one views δ and η as uncertain parameters in the SC-CO2 calculation and it is plausible to consider their joint distribution, one could include them with other uncertain parameters. This would lead, ultimately, to a single mean estimate of the SC-CO2, along with a distribution that might be summarized on the basis of a particular prediction interval. Alternatively, if one views δ and η as ethical or policy parameters, the treatment of uncertainty about these parameters needs to be distinct from the treatment of uncertainty about the growth rate. Moreover, current OMB guidance suggests specific sensitivity analysis with respect to the discount rate because of its potentially dramatic effect on policy evaluation. Therefore, one could present a set of SC-CO2 estimates based on different specified values of δ and η. That is, conditional on several different choices of δ and η, a distribution of SC-CO2 values (including an average value) could be presented to reflect other sources of uncertainty in the computation of the SC-CO2.
RECOMMENDATION 6-2 The Interagency Working Group should choose parameters for the Ramsey formula that are consistent with theory and evidence and that produce certainty-equivalent discount rates consistent, over the next several decades, with consumption rates of interest. The IWG should use three sets of Ramsey parameters, generating a low, central, and high certainty-equivalent near-term discount rate, and three means and ranges of SC-CO2 estimates.
Given an average per capita GDP growth rate, E[g], Table 6-3 shows that a variety of δ and η values can target the implied near-term discount rate given by r = δ + η E[g]. Moreover, the certainty-equivalent rate remains relatively constant over several decades. While the long-term certainty-equivalent rates will vary over ranges for δ and η that are consistent with theory and evidence, the SC-CO2 itself is likely to be less sensitive to alternative choices of δ and η if they are chosen to target
TABLE 6-3 Combinations of Pure Time Preference (δ) and Risk/Inequality Aversion (η) Consistent with a Discount Rate of 3.0 Percent in 2015
| δ (%) | η | 2015 Rate (%) | 2055 Rate (%) | 2295 Rate (%) |
|---|---|---|---|---|
| 0.1 | 1.33 | 3.0 | 2.7 | 1.9 |
| 1.1 | 0.88 | 3.0 | 2.9 | 2.4 |
| 2.1 | 0.42 | 3.0 | 3.0 | 2.8 |
| 3.0 | 0.00 | 3.0 | 3.0 | 3.0 |
the same near-term discount rate.23 When choosing values of δ and η to match a particular near-term rate, the IWG could test the sensitivity of the SC-CO2 to alternative values and be especially wary of values that lead to nonconvergent sequences of discounted damages (i.e., damages that grow faster than the discount rate).
One way to construct low, central, and high estimates would be to consider empirical evidence on the possible range of consumption-based, near-term market rates (e.g., government bonds). Alternatively, one could consider other judgments about appropriate high and low values around a central, market-based estimate. In any case, however, note that our recommendation for three rates in no way endorses the targeting of a near-term 7 percent discount rate as the high rate or the targeting of a near-term 3 percent discount rate as the lowest sensible low rate.
First, a portion of the argument for a 7 percent discount rate rests on uncertainty and correlation with market returns. Our recommended approach accounts for these factors directly. Second, another portion of the argument for a 7 percent discount rate rests on the tax wedge between returns to investment and the net-of-tax return received by consumers. As highlighted by Bradford (1975) and Lind and colleagues (1982), the return to investment is the correct discount rate only under very restrictive assumptions. Finally, the notion put forward in our recommendation is that of a sensitivity analysis around a central value. An implication is that, if the central parameterization for discounting is associated with a near-term 3.0 percent rate, as in the current IWG approach, then the low and high values would be on either side of 3.0 percent.
RECOMMENDATION 6-3 The Interagency Working Group should be explicit about how the SC-CO2 estimates should be combined in regulatory impact analyses with other cost and benefit estimates that may use different discount rates.
__________________
23 This is not to say that there is no sensitivity and, particularly when considering the risk of catastrophic damages, the choice of η and δ may be more difficult.
The committee sees at least two options for how SC-CO2 estimates based on Recommendation 6-2 (above) could be combined in RIAs with other cost and benefits estimates that may use different discount rates. First, the IWG could present high and low parameterization results as a sensitivity analysis meant to illustrate the effect on the SC-CO2 and instruct agencies to focus only on the central parameterization in RIAs. Second, the IWG could suggest all three discount rate parameterization results be used when appropriate in RIAs. The central value could be used in situations in which only one discount rate scenario is presented for other RIA benefits and costs. When estimates of other costs and benefits are presented using multiple discount rates, there would need to be guidance on how to pair estimates that are based on a particular discount rate with the SC-CO2 parameterization. Here, one could imagine several options: (1) combining other cost and benefit estimates with the SC-CO2 estimate whose near-term discount rate most closely matches that particular discount rate; (2) combining other costs and benefits based on a high discount rate with the SC-CO2 estimate based on its highest discount rate, and analogously combining the low discount rate estimates; and (3) presenting all discount rate combinations of other costs and benefits with SC-CO2 estimates. As discussed above (“Approaches to Discounting and Their Applications”), combining estimates of costs and benefits when only some categories have an intergenerational component raises challenges that have yet to be resolved.
OTHER DISCOUNTING ISSUES
Time Consistency and Uncertain Discount Rates
One objection frequently made to the use of a declining discount rate is that it may lead to problems of time inconsistency. Time inconsistency refers to a change in expected net benefits due solely to the passing of time. Consider what happens when the expected present value of damages associated with emitting 1 metric ton of CO2 in 2035 is evaluated in 2015 (e.g., for a regulation implemented in 2015 that affects emissions in 2035). Damages occurring in 2055 from those 2035 emissions are discounted back to 2035 using a certainty-equivalent rate of 2.85 percent (see Table 6-2 above). Now imagine the damages associated with emitting 1 metric ton of carbon in 2035 are recomputed in 2035 and the discount schedule in Table 6-2 has not changed. That is, the first column of discount factor/rates is the same (1 and 3 percent) but applies to 2035. Now damages in 2055 will be discounted to 2035 using a higher certainty-equivalent rate of 2.9 percent. This occurs because in 2035, 2055 will be closer to the present. Although the changes are small, one can imagine larger effects
over longer horizons that might affect the preference for one or another option.
This apparent inconsistency is not in fact inconsistent. The discount rate schedule shown in Table 6-2 corresponds to the distribution of future growth rates given information available in 2015. At present, no one knows what the distribution of future growth rates in 2035 will be; it may be different or the same as the distribution in 2015. Even if it turns out to be the same as the distribution in 2015, that realization is new information that was not available in 2015.
Regional Disaggregation and Discounting
The possibility of disaggregating damages by geographic region (see Chapter 5) raises the issue of whether region-specific discount rates might be used to discount damages. Two approaches can be taken to the issues of aggregating damages across regions and discounting. Damages can be aggregated across regions in a given year to yield global damages, and global damages can be discounted, as described above. Alternately, damages could be discounted to the present for each region and then aggregated. The discount rates in each region could be region-specific based on region-specific growth rates. Currently, the IWG employs the former approach.
Using region-specific discount rates requires values of δ and η for each region, as well as a distribution over the rate of growth of per capita consumption in each region. Treating future generations differently based on where they live—whether due to differing values of δ and η or to differing growth rates—suggests a need to treat current generations differently on the basis of where they live. This raises the issue of how such regional weights would be determined.24 The current approach avoids this issue and, by applying the same discount rate to all countries, is in the spirit of OMB guidance, which calls for treating equally persons of different income levels at a given time, for the purposes of valuation.
__________________
24 Note that in a simple formulation, η would be a basis for both how marginal utility declines with economic growth and how differences in levels of economic development are weighted. This need not be the case in general.


