
2
Current Challenges and Opportunities in Federal Statistics
This chapter discusses the importance of federal statistics for the country and provides an overview of the federal statistical system, which is responsible for providing relevant, credible, and timely information to inform policy makers and the public. We describe how sample surveys have come to dominate federal statistics, as well as the current threats to this paradigm, including declining response rates and rising costs. We conclude the chapter with a discussion of the growing demand and expectations for more timely information and their implications for trying to continue to rely solely on sample surveys for federal statistics.
THE U.S. FEDERAL STATISTICAL SYSTEM
Since the founding days of the country, the system of national statistics has changed many times in response to growing needs for data, developments in technology and statistical methodology, decreasing response rates, and increasing concern about privacy (Bellhouse, 2000; Duncan, 1976; Sylvester and Lohr, 2005). The U.S. federal statistical system is highly decentralized, with statistical activities spread across approximately 125 agencies of the federal government (U.S. Office of Management and Budget, 2015b). There are 13 principal statistical agencies, whose primary mission is producing statistics.1 The U.S. Office of Management and Budget (OMB)
___________________
1 These agencies are the Bureau of Economic Analysis; Bureau of Justice Statistics; Bureau of Labor Statistics; Bureau of Transportation Statistics; Census Bureau; Economic Research Service; Energy Information Administration; National Agricultural Statistics Service; National
is charged (44 U.S. Code §3504(e)) with coordinating the federal statistical system, including issuing standards, guidelines, and statistical directives to all agencies to ensure that agencies use common classifications, definitions, and appropriate methodologies in producing statistical products, as well as with enforcing standards through centralized review of all agency information collections as required by the Paperwork Reduction Act (P.L. 104-13).
At OMB, the U.S. chief statistician leads a small staff in the Statistical and Science Policy Branch (SSP) of the Office of Information and Regulatory Affairs (OIRA) to carry out these activities and chairs the Interagency Council on Statistical Policy (ICSP), which is composed of the heads of the principal statistical agencies and is codified in the Paperwork Reduction Act (44 U.S. Code §3504(e)(8)). ICSP improves coordination and communication across the system through monthly meetings to discuss activities and issues across the agencies, to exchange information about agency programs and activities, and to provide advice and counsel to OMB on statistical matters.
Over the past century, there have been a number of studies of the U.S. federal statistical system that have documented needed improvements. Norwood (1995) reviewed 15 different committees, commissions, and study groups that examined the federal statistical system in the 20th century, and she found that these groups uniformly recommended greater centralization of the system or greater coordination of the decentralized system. However, few actions have ever been taken on those recommendations.
THE IMPORTANCE OF FEDERAL STATISTICS
Federal statistics shape decisions by the public, by businesses, and by government agencies, such as the Federal Reserve Board of Governors, which sets monetary policy and the target for the federal funds interest rate. Many federal statistics are eagerly awaited since the business community demands timely information on the economy. The Bureau of Economic Analysis (BEA) publishes three estimates for the U.S. gross domestic product (GDP) for each quarter, with the “initial” estimate released 30 days after the end of each quarter to provide as timely information as possible. The following month a “second” estimate is released: it includes more complete data than was available the previous month. The next month, the “third” estimate for the quarter is released, based on the most complete data.2 There can be substantial revisions among these estimates, but the
___________________
Center for Education Statistics; National Center for Health Statistics; National Center for Science and Engineering Statistics; Office of Research, Evaluation and Statistics in the Social Security Administration; and Statistics of Income Division in the Internal Revenue Service.
2 See http://www.bea.gov/methodologies/index.htm#national_meth [January 2017].
demand for timely information seems to outweigh concerns about later changes.
Federal statistics, such as GDP and the employment situation noted in Chapter 1, represent 2 of the 36 designated principal federal economic indicators, which OMB recognizes as statistics that have the potential to move markets when publicly released. Therefore, these statistics are subject to careful controls on the timing and handling of these statistical releases (U.S. Office of Management and Budget, 1985).
Beyond the economy, statistical reports of the crime victimization and criminal justice activities are critical for having informed national discussions about policing, sentencing, crime, and race, as well as legislative efforts to reform the criminal justice system. Statistical evidence about the relative prevalence of health conditions is used to allocate funding to ameliorate those conditions. Epidemiological statistics about the prevalence of infectious disease are used to allocate resources to combat epidemics (National Institutes of Health, 2016). In short, federal statistics matter.
Statistics for the common good are embedded in the very foundation of the United States and are central for the nation’s democratic foundation and its economic and social well-being. Statistics derived from high-quality data promote informed decision making and strengthen democratic institutions by informing the public and enabling them to hold leaders accountable. The Constitution (Article 1, Section 2) specifies a decennial census to ensure proportional representation in the House of Representatives, beginning with the first census conducted in 1790. The first statistical agency was created in the 1860s in the Treasury Department, followed by the establishment of units in the Departments of Agriculture and Education (see Bureau of the Census, 1975; Norwood, 1995). As needs for information grew, new statistical agencies were formed in various other departments.
The United States is not unique in its belief in the importance of objective statistical information. Almost every country in the world has established a system of statistical indicators that cover macroeconomic performance, health, labor, agriculture, demography, crime, tobacco and drug use, transportation, and energy that assist in planning, investments, and the development of national priorities. Indeed an informed public requires information about the status of the country (Holdren, 2010; Prewitt, 2010). In that sense, statistical information about the welfare of the country is indispensable to a well-functioning democracy (Holt, 2007; Norwood, 2016).
Given the importance of national statistics, their quality and timeliness also matter a great deal. Even a slight underestimate or overestimate can have multibillion dollar impacts on the country. For example, the report of the Boskin Commission (Advisory Commission to Study the Consumer Price Index, 1996) estimated that the consumer price index produced by the
Bureau of Labor Statistics (BLS) at that time overstated the cost of living by 1.1 percentage points and noted that, if true, “would contribute about $148 billion to the deficit in 2006 and $691 billion to the national debt by then” (pp. 1-2).
In another example, Reamer (2014, pp. 3-4) describes how the lack of regularly updated services industries data prior to 2009 affected the quarterly GDP measure at the beginning of the great recession:
[T]he erroneous January 2009 prediction by Christina Romer and Jared Bernstein, President-elect Obama’s top economic advisers, that the passage of a Recovery Plan of “slightly over $775 billion” would keep the national unemployment rate below 8 percent was based on the overly optimistic GDP data available at the time. At the time, the latest available GDP estimates were a 1.0 percent annual rate of growth in the first quarter of 2008 (2008Q1), a 2.8 percent annual growth rate in 2008Q2, and a 0.5 percent annual rate of decline in 2008Q3. By 2011, BEA had revised these numbers to minus 1.8 percent, plus 1.3 percent, and minus 3.7 percent, respectively.
By the time Congress passed the Recovery Act in February 2009 ($787 billion initial estimate), BEA had issued another, relatively dire GDP number, an annual rate of decline in 2008Q4 of minus 3.8 percent. By 2011, BEA revised that figure to minus 8.9 percent.
These examples demonstrate how important it is that the federal statistical system provide the most accurate and timely indicators, as the country’s economic well-being relies upon the accuracy of these statistics. Economic and social policy is in large extent informed by measurements that are produced by statistical offices. Therefore, mistakes in the measurement will be translated to mistakes in policies. Such mistakes are invariably costly. Inaccuracies in statistical indicators could mean unfair allocation of funds among states (National Research Council, 2003; Seeskin and Spencer, 2015; U.S. Government Accountability Office, 2003, 2009a) and could also affect governmental and business decision making. For example, mismeasurement of the inflation rate has consequences on wage negotiations, retirement income, and asset prices. Similarly, mismeasurement of economic activity has consequences for fiscal and economic policy decisions.
It is of critical importance for the country not only that federal statistical agencies provide indicators that assist planning, investments, and the development of national priorities, but also that they do so in an objective manner. Since all statistics have limitations, the credibility of statistical information requires transparency of methods (Miller, 2010), documentation of error qualities, and absolute protection from political interference in the production and dissemination of the statistics (see National Research
Council, 2013b). For that reason, strict codes of ethics, laws, and regulations that protect the operations of national statistical offices from political interference, and powerful pledges of confidentiality of data have been promulgated by national and international organizations.
In the United States, the National Research Council first published Principles and Practices for a Federal Statistical Agency in 1992, and it has been widely used by U.S. statistical agencies and cited in OMB directives and GAO reports. It has been and continues to be updated every 4 years and is now in its fifth edition (National Research Council, 2013b). Underlying the production of federal statistics and their usefulness are four principles: (1) relevance to policy issues, (2) credibility among data users, (3) trust among data providers, and (4) independence from political and other undue external influences. The publication also delineates 13 practices that agencies should follow to help achieve and embody these principles (see Box 2-1).
Similarly, the General Assembly of the United Nations formally adopted the Fundamental Principles of Official Statistics in January 2014, providing high-level recognition of the principles that had been promul-
gated by the U.N. Statistical Commission since 1994 (see Box 2-2). OMB also issued Statistical Policy Directive No. 1: Fundamental Responsibilities of Federal Statistical Agencies and Recognized Statistical Units (Office of Management and Budget, 2014b) (see Box 2-3). This directive enumerates the responsibilities of federal statistical agencies in the design,
collection, processing, editing, compilation, storage, analysis, release, and dissemination of statistical information.
Combinations of political pressures, inaccurate data collection, and other poor practices can have severe consequences for both statistical offices and an entire country, as was seen recently in Greece and Argentina (Hartman et al., 2014; The Economist, 2012). At the same time, unsubstantiated political attacks on the quality of statistics can harm the credibility of not only particular statistics, but also the agency producing the statistics. Jack Welch, former chief executive officer of General Electric, sent a tweet accusing BLS of “cooking the books” on its release of the unemployment rate on the eve of the 2012 presidential election (Malone and Mutikani, 2012). After gaining some initial traction, the statement was countered by commentators across the political spectrum who strongly attested to the independence and impartiality of the agency and noted that there was no basis for the assertion of manipulation.
As noted above, OMB issues standards and guidelines that play a critical role in ensuring the integrity, credibility, and independence of the U.S. federal statistical system. Specifically, OMB has directives to ensure that the mission of statistical agencies is adhered to and supported by their parent departments, that statistical releases of information are not subject to manipulation, that appropriate statistical methodologies are used and documented, and that the confidentiality of information is protected (U.S. Office of Management and Budget, 1985, 2006, 2007, 2008, 2014b).
It is also vital that information providers, including businesses and individuals, trust the agency to protect the data they possess from misuse and thereby are willing to provide the requested data (see National Research
Council, 2013b). In the United States, statistical agencies have a superb record of protecting the personal and business data they collect, and there are strong laws protecting information collected under a pledge of confidentiality for exclusively statistical purposes, such as the Confidential Information Protection and Statistical Efficiency Act of 2002 (see Chapter 5). This law and related regulations (see U.S. Office of Management and Budget, 2007) as well as other specific statutes, such as Title 13 for the Census Bureau, are key to respondent trust and ultimately the credibility of the statistical indicators the agencies produce.
All of these laws, directives, principles, and practices are established and widely broadcast to ensure that the relevance and credibility of information produced by statistical agencies is independent from political or other undue external influence (National Research Council, 2013b). Federal statistical agencies strictly follow all of these principles so that their statistical products can provide a solid and objective foundation for policy discussion and decision making.
CONCLUSION 2-1 Federal statistics provide critical information to the country and serve a key role in a democracy.
THE SAMPLE SURVEY PARADIGM
Federal government statistics underwent a revolution between 1930 and 1950 to meet increasing needs for timely information (Duncan and Shelton, 1992). This period saw the development of probability sampling designs and early models to adjust for nonresponse. The 1940 decennial census was the first to employ sampling, with 5 percent of the respondents asked supplemental questions about such topics as the birthplace of their parents, veteran status, and participation in the social security system.3 The use of sampling in the 1940 census also allowed the Census Bureau to publish preliminary tables about 8 months before the full tabulations were available. The Current Population Survey, the nation’s primary measure of unemployment, began using probability sampling for the entire sample in 1943.4
Books that were published about probability sampling around 1950 (Cochran, 1953; Deming, 1950; Hansen et al., 1953a, 1953b; Parten, 1950; Yates, 1949) described the advantages of taking a sample instead of conducting a census or using available information. A statistically designed
___________________
3 See http://1940census.archives.gov/questions-asked.asp [November 2016].
4 The Current Population Survey built on developments in earlier unemployment surveys: the trial census of unemployment in 1933-1934, the Enumerative Check Census in 1937, and the Sample Survey of Unemployment in 1940 (Hansen et al., 1955).
sample allowed estimates to be calculated faster and with less cost because interviewers needed to contact only the sampled households and people and so there were fewer records to be tabulated.5 One major reason for the adoption of probability sampling was its ability to give error bounds for estimates. Probability sampling uses random selection to draw a sample in which each subset of the population has a known nonzero probability of being selected in the sample. Those probabilities are used to calculate an accurate measure of the precision of the results, and the statistical sampling texts of the 1950s emphasized that the measures of precision in probability samples were based on a rigorous mathematical framework. In contrast, other types of samples—such as convenience samples, which are composed of those people or entities most easily available—also have errors, but those errors are often unobservable and unquantifiable.
The success of probability sampling in providing reliable, trustworthy information led to a proliferation of surveys across the federal government. Many U.S. federal statistical agencies use a sample survey as the default method of producing statistical information. A sample survey can be tailored to particular data needs: it can include the specified questions needed for standardized measurement, and it can include steps to minimize bias from nonresponse and other sources. The agency or its contractor exercises control of the data collection process, often resulting in the collection of high-quality standardized data for a wide variety of characteristics of units and populations of interest. Because of the consistency with which federal statistical agencies use this method, estimates can be compared for different time periods and different locations, which is a crucial feature for such indicators as unemployment and poverty.6
Surveys and censuses are currently the principal means of collecting federal statistics. The Census Bureau alone conducts more than 130 economic and demographic surveys every year.7 In addition, private-sector federal contractors also conduct surveys that are sponsored by federal statistical agencies. As noted above, federal surveys provide vital information on agriculture, the economy, health, crime, transportation, defense, education, energy, housing, social welfare, and virtually every other area in which public policy is set. Each agency often has its own user community and stakeholders.
Although there is tremendous value in the information collected by the federal statistical agencies (see, e.g., U.S. Department of Commerce, 2014),
___________________
5 Before the Census Bureau received the very first UNIVAC computer in 1951, tabulations were time-consuming and prone to error. Operators prepared punch cards for data items, which were then processed by Hollerith machines.
6 Changes in modes and methods do occur, which result in breaks in series, and these are documented to alert all users.
7 See http://www.census.gov/programs-surveys/are-you-in-a-survey/survey-list.html [January 2017].
there also appears to be redundancy in the collection of information and inefficiency by sole reliance on sample surveys (U.S. Government Accountability Office, 2006). For example, the Current Population Survey, the American Community Survey, the Survey of Income and Program Participation, and many other surveys ask questions about demographic characteristics, income, poverty, and unemployment. For some items and purposes, redundancy is useful: it can add to the reliability of the information and point to sources of variation among different surveys. Yet the redundancy in information collection can lead to additional burden on survey participants, and it can also result in competing national estimates from different sources and different agencies, causing confusion for users. National estimates of health insurance coverage, a key statistic for evaluating the success of the Affordable Care Act, are published by two agencies on the basis of three different surveys: by the National Center for Health Statistics (NCHS) based on the National Health Interview Survey and by the Census Bureau based on both the Annual Survey of Social and Economic Conditions (a supplement to the Current Population Survey (CPS)), and the American Community Survey (ACS). The Census Bureau and NCHS have issued materials to inform and educate users about the appropriate use of each of these estimates and explanations for potential differences among the estimates, but perceptions of burden and confusion about different estimates remains.
In addition to possible redundancy and confusion, there are also questions about some surveys. Although there have been notable improvements in the designs and estimation methods for federal surveys throughout the years, the basic structure of many large surveys has been relatively constant over time. This constancy is due in part to the desire for estimates to be consistently produced from year to year. As noted above, BLS measures unemployment using the CPS and has kept the questionnaire and the statistical methodology for the survey stable to be able to consistently measure changes in unemployment. When the CPS was redesigned in 1994 to update the questionnaire and use laptop computers for the data collection, it had been nearly 30 years since the last redesign in 1967 (Cohany et al., 1994). Because of the importance of this indicator, the change in methodology involved extensive research over several years, including a test running the “old” and “new” surveys in parallel for 18 months to compare results between the new and old procedures to carefully measure the effects of the changes (Cohany et al., 1994; Polivka and Miller, 1995). This example illustrates the careful and transparent research and implementation that is a strength of the federal statistical system. However, it also shows how changes to methods of production of statistics can be difficult and time-consuming, resulting in a system that tends to be conservative and not likely to adapt to new technologies (see Van Tuinen, 2009).
CONCLUSION 2-2 Federal statistical agencies use a highly developed sample survey paradigm for federal statistics.
THREATS TO THE SURVEY PARADIGM
Continued reliance on sample surveys as the principal means of collecting national statistical data is threatened by the increasing difficulty and cost in conducting the surveys, with consequent threats to data quality, and by the increasing demand for more and faster information. Response rates are decreasing for almost all household surveys, adding to the cost of the surveys and, in some cases, raising questions about how well the survey results represent the population. A recent report (National Research Council, 2013a) documented the decreasing response rates and consequences in major federal surveys (see also Brick and Williams, 2013).
Figure 2-1 shows the decrease in response rates for three federal household surveys from 1994 to 2015: the Consumer Expenditure Survey (CES), the National Health Interview Survey (NHIS), and the National Crime Victimization Survey (NCVS). In these three surveys, for at least one interview the data are collected by an interviewer who visits the sample household.
The CES, the oldest of the three, was initiated in 1888; the current form of separate interview and diary components was adopted in 1972. The response rates in 1972 were approximately 94 percent for the interview component and approximately 82 percent for the diary component (Hoff, 1981). These rates decreased to approximately 70 percent for both components in the 2010s despite extensive efforts to maintain them.
The NHIS was launched in 1957. After a household is sampled for the survey and agrees to participate, one adult and one child (if the household has children) are randomly selected to complete the adult and child components. The household response rate in 1963 was 95 percent; in 2015, it was 70 percent. The response rates for the sampled adult and sampled child are lower than that for households because there is additional nonresponse when an individual is asked to participate in the survey: in 2015, the response rates were 63 percent for the sampled children and 55 percent for the sampled adults.
The NCVS, which began in 1972 administers a screening instrument to a household respondent, followed by individual interviews with all people aged 12 and over in the household. Until 1995, the household response rate for the NCVS was consistently above 95 percent, and it has had the smallest declines in response rate of the three surveys. The 2014 household response rate was 84 percent, and that for the interviewed people was 73 percent. The lowest response rates were for nonwhites aged 12 to 24, which is the demographic group with the highest levels of victimization.
Response rate declines have been even more dramatic for telephone
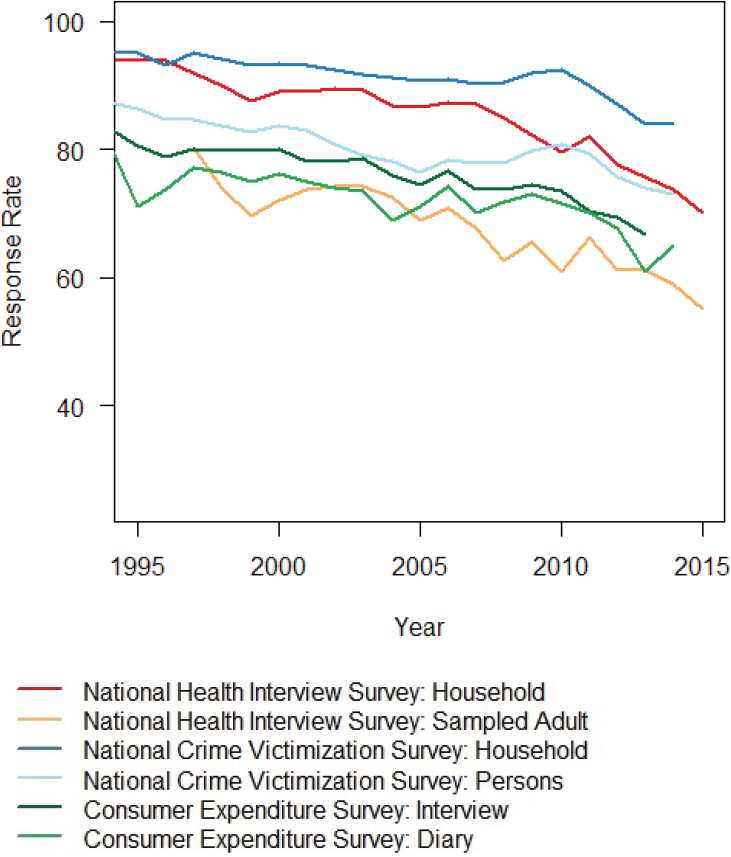
SOURCES: Data from National Research Council (2013a, Table 1-1); public-use dataset documentation for the National Health Interview Survey (see ftp://ftp.cdc.gov/pub/Health_Statistics/NCHS/Dataset_Documentation/NHIS/2015/srvydesc.pdf [November 2016]); the National Criminal Victimization Series (see http://www.bjs.gov/index.cfm?ty=dcdetail&iid=245 [November 2016]); and the Bureau of Labor Statistics (see http://www.bls.gov/cex/pumd/2014/csxresponserates.pdf [November 2016]).
surveys. The response rate for the National Immunization Survey (NIS) landline telephone sample declined from 86.8 percent in 1994 to 62.6 percent in 2014 (Centers for Disease Control and Prevention, 2015). And that decline in response rates does not tell the whole story. Before 2011, the NIS called only landline telephones, and the percentage of households without a landline increased from 5 percent in 2003 to 32 percent in 2010 (Blumberg and Luke, 2007, 2011). Thus, the NIS 2010 reported response rate of 64 percent refers to responses from landline households alone and ignores the cellular-only and non-telephone households that were not contacted for the survey. Adults in cellular-only households tend to be younger and have different health characteristics than adults in landline households, so any survey that excluded them in 2010 did not represent the full U.S. population (Blumberg and Luke, 2011). In 2011, the NIS implemented a design in which cellular telephones were also called in an attempt to reduce bias resulting from omitting the households that have no landline service. The household response rate for the cellular telephone numbers has been less than 35 percent for every year from 2011 to 2014 (Centers for Disease Control and Prevention, 2015). As a larger proportion of the population becomes cell-only,8 the overall response rate for NIS is expected to continue to decrease.
Another telephone survey, the National Household Education Survey (NHES), has experienced similar declines in response rates, from 81.0 percent in 1991 to 52.8 percent in 2007 (Grady et al. 2010; Zukerberg, 2010). The NHES discontinued using the telephone as a mode of data collection in 2007 and switched to a mail survey for 2012, which resulted in an increase of the response rate to 73.5 percent (McPhee et al., 2015).
For all three surveys shown in Figure 2-1, the recent large declines in response rates are a disturbing trend because face-to-face surveys often have the highest coverage of the population and response rates, as well as the most control over the data collected (deLeeuw, 2008). The decrease in response rates has led to increased costs as more people must be contacted in order to obtain the required number of respondents to the survey. Decreasing response rates also require other efforts, such as callbacks or mixed mode surveys, which further increase the cost of conducting household surveys.
Similar patterns of decreasing response rates have also been seen in surveys of establishments. In the past 5 years, the Census Bureau has experienced a decline of more than 20 percentage points for the Advance Monthly Sales for Retail and Food Services Survey and a decline of more
___________________
8 As of 2015, 48 percent of adults and 58 percent of children live in households without a landline telephone (Blumberg and Luke, 2016).
than 10 percentage points for the Monthly Retail Trade Survey and the Manufacturers’ Shipments, Inventories, and Orders Survey.
In an era of flat or decreasing budgets for many federal statistical agencies (see U.S. Office of Management and Budget, 2015b), efforts to increase response rates have resulted in other declines in the quality of survey work. For the NCVS, for example, increasing survey costs and flat budgets from 1995 to 2006 led to the suspension of interviewer training, reductions in reinterviews for quality control, and cuts in the sample size to compensate for increasing costs. By 2003, the precision of NCVS estimates had decreased so much that the Bureau of Justice Statistics could no longer report reliable estimates of year-to-year changes in victimization, which it had done every year since the beginning of the survey. Thus, the criminal victimization rates for 2003 reported changes in victimization rates between the 2-year averages for 2000-2001 and 2002-2003, instead of 1-year changes between 2002 and 2003 (Catalano, 2004). For the 2006 rates, Rand and Catalano (2007, p. 1) wrote: “The variation in the amount and rate of crime was too extreme to be attributed to actual year-to-year changes.”
A review of the programs of the Bureau of Justice Statistics (National Research Council, 2009a, p. 3) found:
[T]he current NCVS falls short of the vibrant measure of annual change in crime that was envisioned at the survey’s outset...[and] as currently configured and funded, the NCVS is not achieving and cannot achieve BJS’s legislatively mandated goal to “collect and analyze data that will serve as a continuous and comparable national social indication of the prevalence, incidence, rates, extent, distribution, and attributes of crime.”
Following a funding increase, the sample size was increased beginning in October 2010, which gave more precision for year-to-year changes, though at a higher cost.
As response rates continue to decline, there is growing concern about bias from nonresponse, which can occur when the nonrespondents differ systematically from the respondents. As noted above, in the NCVS the demographic group with the lowest response rates is the group with the highest victimization rates. Although adjustments are made to the survey weights to correct for demographic imbalances between the survey respondents and the population and to reduce bias, there is no assurance that the adjustments completely remove nonresponse bias for the key measures of interest about victimization rates. Indeed, the adjustment methods require strong assumptions about the nature of the nonresponse, and as response rates decrease, greater reliance is placed on those assumptions.
Rising rates of item nonresponse, in which a survey participant fails
to provide responses to one or more items in the questionnaire, is another threat to the quality of data from surveys. Reports of income can be particularly problematic because respondents are often unwilling or unable to provide this information in detail, which is important for analysis of many federal programs, including Temporary Assistance for Needy Families (TANF), Supplementary Nutrition Assistance Program (SNAP), Supplemental Security Income (SSI), Old Age Survivors and Disability Insurance (OASDI), and Unemployment Insurance (UI). To account for both the level and impact of item nonresponse to a series of specific income questions, one can compute the percentage of total income that is statistically imputed as opposed to reported (see Czajka and Beyler, 2016). Using this approach, Czajka and Denmead (2008) found that more than 50 percent of people in the CPS had some income imputed and that 34.2 percent of the total income in the CPS was imputed. Both the Survey of Income and Program Participation and NHIS had similar amounts of total income imputed, 32.4 percent, while the percent of total income imputed in the ACS was 17.6 percent. The percentage of total income from TANF, SNAP, SSI, OASDI, and UI that has been imputed in the CPS has been increasing over the past 25 years (Meyer et al., 2015). The statistical methods used to impute for missing data rely more heavily on assumptions as nonresponse increases and may introduce bias into the estimates (Citro, 2014). Imputation procedures for earnings in the CPS have consistently underestimated poverty by an average of 1 percentage point due to item nonresponse in earnings (Hoyakem et al., 2014).
INCREASING DEMANDS FOR MORE DETAILED AND MORE TIMELY INFORMATION
The demand for more detailed and timely statistical information has grown steadily in the past two decades (Holt, 2007). The ubiquitous availability of information on the Internet can affect people’s perceptions of the timeliness of statistical information. Nowhere was this change in demand more clearly illustrated than in the 2015 reaction of James Comey, director of the Federal Bureau of Investigation (FBI), to his discovering that he could not get an accurate, current, national estimate of the number of citizens shot by the police. After Michael Brown was shot and killed by a police officer in Ferguson, Missouri, Comey wanted to know how many people shot by police were African American, and his staff could not give him this information because it is not collected reliably. He stated that “our data are incomplete and therefore, in the aggregate, unreliable” (Comey, 2015). He later said that it was “embarrassing and ridiculous” that you can “get online and figure out how many tickets were sold to The Martian” but
“we can’t talk about crime in the same way, especially in the high-stakes incidents when your officers have to use force” (quoted in Tran, 2015).
The broad challenge for the federal statistical system is the increased demand for more data more quickly and with more detail for small areas of geography and subpopulations, especially by local governments and businesses. The CPS produces monthly estimates of unemployment and labor force participation, but for many other surveys, estimates are produced annually or less frequently. For the NCVS, the data collection is spread over a year, and the annual estimates of victimization are usually reported about 8 months after the end of data collection. Because most of the people contacted for the NCVS are not victims of crime, the sample sizes for crime victims of specific types tend to be small. Therefore, victimization rates cannot be reliably produced for most states, let alone for metropolitan areas or local jurisdictions.9 However, it is the local areas where efforts to fight crime take place and where reliable and timely information is needed to take actions.
The ACS is designed explicitly to provide local area information. It is the largest continuous household survey conducted by the federal government and is the replacement for the “long form” from the decennial census. The survey is sent to 3.5 million households every year and includes questions on housing and the demographic characteristics of respondents, as well as such factors as employment, health insurance coverage, and income. Annual estimates are produced for all areas in the country with populations of at least 65,000, while estimates for smaller areas are 5-year rolling averages that are updated annually. Smaller areas include not only smaller cities and towns, but also census tracts within cities and metropolitan areas.
Because the ACS provides comparable data for all areas, its results are widely used by federal agencies for allocating federal program funding, by local governments for local planning, and by private companies for making businesses decisions. The ACS provides much more timely data than was previously available from the decennial census long form (which was available only every 10 years), and these estimates are updated every year. However, the 5-year-period estimates may mask underlying economic and social changes over shorter time periods and make them less useful for understanding current circumstances and informing decisions. The ACS small-area estimates are also less precise than those from the census long form, resulting in greater uncertainty about the current status.
Director Comey’s reaction to the lack of needed data is illustrative of
___________________
9 In 2012 the NCVS began a program to provide data-based estimates for the 22 largest states and modeled estimates for smaller jurisdictions. Even with this ambitious program, however, the ability of the survey to make estimates for cities and localities—which are responsible for most crime control policy—is quite limited.
another challenge to the federal statistical system resulting from increased demand—competition from private-sector sources. With the traditional data on police shooting deemed inadequate and not timely enough, the Guardian and the Washington Post used open-source data to produce estimates of citizen shootings by the police.10 These ad hoc data collections do not have the stability and transparency of sample surveys, but in the absence of timely “official” estimates from the federal statistical system, alternative estimates of unknown quality and reliability will be used.
CONCLUSION 2-3 The way that statistics are currently produced by federal statistical agencies faces threats from declining participation rates and increasing costs. These threats are exacerbated by expanding demands for more timely and geographically detailed information.
___________________
10 The results from the two newspapers differed, according to Politico (see http://www.politico.com/story/2015/06/police-involved-killings-statistics-washington-post-guardian-118490 [November 2016]).
This page intentionally left blank.


