
3
Inference About Discoveries Based on Integration of Diverse Data Sets
The first session of the workshop focused on inference about discoveries from integration of diverse data sets. The session highlighted opportunities and challenges for reliably combining different data types, such as genomic and proteomic data, physiological measurements, behavioral observations, and cognitive assessments, in the context of sound statistical modeling. Alfred Hero (University of Michigan) described the possibilities and risks of big data integration using a case study of genetic biomarker discovery for viral infection and presented a method for uncertainty estimation in graphical network models. Andrew Nobel (University of North Carolina, Chapel Hill) discussed the relationship between statistical and data management challenges when working with large, diverse data sets and presented an iterative testing procedure for community detection and differential correlation mining. Genevera Allen (Rice University and Baylor College of Medicine) discussed two large longitudinal medical cohort studies and described a flexible framework for modeling multivariate distributions with exponential families. Last, Jeffrey Morris (MD Anderson Cancer Center) discussed incorporating biological knowledge into statistical model development to reduce the parameter space and increase the biological coherence of results.
DATA INTEGRATION WITH DIVERSE DATA SETS
Alfred Hero III, University of Michigan
Alfred Hero began by describing the recent Federal Trade Commission report titled Big Data: A Tool for Inclusion or Exclusion? Understanding the Issues, which
examined some of the potential benefits and pitfalls in drawing inferences from big data (FTC, 2016). While the case studies presented in that report demonstrate a clear commercial value for big data analysis, Hero issued the caveat that “bigger data does not necessarily lead to better inferences” for a number of reasons related to unknown biases, unquantified uncertainty, and uncontrolled variability across studies. In part this is because a lot of big data is collected opportunistically instead of through randomized experiments or probability samples designed specifically for the inference task at hand. Some analyses may have high computational demands and long run times, and Hero pointed to a need for tools that can identify the necessary conditions for replicability—for example, with regard to sample size relative to the number of variables—before running the analysis.
Hero described the potential benefits of integrating diverse data sets, including the development of better predictors and better descriptive models. However, realizing these benefits is difficult because assessment of bias and replicability is challenging, especially in high-dimensional cases, and may require more sophisticated methods. Hero described three distinct categories of data integration:
- Integration of data within a single study, in which the analyst has control over the experimental design and all data collection. In principle, bias can be measured, heterogeneity and variability in the data—for example, from batch effects or sample misregistration—can be controlled for, and uncertainty can be quantified. While there will always be some noise in the data due to biological diversity and temporal progression, these studies are the best-case scenario for analysts, albeit expensive and not always feasible. Examples of this type of integration can be found in Wang et al. (2009), Chen et al. (2012), and Hsiao et al. (2014).
- Integration of primary data across several studies, in which the analyst has access to primary data but does not control all elements of experimental design. In this context, the bias and uncertainty in the data are at least partially unknown; for example, there may be one type of data collected by different laboratories with different protocols. This requires a different set of tools for analysts to account for these uncontrolled noise errors—for example, as presented by Deng et al. (2009), Morris et al. (2012), and Sripada et al. (2014).
- Integration of metadata across several studies, in which the analyst does not have access to primary data but instead combines metrics such as mean aggregated effect sizes, computed p-values, or imputed relationships. Examples of this type of post-experimental integration can be found in Singh et al. (2008), Langfelder et al. (2013), and Rau et al. (2014).
Across all of these categories, Hero said there are statistical principles for data integration. Given two data sets X and Y, and assuming a model f(X,Y | θ) that gives
joint probability distribution for X and Y conditioned on the parameter of interest θ, Fisher’s sufficiency principle yields that there is a minimal sufficient statistic T(X,Y) satisfying Fisher-Neyman Factorization following equation 1:
![]()
Hero explained that this provides the best possible integration algorithm available and supports any type of inference task, but it requires a model. Furthermore, if the analyst has access to reliable prior information on the variable of interest, the Bayesian posterior distribution induces dimensionality reduction. While these principles provide an optimistic target, Hero reminded the audience that it is challenging to develop such a model and repeated the famous George Box mantra: “all [statistical] models are wrong, but some are useful” (Box, 1979).
There are also practical challenges for using big data, such as the tremendous increase in the amount of information stored on the cloud, said Hero. Looking forward over the next 10 years, Hero described the potential for similar increases in cloud computing and local sharing. As data sets become too large to store and manipulate on a personal computer, questions arise about how to do inference without ever having access to a complete data set (Wainwright and Jordan, 2008; Meng et al., 2013). Similarly, Hero anticipates that privacy concerns—for example, with regard to electronic health records (EHRs)—will result in data sets with more messiness and missing data points as patients opt out of sharing information for research. Approaches for incorporating privacy as a constraint on statistical inference are still in their infancy, said Hero (see e.g., Duchi et al., 2014; Song et al., 2015).
Hero then presented several case studies, the first trying to predict the onset of illness before peak expression of symptoms by looking at various biomarkers over time and identifying the biomarkers that are most useful for predicting the onset of symptoms. Pre- and post-inoculation data describing ribonucleic acid (RNA) expression; protein expression; nasal, breath, and urine cytokines; and self-reported symptoms were collected 3 times daily for 121 subjects over 5 days, resulting in more than 18,000 samples assayed. The collected data have high dimensionality, exhibit large biological and technical variability, and have missing samples. These complexities are typical of big data. Hero presented an overview of select findings from the study, including a novel factor analysis method (Huang et al., 2011; Woods et al., 2013), identification and validation of a biological predictor of viral symptom onset (Zaas et al., 2013), demonstration that use of a personalized baseline reference sample improves predictor performance (Liu et al., 2016), and demonstration that whole blood messenger RNA (mRNA) is the best data type (a “modality”) for predicting illness. This study raised additional questions such as whether additional baseline samples could further improve the accuracy of the predictor and
how generalizable findings are to the broader population. These questions are currently being explored in a follow-up study that includes more baseline samples and a collection of additional data modalities, said Hero.
These projects are very challenging in terms of both data management and statistical methods, and Hero briefly introduced several inference-driven data integration techniques developed in this project. The novel factor analysis method used to estimate a small number of explanatory variables as biological predictors for onset of symptoms is easily extendable to many data modalities. The novel aspect of this method, Hero explained, is that the positive sum-to-one constraint in the factor model avoids known problems of masking and interference faced by principal component analysis. The novel factor analysis method was more effective for predicting onset of symptoms than other methods in the literature and was validated with additional data sets (Huang et al., 2011; Bazot et al., 2013).
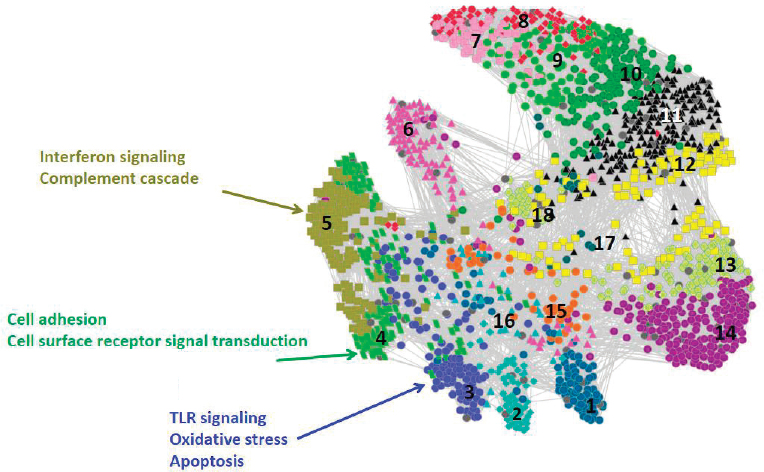
Hero next described the use of gene set enrichment analysis, which integrates variables in the large data sets into known molecular pathways of action (Irizarry et al., 2009) and reduces the dimensionality of the data. Calculating p-values on the differential expression of specific molecular pathways over time allows identification of statistically significant differences. Hero showed a network constructed from correlating these p-value trajectories that groups pathways that have a similar temporal progression of differential expression (Huang et al., 2011), as shown in Figure 3.1.
In the final section of his talk, Hero focused on network inference and how to evaluate the significance and replicability of network edges by controlling for false discoveries. This is challenging in the high-dimensional context of big data when fitting models with many more parameters (p) than samples (n), often denoted as p>>n, as the classical central limit theorem applies only for fixed p as n goes to infinity. Similarly, Hero described analogous approximations used in the mixed high-dimensional setting that allow both p and n to go to infinity (Bühlmann and van de Geer, 2011), which are not useful for small samples. Hero derived a “purely high-dimensional regime,” allowing p to go to infinity with a fixed n (Hero and Rajaratnam, 2011, 2012, 2016), that he used to calculate a critical phase transition threshold (ρc) for sample correlation values (equation 2), below which false discoveries dominate:
![]()
The phase transition threshold for detection of correlations increases logarithmically with p; thus, for a fixed threshold value one can accommodate exponentially larger p with small increases in sample size (n) in what Hero called “the blessing of high dimensionality.” He noted, however, that other inference tasks—for example, full uncertainty quantification—are more demanding in terms of sample size. Hero concluded by emphasizing the importance of rightsizing the inference task to available data by first detecting those network nodes with edges and prioritizing them for further data collection and estimation (Firouzi et al., 2017).
DATA INTEGRATION AND ITERATIVE TESTING
Andrew Nobel, University of North Carolina, Chapel Hill
Andrew Nobel began by remarking that the trade-off between computational error and statistical error is more important than ever because of the growing size of data sets. He cautioned that having a lot of data does not necessarily mean one has the right data to answer the analysis question of interest. Often, the obvious statistical techniques, or those deemed appropriate by a disciplinary scientist, are not the ones actually required. For these reasons, in practice most data analysis problems require sustained interaction between statisticians and disciplinary scientists; the process works best if scientists understand some elements of the statistical analysis, and likewise statisticians understand some of the underlying science.
Nobel then presented a taxonomy of data integration, contrasting classical approaches with the challenges of big data. Classical data integration focuses on integrating data from multiple experiments or multiple groups of samples on a common measurement platform, said Nobel. While this is still relevant today, inte-
gration techniques increasingly bring together many data types into a common, or at least overlapping, sample group. Nobel presented an example of a data set from The Cancer Genome Atlas (TCGA) consortium, which contains gene expression data (approximately18,000 genes), micro RNA data (650 miRNAs), copy number data (200,000 probes), methylation data (22,000 regions), and gene mutation data (12,000 genes), as well as patient survival or treatment response descriptors for 350 breast cancer tumors. In such large data sets, frequently data are missing and the analyst does not have coverage across all data modalities for all subjects. For example, Nobel described data from the Genotype-Tissue Expression (GTEx) consortium in which genotype single nucleotide polymorphism (SNP) information is available at 5 million genomic locations for each individual, but gene expression data are available only for a subset of tissues that varies from individual to individual.
The potential benefits of integrating data across many measurement platforms are enhanced statistical power and improved prediction, said Nobel, and these can be used to provide new or better insights into complex biological phenomena. However, this comes at the expense of greater challenges in managing, curating, and analyzing data. Before even getting to formal statistical analysis, Nobel explained, many preprocessing decisions are made—for example, normalization, imputation, and removal of appropriate covariates—that must be scrutinized closely. Even seemingly small decisions may have significant impacts on later analyses, and it can take months to fully understand what processing has been or should be performed on the data. This is another reason for stronger and more frequent collaboration between statisticians and disciplinary scientists, Nobel urged. Moving to model selection, he said that integration of diverse data sets often requires modeling assumptions to reduce the dimensionality of the parameter space—such as sparsity assumptions. While it is critically important to check the validity of these assumptions, this is often more difficult than simply checking for normality. Furthermore, many statistical models have free parameters that must be specified by the analyst, and these decisions also have a significant impact on the final analysis.
Shifting topics, Nobel remarked that networks have become extremely popular in part because they are intuitive visual representations of systems characterized by pairwise relationships and can be amenable to statistical analysis. Unfortunately, networks do not capture higher-order interactions between groups of variables, said Nobel, and summary edge weights (e.g., derived from correlations) may not adequately capture heterogeneity among samples.
He described an iterative testing method for community detection in large networks, in which a community is a group of nodes that are significantly interconnected but have relatively few connections to nodes outside the community (Figure 3.2). Given a group of nodes that represent a candidate community (Bt), the iterative testing algorithm calculates a p-value for each node in the network relative to the configuration null model, which represents how significantly each node is
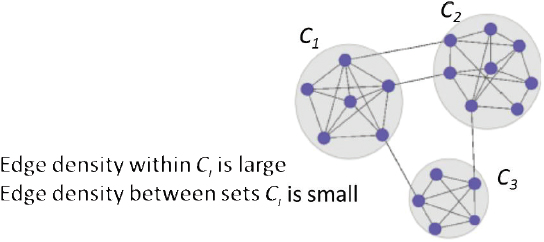
connected to the community Bt. The nodes are ordered from most to least significantly connected to Bt and those nodes with a p-value above a specified threshold are omitted, following the Benjamini-Hochberg step-up procedure (Benjamini and Hochberg, 1995). This process is repeated with this new community (Bt+1) and repeats until Bt+1 = Bt. This procedure is competitive with other community detection methods in the literature, is relatively insensitive to the selection of the rejection threshold, and does not require partitioning of the network, said Nobel. Running this process with initial node sets derived from vertex neighborhoods can identify meaningful communities in a network. Importantly, nodes not assigned to any community can be assigned to background.
Nobel described a similar procedure to identify variable sets that are differentially correlated in two sample groups, illustrating the method using cancer subtypes from the TCGA data set. Identifying differentially correlated variables is a useful form of exploratory analysis to generate hypotheses worthy of further study, said Nobel. As a second example, he presented results from differential correlation mining of a functional magnetic resonance imaging (fMRI) data set from the Human Connectome Project. Figures from the analysis show that brain voxels exhibiting differential correlation between language and motor tasks exhibit a distinct spatial pattern that corresponds to known regions of neural activity and that differs from a standard analysis of differential activity. This calls attention to the potential advantages of studying higher-order differences to gain additional biological insights.
PANEL DISCUSSION
A panel discussion followed the presentations from Hero and Nobel. An audience member asked Hero if the gene pathways identified in the viral infection biomarker
discovery study comport with known biological mechanisms as well as how or if findings were replicated in any of the presented studies. Hero responded that many of the gene signatures identified—toll-like receptor pathways, inflammation pathways, and interferon inducible transcription factors—are well known in the literature. But there are also some factors in this signature that are unknown and seem unrelated to the infection, and the current hypothesis is that these genes and proteins are associated with susceptibility factors that are not currently characterized. Further study may provide some mechanistic understanding of their presence, said Hero. Regarding replication, there have been a number of cross-validation efforts within and across multiple studies, as well as in clinical trials. Interestingly, the biomarker is equally effective for predicting onset of other viral infections, and follow-up research may identify a similar marker for bacterial illness or develop a composite biomarker that can help distinguish the two different causes. Nobel added that interpretation of gene pathways is challenging but often the best available explanation, and Hero agreed, saying that a critical limitation is that gene pathway data present a snapshot rather than account for temporal changes in expression.
Another audience member noted that relying on prediction for model validation provides only an aggregate indicator of model suitability and asked Hero if model residuals were used as an alternative approach to validation. Hero agreed that looking at model fit is feasible, but there is limited value with so few subjects and so many parameters; he would be concerned with overfitting of residuals. He suggested that there is a need to develop methods for residual analysis with few samples and many parameters.
An online participant asked if model development, analysis, and results might be impacted by the fact that much of the data was collected years ago and there are likely differences and improvements in data curation and storage practices over time. Nobel answered first, saying that in his experience there is no such thing as a final data set; rather, the data used in analyses are always evolving. Furthermore, reevaluating any decision about a data preprocessing step can substantially change the downstream analysis. Data preprocessing was discussed extensively in the initial stages of the GTEx project: “As a theoretician . . . I never would have imagined how complex [data curation and sharing] is . . . and I don’t know if anyone has the right system,” Nobel said. Hero agreed, adding that improvements have been driven to some extent by top journals and funding agencies that require data sharing. Nonetheless, there is still a long way to go before all data produced from publicly funded research will be available to the public. He noted that large data sets produced by private companies are almost never made public. Hero emphasized that software should be shared more frequently, and Nobel commented that pseudocode is not a substitute.
A member of the audience called attention to the importance of data preprocessing as a crucial part of statistical analysis that should not be viewed as a
separate, upstream process. The participant shared some concern regarding the use of p-values in network community detection, because p-values do not measure the size of an effect, particularly with heterogeneous data sets. Nobel agreed, saying that in this specific case the methodological use of p-values was principled, and p-values were not assigned to communities per se (Wilson et al., 2014). The participant said that, in principle, Bayesian approaches can handle many of the challenges raised in this session—for example, missing data or identification problems—but the practice of developing algorithms and computing results is not a trivial matter. The participant described regularization and parameter reduction as a challenge in finding appropriate priors and called for more research into developing Bayesian models for large, complex data structures for which a flat prior is insufficient. Hero agreed, but he remains open-minded and will use whatever method works, whether Bayesian or not.
STATISTICAL DATA INTEGRATION FOR LARGE-SCALE MULTIMODAL MEDICAL STUDIES
Genevera Allen, Rice University and Baylor College of Medicine
Genevera Allen provided an overview of data integration for large-scale multimodal medical studies. Large-scale medical cohort studies typically have many types of data—including clinical evaluations; EHRs; images; gene and protein expression; and social, behavioral, and environmental information—and the objective of data integration in this context is to combine all of these to better understand complex diseases. Allen defined multimodal data as coming from multiple sources or measurement technologies applied to a common set of subjects. If these data take different forms, including discrete, continuous, and binary, they are called mixed multimodal data and require additional processing to integrate. She suggested that multimodal data integration be thought of as the opposite of classical meta-analysis, in which analysts aggregate across many sets of subjects (n) to conduct inference on variables. Conversely, the focus of data integration is to aggregate multiple sets of variables to conduct inference on the subjects.
Allen described some of the data collected through TCGA, which contains information from more than 11,000 patients and totals nearly 2.5 petabytes of data. Genetic data collected include mutation information, copy number variations, gene and miRNA expression, and methylation data. Individually, each modality provides information on only one component of a complex process, and many of the biological malfunctions in cancer development happen between these types of data. Thus, developing a comprehensive understanding of cancer biology requires integration of these diverse data, said Allen. However, integration of these data is particularly challenging both because they are large and because of the mixed data types with
different scales and domains. Allen described some of the objectives for integration of TCGA data: (1) to discover the sets of mutations, gene expression changes, and epigenetic changes that are most associated with, and potentially causative of, tumor cell growth; (2) to identify different cancer subtypes and patient groups that have tumors with similar characteristics; and (3) to discover new, potentially personalized, therapies for treating cancer.
In a second case study, Allen introduced the Religious Orders Study (ROS) and the Rush Memory and Aging Project (MAP), which are longitudinal cohort studies tracking dementia and Alzheimer’s disease in nearly 3,000 patients. Alzheimer’s is a large and growing public health burden, said Allen, and is the only “top-10” cause of death in the United States with no prevention or cure. One key facet of these studies is that patients’ brains were donated at death, allowing for full pathological analysis, in addition to containing baseline data describing patients’ genetics, lifestyle, environment, and behavior, as well as clinical evaluation, results from 19 distinct cognitive tests, and neuroimaging data collected through the duration of the study. At the time of death, more than 60 percent of patients’ brains had symptoms of Alzheimer’s disease but less than half of these patients had been diagnosed with the disease, pointing to a large discrepancy between clinical interpretation of cognition and the pathology. Key goals of data integration in these studies include developing a biological understanding of this discrepancy and identifying additional risk factors to guide development of new treatments. Alzheimer’s disease is complex, and individual data modalities have been studied extensively, said Allen, making integration an important strategy for advancing understanding of the disease.
After providing background on these two case studies, Allen described some of the practical data-related challenges faced regardless of the statistical methods applied. One critical challenge is identifying and correcting for batch effects, which arise from differences in data collection procedures across different laboratories or technologies and are problematic because they can be confounded across data modalities or across time. Allen showed the results of principal component analysis for methylation data and RNA sequencing data from the ROS and MAP studies, which showed clear grouping and batch effects, in one case due to instrument maintenance. Similarly, structural neuroimaging data collected in the ROS and MAP studies before 2012 relied on a 1.5 tesla magnet that was replaced with a 3 tesla magnet to provide greater resolution; how to reconcile these two batches of imaging data remains an open question, said Allen. Another critical challenge is that not all data modalities are measured for every subject, which creates missing or misaligned data and can result in a very limited sample size if the analysis is restricted only to patients for whom complete data are available (Figure 3.3A). This is problematic because these studies begin with small sample sizes relative to the number of variables. Allen showed several Venn diagrams illustrating the small
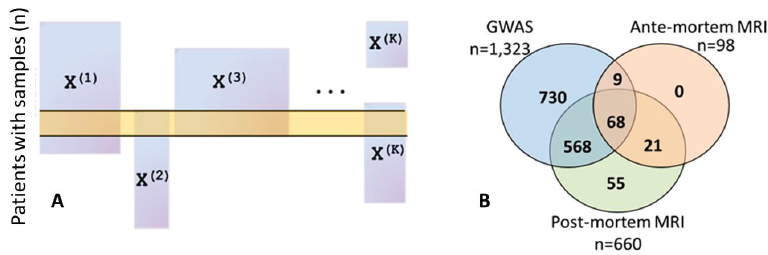
fraction of patients who have multiple data types available: only 68 out of nearly 3,000 patients have genetic information, pre-mortem magnetic resonance imaging (MRI), and postmortem MRI available in the ROS and MAP studies (Figure 3.3B).
Moving to methodological challenges faced in analysis of mixed multimodal data sets, Allen said that prediction is a relatively easy task. Although understudied, there are a number of methods that can be applied: (1) black box methods (e.g., random forests), (2) ensemble learning in which a model is fit to each data modality and then combined, and (3) feature learning approaches (e.g., principal component analysis) on each data modality followed by supervised models using the identified features. More challenging are data-driven discoveries that provide new biological knowledge; for instance, the ROS and MAP studies not only aim to predict if a patient will get Alzheimer’s, but also seek to know why, said Allen.
She then discussed a novel method for integrating mixed multimodal data using network models and exponential families to model a joint multivariate distribution. While the broader literature describes network methods for some types of data—for example, the Gaussian network model for continuous valued data and the Ising model for binary valued data—others are less well researched (e.g., count-valued data, bounded random variables), and bringing all of these data types into a common network model is a significant challenge. Allen introduced a framework for graphical models via exponential families, which assumes that all conditional distributions can be described as a distribution from the exponential family (containing many of the most common distributions including the normal, Gaussian, Bernoulli, and Poisson) and takes the general form of the following:
![]()
where θ is the canonical parameter, B(X) is the sufficient statistic, C(X) is the base measure, and D(θ) is the log-partition function. Based on this assumption, it follows that the joint multivariate distribution takes the form of the following:

in which the pairwise dependencies between variables s and t are given by the product of their sufficient statistics. This flexible framework accommodates diverse data types, permits a wide range of dependence structures, and allows model fitting with penalized generalized linear models, said Allen. To the best of her knowledge, this is the first multivariate distribution that parameterizes dependencies of mixed data types. According to Allen, one of the main challenges in fitting these models is that each type of data is on a different scale, which requires different levels of regularization, and preliminary work shows that standardization of the different data types is inappropriate and potentially misleading. Furthermore, because of correlation within and between data modalities, there may be confounding interference that obscures weaker signals.
While Allen focused on methods for mixed multimodal data, she called attention to existing work on data integration and dimension reduction for single data types such as joint and individual variation explained (Lock et al., 2013) and integrative clustering (Shen et al., 2009). Developing statistical methods for dimension reduction and clustering within mixed multimodal data sets remains an open problem, said Allen. Referring back to the ROS and MAP studies, she said longitudinal studies with mixed multimodal data also present open statistical problems related to aligning data collected at different times. In the bigger picture, the ROS and MAP studies are two of many ongoing projects looking at aging and cognitive health, which creates the opportunity for meta-analysis across similar integrative studies to increase statistical power, which is an objective of the Accelerating Medicines Partnership–Alzheimer’s Disease project.
More fundamental challenges relevant for all medical studies using big data are related to data access, data quality, and patient privacy while sharing data. For example, much of the data collected in the ROS and MAP studies is not yet publicly available, so just getting data to analysts is a major challenge that cannot be overlooked, said Allen. Ensuring reproducibility of research is a critical challenge that is exacerbated in the context of multimodal data because each measurement technique typically has a distinct data preprocessing pipeline, and there may not be one person who understands all of these for large studies such as ROS and MAP. These studies typically are conducted by large teams that use different instruments and different software that introduce error, Allen said, so researchers need to make sure that downstream inferences are reproducible at the end of the analysis.
DISCUSSION OF STATISTICAL INTEGRATION FOR MEDICAL AND HEALTH STUDIES
Jeffrey S. Morris, MD Anderson Cancer Center
Jeffrey Morris remarked that the last 10 years have produced a large amount of complex, information-rich data that has transformed biomedical research. For example, research in molecular biology produces genome-wide data through a variety of platforms that provides information on deoxyribonucleic acid (DNA), RNA, protein expression, and epigenetics data on mediating processes such as methylation. Similarly, imaging technologies continue to evolve and currently provide both structural and functional information, said Morris. Given the abundance of data, the critical question is how biological knowledge can be extracted from these large, complex, and heterogeneous data sets. Integrative modeling is one of the key scientific challenges and will be critical for translating information to knowledge, said Morris, who showed an example of five different types of neuroimaging that each contains different types of information. This is particularly challenging when data and measurement platforms describe biological phenomena across several orders of magnitude in spatial and temporal scales, ranging from single neurons to whole brain regions.
Integrative modeling faces numerous challenges—for example, the small sample size for complete data sets—said Morris, referencing the small overlapping area in a Venn diagram in Figure 3.3B. This requires implementing creative ways to best use the information that is available or developing strategies for multiple imputation of missing data. Similarly, batch effects are a serious problem if they are confounded with important factors and are even more challenging with complex, high-dimensional data sets. Morris also mentioned the importance of understanding data preprocessing—echoing the call for analysts to consider preprocessing as part of their statistical inference—as well as the practical challenges of storing, indexing, linking, and sharing large data sets. Morris then introduced the issue of defining a common unit of analysis, as different data observe different objects and phenomena. For example, methylation occurs at individual sites on a gene, which can contain more than 20,000 potential binding sites, so it is not trivial to align observations and elements across different platforms.
Morris summarized three main classes of statistical tasks described in the preceding presentation by Genevera Allen:
- Building of predictive models that integrate diverse data and allow a larger set of possible predictors to search over, which is difficult with mixed multimodal data sets;
- Structure learning to empirically estimate interrelationships and exploit correlations to reduce the number of parameters, which can be difficult
-
because although structure can usually be found, not all structures are replicable and meaningful; and
- Network structure learning and use of graphical models to estimate pairwise associations in the data.
These strategies focus on concatenating across variables to facilitate discovery of underlying biological phenomena, said Morris. However, there are other integrative modeling strategies to narrow the parameter space, specifically incorporating known or theoretical knowledge into model development. For example, genetic information is transcribed to proteins through mRNA, which in turn is modified through miRNA and epigenetics that also have a genetic component. Expression of different proteins results in different phenotypes or molecular subtypes and ultimately causes different clinical outcomes, so it would make sense to build a model that has this type of directed flow between data modalities. Similarly, incorporating biological knowledge from the broader literature, such as molecular pathway information, can inform model development. Additionally, focusing on biologically relevant information—for example, excluding methylation sites that are known not to affect gene expression—can simplify complex data sets.
For the remainder of his presentation, Morris described a case study evaluating subtypes of colorectal cancer that demonstrates incorporation of biological knowledge into integrative modeling. As motivation, he presented a continuum of precision medicine ranging from traditional practices in which all patients are given the same treatment regardless of personal variability to personalized care in which each patient is given a specifically designed treatment. A reasonable middle ground to aim for is identifying and treating cancer subtypes that share many biological characteristics, said Morris. To develop consensus regarding molecular subtypes of colorectal cancer, Morris and colleagues participated in an international consortium led by SAGE Biosystems that combined information from 18 different studies with mRNA data from approximately 4,000 patients. Their analysis yielded four distinct communities, representing different colorectal cancer subtypes, each characterized by different biological characteristics. The subtypes identified are consistently identified and replicable, in part because the data set is large and diverse, said Morris, and he believes it represents true biological differences. Unfortunately, mRNA data are not clinically actionable and require an understanding of the upstream effectors. TCGA data on colorectal cancer and MD Anderson internal data are now being combined with the goal of characterizing the biology of each colorectal cancer subtype to explore questions such as the following: Which subtype has the worst prognosis and is a priority for aggressive treatment? Do different subtypes respond differentially to a specific treatment? Are there subtype-specific targets that can be used to guide development of new treatments? Morris suggested that integrative modeling is critical to answering these questions.
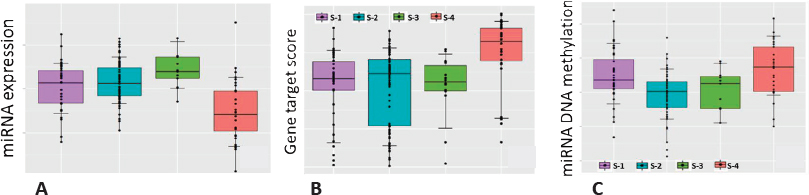
Providing one example, Morris showed boxplots of miRNA expression indicating that the particular miRNA was expressed less in one subtype than in the other subtypes. As miRNA affects expression of numerous other genes, gene set enrichment was used to show that downstream genes that would normally be inhibited by the miRNA were overexpressed in this subtype, and similarly the DNA coding for the miRNA itself is more methylated in this subtype. Putting this information together indicates that methylation inactivates this miRNA, which in turn results in greater downstream expression of genes that are a known hallmark of metastatic cancer (Figure 3.4). Morris described a strategy for relating methylation and mRNA data, which is challenging because methylation is measured at thousands of sites per gene, that involves restricting the analysis to sites for which methylation is correlated with mRNA expression and constructing a gene-level methylation score. In turn, this allowed estimation of the percent of gene expression that is explained by methylation to obtain a list of genes whose expression is strongly modulated by methylation.
In one final example of bringing biological knowledge into statistical model development, Morris presented a Bayesian hierarchical integration framework called iBAG that models biological interrelationships from genetics through clinical outcomes. Beginning with a nonparametric model to regress gene expression based on upstream effectors such as methylation and copy number, these estimates are carried forward as predictors in the clinical regression model. This results in a list of prognostic genes and the upstream effectors that are responsible for its expression, said Morris. The framework has been extended to account for gene pathways as well as to incorporate clinical imaging data, which allows researchers to identify predictive features on an image, understand the gene pathways associated with that feature, and relate these pathways to the upstream genetic and epigenetic processes
that dictate gene expression. Integrating multimodal data and known biology reduces the number of potentially relevant parameters, which makes modeling more efficient, and incorporating known biological information yields biologically coherent results that are more likely to be reproducible, said Morris. However, he cautioned that not everything in the literature is true, so incorporating biological knowledge may introduce additional bias. Furthermore, it requires detailed understanding of the underlying biology, and Morris concluded with an appeal for close collaboration between disciplinary scientists and statistical analysts.
PANEL DISCUSSION
Genevera Allen and Jeffrey Morris participated in a panel discussion following their individual presentations. A participant remarked on the growing popularity of graphical models, such as the Ising and Gaussian used by Allen, but asked why Bayesian networks were not mentioned despite their ability to integrate mixed multimodal data and additional advantageous properties. Morris answered first, saying that graphical models can be fit using either a Bayesian or frequentist approach. He agreed that Bayesian networks have many advantages but pointed out that they may be more computationally demanding. Allen responded that a lot of good work has been done using Bayesian networks to integrate mixed multimodal data, and the framework she presented using exponential families to represent a multivariate distribution could be applied with Bayesian networks and priors. Many Bayesian approaches model dependencies between mixed data types in the latent hierarchical structure of the model; this avoids challenges related to scaling of data across modalities but is often more difficult to interpret. There are benefits and drawbacks to both approaches, and data should be analyzed with many different methods, concluded Allen.
Another participant commented that as a biologist he viewed changing technology as a positive trend, making reference to the replacement of 1.5 tesla magnets in MRI machines with a 3 tesla magnet mentioned by Allen, and asked for comments or strategies to avoid older data becoming obsolete while taking advantage of the improved data produced by newer instruments. Allen responded that one strategy is to identify appropriate metrics—for example, gene-level summaries of methylation—that allow researchers to link data sets across technology changes. The strategy depends a lot on the context, Morris explained, but MD Anderson analyzes some common samples with both the newer and older technology and uses these overlapping data sets to create a mapping function to relate the older and newer data sets.
A participant asked how to interpret the dependencies between mixed data specified as multivariate distributions from exponential families and if using likelihood-based methods for inference would lead to model misspecification given the
limited sample size. Addressing the first question, Allen responded that dependencies between mixed data are parameterized as the product of sufficient statistics from each underlying distribution and that interpretation of this is an open area for future research. Regarding the second question, Allen agreed that there is an insufficient sample size relative to the number of parameters to rely on likelihood-based inference even in large medical cohort studies with thousands of subjects. In the cases that Allen has applied this approach, she relied on biological knowledge to filter the data, as discussed by Morris, before fitting the network. Furthermore, it is critical to understand the reproducibility of network features, said Allen, who described how she uses bootstrapping to assess the stability of network edges and provides collaborators with a rank ordering of the most important edges. Although this is practicable, Allen acknowledged that there are likely better ways to assess reproducibility that should be the subject of further research.
In the last question, a participant noted that many different models exist and asked how the speakers compared and assessed the suitability of the models they used beyond prediction. Morris answered that after developing a model, he uses it to generate data for comparison to the original data used to create the model. Allen added that model averaging or consensus models are other strategies that can be used to compare and improve inference from complex models.


