
3
The Demography of the English Learner Population
A prerequisite for understanding English learners (ELs) is a systematic analysis of their demographic characteristics and of whether and how these characteristics differ from those of their non-EL peers. These are not simple matters. Nonetheless, existing descriptions of ELs yield some generalizations about their overall demographic characteristics and can help in better understanding the supports that may be needed by ELs and their families for these children and youth to succeed in school.
Before proceeding, a note on the terminology used in this chapter is in order. As explained in Chapter 1 (see Box 1-1), the term “dual language learner (DLL)” is used in this report to refer to children from birth to age 5 in their homes, communities, or early care and education programs; the term “English learner (EL)” is used to refer to children and youth ages 3-21 in the pre-K to 12 education system; and the term “DLL/EL” is used to refer to the broader population of children and youth from birth to age 21. The major data sources cited in this chapter generally provide demographic information only for ELs. Therefore, as reflected in the chapter’s title, the text focuses on this group. Nonetheless, the discussion, as well as the conclusions at the end of the chapter, often may be relevant to DLLs, and in some cases these children are explicitly included in the cited research. Finally, the term “indigenous heritage language learners” is used to refer to American Indian, Alaska Native, and Native Hawaiian students whose first language is English and who are learning their heritage language.
The population of ELs is demographically diverse (Espinosa, 2013; García et al., 2009; Hammer et al., 2011). ELs vary in their home language, language abilities, age, race/ethnicity, immigration circumstances,
generational status in the United States, geographic distribution, academic achievement, parental characteristics and socioeconomic resources, disability status, nativity status, and other demographic attributes (Capps, 2015; Fry, 2007). Thus, while on average, ELs have a number of unique characteristics that distinguish them from the general population of non-ELs (Capps, 2015; Fry, 2007), broad comparisons of ELs with non-ELs mask significant heterogeneity within both groups.
Describing the characteristics of ELs is complicated for several reasons beyond this demographic diversity. First, definitions of ELs differ across datasets. Many studies identify ELs simply by using parental reports on home language use and the English proficiency of their children (e.g., Cleave et al., 2010; Winsler et al., 2014). Other studies rely on information on program participation to distinguish ELs from non-ELs. A major limitation of this latter approach is that it can understate actual variations in language proficiency among children. To overcome this limitation, some scholars use such methods as specialized language proficiency tests and statistical models to distinguish the two groups (Farrington et al., 2015; Niehaus and Adelson, 2013). In the U.S. Census and the American Community Survey (ACS), ELs can be identified only using proxy indicators that capture whether children speak English less than “very well” (Ruiz Soto et al., 2015). The Census and the ACS ask language proficiency questions about all respondents ages 5 and older who speak only English at home. For respondents who speak a language other than English at home, the Census and ACS further distinguish among those who speak English very well, well, not well, and not at all.1 The data collection process also is complicated by the difficulty of translating survey instruments, disproportionate nonresponse rates driven by suspicion of government or fear of deportation among some subgroups, missing data for some age groups, and difficulties in obtaining representative samples through phone surveys. A recent report (O’Hare et al., 2016) suggests that young children, particularly those under age 5, have a higher net census undercount than any other age group when they live in difficult-to-count places, such as areas with multiunit buildings and a high proportion of renters, or in difficult-to-count households, such as multigenerational and highly mobile families or households with complex relationships. Evidence also suggests that some adults believe young children need not be reported on the census form. In addition, data analyses typically group ELs into broad racial or ethnic categories such as Asian or
___________________
1 Both the Census and the ACS ask the following question: “Does this person speak a language other than English at home?” If the response to this question is yes, the following question is then asked: “How well does this person speak English?” While these questions can provide useful insight into the characteristics of ELs, they have several limitations, including the fact that they do not capture children’s proficiency in writing and reading English.
Hispanic, disregarding the socioeconomic and language diversity of such groups.
Variations in the identification of ELs across datasets have several implications for the description of their demographic profiles. Among the most important of these implications is that the variations limit the ability to estimate the size of the population of ELs accurately. As Capps (2015) reports, estimates of the number of ELs in the United States range from 2.6 million, based on U.S. Census definitions, to approximately 4.9 million, based on data from the U.S. Department of Education. One possible reason for this disparity is that, whereas the census definitions are based on responses to questions on language use at home, the U.S. Department of Education identifies ELs using various criteria (e.g., nativity status; reading, writing, and spoken English proficiency) that usually are captured in school administrative data (U.S. Department of Education, 2016). Differences in the definition of ELs across datasets also may result in selectivity in the types of ELs identified across studies. In other words, the ability to draw reliable conclusions about ELs from multiple datasets is limited by the challenge of comparing the outcomes of children who may differ in their familiarity with two or more languages or language varieties, as well as their language skills.
Despite the above challenges, existing data are used in this chapter to serve a simple instrumental purpose—to develop a broad portrait of ELs from which inferences can be drawn regarding who they are and how they differ from or are similar to the broader population of non-ELs.
THE ORIGINS OF ENGLISH LEARNERS
The annual number of immigrants admitted to the United States increased from about 320,000 in the 1960s to approximately 1 million in the following decade (Martin and Midgely, 2006). By 2013, the foreign-born population numbered 46 million, up from approximately 10 million in the mid-1960s (Connor et al., 2013; Fix and Passel, 2003).
Children of immigrants are the fastest-growing and one of the most diverse segments of the child population in the United States (Capps et al., 2005). In 2004, Latinos made up 21.4 percent of the total U.S. population under 5 years of age, and 23 percent of all babies born in the United States in that year were born to Latina mothers (both foreign- and U.S.-born) (Castro et al., 2010).
Between 1995 and 2010, first- and second-generation youth and young adults of immigrant origin accounted for half of the population growth among those ages 16-26 (Batalova and Fix, 2011). In 2010, first-generation youth accounted for 10.3 percent and second-generation youth for 14.1 percent of all people in the United States ages 16-26—together making
SOURCE: Data from Jensen et al. (2015).
up roughly one-fourth of the total population of this age group (Batalova and Fix, 2011). These young people represent the future workforce in the United States and will play an important role in the vibrancy of the U.S. economy and local communities. As noted above, they are a highly heterogeneous group, with different home languages, different ages at arrival, varying proficiency in English, differing legal status, diverse racial and ethnic identities, and varying educational outcomes (Crosnoe and López Turley, 2011; Rumbaut, 2004; Suárez-Orozco et al., 2010).
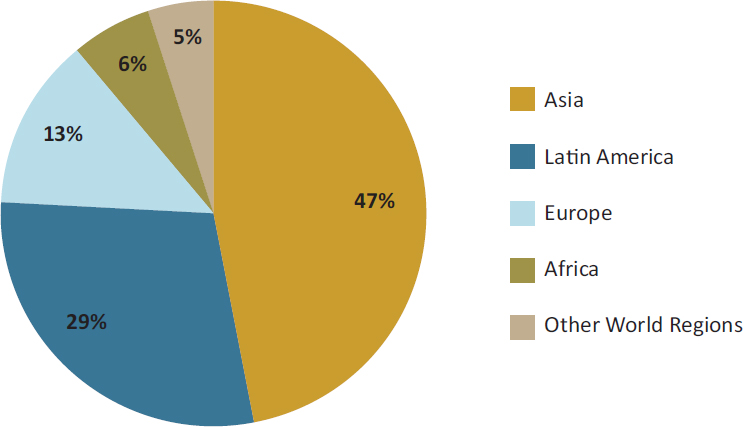
As the size of the foreign-born population in the United States has increased, so, too, has the number of countries and regions of origin of immigrants. Whereas 88 percent of all immigrants who arrived between 1820 and 1920 came from Europe (Massey, 1999), recent immigrants arriving since 1965 are distinguished by their non-European origins (Jensen et al., 2015; Martin and Midgely, 2006), coming largely from Latin America and Asia. As of 2013, Mexico was the birthplace of 28 percent of all immigrants currently living in the United States (Krogstad and Keegan, 2015). As shown in Figure 3-1, approximately half of all new immigrants arriving in the United States in 2013 arrived from Asia (47.1%), followed by Latin America (29.5%),2 Europe (12.5%), Africa (6.2%), and other world
___________________
2 In this instance, the term Latin America follows the definition of the U.S. Census Bureau and the United Nations, which includes Mexico, the countries of Central and South America, and the Caribbean.
regions (4.7%) (Jensen et al., 2015). According to the Pew Research Center (2012), Asian Americans are now the fastest-growing, highest-income, and best-educated racial/ethnic group in the United States.
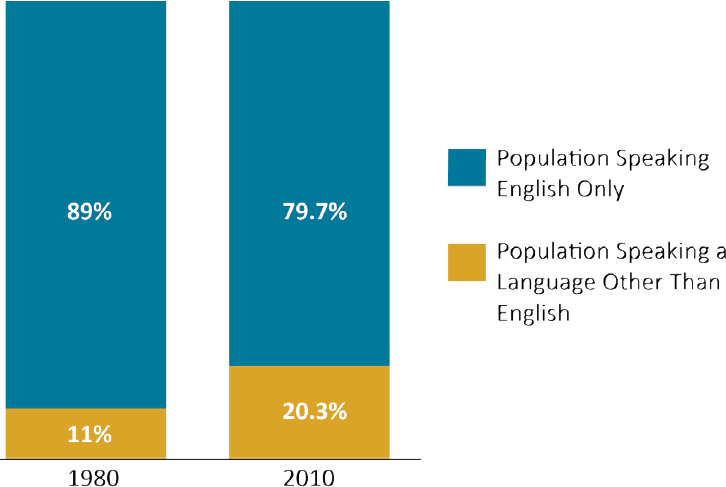
Immigration trends contribute to the changing profile of the U.S. population of children and youth. Overall, about 1 in 5 children between 5-17 years old now live in immigrant families (García et al., 2009; Landale et al., 2011). Combined, the foreign-born population and U.S.-born individuals with immigrant parents account for 25 percent of the overall U.S. population (National Research Council, 2015). Recent immigration trends also are associated with changes in the distribution of languages spoken in the United States. In the past three decades, the percentage of the U.S. population speaking only English has declined, while the percentage speaking a language other than English has increased. Spanish is the most commonly spoken non-English language in U.S. homes, even among non-Hispanics (Gonzalez-Barrera and Lopez, 2013). According to Rumbaut and Massey (2013), 89 percent of the U.S. population spoke only English in 1980, compared with 79.7 percent in 2010 (see Figure 3-2). The use of non-English languages is an essential part of immigrants’ identities, and this cultural
SOURCE: Data from Rumbaut and Massey (2013).
role of language is reflected in the diverse set of mother-tongue languages currently being used within immigrant families and their communities (Ruiz Soto et al., 2015).
ELs of Hispanic Origin
Hispanic populations, which can be white, black, or of mixed race/ethnicity, are growing and dispersing across the United States. Hispanics make up 20 percent or more of the kindergarten population in 17 states, concentrated especially in the West and Southwest. In 2012, 25 percent of all newborns in the United States were Hispanic. Mexico may no longer be the main source of new U.S. immigrants, although Mexico currently remains the major country of origin of immigrants in the United States (González-Barrera et al., 2015). While many of the Mexican families in the United States have been in the country for many years, Mexican Americans have a long history of circular migration to the United States, and their children may have experienced schooling in both the United States and Mexico (Migration Policy Institute, 2014; Zúñiga, 2013). Hispanic populations also include immigrants who speak an indigenous language—sometimes in addition to Spanish—from Mexico and Central America and who also know or are learning English.
In a qualitative study of Central American immigrant families residing in Los Angeles, Lavadenz (2008) found that linguistic diversity among Central Americans who migrated to the United States served to identify each group with its homeland and linked compatriots to one another. She demonstrated that Central America is not uniformly Spanish-speaking, and indigenous languages—such as the Mayan languages spoken in Guatemala—are often overlooked. Even in countries that speak Spanish, each country has different pronunciations and vocabulary, and regions such as Belize and parts of Nicaragua have strong influences of English because of colonization.
The Hispanic or Latino population also is culturally diverse, although most come from countries where Spanish is spoken (see Table 3-1). Additionally, as of 2015 Hispanics/Latinos represented the largest ethnic group in the United States at 54 million, or 17 percent of the nation’s population (U.S. Census Bureau, 2015). When population figures for 2012 are presented by nativity, Mexicans are the largest group of Hispanic origin, representing 64.2 percent of the U.S. Hispanic population, Puerto Ricans are the second-largest at 9.3 percent, with Cubans at 3.7 percent and Salvadorans at 3.7 percent. The remaining 19 percent of the U.S. Hispanic population comes from countries, such as Guatemala, Dominica, Columbia, and Honduras. Table 3-1 shows that Mexico is also the country of origin of the largest number of ELs.
The largest percentages of the U.S. Hispanic population are those younger than 5 (4.9%) and 5-9 (4.9%)—preschool- and school-age children (Brown and Patten, 2014). Overall, Hispanics are a young population, with a median age of 27; U.S.-born Hispanics have an even younger median age of 18 (Brown and Patten, 2014).
ELs of Asian Origin
The countries from which ELs of Asian origin come are also considerably diverse (see Table 3-1). According to the 2010 Census, the largest populations of Asian origin in the United States are Chinese, Asian Indian, Filipino, Vietnamese, Korean, and Japanese, in that order (Frey, 2015), which together make up at least 84 percent of the total U.S. Asian population. Various Asian subgroups, such as Bangladeshis, Burmese, Cambodians, Hmong, Laotians, Pakistanis, and Thais, also exist in significant numbers (Pew Research Center, 2012). The Chinese, whose history dates back to the 1840s in the United States, are the oldest and largest population of Asian origin in the United States (Lee and Zhou, 2015), numbering about 4 million in the 2010 Census. The Vietnamese, whose numbers in the U.S. population rose after the Vietnam War ended in 1975, are one of the newest Asian groups in the United States.
According to Lee and Zhou (2015), contemporary Asian immigrants exemplify “hyper-selectivity,” meaning that on average, they have higher levels of education and higher skills than others in their home countries; they also are more highly educated than the average American. There are exceptions to this generalization, such as some Southeast Asian immigrants, but it nonetheless remains largely true.
The different origins and immigration histories of Asian groups result in differing social and demographic attributes. Recently arrived Vietnamese, Koreans, and Asian Indians are a relatively young population. For example, 40 percent of the U.S. Asian Indian population in 2010 had arrived since 2000, and one-quarter of the total U.S. Asian Indian population is under age 18 (Frey, 2015). Whereas early Chinese immigrants were low-skilled and originated from areas in the southern region of Guangdong Province, contemporary Chinese immigrants are of diverse origins and socioeconomic backgrounds. According to Lee and Zhou (2015), Chinese immigrants now come primarily from mainland China, Hong Kong, and Taiwan, but some come from Southeast Asia and the Americas. Although all ethnic Chinese share an ancestral written language that may vary in versions of the written characters, they also speak a variety of regional dialects, including Cantonese, Mandarin, Hakka, Taiwanese, and others (Lee and Zhou, 2015).
TABLE 3-1 Origin Countries of Foreign-Born Children Who Are English Learners (ELs)
| Country | Percentage |
|---|---|
| Mexico | 41.28 |
| China | 4.54 |
| Dominican Republic | 3.60 |
| Vietnam | 3.49 |
| Philippines | 3.48 |
| Korea | 3.03 |
| El Salvador | 2.78 |
| Guatemala | 2.19 |
| Cuba | 2.16 |
| Haiti | 2.00 |
| India | 1.94 |
| Thailand | 1.90 |
| Japan | 1.40 |
| Honduras | 1.38 |
| Colombia | 1.17 |
| Other Central and South American countries | 7.01 |
| European Countries | 5.97 |
| African countries | 4.36 |
| Other countries | 6.32 |
| All Foreign-Born | 100.00 |
NOTE: ELs are defined based on responses to the American Community Survey (ACS) question of how well individuals who speak a language other than English at home speak English. ELs thus are defined as children who speak English less than “very well.” As noted in footnote 2, language information from the ACS has its limitations. However, because ACS data are extensive and nationally representative, they are still useful in providing a broad picture of the characteristics of children who can be classified as ELs.
SOURCE: Data from the American Community Survey, 2008-2012.
ELs of Native Hawaiian or Pacific Islander Origin
More than 1.2 million Native Hawaiians and Pacific Islanders were living in the United States as of 2010 (U.S. Census Bureau, 2012). While Native Hawaiians and many Pacific Islanders are U.S. citizens, some Pacific Islanders are foreign-born and vary in their immigration status. Among the
Native Hawaiians and Pacific Islanders, Native Hawaiians are the largest ethnic group, numbering more than 527,000, followed by Samoans and Guamanian or Chamorros. Ethnic groups in this population also include Tongan, Fijian, Marshallese, Palauan, Tahitian, and many others (Empowering Pacific Islander Communities and Asian Americans Advancing Justice, 2014).
Pacific Islander immigrants to the United States often face a lack of culturally competent indigenous heritage language programs to help them navigate the U.S. immigration system and other services, such as education. Nearly 29 percent of Native Hawaiians and Pacific Islanders speak a language other than English at home, primary among these being Samoan, Tongan, Hawaiian, and Chamorro. Marshallese (78%) and Fijian Americans (77%) are most likely to speak a language other than English at home. Nearly 9 percent of Native Hawaiians and Pacific Islanders report limited proficiency in English on average. Marshallese Americans have a higher-than-average rate of limited English proficiency (41%) among Native Hawaiian and Pacific Islander groups, and in more than one in four Marshallese American households (26%), everyone in the household over age 14 has limited English proficiency or speaks English less than “very well” (Empowering Pacific Islander Communities and Asian Americans Advancing Justice, 2014). This rate is similar to that of Latinos and higher than that of Asian Americans (Empowering Pacific Islander Communities and Asian Americans Advancing Justice, 2014).
ELs of European Origin
Research is limited on immigrants to the United States from Eastern Europe and their children. After the collapse of the communist regime in Eastern Europe in the early 1990s, the number of these immigrants increased significantly, from 1.3 million in 1995 to 4.3 million in 2006 (Migration Information Source, 2009). Many highly educated researchers, professors, and scientists left their countries of origin seeking better economic and professional opportunities when the economies of previously communist states disintegrated, and wars erupted in Bosnia and Herzegovina (Ispa-Landa, 2007). As a result, Eastern European immigrants generally have higher educational attainment relative to immigrants from such regions as Mexico and Latin America. According to Gold (2007), the percentage of immigrants born in the former Soviet Union with a bachelor’s degree or higher (60%) is greater than that of all foreign-born people in the United States (26%), and these highly educated immigrants are likely to have a good command of the English language when they arrive. Given their high human capital, occupational success, and favorable reception in the United States, families and children of highly educated immigrants
relative to those of less well educated immigrants generally have an easier time adapting to their new environment, report higher levels of satisfaction and psychological well-being, are more geographically dispersed within the United States, are less likely to reside in ethnic communities, have high levels of interaction with the U.S.-born population, and regard their children’s education and school progress in the United States as important goals (Nesteruk and Marks, 2011).
At the same time, communication difficulties and uncertainty about how to handle schooling situations often result in cultural gaps between these parents and their children despite the parents’ relatively high education levels (Nesteruk, 2010). Nesteruk and Marks (2011) report that although each Eastern European country has its unique culture, language, and traditions, as these parents became more acculturated, they practiced an “American” style of parenting that involved more child-centered approaches and permissiveness—giving children choices and negotiating with them. The challenge for these immigrants, as for those from other cultures, was to find an acceptable balance between the two cultures. Eastern European immigrant parents often reported difficulties with their children’s diminishing obedience and respect for the authority of parents, elders, and teachers. This finding is consistent with those of previous research on Latin American, Asian, Middle Eastern, and African immigrant parents in the United States who lack extended family to reinforce important language and cultural norms (Nesteruk and Marks, 2011). Relative to the overall immigrant population, however, common immigrant issues such as language brokering and parent-child role reversal are less relevant to immigrants in professional occupations, who, as noted, generally have greater success in being incorporated (Nesteruk, 2010).
ELs of African or Caribbean Origin
The growth in the number of black immigrants in the United States is another dimension of recent immigration trends that has implications for the nation’s language diversity. Research indicates that the voluntary black immigrant population in the United States increased by more than 2,000 percent between 1965 and 2013 (Anderson, 2015). Black immigrants, especially those from Africa, are now one of the fastest-growing immigrant groups in the nation (Capps et al., 2011; Rumbaut, 1994; Thomas, 2011c), and their young children are one of the fastest-growing segments of the U.S. child population (Hernandez, 2012).
Research reveals significant variation in the English proficiency of black immigrant groups (Thomas, 2010, 2011a, 2011b). These variations are associated in part with the language characteristics of countries within the two main world regions from which these immigrants originate—the
Caribbean and Africa. Relative to those from Africa, Caribbean immigrants have a longer history of migration to the United States, accounting for approximately 49 percent of the black immigrant population (Thomas, 2012). Although the majority come from English-speaking countries such as Jamaica and Trinidad and Tobago, many others, including those from Haiti and the Dominican Republic, have French and Spanish language backgrounds (Thomas, 2012).
African immigrants, accounting for about 33 percent of the black immigrant population, immigrate to the United States mainly through the Diversity Visa Program, although a growing number of African immigrants from countries such as Somalia and Ethiopia arrive as refugees (Thomas, 2011a). As with their Caribbean counterparts, black immigrants from Africa largely originate from English-speaking countries; many, however, come from non-English-speaking backgrounds, including countries in which French, Portuguese, and Arabic are the primary languages (Thomas, 2010). South American countries such as Brazil, Colombia, and Venezuela account for a smaller proportion of the black immigrant population, and their main languages are Spanish and Portuguese.
Mitchell (2015) provides the most recent information on the languages spoken at home by black immigrant children. According to his estimates, 40 percent of black immigrant children speak Spanish at home, reflecting the increasing number of black immigrants from Central America, Latin America, and the Caribbean. Another 18.1 percent speak French Creole; 7.5 percent speak French; and the remaining 34 percent speak an assortment of languages, including Yoruba, Fulani, Swahili, Portuguese, and Arabic.
ELs Born in the United States
While the countries of origin of immigrant ELs are considerably diverse, it is important to note that the majority of children in the U.S. EL population are born in the United States and are birthright citizens. As shown in Figure 3-3, the percentage of ELs born in the United States is greater than the percentage of their foreign-born peers at every age between 5 and 17. Figure 3-3 also shows that the majority of U.S.-born ELs have at least one immigrant parent.
At the same time, the distributions presented in Figure 3-3 have important implications for understanding other issues. For example, the high concentration of foreign-born ELs in the older age group implies that they are the most likely of the three major groups shown in the figure to complete high school with low levels of English proficiency. This pattern does not appear to be driven by older ages at arrival among foreign-born ELs: foreign-born ELs arrive in the United States at a younger average age (4.97
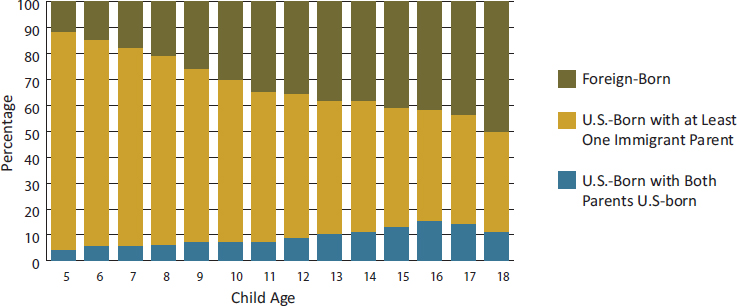
SOURCE: Migration Policy Institute analysis of the American Community Survey, 2008-2012, presented by Capps (2015).
years) relative to foreign-born non-ELs (7.6 years). Instead, foreign-born ELs appear to find themselves in disadvantaged structural contexts that limit their access to services needed to improve their English proficiency. Figure 3-3 also shows that children exposed to English earlier in life (i.e., U.S.-born children with one or both immigrant parents) account for considerably lower percentages of those graduating from high school as ELs. Finally, the fact that U.S.-born children account for almost 50 percent of ELs at age 18 indicates that the existing education system neglects a significant number of these children.
Group differences among immigrant children often reflect disparities in the types of parents who choose to emigrate from another country to the United States. East Asian immigrant children, for example, are likely to have college-educated parents, while Mexican immigrant children are likely to have no parent with a high school degree (Crosnoe and López-Turley, 2011).
American Indian and Alaska Native Indigenous Heritage Language Learners
The ACS codes 381 distinct non-English languages, 169 of which are Native North American languages, although the speakers of these latter languages number less than half a million (Siebens and Julian, 2011). The most common Native North American languages spoken by American Indian and Alaska Native individuals ages 5 and older include Navajo, spoken by more people—an estimated 169,471—than any other Native
North American language; Yupik, with 18,950 speakers; Dakota, with 18,616 speakers; Apache, with 13,063 speakers; Keres, with 12,945 speakers; and Cherokee, with 11,610 speakers (Siebens and Julian, 2011). Fully 87 percent of the population ages 5 years and older living in an American Indian or Alaska Native area speak only English at home. The percentage of those who live in an American Indian or Alaska Native area who report speaking a Native North American language at home does not vary greatly across age groups, although the highest percentage doing so is among those ages 18-64, at 5.6 percent, followed those ages 5-17 and 65 and older, each at 5.1 percent (Siebens and Julian, 2011). Among those who identified as American Indian or Alaska Native, the most likely to maintain the home language are members of the older generation, among whom more than 1 in 5 ages 65 and older speak a Native North American language at home, while about 1 in 10 of those ages 5-17 do so. Spanish speakers (5% of the population residing in American Indian or Alaska Native areas) are almost as common as speakers of Native North American languages.
THE GEOGRAPHIC DISTRIBUTION OF ENGLISH LEARNERS
ELs are located in every state of the United States, as well as the U.S. territories and commonwealths (e.g., Guam, Puerto Rico); in American Indian and Alaska Native communities; and on American Indian tribal lands. On the U.S. mainland, California and Texas have the highest share of ELs, who represent 9 percent of children ages 5-18 enrolled in school; Arizona, Illinois, Nevada, New York, and Washington also have large concentrations of ELs (Capps, 2015). Collectively, California, Florida, New York, and Texas house 58 percent of second-generation immigrant youth (Enchautegui, 2014). The lowest percentages of ELs (approximately 3% of school-enrolled children in this age group) are found in states such as Idaho, Maine, Montana, North Dakota, South Dakota, Utah, and Vermont (Capps, 2015). U.S. Department of Education data show that the states of Alaska, California, Colorado, Florida, Kansas, Nevada, New Mexico, Oregon, Texas, Hawaii, and Washington enrolled 10-25 percent ELs among K-12 students in the school year 2012-2013 (Capps, 2015).
Within states, an emerging feature of the geographic distribution of ELs is their notable levels of residential and schooling segregation. The best example of this phenomenon is seen in the segregation experiences of Hispanic ELs. Estimates indicate that an increasing number of these children attend schools where they account for 90 to 100 percent of the student population (Carnock and Ege, 2015). Other dimensions of the segregation experiences of Hispanic children include their high concentrations in poor and disadvantaged neighborhoods, as well as their linguistic segregation. Carnock and Ege (2015), for example, argue that the linguistic
segregation of Hispanics can be observed across several levels, including their segregation into schools with other poor children who are also ELs, and within schools, where they are likely to be in bilingual programs or classes in which most of the children are classified as ELs. Compared with the evidence on segregation among Hispanic ELs, less is known about the experiences of their non-Hispanic peers. Nevertheless the high prevalence of racial/ethnic segregation in housing and schooling in the United States suggests that the segregation experiences of Hispanic ELs are likely to be shared by ELs from other minority groups.
Historically, ELs have tended to cluster in large urban areas in immigrant enclaves, such as Chicago, Houston, Los Angeles, Miami, and New York City (Uro and Barrio, 2013). Gateway cities such as these continue to have high concentrations of ELs. Recent years, however, have seen a shift to destination sites across the United States, in small towns as well as in cities, in the nation’s interior and along its coasts (Massey, 2008; Singer, 2004, 2015) (see Figure 3-4).
Using U.S. census data, Singer (2004) notes that newly emerging immigrant gateways experienced rapid growth of both the foreign-born and U.S.-born since the 1970s. Immigrants and their families in metropolitan areas were more likely to live in suburbs than in inner cities. The author also reports that the recent arrivals to the newest immigrant gateways, who originated mainly from Asian countries or Mexico, were likely to have low English proficiency, which also continued to be the case among immigrants residing longer in the traditional post–World War II gateways. Singer (2015) also adds a new category of major emerging gateways—those with
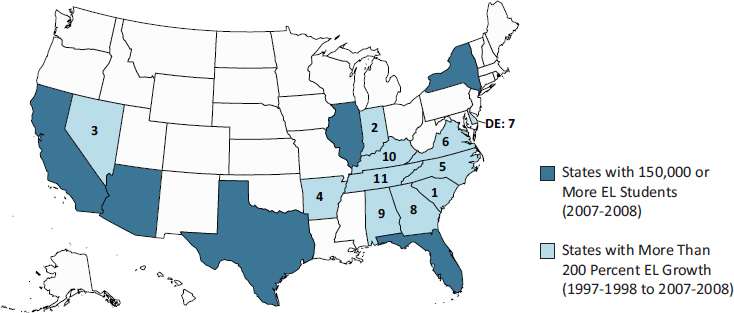
NOTE: Numbers on the map show the ranking of states in EL growth.
SOURCE: National Clearinghouse for English Language Acquisition, State Title III Information System © 2010 Migration Policy Institute.
the fastest contemporary growth rates. This category includes Atlanta, Austin, Charlotte, Las Vegas, Orlando, and Phoenix, which together accounted for 8 percent of the total foreign-born population in the United States in 2014. The author notes that immigrants continued to find opportunities in both more established and emerging and reemerging gateways. New York City, for example, saw an increase of nearly 900,000 immigrants between 2000 and 2014, while Houston and Miami each gained more than 500,000.
Previous research shows notable variations in settlement within and among immigrant groups. Studies show, for example, that for Asian populations, the major settlement areas differ by national group. According to 2010 census data reported by Frey (2015), Boston, Los Angeles, New York, San Francisco, and San Jose had the largest Chinese populations, accounting for 54 percent of the total U.S. Chinese population. Chicago, Los Angeles, New York, San Francisco, and Washington (DC) had the largest populations of Asian Indians. Filipinos lived predominantly in Honolulu, Los Angeles, New York, San Diego, and San Francisco, which housed 43 percent of that group. Vietnamese lived predominantly in Dallas, Houston, Los Angeles, San Jose, and Washington (DC); Koreans in Chicago, Los Angeles, New York, Seattle, and Washington (DC); and Japanese in Honolulu, Los Angeles, New York, San Francisco, and Seattle, which accounted for 52 percent of the total U.S. Japanese population. Saint Paul Public Schools in Minnesota reported 31.5 percent Asian students in 2014, with the highest percentage in grade 11 (40.7%). Almost three of four Asian students in that district were identified as ELs (69%), and one in five were Hmong (Saint Paul Public Schools Office of Accountability, 2015).
According to Siebens and Julian (2011), speakers of Native North American languages were concentrated most heavily in the states of Alaska, Arizona, and New Mexico, which accounted for 65 percent of this population. Their highest concentration—37,000—was in Apache County, Arizona. The urban areas with the largest number of American Indians and Alaska Natives in 2010 were Albuquerque, Anchorage, Los Angeles, New York City, Oklahoma City, and Phoenix (Norris et al., 2012).
The states with the largest Hispanic population were California at 14,539,578 (38.2% of the state population) and Texas at 9,959,855 (38.2%) (Brown and Patten, 2014). New destination states, such as North Carolina (8.7% Hispanic), Nevada (27.3%), Pennsylvania (6.1%), Virginia (8.4%), and Washington (11.7%), have experienced substantial increases in their Hispanic populations in recent years as Hispanics have dispersed throughout the United States (see Table 3-2). The rapid increases in the Hispanic populations in these new destination states have resulted in many towns and cities and school districts experiencing significant changes in the ethnolinguistic composition of their populations for which they were not prepared.
| State | 2000 | 2012 | Increase, 2000-2012 | Percentage Change, 2000-2012 |
|---|---|---|---|---|
| Georgia | 434,375 | 903,300 | 468,925 | 108.0 |
| North Carolina | 377,084 | 845,420 | 468,336 | 124.2 |
| Virginia | 333,482 | 687,008 | 353,526 | 106.0 |
| Maryland | 230,992 | 510,448 | 279,456 | 121.0 |
| Oklahoma | 173,746 | 356,077 | 182,331 | 104.9 |
| Tennessee | 116,692 | 306,710 | 190,018 | 162.8 |
| Arkansas | 85,303 | 197,146 | 111,843 | 131.1 |
| Alabama | 72,152 | 185,188 | 113,036 | 156.7 |
| Iowa | 80,204 | 160,566 | 80,362 | 100.2 |
| Kentucky | 56,922 | 133,726 | 76,804 | 134.9 |
| Delaware | 37,811 | 78,597 | 40,786 | 107.9 |
| Mississippi | 37,301 | 76,139 | 38,838 | 104.1 |
| South Dakota | 10,101 | 23,402 | 13,301 | 131.7 |
| North Dakota | 7,429 | 16,459 | 9,030 | 121.6 |
| Vermont | 5,260 | 10,662 | 5,402 | 102.7 |
NOTE: States are listed in descending order of number of Hispanic residents in 2012.
SOURCE: Adapted from Brown and Patten (2014). Data from Pew Research Center’s Hispanic Trends Project tabulations of 2000 Census (5% IPUMS) and 2012 American Community Survey (1% IPUMS). IPUMS = Integrated Public Use Microdata Series.
Collectively, new destination gateways increased their share of the U.S. immigrant population from 18.2 percent in 2000 to 20.8 percent in 2010. Medium-sized metropolitan areas and small metro and nonmetro areas gained as the numbers of immigrants declined in traditional urban gateways, although the allure of these new destinations weakened in the late 2000s as a result of the U.S. economic recession (Ellis et al., 2014). Ellis and colleagues (2014) speculate that increasingly hostile environments for immigrants and their children and locally based anti-immigration initiatives may have affected the propensity of immigrants to locate in some of these new destinations (Ayón, 2015).
Schools remain at the forefront of the integration of immigrant children and youth into U.S. society, and some schools are clearly more prepared to support the educational success of ELs than others. The majority of immi-
grants studied by Griffith (2008) reported that communities in the Midwest were doing a good job at the elementary level, while those in communities in the South had less favorable perceptions of their children’s elementary schools.
Griffith (2008, p. 194) found that Southern schools were “less sanguine in their reception of new immigrants” than Midwestern schools but were nevertheless making efforts to accommodate the new students by offering instruction in English as a second language (ESL) (Griffith, 2008). Although this was a small regional study, the schools Griffith studied in two Northern sites went well beyond merely teaching English to newcomers. In addition to offering ESL classes, those schools made efforts to learn about the cultural backgrounds of immigrant children; helped teachers understand the conditions that refugee children might have experienced; made efforts to deal with ethnic tensions that arose among Anglo, Somali, Latino, and Asian youth; and brought in volunteer bilingual adult members of each immigrant group to facilitate communication among students, families, and staff. They also made continuing attempts to involve parents in the schools and hired immigrants as teachers’ aides in an attempt to make the students and their families feel welcome. Griffith found that new immigrant children sometimes proved beneficial to rural school districts losing enrollment. One school in a rural area of Minnesota, for example, experienced an influx of new Hmong students between 2000 and 2003 that revitalized the local elementary school, saving it from closing.
The inadequate language competency of teachers remains a major challenge to the provision of services for the growing number of ELs. School districts may attempt to bring in parents or members of an underrepresented language group to translate for students and assist them in the classroom, but these assistants often lack the formal teaching credentials required of English-speaking teachers and may lack the academic skills needed to guide students in the school curricula. The availability of teachers with the training required to meet the educational needs of ELs also varies widely. In a paper commissioned for this report, for example, Arias and Markos (2016) indicate that the ratio of ELs to teachers certified in ESL/bilingual education (BLE) is 1:10 in traditional immigrant destinations such as California and Florida, but 1:391 in new immigrant destinations such as Kansas.3 (For a more detailed discussion of workforce issues related to ELs, see Chapter 10.)
Other suburban school districts with predominantly white populations have found it challenging to respond to the increasing racial/ethnic diversity driven largely by immigration (Jones-Correa, 2008). In Maryland in 2000,
___________________
3 The full commissioned paper is titled Characteristics of the Workforce Who Are Educating and Supporting Children Who Are English Language Learners (Arias and Markos, 2016).
for example, the population of Montgomery County’s public schools represented 163 countries and spoke 123 different languages, and 31 percent of their households did not speak English at home. There were 12,000 ELs who took special courses in English for speakers of other languages. In 2003, the county’s public schools for the first time had a majority minority student population—45 percent white, 22 percent African American, 19 percent Latino, and 14 percent Asian American (Jones-Correa, 2008). In Virginia, Fairfax County’s schools saw similar increases in racial/ethnic diversity, and in 2003 had a student population representing more than 120 different languages spoken at home (Jones-Correa, 2008). Politics, federal and state mandates, court cases, budget constraints, professional interests, and bureaucratic considerations all influenced policy making and the changes the districts had to implement to meet the needs of their changing student population.
SOCIOECONOMIC CHARACTERISTICS AND STATUS OF ENGLISH LEARNERS
Family Income and Poverty
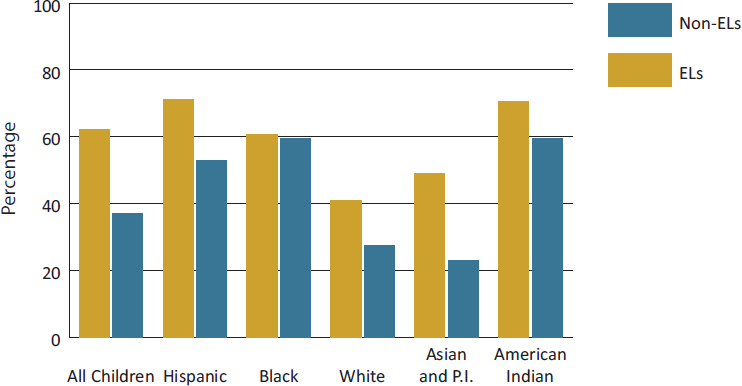
As noted earlier, children in immigrant families are more likely than their counterparts with U.S.-born parents to grow up in economically disadvantaged circumstances (Borjas, 2011; Capps, 2015; Fry, 2007). Research on exposure to poverty during early childhood suggests that it can have negative consequences for the development of children and their educational outcomes. Table 3-3 shows the distribution of ELs and non-ELs by quintiles of family income. Several striking patterns are obvious in these distributions. On average, ELs are more likely to live in families in the lowest-income quintiles, while non-ELs are concentrated in the highest-income families. These patterns indicate that ELs are more likely than non-ELs to grow up in socioeconomic contexts that have negative consequences for child development.
Despite their collective disadvantage, the economic circumstances of ELs vary considerably by race/ethnicity. Hispanic ELs, for example, are most likely to live in the poorest families, followed closely by American Indian and black ELs/indigenous heritage language learners. White and Asian ELs live in relatively more favorable economic circumstances. The exception to the general statement that ELs are more likely than their non-EL counterparts to live in families with the lowest incomes is blacks, among whom the percentages of ELs and non-ELs in the poorest families are roughly the same.
A related perspective on the economic circumstances of ELs and non-ELs comes from analysis of the distribution of children in families that are
| Family Income Quintile | |||||
|---|---|---|---|---|---|
| Quintile 1 | Quintile 2 | Quintile 3 | Quintile 4 | Quintile 5 | |
| ELs | |||||
| All | 34.6 | 27.4 | 16.8 | 11.6 | 9.7 |
| Hispanic | 40.2 | 30.5 | 16.0 | 8.3 | 5.0 |
| Black | 36.3 | 26.7 | 16.0 | 11.8 | 9.2 |
| White | 21.3 | 20.3 | 19.1 | 19.4 | 20.0 |
| Asian and Pacific Islander | 25.7 | 20.2 | 15.6 | 14.7 | 23.8 |
| American Indian | 37.7 | 31.4 | 14.1 | 9.8 | 7.0 |
| Non-ELs | |||||
| All | 19.3 | 19.6 | 20.2 | 20.4 | 20.5 |
| Hispanic | 28.3 | 26.7 | 19.8 | 14.5 | 10.8 |
| Black | 37.8 | 23.8 | 15.9 | 11.4 | 11.1 |
| White | 13.3 | 17.1 | 21.3 | 23.9 | 24.4 |
| Asian and Pacific Islander | 10.4 | 12.7 | 15.0 | 21.2 | 40.8 |
| American Indian | 33.9 | 26.0 | 18.1 | 12.4 | 9.6 |
NOTES: The range of family incomes found in each quintile is as follows: Quintile 1: $0 to $26,919; Quintile 2: $26,200 to $52,000; Quintile 3: $52,201 to $81,659; Quintile 4 $81,660 to $128,425; and Quintile 5: $128,426 and above. Sample = children ages 5-18. ELs are defined based on responses to the American Community Survey question of how well individuals who speak a language other than English at home speak English. ELs thus are defined as children who speak English less than “very well.”
SOURCE: Data are from the American Community Survey, 2008-2012.
at or under 185 percent of the federal poverty line (see Figure 3-5). Fully 65 percent of all ELs meet the threshold for free or reduced-price school lunches, compared with 36 percent of non-ELs. Hispanic and American Indian ELs/indigenous heritage language learners are most likely to qualify for free or reduced-price lunches and white ELs the least likely. Once again, the general economic disadvantage of ELs remains robust across race except for blacks, among whom equal proportions of ELs and non-ELs live in families at or below 185 percent of the federal poverty line.
Most explanations for the economic risks experienced in childhood focus on the effects of parental characteristics on children’s welfare. Parental educational attainment, for example, is considered to be a leading determi-
NOTE: Sample = children ages 5-18. ELs = English learners; P.I. = Pacific Islander.
SOURCE: Data are from the American Community Survey, 2008-2012.
nant of child poverty (Wood, 2003). Yet among immigrants, the range of parental influences is more diverse. Research indicates that the economic welfare of immigrant children also is positively associated with parental levels of English proficiency (Thomas, 2011a); in part, this relationship stems from the positive implications of English proficiency for wages (Chiswick and Miller, 2010; Dávila and Mora, 2004).
The distributions of the highest parental levels of education presented in Table 3-4 reveal some of the critical inequalities in parental human capital found among ELs and non-ELs. ELs are more likely to have parents with low levels of schooling. About 38 percent live in families where the highest level of parental schooling is less than a complete high school education, compared with 8.1 percent among non-ELs. Inequalities in parental educational attainment are observed within race and are most profound among Hispanic children. Almost half of all Hispanic ELs (49.8%) have parents who did not graduate from high school, compared with 26 percent among Hispanic non-ELs.
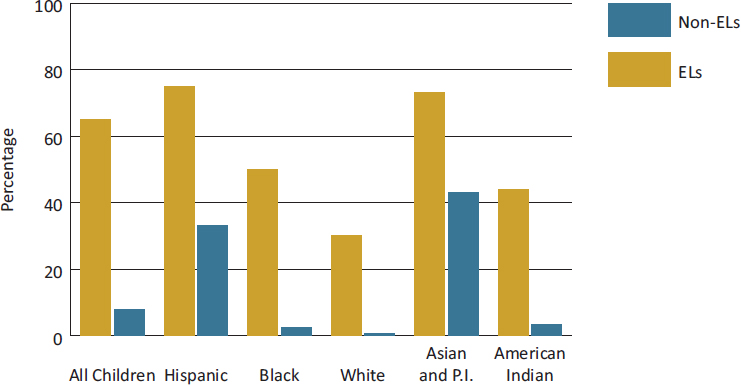
Figure 3-6 presents comparisons of English language proficiency among the parents of ELs and non-ELs. It focuses on children without a parent who speaks English at least “very well,” who account for more than half of all ELs. In contrast, the percentage of non-ELs with parents who do not speak English very well is relatively low (7.9%). The parents of Hispanic
| Below Complete High School | High School Graduate | Some College | Bachelor’s or More | |
|---|---|---|---|---|
| ELs | ||||
| All | 38.4 | 21.8 | 19.1 | 20.8 |
| Hispanic | 49.8 | 24.2 | 16.5 | 9.6 |
| Black | 21.7 | 21.1 | 32.6 | 24.7 |
| White | 18.2 | 18.5 | 25.8 | 37.5 |
| Asian and Pacific Islander | 23.6 | 17.7 | 12.7 | 46.1 |
| American Indian | 11.9 | 35.0 | 43.4 | 9.7 |
| Non-ELs | ||||
| All | 8.1 | 18.2 | 33.2 | 40.5 |
| Hispanic | 26.5 | 23.8 | 30.4 | 19.4 |
| Black | 11.1 | 25.2 | 41.3 | 22.4 |
| White | 2.9 | 16.0 | 33.2 | 47.9 |
| Asian and Pacific Islander | 8.9 | 11.4 | 12.3 | 67.5 |
| American Indian | 10.1 | 27.0 | 45.1 | 17.8 |
NOTE: Sample = children ages 5-18. ELs are defined as children who speak English less than “very well.”
SOURCE: Data are from the American Community Survey, 2008-2012.
and Asian non-ELs are exceptions to this pattern: approximately one-third of non-ELs in both groups have parents with low levels of English proficiency. Hispanic and Asian non-ELs thus experience a notable mismatch between their own English-speaking skills and those of their parents. In such cases, non-EL children typically act as language brokers who help their parents interact with community and educational institutions.
Families, Household Contexts, and Language Use
Families are the first setting within which the socialization of children occurs. Among immigrants, they further perform cultural functions and exert social and economic influences that can either facilitate or constrain children’s integration (Alba and Holdaway, 2013; Glick, 2010). Table 3-5
NOTE: Sample = children ages 5-18. ELs = English learners; P.I. = Pacific Islander.
SOURCE: Data are from the American Community Survey, 2008-2012.
compares the family structures of ELs and non-ELs. The table shows that, regardless of EL status, all children are on average less likely to live in single-parent than in two-parent households. For the most part, these patterns hold across race, except for blacks. Among blacks, ELs are less likely than non-ELs to live in single-parent households. This difference appears to reflect the lower prevalence of single-parent households among black immigrants relative to U.S.-born blacks (Brandon, 2002). Table 3-5 also shows that ELs are slightly more likely than non-ELs to live in households with no resident parent—probably a reflection of unaccompanied minors originating from Central America and Asia. As the table indicates, moreover, the percentage of Hispanic and Asian ELs living in households with no resident parent is much higher than the respective percentages among their non-EL peers.
Demographic research on the ways in which families shape the language development of their children focuses on two perspectives. The first examines the association between having immigrant parents in ethnically endogamous marriages, or marriages among couples of the same ethnicity, and level of English proficiency. Studies indicate that children in such immigrant families have lower levels of English proficiency relative to other children of immigrants (Alba et al., 2002; Ishizawa, 2004). The second perspective examines variations in the languages used at home by immigrant children (Capps, 2015; Capps et al., 2005). As expected, recent data
TABLE 3-5 Family Structures of ELs and Non-ELs, by Race/Ethnicity
| Single-Parent Household | Two-Parent Household | No Resident Parent | |
|---|---|---|---|
| ELs | |||
| All | 25.57 | 65.92 | 8.51 |
| Hispanic | 30.01 | 61.14 | 8.85 |
| Black | 37.91 | 49.63 | 12.46 |
| White | 14.34 | 81.39 | 4.27 |
| Asian and Pacific Islander | 14.31 | 71.94 | 13.75 |
| American Indian | 37.00 | 48.44 | 14.56 |
| Non-ELs | |||
| All | 27.15 | 66.52 | 6.33 |
| Hispanic | 32.52 | 60.59 | 6.89 |
| Black | 53.27 | 32.52 | 14.21 |
| White | 21.04 | 73.36 | 5.60 |
| Asian and Pacific Islander | 12.49 | 81.34 | 6.17 |
| American Indian | 40.67 | 45.13 | 14.20 |
NOTE: Sample = children ages 5-18. ELs are defined as children who speak English less than “very well.”
SOURCE: Data are from the American Community Survey, 2008-2012.
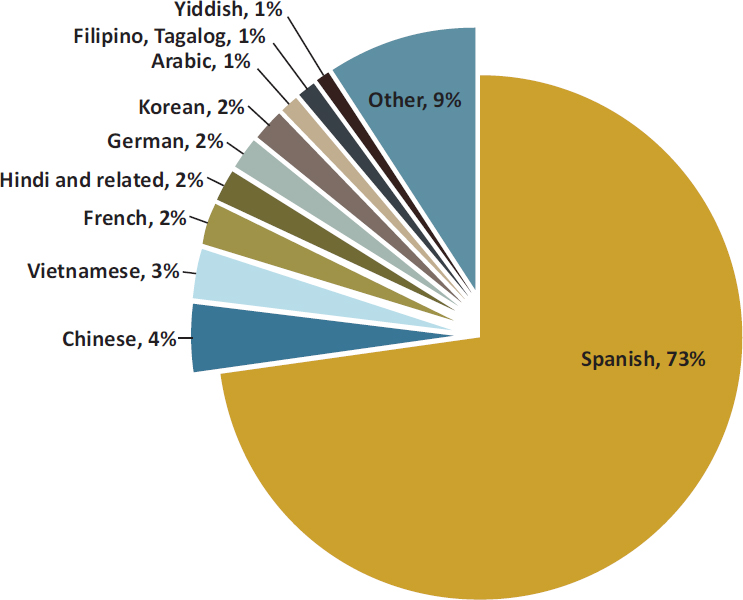
from the 2008-2012 ACS indicate that this variation is higher among ELs than among non-ELs. While all ELs speak a language other than English at home, only 16 percent of non-ELs do so. The diversity of languages spoken at home by ELs is captured in Figure 3-7. Spanish is by far the most common of these languages (73%), followed by Chinese4 (4%) and Vietnamese (3%).
Homeless ELs
A final perspective on children’s living arrangements comes from examination of ELs who are homeless. According to the National Center for Homeless Education (2015), approximately 190,785 ELs were homeless in the United States in 2013-2014—a 9.1 percent increase over the number
___________________
4 The term “Chinese” encompasses a number of languages, such as Mandarin, Cantonese, and others.
SOURCE: Migration Policy Institute analysis of the American Community Survey, 2008-2012, presented by Capps (2015).
in 2012-2013. In both periods, ELs represented the largest subgroup of homeless children who were enrolled in U.S. schools. Homeless children have lower levels of academic achievement than their nonhomeless peers (Cutuli et al., 2013; Rafferty, 1998) and are exposed to a number of risk factors that can negatively affect their development. Homeless ELs also may face other challenges, such as living as unaccompanied minors or living with various types of disabilities (National Center for Homeless Education, 2015), that can compound these risk factors.
In terms of geographic distribution, homeless ELs are most likely to be found in Western and Southwestern states such as Arizona, California, New Mexico, and Texas that have high concentrations of ELs. In these states, 10 percent or more of all homeless students enrolled in pre-K to grade 12 are ELs (National Center for Homeless Education, 2015). Comparatively lower percentages of ELs are found among homeless children in Midwestern
states such as Ohio and in the Southeast (Georgia, South Carolina, Mississippi, and Tennessee). In these states, ELs account for less than 4 percent of the total number of homeless students in pre-K to grade 12.
Transnational Youth
Scholars use the concept of transnationalism to describe immigrants’ long-term maintenance of cross-border ties to their communities of origin. Although critics have argued that the overall proportion of such immigrants is low and that as a result, transnationalism has little sustained effect on the process of immigrant adaptation, social networks often connect immigrants to their communities of origin and remain important in cross-border communication with friends and family members left behind (Mouw et al., 2014).
Children of parents who are members of tight-knit transnational communities or who participate in transnational organizations that keep them firmly connected to their ancestral homelands are more likely than children of nontransnational parents to sustain ties with relatives, peers, and community events and remain active in their communities of origin, as well as to maintain proficiency in their home language. Children may attend part of their school years in their country of origin and part in the United States, or spend time in U.S. schools and return to their country of origin to continue their education. Children in their country of origin with family members in the United States also may see migration, rather than education, as a route to a better socioeconomic future. As a result, they may not view schooling in their home country as worthwhile and may underachieve educationally while in their home country and separated from their family members (Gindling and Poggio, 2012). These children may later migrate to the United States to join their family members and be behind their classmates in academic skills.
Adjustment to migration is a complex process that differs for immigrant children with different characteristics. Because language acquisition becomes more challenging as children grow older, learning English is more difficult for children who migrate when they are older (Chiswick and Miller, 2008). Similarly, children who are younger when they reunite with families from which they have been separated are generally more respectful of authority and may adapt to a new school, new culture, and new educational system more readily relative to teenagers, who may have a more difficult time with integration into the academic and social life at U.S. schools (Gindling and Poggio, 2012).
Using data from the New Immigrant Survey, Gindling and Poggio (2012) found that children separated from their parents as a result of migration, compared with children who migrated with their parents or were
born in the United States, were much more likely to be significantly older than other children in their grade who entered school at the appropriate age and moved on to the next grade each year. The impact of separation was also greater for children who migrated at older ages or were separated from their parents during their teenage years. The impact of separation from the mother was greater than that of separation from the father. The authors also found that dropout rates were higher for youth who were separated from their families during migration than for those who migrated with their parents, and their results suggested that the higher dropout rates of Latino immigrant children as compared with non-Latino immigrant children were due largely to the impact of family separation during migration.
Gindling and Poggio (2012) conducted a teacher survey whose results indicated that children separated from their parents during migration may have less success relative to those who do not experience such separation because they are assigned to a grade below their age level when they arrive in the United States, possibly as a result of their lack of English skills. Capps (2015 [analysis of 2008-2012 ACS]) reports that ELs ages 15-18 were less likely to be enrolled in school relative to other U.S. children of that age.
Parents’ and children’s social status as transnational migrants creates unique dynamics in families and may be reflected in difficult adjustments to U.S. schools. While some of these children may have exposure to English language instruction prior to coming to the United States, many arrive in U.S. classrooms as ELs. For many of the parents of these children, the hardships of family separation often are compounded by other challenges associated with their migration, making it difficult for them to participate in school activities with their children.
Undocumented ELs
Another dimension of recent immigration trends is the increasing salience of undocumented immigrant status. The size of the undocumented immigrant population increased from 8.6 million in 2000 to 11.5 million in 2011, leveling off at an estimated 11.2 million in 2014 (Passel and Cohn, 2016; Pew Hispanic Center, 2014; Zong and Batalova, 2016). Undocumented status affects not only immigrants’ access to better-paying jobs and social services, but also the educational outcomes of their children (Bean et al., 2011, 2015; Suarez-Orozco and Yoshikawa, 2013; Yoshikawa and Kalil, 2011). Recent estimates suggest that more than half of all ELs have an undocumented immigrant parent (Capps, 2015).
Growing up in the United States without authorized immigration status or with parents who are unauthorized immigrants can be stressful for children and adolescents. According to a report from the Pew Hispanic Center (Passel, 2006), in 2005, children accounted for 1.8 million (16%) of the
approximately 11.1 million undocumented immigrants living in the United States. Capps and Fortuny (2006) estimate that more than three-quarters of children of immigrants living in the United States are U.S. citizens, and over half live in mixed-status families, with some children being U.S.-born and others being unauthorized. These authors do not break out the percentage of these children whose home language is other than English, but it is safe to say that many of them are ELs. In mixed-status families, one or more siblings who are not U.S. citizens may face deportation, while those who were born in the United States may remain. Resources available to children who are U.S. citizens, such as financial aid for college, are unavailable to undocumented siblings (Pérez, 2014).
In addition, through social relations, deportability can be transferred to “legal” residents and citizens. For example, there are many children of undocumented immigrants who are U.S. citizens but because of their parents’ unauthorized status may be viewed as “illegal” (Boehm, 2009). Even if they are recognized as citizens, the fate they face if their undocumented parents or guardians are deported has known negative outcomes. Moreover, the children of undocumented immigrants often are forced to grow up without their parents being involved in their school lives because of fears of deportation, a circumstance that has been tied to poor academic outcomes (Abrego, 2014; Dreby, 2015a).
These issues are important for future immigration policies as schools seek ways to incorporate the large population of undocumented immigrant children and children of undocumented parents. Although undocumented immigrants tend to be concentrated in those states with the highest numbers of immigrants, they can be found in most U.S. states, and they represent many different countries of origin (Passel and Cohn, 2011). Spanish-speaking countries, such as El Salvador, Guatemala, Honduras, and Mexico, are the countries of origin of the largest percentages of unauthorized immigrants. The Urban Institute (2011) estimated that in 2008-2009, 3.5 million U.S. citizen children had noncitizen Mexican parents. Passel and Cohn (2014) found that although Mexicans represent a majority of unauthorized immigrants in the United States (52% in 2012), both their numbers and their share have declined in recent years. But as the number of unauthorized Mexicans declined, the numbers of unauthorized immigrants from South America, European countries, and Canada held steady (Passel and Cohn, 2014), and unauthorized immigrants from Asia, the Caribbean, Central America, and other countries grew slightly. The Philippines also is the top country of origin for unauthorized immigrants in Alaska and Hawaii. Also among the largest contributors of unauthorized immigrants in the United States are India, China, and Korea (Passel and Cohn, 2014).
One of the major challenges for U.S. schools relative to ELs is determining the strengths of these youth in their home languages and English.
Undocumented ELs or ELs with undocumented family members may be reluctant to identify as immigrant children because of their status or the status of their family members. In a report for the Immigration Policy Institute, Gonzales (2007) documents the plight of these students, who are seldom able to go to college, cannot work legally in the United States without DACA5 status, in some states cannot obtain a driver’s license or attend public universities, and cannot put their education to good use. Many get discouraged and drop out before completing high school, while others are honor roll students, class officers, and valedictorians and aspire to give back to their communities by becoming teachers, doctors, lawyers, and social activists.
These youth express fears about family separation and have various legal misunderstandings (Dreby, 2013). Many have experienced significant tensions at the local level in communities that have seen an increase in the number of unauthorized students in their schools and non-English-speaking undocumented residents in their midst (Zúñiga and Hamann, 2009; Zúñiga and Hernández-Leon, 2005). Abrego (2014) reports that the persistently negative representation of undocumented immigrants as “criminals” affects how immigrant children understand and experience “illegality” in their day-to-day lives. She found that the undocumented immigrants she interviewed feared deportation; had a general sense of insecurity; and often felt that they could not depend on police, emergency services, or authority figures to protect them.
Many undocumented students have joined other undocumented youth and made claims as students in school settings and beyond through such organizations as the DREAM Act Movement (Nicholls, 2013). A number of these students have formed a national organization, United We Dream, that has developed a “toolkit” for students, parents, teachers, and other school personnel to help them enable undocumented youth to be successful in their educational pursuits (United We Dream, 2015).
Immigration policy plays an important role for these youth in shaping their incorporation patterns and trajectories into adulthood. Undocumented youth share a confusing and contradictory status in terms of their legal rights and the opportunities available to them. Families and children may adopt subordinate statuses and deferential behaviors, such as acting quietly, drawing little attention to themselves, or feeling isolated, and they are often fearful of seeking help from teachers or others because of their
___________________
5 Deferred Action for Childhood Arrivals (DACA) was enacted in 2010 to prevent the deportation of those who meet certain criteria, such as age at arrival, possession of a high school diploma, and time in the United States. Meeting these criteria allows undocumented residents to obtain a 2-year work permit, Social Security number, and driver’s license.
undocumented status and their fear of deportation (Abrego, 2006, 2008, 2014; Gonzales, 2007).
Undocumented status also affects children of other national origin groups, such as Pacific Islanders who are not from countries with a compact of free association with the United States.6 Immigrants from Kiribati, Papua New Guinea, Samoa, Tokelau, Tonga, and others must apply for legal permanent resident status to work and live in the United States legally. Between 2002 and 2012, U.S. courts deported more than 2,700 persons to the Pacific Islands, mainly to Fiji, Micronesia, Tonga, and Western Samoa (Empowering Pacific Islander Communities and Asian Americans Advancing Justice, 2014).
Unaccompanied Minors
In recent years, most unaccompanied minors (defined as children under age 18 who do not have a parent or legal guardian and are detained because of their lack of lawful immigration status in the United States) have originated from three Central American countries—El Salvador, Guatemala, and Honduras—with others coming from Mexico (Kandel and Seghetti, 2015) (see Box 3-1).
The U.S. Department of Homeland Security (2016) reports an overall increase in the apprehension of unaccompanied children from Central America at the Southwest border, specifically in the Rio Grande Valley of Texas. The U.S. Office of Refugee Resettlement arranges for these children to be cared for initially through a network of state-licensed care providers that are required to provide classroom education, medical services, and case management while they attempt to reunite the child with a family member. Family unit apprehensions also are high, totaling 68,445 in 2014 and 39,838 in 2015 along the U.S. Southwest border.
The term “immigrant bargain” (Smith, 2005) has been used to describe immigrant families’ hopes that their children’s academic success will be a form of repayment for parental sacrifice. Oral histories of migration experiences and decisions are passed down to children as a way of instilling educational values and responsibility toward the family (Stanton-Salazar, 2001). Parental sacrifice is at times paid back in the form of succeeding educationally and making parents proud, or contributing to the household financially by seeking employment (Katz, 2014). Some parents choose to
___________________
6 Countries with a compact of free association have an agreement with the United States to allow a military presence in their country in exchange for allowing residents to live and work in the United States as “nonimmigrants” but without citizenship, although they may serve in the U.S. military. They include the Federated States of Micronesia, the Marshall Islands, and Palau.
send their children to the United States even if unable to accompany them because they believe their children will have better educational opportunities or opportunities to learn English in the United States. Upper-middle-class families from such countries as Hong Kong, and Taiwan sometimes send middle and high school-age students to study abroad living with their mothers while fathers remain in the home country. Other families may send children to the United States to live with extended family or family contacts while both parents remain in the home country (Waters, 2002, 2003).
Divided families and parenting across borders have been well documented (Arias, 2013; Dreby, 2010, 2012, 2015a; Orellana et al., 2001). Unless parents can maintain regular contact with their children, younger children may become emotionally withdrawn, and adolescents may become quite independent or act out aggressively (Dreby, 2015b), which can negatively impact their ability to thrive in an academic setting.
Once families unite, and during the reunification process, children and youth may miss caretakers and friends left behind and may feel like strangers when they join their biological family after long separation (Foner, 2014). While both parents and children have reported difficulties resulting from separation and in the years following reunification, most families demonstrate strength, determination, resourcefulness, and resilience in dealing with the challenges presented by migration (Suárez-Orozco et al., 2011).
Refugees
Newcomers with refugee or asylum status are unable or unwilling to return to their country of origin because of persecution, and they may have left close or extended family members behind. In 2013, 34 percent of refugees admitted to the United States were under age 18 (Martin and Yankay,
2014). The leading states receiving these refugees were Texas (10.7%), California (9.1%, and Michigan (6.7%) (Martin and Yankay, 2014). As a result of these relocations, as well as migrations, children in these families often experience separations and reunifications of different members of the family over time.
Family contexts have critical implications for the functioning of children and youth. Disruptions in family systems are likely to have implications for their well-being, including psychological repercussions for those who have been separated from parents who have emigrated to the United States and those who arrive in the United States without their parents (Suárez-Orozco and Suárez-Orozco, 2001; Suárez-Orozco et al., 2011). These experiences may contribute to the difficulties faced by some of these children and youth in school (Gindling and Poggio, 2012.
The U.S. Department of Homeland Security reported that 69,909 refugees were admitted to the United States during 2013, the majority coming from Iraq (28%), Burma (23%), Bhutan (13%), and Somalia (11%) (Martin and Yankay, 2014). In that year, China, Egypt, and Ethiopia were the leading countries of origin of those granted either affirmative or defensive asylum in the United States. The leading countries of nationality of “follow-to-join” refugees, consisting of spouses and children under 21, were China, Haiti, and Ethiopia (Martin and Yankay, 2014).
U.S. military involvement in Southeast Asia and the end of the Vietnam War in the early 1970s led to waves of Vietnamese, Laotian, and Cambodian refugees. The U.S. government set up centers, such as that in the military base at Camp Pendleton in Southern California, to help these refugees learn English and adjust to the United States. The refugees were initially dispersed to several parts of the country as part of the refugee resettlement process. These families were often sponsored by churches or civic organizations. Many later resettled in major Asian settlement areas, such as the Los Angeles, California, metropolitan area, and Houston and Dallas in Texas (Frey, 2015).
The Vietnamese are a bifurcated group: a significant portion are poorly educated and have not graduated from high school, and another significant portion are highly educated and have attained at least a college degree. The positive educational selectivity of the elite and middle-class emigrants who fled Vietnam before the fall of Saigon enabled them to transfer skills and mindsets to the new U.S. contexts of resettlement (Lee and Zhou, 2015). Immigration among these groups has increased in recent decades, associated with family reunification in the United States, and many of these newcomer children are ELs. Lee and Zhou (2015) note that between 1990 and 2010, the Vietnamese population in the United States nearly tripled, to 1.74 million, and this figure likely underestimates the numbers of Vietnamese im-
migrants because others came as part of the larger refugee exodus from Southeast Asia.
Another group of refugees, Cubans, arrived initially in the post-Castro period, fleeing a political regime that was ideologically at war with the United States. They were warmly received as political refugees, assisted in relocation, and given monthly allowances and other government assistance (Rodriguez, 2008). The early Cuban refugees were predominantly skilled, upper-class, white, and entrepreneurial and were more likely to speak English than the later waves of Cuban refugees, referred to as the Marielitos’ migration, who were less privileged (Borjas, 2015). Some families who remained in Cuba sent their children to the United States on what were known as “Peter Pan flights,” hoping to join them later.
Although the U.S. government attempted to relocate Cuban refugees to various parts of the United States, many reestablished their ethnic communities in Miami and Los Angeles. Some of the first federally funded bilingual education programs, such as the transitional bilingual program at Coral Way Elementary School, were established in Miami as the U.S. government tried to facilitate the refugees’ integration. There were sufficient numbers of elite, well-educated Cubans among the refugees to staff the bilingual programs as teachers and administrators. Approximately half a million Cubans have become legal permanent residents in the United States since 1981, and Cuba consistently ranks among the top 10 source countries for legal permanent residents. Since the beginning of the normalization process between Cuba and the United States in 2014, Cuban migration has increased. A “wet foot/dry foot” practice toward Cuban migrants has evolved, according to which those who do not reach dry land in the United States are returned to Cuba unless they cite fears of persecution. Those who reach the U.S. shore successfully are generally permitted to remain and become legal permanent residents within 1 year. They also are eligible to receive government benefits (Wasem, 2009).
ENGLISH PROFICIENCY ACROSS IMMIGRANT GENERATIONS
A significant percentage of ELs are born in the United States or are U.S.-born children of immigrants. Studies on language assimilation among immigrants have found that with succeeding generations, their use of mother-tongue languages decreases as their levels of English proficiency increase (Ishizawa, 2004; Thomas, 2010). The proportion of children who are ELs can be expected to decrease accordingly.
Table 3-6 presents the distribution of children who speak English less than very well by race/ethnicity and generation, based on ACS data. In general, the distributions conform to this expectation. In each immigrant generation, however, the highest prevalence of ELs is found among non-
| Hispanic | Black | White | Asian and Pacific Islander | |
|---|---|---|---|---|
| First Generation | 32.67 | 19.19 | 15.25 | 35.21 |
| Second Generation | 19.33 | 3.83 | 4.50 | 15.57 |
| Third Generation | 5.18 | 0.50 | 0.85 | 3.54 |
NOTES: Sample = children ages 5-18. English learners (ELs) are defined based on responses to the American Community Survey question of how well individuals who speak a language other than English at home speak English. ELs thus are defined as children who speak English less than “very well.”
SOURCE: Data are from the American Community Survey, 2008-2012.
white children, highlighting the dual challenge of navigating both low levels of English proficiency and racial/ethnic minority status. First-generation children, especially those who are Hispanic or Asian, are the most likely to have poor English-speaking skills. By the second generation, the percentage of children who speak English less than very well declines, reflecting the expected gains in English proficiency among the U.S.-born or second-generation children of immigrants. Yet this decline is inconsistent across ethnic categories. Approximately 20 percent of second-generation Hispanic children and 16 percent of second-generation Asian children speak English less than very well, compared with less than 5 percent of U.S.-born blacks and non-Hispanic whites. By the third and higher generations, many of the group differences in English proficiency disappear; even within the third generation, however, at least 5 percent of Hispanic children still speak English less than very well—the highest percentage across ethnic categories.
In general, these estimates reflect the patterns of English proficiency found among immigrant groups in previous studies. According to Brown and Patten (2014), for example, approximately 11.5 percent of the Hispanic U.S.-born population reported that English was spoken less than very well in the home, compared with 29.8 percent of the foreign-born Hispanic population. The majority of both U.S.-born and foreign-born Hispanics reported that English was spoken very well or only English was spoken at home. Among the more recent foreign-born Hispanic immigrants, those who arrived in 2006 or later, 48 percent reported that English was spoken less than very well at home. Asians reported a slightly higher percentage of those who spoke English less than very well.
However, data from the 2010 U.S. census show that Asian children generally are proficient in English, with 37 percent of those ages 5-17 speaking English at home and only 16 percent speaking English less than very well
(Frey, 2015). Data from the 2010 census and the 2006-2010 ACS reveal that among Asians ages 5 and older, 46 percent of Chinese, 46 percent of Koreans, and 53 percent of Vietnamese did not speak English very well. Fewer Asian Indians (22%), Filipinos (22%), and Japanese (24%) did not speak English very well (Frey, 2015).
A study of Mexican-born immigrants in Los Angeles yields a membership-exclusion perspective on the integration of immigrants (Bean et al., 2015). The authors emphasize the importance of societal membership for integration and the impact of the extent to which unauthorized status leads to conditions that limit schooling gains for children of immigrants, including those born in the United States. These researchers identify three major components of integration—economic, spatial, and linguistic. They argue that linguistic integration is important because learning English in the United States is a prerequisite for other kinds of incorporation. They argue, however, that in looking at linguistic integration, it is important to consider both language acquisition and preservation of the heritage language. Their study revealed that among later generations of the Mexican immigrant population in Los Angeles, a preference for the English language only was almost universal (99% of the 3.5 generation). In their sample, among the second generation whose parents were both Mexican-born, members of the extended family on both sides were likely to speak Spanish, but the percentage speaking Spanish well declined dramatically in the third generation. This finding is similar to the experiences of white European immigrants, among whom there is scarcely any survival of mother tongue preference by the third generation. First- and second-generation immigrants from Mexico are on average more likely than immigrants from other countries to have low levels of English proficiency upon arrival in the United States because they are less likely to have been exposed to English in school or at work.
According to Bean and colleagues (2015), a major factor in membership exclusion for immigrants of Mexican origin and succeeding generations is legal status. They argue that “unauthorized status, reinforced by immigration and immigrant policies of the United States over the past forty years, hinders the integration of Mexican Americans” (p. 6). They found that youth whose parents had legal status were able to take greater advantage of new opportunities. For third-generation males, they found that, despite long-term residence in the United States, there was an education lag, with few Mexican Americans in their sample reaching beyond high school and with minimal educational gains from the second to the third generation, although incomes increased slightly. The authors propose that the unauthorized status of parents created conditions that affected educational attainment among their children, even those children who had U.S. citizenship. Parents’ lack of legal status, low levels of education, long working hours, and limited English proficiency limited their own ability to
deal with their children’s schooling issues. The authors also argue that the poverty associated with unauthorized migration contributes to social isolation, strong family norms about working versus the high costs of pursuing postsecondary education, living in poor neighborhoods, female-headed households, unemployment, and low-quality schools, all factors that influence the educational attainment of second and third generations.
CONCLUSIONS
Conclusion 3-1: The cultures, languages, and experiences of English learners are highly diverse and constitute assets for their development, as well as for the nation.
Conclusion 3-2: Many English learners grow up in contexts that expose them to a number of risk factors (e.g., low levels of parental education, low family income, refugee status, homelessness) that can have a negative impact on their school success, especially when these disadvantages are concentrated.
Conclusion 3-3: As the population of English learners continues to diversify, limitations of current data sources compromise the capacity to provide a more comprehensive description of the population’s characteristics for policy makers, administrators, and teachers who have responsibilities for their education.
BIBLIOGRAPHY
Abrego, L.J. (2006). “I can’t go to college because I don’t have papers”: Incorporation patterns of Latino undocumented youth. Latino Studies, 4(3), 212-231.
Abrego, L.J. (2008). Legitimacy, social identity, and the mobilization of law: The effects of Assembly Bill 540 on undocumented students in California. Law & Social Inquiry, 33(3), 709-734.
Abrego, L.J. (2014). Latino immigrants’ diverse experiences of “illegality.” In C. Menjívar and D. Kanstroom (Eds.), Constructing Immigrant “Illegality”: Critiques, Experiences, and Responses (pp. 139-161). New York: Cambridge University Press.
Alba, R., and Holdaway, J. (2013). The Children of Immigrants at School: A Comparative Look at Integration in the United States and Western Europe. New York: NYU Press.
Alba, R., Logan, J., Lutz, A., and Stults, B. (2002). Only English by the third generation? Loss and preservation of the mother tongue among the grandchildren of contemporary immigrants. Demography, 39(3), 467-484.
Anderson, M. (2015). A Rising Share of the U.S. Black Population Is Foreign Born; 9 Percent Are Immigrants; and While Most Are from the Caribbean, Africans Drive Recent Growth. Washington, DC: Pew Research Center. Available: http://www.pewsocialtrends.org/2015/04/09/a-rising-share-of-the-us-black-populationis-foreign-born [January 5, 2017].
Arias, P. (2013). International migration and familial change in communities of origin: Transformation and resistance. Annual Review of Sociology, 39, 429-450.
Arias, M.B., and Markos, A.M. (2016). Characteristics of the Workforce Who Are Educating and Supporting Children Who Are English Language Learners. Unpublished manuscript commissioned by the Committee on Fostering School Success for English Learners: Toward New Directions in Policy, Practice, and Research, Washington, DC.
Ayón, C. (2015). Economic, Social, and Health Effects of Discrimination on Latino Immigrant Families. Washington, DC: Migration Policy Institute.
Batalova, J., and Fix, M. (2011). Up for Grabs: The Gains and Prospects of First- and Second-Generation Young Adults. Washington, DC: Migration Policy Institute.
Bean, F.D., Leach, M.A., Brown, S.K., Bachmeier, J.D., and Hipp, J.R. (2011). The educational legacy of unauthorized migration: Comparisons across U.S.-immigrant groups in how parents’ status affects their offspring. International Migration Review, 45(2), 348-385.
Bean, F.D., Brown, S.K., and Bachmeier, J.D. (2015). Parents without Papers: The Progress and Pitfalls of Mexican American Integration. New York: Russell Sage Foundation.
Boehm, D.A. (2009). “¿Quien Sabe?”: Deportation and temporality among transnational Mexicans. Urban Anthropology and Studies of Cultural Systems and World Economic Development, 38(2/3/4), 345-374.
Borjas, G.J. (2011). Poverty and program participation among immigrant children. The Future of Children, 21(1), 247-266.
Borjas, G.J. (2015). The Wage Impact of the Marielitos: A Reappraisal. (NBER Working Paper No. 21588). Cambridge, MA: National Bureau of Economic Research
Brandon, P.D. (2002). The living arrangements of children in immigrant families in the United States. International Migration Review, 36(2), 416-436.
Brown, A., and Patten, E. (2014). Statistical Portrait of Hispanics in the United States, 2012. Washington, DC: Pew Research Center’s Hispanic Trends Project. Available: http://www.pewhispanic.org/2014/04/29/statistical-portrait-of-hispanics-in-the-unitedstates-2012 [November 6, 2016].
Capps, R. (2015). Trends in Immigration and Migration of English and Dual Language Learners. Presentation to the National Research Council Committee on Fostering School Success for English Learners, Washington, DC, May 28. Available: http://www.nationalacademies.org/hmd/~/media/Files/Activity%20Files/Children/DualLanguageLearners/2015-MAY-28/1Capps%20Randy.pdf [November 18, 2016].
Capps, R., and Fortuny, K. (2006). Immigration and Child and Family Policy. Washington, DC: Urban Institute.
Capps, R., Fix, M.E., Ost, J., Reardon-Anderson, J., and Passel, J.S. (2005). The Health and Well-Being of Young Children of Immigrants. Washington, DC: Urban Institute.
Capps, R., McCabe, K., and Fix, M. (2011). New Streams: Black African Migration to the United States. Washington, DC: Migration Policy Institute.
Carnock, J.T., and Ege, E. (2015). The Triple Segregation of Latinos, ELLs: What Can We Do? Available: https://www.newamerica.org/education-policy/edcentral/latinos-segregation [January 5, 2017].
Castro, D.C., Peisner-Feinberg, E., Buysse, V., and Gillanders, C. (2010). Language and literacy development of Latino dual language learners: Promising instructional practices. In O. Saracho and B. Spodek (Eds.), Contemporary Perspectives on Language and Cultural Diversity in Early Childhood Education (pp. 65-93). Scottsdale, AZ: Information Age.
Chiswick, B.R., and Miller, P.W. (2008). A test of the critical period hypothesis for language learning. Journal of Multilingual and Multicultural Development, 29(1), 16-29.
Chiswick, B.R., and Miller, P.W. (2010). Occupational language requirements and the value of English in the U.S. labor market. Journal of Population Economics, 23(1), 353-372.
Cleave, P.L., Girolametto, L.E., Chen, X., and Johnson, C.J. (2010). Narrative abilities in monolingual and dual language learning children with specific language impairment. Journal of Communication Disorders, 43(6), 511-522.
Connor, P., Cohn, D., and Gonzalez-Barrera, A. (2013). Changing Patterns of Global Migration and Remittances. Washington, DC: Pew Research Center.
Crosnoe, R., and López-Turley, R.N. (2011). K-12 educational outcomes of immigrant youth. The Future of Children, 21(1), 129-152.
Cutuli, J.J., Desjardins, C.D., Herbers, J.E., Long, J.D., Heistad, D., Chan, C.-K., Hinz, E., and Masten, A.S. (2013). Academic achievement trajectories of homeless and highly mobile students: Resilience in the context of chronic and acute risk. Child Development, 84(3), 841-857. https://doi.org/10.1111/cdev.12013.
Dávila, A., and Mora, M.T. (2004). English-language skills and the earnings of self-employed immigrants in the United States: A note. Industrial Relations: A Journal of Economy and Society, 43(2), 386-391.
De Bot, K., and Kroll, J.F. (2002). Psycholinguistics. In N. Schmitt (Ed.), Introduction to Applied Linguistics. London, UK: Arnold.
Dreby, J. (2010). Divided by Borders: Mexican Migrants and Their Children. Berkeley: University of California Press.
Dreby, J. (2012). The burden of deportation on children in Mexican immigrant families. Journal of Marriage and Family, 74(4), 829-845.
Dreby, J. (2015a). Everyday Illegal: When Policies Undermine Immigrant Families. Berkeley: University of California Press.
Dreby, J. (2015b). U.S. immigration policy and family separation: The consequences for children’s well-being. Social Science & Medicine, 132, 245-251.
Ellis, M., Wright, R., and Townley, M. (2014). The Great Recession and the allure of new immigrant destinations in the United States. International Migration Review, 48(1), 3-33.
Empowering Pacific Islander Communities and Asian Americans Advancing Justice. (2014). A Community of Contrasts: Native Hawaiians and Pacific Islanders in the United States, 2014. Available: http://empoweredpi.org/wp-content/uploads/2014/06/A_Community_of_Contrasts_NHPI_US_2014-1.pdf [May 2017].
Enchautegui, M.E. (2014). Immigrant Youth Outcomes: Patterns by Generation and Race and Ethnicity. Washington, DC: Urban Institute.
Espinosa, L.M. (2013). Early Education for Dual Language Learners: Promoting School Readiness and Early School Success. Washington, DC: National Center on Immigrant Integration Policy, Migration Policy Institute.
Farrington, A.L., Lonigan, C.J., Phillips, B.M., Farver, J.M., and McDowell, K.D. (2015). Evaluation of the utility of the revised Get Ready to Read! for Spanish-Speaking English-language learners through differential item functioning analysis. Assessment for Effective Intervention, 40(4), 216-227.
Fix, M., and Passel, J.S. (2003). U.S. Immigration: Trends and Implications for Schools. Washington, DC: Urban Institute.
Foner, N. (2014). Intergenerational relations in immigrant families. In M. Halter, M. Johnson, K. Viens, C. Wright, Z.D. Barany, and P.D. Stachura (Eds.), What’s New About the “New” Immigration?: Traditions and Transformations in the United States since 1965 (pp. 113-130). New York: Palgrave Macmillan.
Frey, W.H. (2015). Diversity Explosion: How New Racial Demographics Are Remaking America. Washington, DC: Brookings Institution Press.
Fry, R. (2007). How Far Behind in Math and Reading Are English Language Learners? Washington, DC: Pew Hispanic Center.
García, E.E., Jensen, B.T., and Scribner, K.P. (2009). The demographic imperative. Educational Leadership, 66(7), 8-13.
Gindling, T.H., and Poggio, S.Z. (2012). Family separation and reunification as a factor in the educational success of immigrant children. Journal of Ethnic and Migration Studies, 38(7), 1155-1173.
Glick, J.E. (2010). Connecting complex processes: A decade of research on immigrant families. Journal of Marriage and Family, 72(3), 498-515.
Gold, S.J. (2007). Russia. In M.C. Waters, R. Ueda, and H.B. Marrow (Eds.), The New Americans: A Guide to Immigration since 1965. Cambridge, MA: Harvard University Press.
Gonzales, R.G. (2007). Wasted talent and broken dreams: The lost potential of undocumented students. Immigration Policy in Focus, 5(13), 1-11.
González-Barrera, A., and Lopez, M.H. (2013). Spanish Is the Most Spoken Non-English Language in U.S. Homes, Even among Non-Hispanics. Washington, DC: Pew Research Center.
González-Barrera, A., Lopez, H.L. and Rohal, M. (2015). More Mexicans Leaving Than Coming to the U.S. Washington, DC: Pew Research Center.
Griffith, D. (2008). New Midwesterners, New Southerners: Immigration Experiences in Four Rural American Settings. In D.S. Massey (Ed.), New Faces in New Places: The Changing Geography of American Immigration (pp. 179-210). New York: Russell Sage Foundation.
Guendelman, S., Schauffler, H.H., and Pearl, M. (2001). Unfriendly shores: How immigrant children fare in the U.S. health system. Health Affairs, 20(1), 257-266.
Hammer, C.S., Jia, G., and Uchikoshi, Y. (2011). Language and literacy development of dual language learners growing up in the United States: A call for research. Child Development Perspectives, 5(1), 4-9.
Hernandez, D.J. (2012). Young children in black immigrant families from Africa and the Caribbean. In R. Capps and M. Fix (Eds.), Young Children of Black Immigrants in America: Changing Flows, Changing Faces (pp. 75-117). Washington, DC: Migration Policy Institute.
Hixson, L., Hepler, B.B., and Kim, M.O. (2012). The Native Hawaiian and Other Pacific Islander Population: 2010. Washington, DC: U.S. Census Bureau.
Immigration Policy Center. (2007). Dreams Deferred: The Costs of Ignoring Undocumented Students. Washington, DC: Immigration Policy Center.
Ishizawa, H. (2004). Minority language use among grandchildren in multigenerational households. Sociological Perspectives, 47(4), 465-483.
Ispa-Landa, S. (2007). Europe: Central and Southeastern. In M.C. Waters, R. Ueda, and H.B. Marrow (Eds.), The New Americans: A Guide to Immigration since 1965 (pp. 433-444). Cambridge, MA: Harvard University Press.
Jensen, E.B., Knapp, A., Borsella, C., and Nestor, K. (2015). The Place of Birth Composition of Immigrants to the United States: 2000 to 2013. Washington, DC: U.S. Census Bureau.
Jones-Correa, M. (2008). Race to the top? The politics of immigrant education in suburbia. In R. Massey (Ed.), New Faces in New Places: The Changing Geography of American Immigration (pp. 308-340). New York: Russell Sage Foundation.
Kandel, W. A. and Seghetti, L. (2015) Unaccompanied Alien Children: An Overview. U.S. Congressional Research Service Report R43599. Available: http://www.refworld.org/docid/55eebcfd4.html [November 7, 2016].
Katz, V.S. (2014). Kids in the Middle: How Children of Immigrants Negotiate Community Interactions for Their Families. New Brunswick, NJ: Rutgers University Press.
Krogstad, J.M., and Keegan, M. (2015). From Germany to Mexico: How America’s Source of Immigrants Has Changed over a Century. Washington, DC: Pew Research Center.
Landale, N.S., Thomas, K.J., and Van Hook, J. (2011). The living arrangements of children of immigrants. The Future of Children, 21(1), 43-70.
Lavadenz, M. (2008). Visibly hidden: Language, culture, and identity of Central Americans in Los Angeles. Association of Mexican American Educators Journal, 2(1), 16-26.
Lee, J., and Zhou, M. (2015). The Asian American Achievement Paradox. New York: Russell Sage Foundation.
Levitt, P., and Waters, M.C. (2002). The Changing Face of Home: The Transnational Lives of the Second Generation. New York: Russell Sage Foundation.
Martin, D.C., and Yankay, J.E. (2014). Refugees and Asylees: 2013. Washington, DC: Office of Immigration Statistics.
Martin, P.L., and Midgley, E. (2006). Immigration: Shaping and reshaping America. Population Bulletin, 61(4).
Massey, D.S. (1999). Why does immigration occur?: A theoretical synthesis. In C. Hirschman, P. Kasinitz, and J. DeWind (Eds.), The Handbook of Immigration Migration (pp. 34-52). New York: Russell Sage Foundation.
Massey, D.S. (2008). New Faces in New Places: The Changing Geography of American Immigration. New York: Russell Sage Foundation.
Migration Information Source. (2009). Country Data on Immigration. Available: http://www.migrationpolicy.org [May 2017].
Migration Policy Institute. (2014). Select Diaspora Populations in the United States: The Mexican Diaspora. Washington, DC: Migration Policy Institute.
Mitchell, C. (2015). White House, Ed. Dept. Partner to Address Needs of Black English-Language Learners. Available: http://blogs.edweek.org/edweek/learning-the-language/2015/10/number_of_black_english-langua.html [June 21, 2016].
Mouw, T., Chavez, S., Edelblute, H., and Verdery, A. (2014). Binational social networks and assimilation: A test of the importance of transnationalism. Social Problems, 61(3), 329-359.
National Center for Homeless Education (2015). Federal Data Summary School Years 2011-12 to 2013-14: Educating Homeless Children. Available: http://center.serve.org/nche/downloads/data-comp-1112-1314.pdf [January 5, 2017].
National Academies of Sciences, Engineering, and Medicine. (2015). The Integration of Immigrants into American Society. Washington, DC: The National Academies Press. doi:https://doi.org/10.17226/21746.
Nesteruk, O. (2010). Heritage language maintenance and loss among the children of Eastern European immigrants in the United States. Journal of Multilingual and Multicultural Development, 31(3), 271-286.
Nesteruk, O., and Marks, L.D. (2011). Parenting in immigration: Experiences of mothers and fathers from Eastern Europe raising children in the United States. Journal of Comparative Family Studies, 42(6), 809-825.
Nicholls, W. (2013). The Dreamers: How the Undocumented Youth Movement Transformed the Immigrant Rights Debate. Palo Alto, CA: Stanford University Press.
Niehaus, K., and Adelson, J.L. (2013). Self-concept and native language background: A study of measurement invariance and cross-group comparisons in third grade. Journal of Educational Psychology, 105(1), 226.
Norris, T., Vines, P.L., and Hoeffel, E.M. (2012). The American Indian and Alaska Native Population: 2010. Washington, DC: U.S. Department of Commerce, Economics and Statistics Administration, U.S. Census Bureau.
O’Hare, W.P., Mayol-Garcia, Y., Wildsmith E., and Torres, A. 2016. The Invisible Ones: How Latino Children Are Left Out of Our Nation’s Census Count. Bethesda, MD: Child Trends Hispanic Institute and the National Association of Latino Elected and Appointed Officials Education Fund.
Orellana, M.F., Thorne, B., Chee, A., and Lam, W.S.E. (2001). Transnational childhoods: The participation of children in processes of family migration. Social Problems, 48(4), 572-591.
Passel, J.S. (2006). Size and Characteristics of the Unauthorized Migrant Population in the U.S. Washington, DC: Pew Hispanic Center.
Passel, J.S., and Cohn, D. (2011). Unauthorized Immigrant Population: National and State Trends, 2010. Washington, DC: Pew Hispanic Center.
Passel, J.S., and Cohn, D. (2014). Unauthorized Immigrant Totals Rise in 7 States, Fall in 14: Decline in Those from Mexico Fuels Most State Decreases. Washington, DC: Pew Research Center Hispanic Trends.
Passel, J.S., and Cohn, D. (2016). Unauthorized Immigrant Population Stable for a Half a Decade. Washington, DC: Pew Research Center.
Pérez, Z.J. (2014). Removing Barriers to Higher Education for Undocumented Students. Washington, DC: Center for American Progress. Available: https://cdn.americanprogress.org/wp-content/uploads/2014/12/UndocHigherEd-report2.pdf [March 21, 2017].
Pew Hispanic Center. (2014). Unauthorized Immigrant Population Trends for States, Birth Countries and Regions. Available: http://www.pewhispanic.org/2014/12/11/unauthorized-trends [June 21, 2016].
Pew Research Center. (2012). The Rise of Asian Americans. Washington, DC: Pew Research Center Social & Demographic Trends. Available: http://www.pewsocialtrends.org/files/2012/06/SDT-Rise-of-Asian-Americans.pdf [June 20, 2016].
Rafferty, Y. (1998). Meeting the educational needs of homeless children. Educational Leadership, 55(4), 48-53.
Rodriguez, C.E. (2008). Latinas/os in the United States: Changing the Face of America. Berlin, Germany: Springer Science & Business Media.
Ruiz Soto, A.G., Hooker, S., and Batalova, J. (2015). Top Languages Spoken by English Language Learners Nationally and by State. Washington, DC: Migration Policy Institute.
Rumbaut, R.G. (1994). Origins and destinies: Immigration to the United States since World War II. Sociological Forum, 9(4), 583-621.
Rumbaut, R. (2004). Ages, life stages, and generations cohorts: Decomposing the immigrant first and second generations in the United States. International Migration Review, 38(3), 1160-1205.
Rumbaut, R.G., and Massey, D.S. (2013). Immigration & language diversity in the United States. Daedalus, 142(3), 141-154.
Saint Paul Public Schools Office of Accountability. (2015). Asian Students in Saint Paul Public Schools. Presentation for Committee of the Board. Saint Paul: Saint Paul Public Schools.
Siebens, J., and Julian, T. (2011). Native North American Languages spoken at home in the United States and Puerto Rico: 2006–2010. American Community Services Briefs, 10(10).
Singer, A. (2004). The Rise of New Immigrant Gateways. Washington, DC: Brookings Institution Press.
Singer, A. (2015). Metropolitan Immigrant Gateways Revisited, 2014. Washington, DC: Brookings Institution Press.
Smith, R. (2005). Mexican New York: Transnational Lives of New Immigrants. Oakland: University of California Press.
Stanton-Salazar, R.D. (2001). Manufacturing Hope and Despair: The School and Kin Support Networks of U.S.-Mexican Youth. New York: Teachers College Press.
Suárez-Orozco, C., and Suárez-Orozco, M.M. (2001). Children of Immigration. Cambridge, MA: Harvard University Press.
Suárez-Orozco, C., Gaytán, F.X., Bang, H.J., Pakes, J., O’Connor, E., and Rhodes, J. (2010). Academic trajectories of newcomer immigrant youth. Developmental Psychology, 46(3), 602.
Suárez-Orozco, C., Bang, H.J., and Kim, H.Y. (2011). I felt like my heart was staying behind: Psychological implications of family separations and reunifications for immigrant youth. Journal of Adolescent Research, 26(2), 222-257.
Suárez-Orozco, C., and Yoshikawa, H. (2013). Undocumented status: Implications for child development, policy, and ethical research. In M.G. Hernandez, J. Nguyen, C.L. Saetermoe, and C. Suárez-Orozco (Eds.), Frameworks and Ethics for Research with Immigrants: New Directions in Child and Adolescent Development (pp. 61-78). San Francisco, CA: Jossey-Bass.
Thomas, K.J. (2010). Household context, generational status, and English proficiency among the children of African immigrants in the United States. International Migration Review, 44(1), 142-172.
Thomas, K.J. (2011a). Familial influences on poverty among young children in black immigrant, U.S.-born black, and nonblack immigrant families. Demography, 48(2), 437-460.
Thomas, K.J. (2011b). Socio-demographic determinants of language transition among the children of French- and Spanish-Caribbean immigrants in the U.S. Journal of Ethnic and Migration Studies, 37(4), 543-559.
Thomas, K.J. (2011c). What explains the increasing trend in African emigration to the U.S.? International Migration Review, 45(1), 3-28.
Thomas, K.J. (2012). A Demographic Profile of Black Caribbean Immigrants in the United States. Washington, DC: Migration Policy Institute.
United We Dream. (2015). Toolbox. Available: http://unitedwedream.org/toolbox [November 6, 2016].
Urban Institute. (2011). The Urban Institute Children of Immigrants Data Tool. Available: http://datatool.urban.org/charts/datatool/pages.cfm [November 18, 2016].
Uro, G., and Barrio, A. (2013). English Language Learners in America’s Great City Schools: Demographics, Achievement, and Staffing. Washington, DC: Council of the Great City Schools.
U.S. Census Bureau. (2015). 2011-2015 American Community Survey 5-Year Estimates. Available: https://factfinder.census.gov/faces/tableservices/jsf/pages/productview.xhtml?src=CF [March 15, 2017].
U.S. Department of Education. (2016). Tools and Resources for Identifying All English Learners. Available: https://www2.ed.gov/about/offices/list/oela/english-learner-toolkit/chap1.pdf [January 5, 2017].
U.S. Department of Homeland Security. (2016). Southwest Border Unaccompanied Alien Children Statistics FY 2015. Available: https://www.cbp.gov/newsroom/stats/southwest-border-unaccompanied-children/fy-2015 [June 21, 2016].
Wasem, R.E. (2009). Cuban Migration to the United States: Policy and Trends. U.S. Congressional Research Service Report 7-5700. Available: www.crs.gov R40566 [February 2017].
Waters, J.L. (2002). Flexible families: “Astronaut” households and the experiences of lone mothers in Vancouver, British Columbia. Social and Cultural Geography, 3(2), 117-134.
Waters, J.L. (2003). Satellite kids in Vancouver. In M. Charney, B. HYeoh, and T.C. Kiong (Eds.), Asian Migrants and Education (pp. 165-184). Dordrecht, the Netherlands: Kluwer.
Winsler, A., Burchinal, M.R., Tien, H.-C., Peisner-Feinberg, E., Espinosa, L., Castro, D.C., LaForett, D.R., Kim, Y.K., and De Feyter, J. (2014). Early development among dual language learners: The roles of language use at home, maternal immigration, country of origin, and socio-demographic variables. Early Childhood Research Quarterly, 29(4), 750-764.
Wood, D. (2003). Effect of child and family poverty on child health in the United States. Pediatrics, 112(Suppl. 3), 707-711.
Yoshikawa, H., and Kalil, A. (2011). The effects of parental undocumented status on the developmental contexts of young children in immigrant families. Child Development Perspectives, 5(4), 291-297.
Zong, J., and Batalova, J. (2016). Frequently Requested Statistics on Immigrants and Immigration in the United States. Washington, DC: Migration Policy Institute. Available: http://www.migrationpolicy.org/article/frequently-requested-statistics-immigrants-and-immigration-united-states [November 6, 2016].
Zúñiga, V. (2013). Migrantes internacionales en las escuelas Mexicanas: Desafíos actuales y futuros de política educativa. Sinéctica, 40, 1-12.
Zúñiga, V., and Hamann, E.T. (2009). Sojourners in Mexico with U.S. school experience: A new taxonomy for transnational students. Comparative Education Review, 53(3), 329-353.
Zúñiga, V., and Hernández-Leon, R. (2005). New Destinations: Mexican Immigration in the United States. New York: Russell Sage Foundation.
This page intentionally left blank.


