
Antarctic Sea Ice Variability in the Southern Ocean-Climate System: Proceedings of a Workshop
OVERVIEW
The sea ice surrounding Antarctica has increased in extent and concentration from the late 1970s, when satellite-based measurements began, until 2015.1 Although this increasing trend is modest, it is surprising given the overall warming of the global climate and the region. Indeed, climate models, which incorporate our best understanding of the processes affecting the region, generally simulate a decrease in sea ice. Moreover, sea ice in the Arctic has exhibited pronounced declines over the same period, consistent with global climate model simulations. For these reasons, the behavior of Antarctic sea ice has presented a conundrum for global climate change science.
The National Academies of Sciences, Engineering, and Medicine held a workshop on January 11-12, 2016, in Boulder, Colorado, to bring together scientists with different sets of expertise and perspectives to further explore potential mechanisms driving the evolution of recent Antarctic sea ice variability2 and to discuss ways to advance understanding of Antarctic sea ice and its relationship to the broader ocean-climate system.
The significant distinctions between the Southern and Arctic Oceans, which are different dynamic systems, was a common theme of the workshop discussions. In particular, the Southern Ocean surface is relatively insensitive to recent human-caused greenhouse gas (GHG) forcing, so surface waters have experienced less warming than has been observed in other areas. However, changes in the deep ocean can have an outsized effect on the Southern Ocean because it is a region of significant upwelling. Therefore, it is expected that as the global deep water continues to warm, it will continue to melt Antarctic ice for many decades, even if carbon dioxide (CO2) levels are reduced.
There are many local, regional, and global processes that influence sea ice growth and melt, but it is not clear what mechanisms best explain the observed variability and the slight increase in overall Antarctic sea ice extent. Some participants highlighted how negative feedbacks between the ocean and sea ice keep Antarctic sea ice thin. Other studies suggest that there may be a modest decrease in Antarctic sea ice extent from anthropogenic warming, but that the trend is overwhelmed by a recent increase associated with high internal variability, resulting in the recent slight expansion of Antarctic sea ice extent. Other factors that may play a role include tropical Pacific and Atlantic teleconnections, variability in the winds and ocean currents that
___________________
1 Note that Antarctic sea ice extent has experienced significant decreases since the workshop was held in January 2016. See http://nsidc.org/data/seaice_index.
2 In the context of this workshop, sea ice variability primarily refers to variability in sea ice extent, but it also includes variability in sea ice concentration, area, velocity, thickness, and snow cover.
circumnavigate Antarctica, and changes in surface conditions resulting from stratospheric ozone depletion.
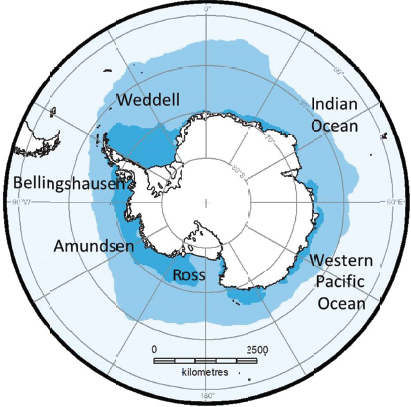
Many workshop discussions emphasized the distinct regional variability of Antarctic sea ice patterns. For example, most of the increase in total sea ice extent has actually occurred in the western Ross Sea. The drivers of the larger increases in this region are not well understood, and the observed trend is outside the range of forced response and internal variability. Some participants said that variability in tropical sea surface temperature (SST) may be leading to changes in winds that have in turn caused cooling in the Ross Sea. This is a key region for improved observations and process studies to better understand the relationship between polynyas, ice production topography, and ice shelf melt processes. In contrast, the sea ice cover and duration in the Bellingshausen Sea are decreasing. Some studies indicate that changes in the Amundsen Sea Low (ASL) and increases in ocean heat content are driving this decrease.
Understanding the mechanisms and processes driving sea ice variability and trends is limited by the lack of a long, homogenous record of sea ice extent and concentration. Furthermore, observations of the surrounding ocean are geographically sparse and short. According to several participants, more effort should go into extending the observational record using proxies, historical records, and data assimilation. At this time, the data that have been captured to extend the historical record indicate a larger sea ice extent prior to the satellite period. However, questions were raised as to whether there is enough confidence in the diverse set of proxies to make such a definitive statement. In addition, some participants highlighted the need for more validation of the passive microwave observations of sea ice concentrations taken from space-based platforms. Reanalysis data also remain problematic and it is not clear which reanalysis is best suited for Antarctic studies.
Some participants said that there is little confidence in the models that are used for attribution of Antarctic sea ice variability. For example, many of the models have a poor representation of the mean state of the Southern Ocean, which is important to reproduce observed trends in Antarctic sea ice. Furthermore, model biases (e.g., stratification/mixed layer depth) impact how the models respond to forcing, but there is uncertainty on how large an impact the biases have. Despite these shortcomings, said many participants, models are useful for understanding processes that may be affecting sea ice.
Many participants said that process-based understanding is critical for improving understanding of the mechanisms of Antarctic sea ice variability. Process studies also provide validation of global coupled models. However, higher-resolution atmosphere and ocean models may be necessary to more fully understand some important processes, especially for resolving eddies, mixed layer depth, polynyas/ice formation, and katabatic winds/cyclogenesis. Another barrier to process-based understanding is the dearth of observations in the Southern Ocean (e.g., under the sea ice), particularly those that are necessary to make heat and freshwater budget calculations. Such calculations require estimates of sea ice thickness; estimates of precipitation over the Southern Ocean; exchange of water between the ocean and under-ice-shelf cavities; and hydrographic measurements of temperature, salinity, and isotopes.
Models that project climate conditions decades and longer into the future indicate that the Antarctic sea ice will eventually respond to global warming and decline. Observations from late
2016 and early 20173 indeed show decreases in Antarctic sea ice extent. Nevertheless, many participants said a better understanding of the mechanisms is critical to making confident statements about the future of Antarctic sea ice.
INTRODUCTION
Sea ice in the oceans surrounding Antarctica has been more extensive on average in the few years prior to the workshop (2012-2014) than at any other time in the satellite-observed record. There is not a consensus on the causes of Antarctic sea ice trends or regional variability, and observed patterns are not well represented in Earth system models. Given the importance of sea ice in the Earth system (see Box 1) and gaps in understanding of its past variability and likely future fate in the Southern Hemisphere, the Polar Research Board and the Ocean Studies Board of the National Academies of Sciences, Engineering, and Medicine organized a workshop to evaluate recent sea ice variability and change in the Southern Ocean surrounding Antarctica (the full statement of task can be found in Appendix A). Specific purposes of the workshop included
- Examining the observational and modeled record of recent (last 50 years) Antarctic sea ice variability,
- Evaluating evidence for key hypotheses about the processes controlling recent Antarctic sea ice variability and change, and
- Highlighting knowledge gaps and important areas for new research that could clarify the mechanisms of past sea ice variability and help constrain projections of future Antarctic sea ice variability.
The workshop was planned and moderated by a seven-member ad hoc committee appointed by the National Academies (the committee member biographical sketches are in Appendix F) and was held on January 11-12, 2016, in Boulder, Colorado. The event brought together domestic and international experts in remotely sensed and in situ sea ice observations, as well as scientists who study sea ice dynamics, oceanography, climatology, and sea ice and climate modeling (see Appendix D for a list of participants).
The committee organized the workshop roughly around the project’s statement of task (see Appendix A), with sessions on observations of Antarctic sea ice and the surrounding ocean and atmosphere, model projections of Antarctic sea ice variability, and the attribution of recent sea ice variability and change to various processes in the coupled ocean-atmosphere-ice system. An introductory session included longer, summary talks that provided an overview and a critical entrée into each of these three broad topics. Participants also broke into smaller groups to analyze the session topics in more detail. The agenda for the workshop can be found in Appendix D.
The organization of this proceedings also roughly follows the statement of task and presents topics thematically rather than following the chronology of the workshop. The first section provides an overview of the observational record Antarctic sea ice variability, including
___________________
observed differences in the regions and seasons (see Figure 1). This is followed by a section on the use of models to better understand the drivers of Antarctic sea ice. The next section provides more detail on a range of proposed processes and mechanisms that control observed sea ice variability and change. The final section summarizes individual workshop participants’ views on future needs and opportunities associated with observing, modeling, and understanding Antarctic sea ice variability.
This Proceedings of a Workshop was prepared by workshop rapporteurs as a factual summary of the workshop presentations and discussions. The planning committee’s role was limited to planning and convening the workshop. The views contained in this proceedings are those of individual workshop participants and do not necessarily represent the views of all workshop participants, the planning committee, or the National Academies of Sciences, Engineering, and Medicine. Thus, this Proceedings of a Workshop is not intended to provide an exhaustive overview of the rapidly progressing field of research on Antarctic sea ice, but rather to provide a current and concise window into critical issues by summarizing the discussions of leading U.S. and international scientists.
OBSERVATIONAL RECORD OF ANTARCTIC SEA ICE VARIABILITY
Background
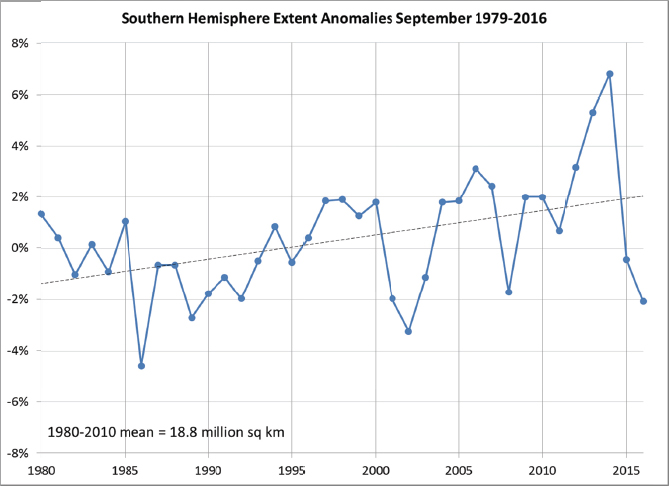
The Antarctic experienced modest increases in maximum and minimum sea ice extent and sea ice concentration since late 1978, when routine satellite measurements started, until 2014 (Comiso et al., 2011; Meier et al., 2013; Parkinson and Cavalieri, 2012; Turner et al., 2015; Zwally et al., 2002). The record maximum extents have all occurred in recent years, with 2012-2014 progressively setting records for September monthly sea ice extent (Massonnet et al., 2015; Parkinson, 2014; Reid et al., 2015; Turner et al., 2013a). The sea ice returned to near-average extent in 2015 (Fetterer et al., 2016) and was below average in 2016 (Fetterer et al., 2016; see Figure 2).
The overall increase in Antarctic sea ice extent stands in contrast to conditions in the Arctic, where sea ice has exhibited pronounced declines (the average monthly sea ice index has been declining at a rate of –2.7% per decade for March, the month in which sea ice reaches its maximum extent in the Northern Hemisphere), and a series of recent record minimum extents (Parkinson and Comiso, 2013). The direction of the Arctic trend is consistent with global climate
model simulations, and shrinking Arctic sea ice is frequently cited as a prominent indicator of greenhouse gas–induced global warming (Stroeve et al., 2012).
The observed Antarctic sea ice record is often presented as surprising and as a conundrum for global climate change science (e.g., Massonnet et al., 2015; Turner et al., 2015). Antarctic sea ice formation and persistence are sensitive to air and sea surface temperatures, and considering that Antarctic air temperatures and Southern Ocean SSTs have increased slightly since 1950 (Armour and Bitz, 2015; Turner et al., 2015), the trends in Antarctic sea ice are not necessarily intuitive (e.g., Turner et al., 2015). However, SST trends have not been as strong in the Southern Ocean when compared to other parts of the Earth (Armour et al., 2016; Turner et al., 2015), and sea ice extent and thickness are variably influenced by other thermodynamic and dynamic factors such as transport by surface winds (Holland and Kwok, 2012; Maksym et al., 2012), snowfall and rain rates above the ice surface (Massom et al., 2001), and water temperatures and salinity beneath the sea surface (Martinson and Iannuzzi, 1998).
The Satellite Record
Observations of sea ice extent, concentration, and area derived from passive microwave radiometers constitute the longest-running and most geographically extensive of sea ice records, and these observations are almost universally drawn upon for studies of sea ice variability and change in both hemispheres, according to Dr. Julienne Stroeve, National Snow and Ice Data Center, and Dr. Claire Parkinson, NASA Goddard Space Flight Center. Routine satellite observation of continental-scale sea ice variability began in the late 1970s with the launch of satellites carrying passive microwave radiometers. Data from such radiometers can be used to estimate the amount of ice coverage in a given area, which is usually expressed in terms of sea ice extent, area, or concentration.
Dr. Rob Massom, Australian Antarctic Division, outlined key uncertainties in the satellite observational record. He noted that the accuracy and precision of passive-microwave-derived sea ice concentration and extent retrievals are affected by a combination of data, algorithm, and physical (environmental) factors. While mismatches in calibration, resolution, and scanning geometry between satellite sensors can lead to spurious retrievals, retrieval uncertainties can be minimized by careful reprocessing (Comiso and Nishio, 2008; Meier et al., 2011). Indeed, Dr. Massom said that previous reports that the significance of the observed trend from the passive microwave record may be compromised by limitations in retrieval algorithm accuracy and precision (c.f., Eisenmann et al., 2014; Meier et al., 2011) are no longer valid, as the issues were rectified prior to Intergovernmental Panel on Climate Change Assessment Report 5 (IPCC, 2013).
According to Drs. Parkinson, Stroeve, and Massom, although there is still important work to be done improving the algorithms that transform raw sensor radiative data into time series of sea ice extent, area, and concentration, the magnitude of variability and the overall trends in sea ice remain very similar regardless of the algorithm used (e.g., IPCC, 2013; Parkinson and Comiso, 2008). Absolute differences in retrievals from the different major algorithms (e.g., NASA Team and Bootstrap) are caused by differences in the choice and utilization of channels, tie-points used, sensitivities to changes in surface physical temperature and emissivity, and use or otherwise of weather filters (Comiso et al., 1997, 2003). As a general rule of thumb, said Dr. Massom, overall accuracies in ice concentration retrieval ranging from ±5% to ±15% are expected. Errors are largest in summer, over regions of predominantly thin/new ice, and year round in the marginal ice zone (MIZ) (up to ±30%) (Brucker et al., 2014; Comiso et al., 2011). Further calibration and validation work is needed to address these uncertainties and to quantify satellite algorithm and data accuracy/bias and precision as a function of region and season (Brucker et al., 2014).
The highly dynamic Antarctic sea ice edge region/MIZ is a particular challenge to observe with passive microwave sensors due to the predominance of new/thin ice and ice surface wetness (caused by wave-ice interaction) and strong weather effects, said Dr. Massom. Sea ice concentration retrieval errors increase within the MIZ due in large part to the overlapping microwave emissivities of wet/thin sea ice and open ocean. There is also a melt-season bias: passive microwave observations of ice edge location are typically in reasonable agreement with in situ observations during the austral cold season (March-October), but not in the melt season (November-February). At this time, a 1-1.5 degree latitudinal discrepancy has been noted, with the satellite-derived ice edge being south of the actual edge (Worby and Comiso, 2004). Dr. Massom also noted that “ice edge” is a somewhat ambiguous term, given that the outer sea ice zone
around Antarctica is typically indistinct and characterized by diffuse low-concentration bands (depending on wind direction). For this reason, sea ice edge location is typically defined by the outer 15% ice-concentration isoline.
Dr. Massom outlined work that has been done to use satellite data from before the modern multifrequency passive microwave era (i.e., before late 1978) to extend the observational record back in time. Cavalieri et al. (2003) reprocessed sea ice extents from the single-channel Nimbus4 5 Electrically Scanning Microwave Rediometer (ESMR) (1973-1976). Including these data changes the trend in overall net Antarctic sea ice extent to negative, as there is evidence that sea ice extent was larger in 1973-1975. However, there is unknown bias in the ESMR data, so they are not often used in the calculation of trends (IPCC, 2013).
Data mining efforts have been ongoing to derive snapshots of Antarctic sea ice extent from early Nimbus satellite visible and infrared imagery from the 1960s. Results from these efforts indicate
- Higher overall extents in the late 1960s (Sissala et al., 1972; Streten, 1973; Zwally et al., 1983) compared to the post-1979 record;
- A September 1964 sea ice extent (Meier et al., 2013) that was higher than any annual maximum in the passive microwave time series of 1979-2013, including records in daily maxima in 2012 and 2013, respectively (Reid et al., 2015); and
- Antarctic monthly sea ice extents in May-July 1966 that were similar to those from the same time of year in the 1980s (Gallaher et al., 2014).
According to Dr. Massom, these early data may be unreliable due to uneven sampling, large uncertainties, and unknown biases. Navigation and cloud-ice discrimination errors may introduce a bias compared to passive microwave estimates, so it is difficult to quantify and compare these early data to the data from microwave sensors. This is also affected by the difference in spatial resolution of the two sea ice extent products. However, said Dr. Massom, such data mining exercises are key to placing the post-1979 record into longer-term context. Considerable decadal variability in observed sea ice extent trends in the satellite passive microwave record to date underline the crucial need to extend the time series (e.g., Simpkins et al., 2013).
While there is a tendency to focus on overall sea ice extent and concentration, these are incomplete descriptors of the sea ice “state,” according to Dr. Massom. In addition, there is a crucial need for additional information on sea ice thickness and volume (IPCC, 2013). Lower sea ice extent does not necessarily equate to thinner sea or lower ice volume. For example, divers measured sea ice thicknesses of 20 m in the Bellingshausen Sea in October 2001 that resulted from extreme ice compaction against the Antarctic Peninsula driven by strong and persistent northwesterly winds (Massom et al., 2006). However, this coincided with a period of anomalously low regional ice extent. This example underlines the importance of improved information on sea ice motion and dynamics as they affect sea ice extent and thickness, and it also speaks to the importance of extreme atmospheric events in driving regional changes in sea ice extent and
___________________
thickness. Also crucial is improved information on precipitation rates and snow thickness as they affect sea ice formation and melt (Leonard and Maksym, 2011; Maksym and Markus, 2008).
Coastal landfast sea ice (fast ice) forms a narrow yet important interface between ice sheet and ocean/pack ice and is also a sensitive indicator of change and variability in wind and ocean wave fields. To date, fast ice has been mapped at 2 km resolution around the East Antarctic coast only using MODIS visible/infrared imagery. This time series (from 2000 to 2008) shows an upturn in coastal fast ice overall, particularly after 2004 (Fraser et al., 2012), but with strong regionality. Fast ice extent in the western Pacific Ocean sector shows significant interannual variability, while that in the southeastern Indian Ocean sector showed an upturn in 2004, largely due to increase in summer persistence. Dr. Massom acknowledged the shortness of this time series and noted that extending the record in time and to circumpolar is in progress.
Dr. Nathan Kurtz, NASA Goddard Space Flight Center, discussed the contribution of Antarctic sea ice thickness observations to understanding of sea ice volume change. Comparisons of 2003-2008 sea ice thickness observations from ICESat (a laser altimeter; Kurtz and Markus, 2012) and 1981-2005 ship-based observations (Worby et al., 2008) show no significant differences. This suggests that there have not been significant changes in the ice thickness over the two time periods, according to Dr. Kurtz.
Dr. Kurtz said radar altimetry (ERS-1, ERS-2, Envisat, CryoSat-25) offers the longest time series (since 1991), but a number of challenges need to be addressed to get accurate retrievals of sea ice thickness. One challenge is that over Antarctic sea ice, the radar does not penetrate to the snow/ice interface but to somewhere between the air/snow and snow/ice interfaces (Giles et al., 2008). Another challenge is that only small changes have been observed in Antarctic sea ice thickness and volume, so longer time series and/or more accurate retrievals are needed in order to determine statistically significant trends, according to Dr. Kurtz.
Dr. Kurtz identified several major sources of uncertainty from altimeters:
- Laser: open water identification, clouds/forward scattering, zero freeboard assumption, snow depth/density, and sea ice density.
- Radar: waveform tracking, absorption/penetration, backscatter from snow and ice layers, off-nadir returns from smooth surfaces, and snow depth on sea ice.
Radar altimetry should be combined with other sources of data (e.g., sea ice thickness measurements from ships) to improve the sea ice thickness record, to quantify spatiotemporal variability of snow and sea ice density, and to validate the satellite data, said Dr. Kutz. Examples of datasets that could be combined with satellite date include in situ measurements, undersea sonar, autonomous underwater vehicles, electromagnetic (EM) bird (airborne electromagnetic instruments), and the passive microwave record. Operation IceBridge6 is providing a novel combination of laser and radar measurements, but there are questions on how best to use the limited flight lines.
___________________
5 See http://www.esa.int/Our_Activities/Observing_the_Earth/CryoSat/Introducing_CryoSat.
6 IceBridge, a 6-year NASA mission, is a large airborne survey of Arctic and Antarctic ice sheets, ice shelves, and sea ice. For more information, see https://www.nasa.gov/mission_pages/icebridge/index.html.
Dr. Ron Kwok, Jet Propulsion Laboratory, California Institute of Technology, noted that the new NASA mission, IceSat-2, will calculate sea ice freeboard and sea surface height.
In Situ Observations
Dr. Michael Meredith, British Antarctic Survey, said that ocean observations are critical for understanding Antarctic sea ice, especially given that the ocean is an integral component of the high-latitude air-sea-ice system (see Box 2 which describes the role of the Southern Ocean in Antarctic sea ice). SST from satellite observational trends shows a relationship to sea ice trends (Armour and Bitz, 2015), but a genuine mechanistic understanding requires more than just surface data.
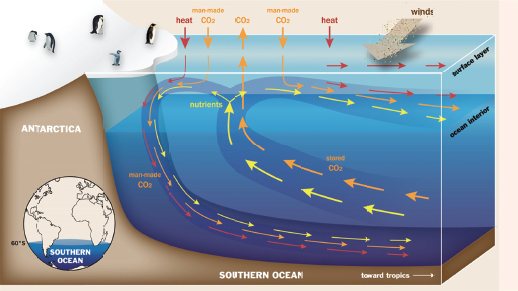
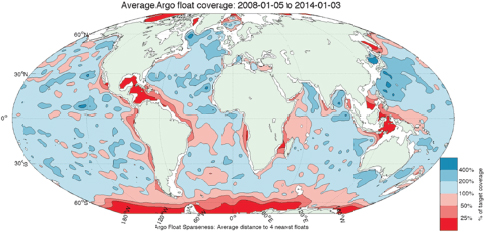
The Southern Ocean is the key site globally where deep waters are returned to the surface and surface waters are downwelled (see Figure 3). But the subsurface Southern Ocean (especially in the sea ice zone) is one of the worst measured places in the world, said Dr. Meredith. The Southern Ocean in winter is virtually unsampled, aside from Argo,7 satellites, and a handful of moorings (see Figure 4).
More sustained observations are needed, said Dr. Meredith, but they need to be planned and coordinated strategically, so that the right data are collected in the right place at the right time, in order to tackle pressing scientific and societal problems. Sea ice matters, but it is one part of a very complex and undermeasured system (Meredith et al., 2013).
Dr. Katherine Leonard, University of Colorado Boulder, said in situ precipitation measurements for the Southern Ocean sea ice are available, and there have been a variety of attempts at collecting these measurements since the 1960s. However, these measurements are challenging because most precipitation is either blown off into the ocean or accumulates in ridges (Leonard and Cullather, 2008).
___________________
7 Argo is a major component of the ocean observing system for observing temperature, salinity, and currents in Earth’s oceans. For more information, see http://www.argo.ucsd.edu/About_Argo.html.
Proxy Observations
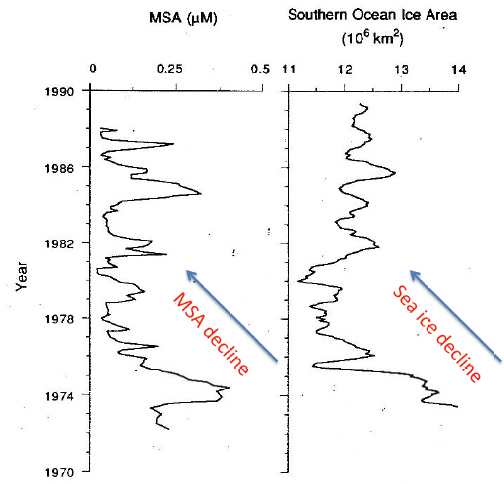
A central point of discussion during the workshop was the need to extend the record back before the late 1970s, given the high degree of internal variability in the observational record. Examples of proxy observations that could be used to extend the observation record include whale catch locations at the ice edge (e.g., Ackley et al., 2003; Cotté and Guinet, 2007; de la Mare, 1997, 2009), ice core methanesulfonic acid (MSA) records (Abram et al., 2010; Curran et al., 2010), ship log-book records (e.g., Ackley et al., 2003; Mackintosh, 1972), ice core deuterium excess data (Sinclair et al., 2014), and Orkney Islands fast ice duration (from 1903; Murphy et al., 1995, 2014).
Such observations indicate more extensive ice prior to the early 1970s, and the recent years of increased sea ice are not unique, said many participants. Dr. Will Hobbs, University of Tasmania, noted that proxies depict an unusual phenomenon in the Ross Sea, with sea ice extent decreasing in the 1950s and 1960s followed by an ongoing increase. A major challenge of proxy reconstructed time series is the uneven geographical representation and uncertain accuracy, which is difficult to quantify and validate. Dr. Stephen Ackley, The University of Texas at San Antonio, noted that proxy data on ice extent may be difficult to compare with passive microwave extent estimates based on the 15% contour. However, several participants said proxy data are invaluable and show consistency in results and findings.
Dr. Sarah Das, Woods Hole Oceanographic Institute, presented work on developing sea ice proxies from ice cores. Ice cores are comprised of preserved annual snow layers; measuring their physical and chemical variables can provide clues about the past. For example, ice layers preserve marine-derived aerosols. Many of these aerosols are related to sea ice processes, which allows scientists to measure changes in concentration over time to estimate past sea ice.
MSA is derived from phytoplankton that thrive in the ice marginal zone and is the most promising proxy (Abram et al., 2013). One of the earliest studies compared ice-core MSA with total Southern Ocean sea ice area from the mid-1970s to the late 1980s (Welch et al., 1993; see Figure 5). The decline of sea ice area matches well with the decline of MSA, and MSA also matches regional ice extent (ice edge) in several locations (e.g., Curran et al., 2003). But, Dr. Das said, there are some areas that have an opposite/negative relationship between MSA and sea ice extent. It would be useful to combine records from different sites to get a good overall picture. In general, the proxy data suggest that there is a longer-term decline in sea ice extent and area, said Dr. Das.
Dr. Das highlighted some other new potential sea ice proxies records from ice cores:
- Halogens (Br and I) for both Arctic and Antarctic regions.
- Sulfur isotopes for deconvolving source type (e.g., polynyas versus ice edge) based on different transport behavior.
- Parameters derived from stable water isotope measurements (e.g., deuterium excess) because they are strongly influenced by sea ice cover in the moisture source region.
- Snowfall accumulation variability because it is strongly influenced by atmospheric transport, which likely also drives concurrent changes in regional sea ice.
- Marine sediment cores because microfossils are often associated with sea ice presence or absence (e.g., diatoms, forams).
- Coraline algae, which can be found on underwater rocks throughout the world’s oceans, because it is correlated with sea ice cover (presence/absence of light; Halfar et al., 2013).
Dr. Das said that one of the biggest challenges is that many factors can influence concentration of key constituents that can be measured in ice cores (e.g., MSA and sea salts). In other words, sea ice is just one of several factors. For example, the same ice core is not always
reflecting moisture from the same ocean source region. Other complicating factors include aerosol production, transport, deposition, and post-depositional processes.
Reanalysis
Dr. David Bromwich, The Ohio State University, said that the Antarctic sea ice zone is almost completely devoid of conventional meteorological observations. Thus, the atmospheric parameters of most relevance to studies of Antarctic sea ice (e.g., winds, temperatures, precipitation, and downward radiation fluxes) are most often derived from global atmospheric reanalyses that merge all available observations with short-term model forecasts. Reanalysis is advancing rapidly, and the options for reanalysis datasets are growing. Most of the reanalyses start in 1979, when comprehensive satellite observations began. There are limited observation reanalyses that date back to the start of the 20th century.
Dr. Bromwich discussed trends in four sea ice–relevant variables: mean sea level pressure (MSLP), 2 m temperature, total precipitation, and sea ice conditions. For each variable, he compared several different reanalysis products and provided 1979-2009 trend maps and time series from 1900 onward.
MSLP reanalyses have a wide spread of spatial variability in trends that similarly impact the surface winds. These winds are then input into some sea ice models. In other words, the reanalysis data impact the model outcomes when models are forced by reanalyses. Based on MSLP time series at 50-65° S, all reanalyses that extend back prior to 1979 exhibit a long-term decrease in pressure, which exists regardless of the type of data assimilation.
The reanalysis products for 2 m temperature trends (1979-2009) have major differences, some of which are due to issues with station data (e.g., ERA-Interim8). Likewise, reanalysis products for total precipitation trends have a considerable spread in magnitude and trends.
Some reanalyses prescribe unrealistic sea ice conditions (i.e., concentration and annual mean sea ice area), said Dr. Bromwich. Sea ice conditions based on various climatologies are used prior to 1979. In some cases (e.g., ERA-20C9), these climatologies can depart significantly from post-1979 sea ice conditions, creating unrealistic trends in various fields.
It is challenging to use current reanalyses to analyze climate across the 20th century in high southern latitudes. The transition across 1979 is still clearly detectable in recent reanalyses, said Dr. Bromwich. He noted that the UK Met Office Hadley Centre for Climate Science and Services plans to digitalize historical records of Southern Hemisphere sea ice.
REGIONAL AND SEASONAL VARIABILITY IN ANTARCTIC SEA ICE
Observations of Antarctic sea ice show that there is significant temporal and spatial variability in the extent, which may be one reason why a simple explanation for the slight overall positive trend in the passive microwave satellite record of Antarctic sea ice extent has proven to
___________________
8 See http://www.ecmwf.int/en/research/climate-reanalysis/era-interim.
9 See http://www.ecmwf.int/en/research/climate-reanalysis/era-20c.
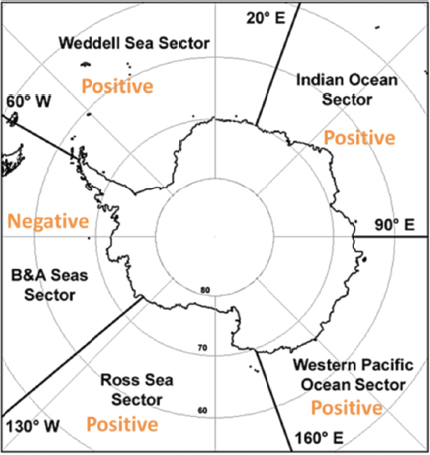
be elusive. Dr. Sharon Stammerjohn of the University of Colorado Boulder said that the oft-cited weakly positive trend in circumpolar sea ice extent is actually the result of large and strongly contrasting regional trends, some with magnitudes equivalent to those observed in the Arctic. In particular, there have been strongly negative monthly extent trends in the Bellingshausen and Amundsen Seas and strongly positive trends in the Ross Sea sector (Stammerjohn et al., 2008; see Figure 6). Such regional variability is not confined to annual sea ice extent or traditionally defined sectors (Raphael and Hobbs, 2014). For example, the length of the sea ice season has changed dramatically in some areas (e.g., becoming shorter in the Bellingshausen Sea and longer in the Ross Sea; Stammerjohn et al., 2012), and there are areas of strongly contrasting trends within the traditionally defined Weddell Sea sector (Holland, 2014; Maksym et al., 2012).
Dr. Paul Holland, British Antarctic Survey, said the sea ice regional trends (i.e., area and concentration) also vary by season. The Ross Sea has a significant sea ice trend year round. No other region has a significant trend in winter and spring. In the Amundsen-Bellingshausen Seas, there is less ice in summer and no change in winter. In the Weddell Sea there is a strong increase in summer that disappears in winter (Holland, 2014).
One way to understand the seasonality of regional sea ice is to measure the seasonal rate of change of ice area (i.e., rate of ice expansion and contraction), said Dr. Holland. Expansion and contraction occur through both ice dynamics and thermodynamics. In autumn, the sea ice grows relatively slowly and in spring, the ice melts rapidly. A change in forcing (e.g., a warming) will not
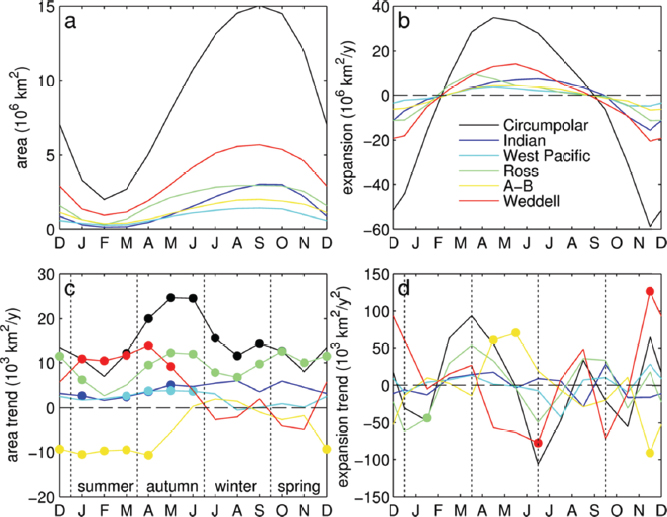
directly affect ice concentration; it will affect the rate of ice expansion and contraction, according to Dr. Holland (see Figure 7).
In looking at how ice concentration and ice expansion and have changed over time, Dr. Holland said it is clear that ice concentration trends are being created in spring and reversed during autumn. For example, there is a large increase in springtime ice loss in the Amundsen-Bellingshausen Seas, which causes a lower ice concentration to persist throughout summer until autumn, when the ice expands faster and compensates this loss. Conversely, in the Weddell Sea there is a decrease in ice loss during spring and an increase in ice gain in autumn.
According to Dr. Stammerjohn, the spatial and temporal variability points to the enormous analytical challenges associated with understanding Antarctic sea ice variability, and to the importance of finer-grained analyses to understand sea ice and its fate in the Southern Ocean.
Dr. Stammerjohn presented an analysis of sea ice extent in 2012-2014. These are years that broke records for maximum sea ice extents in the Southern Hemisphere, contrasting strongly
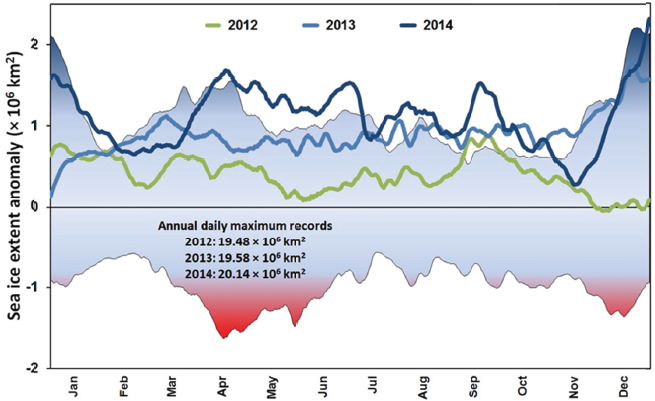
with the record-breaking negative anomalies in the Arctic (see Figure 8). Despite the fact that these years were unprecedented in the modern satellite record, it has been very difficult to establish clear links to any one mechanism driving the successive record-breaking years because they were characterized by strong regional and seasonal differences.
Furthermore, different regions in different seasons contributed to the Antarctic-wide anomalies during the seasons of both sea ice advance and retreat,10 and in many cases there were contrasting seasonal anomalies in the different regions. For example, in 2014, conditions in the western Weddell Sea contributed heavily to (austral) summer and early fall anomalies, while several sectors contributed to late fall and winter anomalies. Positive anomalies in the Ross Sea and Indian Ocean sectors contributed to records in winter through early spring, and large positive anomalies in the Weddell and Ross Seas led to positive anomalies late in the year (late spring and early summer).
Dr. Stammerjohn said that a very promising method to furthering understanding linkages between climate and ocean conditions and sea ice variability is to use a data-driven approach for defining regions and seasons for analyses. A recent example defined regions and seasons from the perspective of the variability in the sea ice record itself, rather than the atmosphere or the ocean, and used this as the starting place for comparison with potential drivers of sea ice
___________________
10 Varies slightly by region, but generally considered February/March to August for advance, and October/November to February for retreat.
variability (Raphael and Hobbs, 2014). This type of analysis has yielded tighter correlations between the sea ice variability record and atmospheric phenomena during critical periods of sea ice advance and retreat, with climate modes identified as predominant proximal drivers of advance and retreat in different regions.
USING CLIMATE MODELS TO INTERPRET AND EXTEND THE OBSERVATIONAL RECORDS
Climate models provide an important tool for interpreting and extending understanding of Antarctic sea ice observations, said many participants, as well as exploring the potential mechanisms influencing the observed variability. Box 3 provides descriptions of the models that have been used to study Antarctic sea ice and the sorts of experiments that can be performed. According to several participants, much of the research to date has focused on understanding the notable discrepancy between observations and models, which generally exhibit a decline in Antarctic sea ice extent over the last 30-50 years. If the models are improved to the point that they can reliably reproduce past sea ice conditions, then they could also be used to disentangle the roles of internal variability and human-caused drivers of changes in sea ice, as well as to project how sea ice might change in the future.
Reconciling Models and Observations
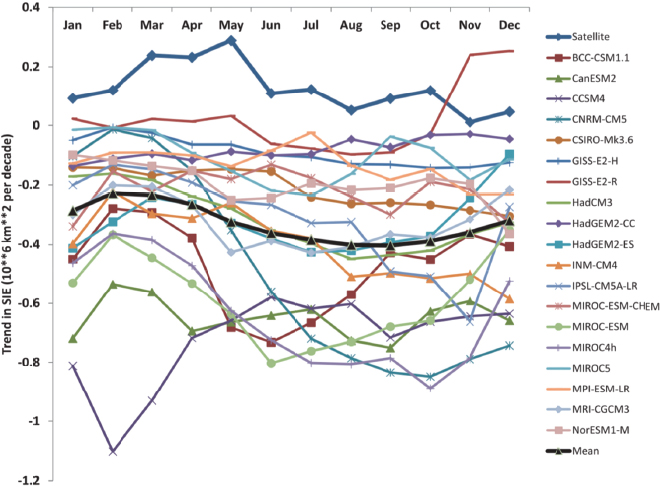
The modest positive trend in satellite-derived estimates of sea ice extent observed from 1979-2014 does not match global climate model simulations of Antarctic sea ice (see Figure 9). Most models show Antarctic sea ice extent declining on average in response to observed warming of the atmosphere (Gagné et al., 2015; Mahlstein et al., 2013; Polvani and Smith, 2013; Swart and Fyfe, 2012; Turner et al., 2013b; Zunz et al., 2013).
Furthermore, said Dr. Hobbs, very few Coupled Model Intercomparison Project Phase 5 (CMIP5) models are able to replicate the observed summer sea ice extent mean state, and they tend to overestimate its year-to-year variability (Zunz et al., 2013). Dr. Hugues Goosse, Université Catholique de Louvain, said it is critical that models represent the mean state of the system accurately because several proposed mechanisms for sea ice variability depend on the mean state (Lecomte et al., 2016). Furthermore, models also need a correct initialization of the Southern Ocean to ensure more accurate decadal predictions and projection.
Over the satellite era, the models (including the CMIP archive and the ensemble mean) do not capture the cooling surface temperature trend that is occurring over the Southern Ocean (Marshall et al., 2014). However, when observations are extended back to 1940, they indicate that there has been warming in the Antarctic (though less than in the Arctic), which is consistent with the models. According to Dr. Cecilia Bitz, University of Washington, scientists should thus reframe the question away from expecting the ensemble mean of models to resemble the observed estimate of Antarctic sea ice extent. The goal could be for modeled response to GHG to match the longer-term record rather than the satellite record. Perhaps the satellite record represents internal variability or shorter-term forcing, not well represented in models.
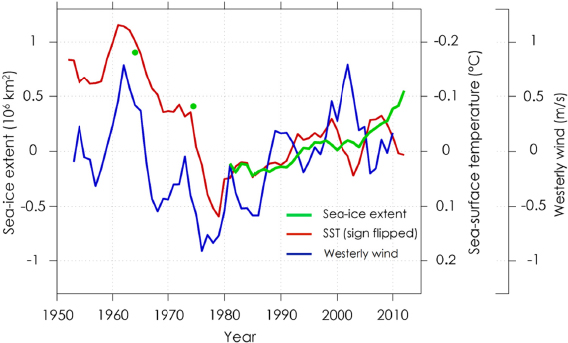
Dr. Bitz noted that Fan et al. (2014) found a strong relationship between SST and sea ice extent, surface wind, and sea level pressure when observations are extended back to 1940. Armour and Bitz (2015) show that sea ice extent, SST, and westerly wind anomalies are all correlated (see Figure 10).This indicates that there has potentially been a loss of sea ice in
Antarctica over the century scale, along with a slight increase in SSTs, which is also shown by CMIP models on the century scale. Thus, there is a better match between models and observations on longer time scales, in terms of both surface air temperature, SST, and quite possibly sea ice extent.
Dr. Lorenzo Polvani, Columbia University, said it is important to recognize that the models simulate the sea ice extent seasonal cycle quite well (Zunz et al., 2013). Furthermore, many models even capture the regional features correctly. However, some participants said that models show larger-scale variability and cannot provide information about regional variability.
Dr. Laura Landrum, NCAR, said that observations of the trends in sea ice extent over the seasonal cycle are well within the uncertainty of CMIP class models over much of the Southern Ocean. However, there are several exceptions. For example, the Ross Sea (especially the western Ross Sea) during January through May is not well captured in the models. Several reasons for this discrepancy include
- Ice shelf processes and freshwater input;
- Polynyas, ice shelf, and continental slope generally not resolved in coupled models; and
- CESM ocean is too stratified on the continental shelf of the Ross Sea.
The Weddell Sea in summer is also not well captured in the models, but to a lesser degree than the Ross Sea.
Dr. F. Alexander Haumann, ETH Zürich, said that the differences in observed and simulated Antarctic sea ice variability may be caused by different atmospheric circulation patterns and ocean stability (Haumann, 2011; Haumann et al., 2014). Zonal asymmetries in the large-scale circulation around Antarctica drive variations and long-term trends in Antarctic sea ice, and this process is not captured well in climate models. Dr. Haumann said that the underestimated zonal asymmetries in the atmospheric circulation are also causing a much weaker ocean surface stratification in the model. This results in a much higher sensitivity of the sea ice to changes in the subsurface heat fluxes, explaining why simulated sea ice changes could be driven by a different mechanism than the changes observed in recent decades.
Another reason why models are not capturing observations is due to a combination of model biases, said Dr. Armour. Such biases include
___________________
11 See https://nsidc.org/data.
- Shortwave radiation, which strongly affects the sea ice;
- Vertical and horizontal ocean temperature gradient biases over the whole Southern Ocean, perhaps due to inability to resolve coastal processes (e.g., Antarctic bottom water formation); and
- Biases in wind trends, both Southern Annular Mode (SAM) and local circulations (up to uncertainties in observations). This could be due to a combination of incorrect ozone forcing in the models, and internal variability.
Dr. Jennifer Kay, NCAR, noted that the excessive absorbed shortwave bias over the Southern Ocean in CESM has been “fixed” by making the clouds brighter. Addressing this longstanding radiation bias results in important climate impacts for the Southern Ocean, illustrating that much can be learned about how the system works by “fixing” these large existing biases.
Many workshop participants said explaining discrepancies between models and observations would lead to improvements in the models and for understanding the future of sea ice. Although models are useful for exploring mechanisms, several participants said that models are not ready to be used for attribution.
Separating Internal Variability from Anthropogenic Forcing
During the discussion, many participants noted that the discussion of the drivers of Antarctic sea ice extent variability has been framed as either anthropogenic forcing or internal variability. However, the expansion of sea ice could be a combination of both, so dominant mechanisms should be emphasized rather than forcing or internal variability, according to several participants.
For detection and attribution, scientists should move away from the idea that the observed climate is the “right” one, said Dr. Hobbs. The observed climate is one realization of the climate. Studies should frame the climate as signal and noise, one of an ensemble of possible climates that could be realized under a given forcing. The difficulty with studying mechanisms and drivers of Antarctic sea ice is that the signals are all in areas of high noise. From a detection and attribution perspective, it makes more sense to study annual mean sea ice extent to get a signal-to-noise ratio. However, important information is lost due to averaging.
If 1979-2005 trends from 100 ensemble members of CMIP5 model runs are averaged, it is difficult to say anything definitive about the models (i.e., whether they are “right” or “wrong” [Maksym et al., 2012]). In CMIP5, almost all of the sea ice response is driven by GHGs; there is some concern that the ozone depletion in the models is not representative, said Dr. Polvani. He emphasized that disagreements between observations and multimodel mean does not imply that models are fundamentally flawed. Given that the multimodel mean comes from combining many different model simulations, the natural variability is “averaged out” and therefore represents the forced response only (Polvani and Smith, 2013). Thus, the multimodel mean and observations will agree only if internal variability is a relatively small driver of the Antarctic sea ice variability, according to Dr. Polvani.
Dr. Hobbs and Dr. Polvani said this suggests that internal variability is large compared to anthropogenic forcings. Many recent modeling studies have indicated that the anthropogenic signal, whether caused by increasing CO2 or decreasing stratospheric ozone, would result in a reduction in ice cover and may be relatively small compared to internal variability. No one mode or process can explain the entirety of the trends. The atmosphere and ocean both play a part, with great spatial dependence on which processes dominate. Polvani and Smith (2013) showed that both forced and observed trends fall well within the probability density function of the preindustrial control runs. Gagné et al. (2015) also found that the recent increase in Antarctic sea ice is due to internal variability.
Dr. Polvani also noted that observations of Antarctic sea ice extent, SSTs, and zonal winds appear to be largely uncorrelated with the increase in carbon dioxide and the decrease in ozone. Observations show a clear reversal of trends around 1980, whereas both major anthropogenic forcings are monotonic since 1950; hence, trends are unlikely to be primarily due to anthropogenic forcings.
Projecting Future Antarctic Sea Ice Conditions
Some participants said that Antarctic sea ice is likely to decline in the longer term, which is in line with model projections. However, others said that models are not ready to make confident projections about 21st-century Antarctic sea ice and that scientists need a better understanding of the mechanisms before confident statements can be made about the future of Antarctic sea ice. For example, if freshwater (e.g., due to ice sheet melt and enhanced precipitation) is really a significant driver of sea ice expansion, perhaps that will continue to dominate GHG trends in the future. On the other hand, if winds have driven expansion, future wind changes (forced or internal variability) may dominate.
Many participants said that in the long term (~2,100) models likely get the right sign of the response to the forcing (i.e., Antarctic sea ice will likely decrease). The Southern Ocean will probably get warmer with thermodynamic consequences for the sea ice, but it is difficult to provide accurate information about locations and magnitude of sea ice trends.
Many participants highlighted the importance of disaggregating overall trends to extrapolate regional variability—with distinct controlling mechanisms—as the drivers of overall trends. Dr. Povlani reminded participants that looking regionally increases signal to noise, whereas averaging hemispherically creates small trends and decreases signal to noise. The largest warming and sea ice loss occurs in the Bellingshausen-Amundsen Seas; this is the only region where observations are in line with what the models predict for the forced response. Yet, this is where some scientists think internal variability has played a primary role in the changes.
PROPOSED MECHANISMS DRIVING OBSERVED VARIABILITY IN ANTARCTIC SEA ICE
There are many local, regional, and global processes that influence seasonal sea ice growth and melt, including the internal variability of the coupled atmosphere–ocean–sea ice system as well as external forcing to processes (e.g., indirect effects of stratospheric ozone
depletion, and greenhouse gases). Workshop presentations and discussions highlighted several individual processes and mechanisms that could influence recent trends and record extents in Antarctic sea ice (see Box 4). These processes and mechanisms are not necessarily mutually exclusive. Many participants said that because every region of the Antarctic is sensitive to different climate anomaly patterns, no one mode or mechanism can be evoked to explain the recent overall record extents.
Feedbacks and Linkages Between Atmospheric Warming and Local Hydrology, Sea Ice Formation, and Ocean Circulation
Sea Ice–Ocean Feedbacks and Linkages
Sea ice feedbacks and linkages can result in opposite drivers leading to the same outcome, said Dr. Hobbs. For example, increased sea ice cover (Goosse and Zunz, 2014) leads to increased spring melt and increased freshwater input, which results in a strongly stratified mixed layer and reduced ocean flux, favoring sea ice formation. Atmospheric warming, on the other hand, leads to reduced autumn ice production and a reduced brine rejection that also results in a strongly stratified mixed layer and reduced heat flux, which also favors sea ice formation (Zhang, 2007).
Dr. Doug Martinson, Lamont-Doherty Earth Observatory, emphasized that the ocean–sea ice negative feedback keeps Antarctic sea ice thin (and thus seasonal). The winter evolution of the water column is the most fundamental process in the Southern Ocean that works to control the stratification; the nature and timing of the sea ice distribution; and deep and bottom water formation, productivity, and ventilation of heat and CO2. The ice-ocean feedback describes how many units of ice would melt for every one unit of ice grown due to entrainment of heat from brine rejection (Martinson and Iannuzzi, 1998). For the Atlantic sector (Weddell gyre) of the Antarctic sea ice fields, each unit grown in one day results in enough heat released to melt 4 to 16 units of ice, or alternatively warms the water such that it takes 4 to 16 units (i.e., 4 to 16 days) to vent the heat before more ice can grow. Hence, very little ice can grow over several months of winter.
Waters capable of growing sea ice are limited by the ACC, so slight changes in its position due to variability in westerlies can set the average northern limit of sea ice fields. The ACC divides polar from tropical waters and limits the equatorward expansion of ice growth, said Dr. Martinson. Near the ACC, the negative feedback gets stronger and stronger, resulting in thinner ice formation that cannot survive the melting from the warm surface waters while being blown northward, thus limiting that form of expansion as well. It is speculated that subtle shifts in the ACC via changes in the westerlies may actually account for the statistical zonal sea ice expansion. Dr. Lynne Talley, Scripps Institution of Oceanography, noted that topography also constrains the southern ACC fronts.
The Southern Ocean has also freshened, which is consistent with an accelerating hydrological cycle (Böning et al., 2008). Dr. Haumann discussed research on estimating uncertainties and freshwater fluxes associated with sea ice melting, sea ice freezing, and sea ice transport. This research depicted a persistent and robust trend of freshwater advection due to
changes in the drift of sea ice from the continent to open water. According to Dr. Haumann, sea ice freshwater flux changes may explain effects on salinity changes in the Southern Ocean in the recent decade. A model sensitivity study was conducted to examine the impacts on salinity, with the addition of glacial melt along the coast of the Amundsen Sea leading to overcompensation and subsequent freshening linked to a feedback in sea ice transportation trends. The resulting conclusions determined that salinity changes and freshening in the Southern Ocean are driven by changes in sea ice transport.
An important question, said Dr. Meredith, is whether the ocean overturning has accelerated. Analysis of tracer data indicates that the Southern Ocean overturning may have accelerated (Waugh et al., 2013), and this potentially represents an increase in upwelling of warm water from below. However, this is very difficult to measure, and current understanding is based on very few data points. Furthermore, for any upwelled warm water to influence sea ice, it must cross the pycnocline and penetrate the upper mixed layer; this may be difficult if stratification is stronger. According to Dr. Meredith, it is very difficult to attribute strengthened Southern Ocean stratification to either ocean-induced melting of ice shelves or increases in precipitation. Increases in glacial discharge in some sectors are fairly robust, and circumpolar spreading around the Antarctic shelf has been shown using satellite data; however, it is not clear whether this freshening on the surface has significantly impacted sea ice production (Rye et al., 2014).
Ice Sheet–Ocean–Sea Ice Feedbacks
Warming of global ocean deep water has considerable potential for long-term melting of Antarctic glacial ice shelves. Although the Southern Ocean is not well measured in all places, there is evidence that the Upper Circumpolar Deep Water (UCDW) has been warming dramatically, according to Dr. Martinson. The UCDW is the warm deeper water responsible for melting the ice shelves. Rhein et al. (2013) found that the deep Southern Ocean is warming significantly faster than the global ocean as a whole. The warming ensures strong melt, even if the circulation beneath the ice margins slows down.
To better understand impact of ice sheet melt on sea ice, several model studies have been conducted. Dr. Ryan Walker, NASA, discussed a 2004 modeling study run by Hellmer (2004) that used ice-ocean models run with and without the inclusion of major subshelves in the ocean. It showed that meltwater contributes to sea ice increases in two ways: through (1) cooling and freshening of surface waters and (2) stabilization of the water column. This demonstrates that the spatial pattern of sea ice response depends on dynamics of ocean currents.
Bintanja et al. (2013) conducted a modeling study where they simulated processes associated with increased ice sheet melt in a coupled climate model to explore how those processes impacted sea ice extent. They used best estimates at the time of grounded ice sheet mass imbalance (250 Gt/yr loss for 31 years; latest estimates are one-third as much), and the sea ice expanded. They argued that, zonally around the continent, there is on average cooling and freshening in the surface layers, warming in the deeper layers, and an increase in stability. This phenomenon is due to sub–ice shelf melting and is considered by Bintanja et al. to be the dominant driver in increased sea ice, more so than any atmospheric factors. However, Swart and
Fyfe (2013) and Pauling et al. (2016) found that the sea ice response was small when they added a similar amount of freshwater to their models.
Pauling et al. (2016) found that the rate of rain that is falling in the Southern Ocean is about 25,000 Gt/yr. This is more than 200 times greater than the rate of freshwater Bintanja found was sufficient to cause sea ice to expand. Pauling et al. added 2,000 Gt/year of freshwater to the CESM model. Sea ice extent increased but not enough to change the trend, said Dr. Bitz.
Different answers from different models reflect model biases, likely biases in the mean state, and especially errors in their climate sensitivity, according to Dr. Bitz.
Variability in Regional and Large-Scale Atmospheric Circulation and Surface Wind Patterns
Southern Annular Mode
The SAM is the dominant mode of atmospheric variability in the Southern Hemisphere and is thought to influence sea ice via its influence on westerly winds. Circumpolar winds become stronger during the positive phase of the SAM as pressure gradients between the middle and high southern latitudes increase, driving increases in the strength of westerly winds. This can cause expansion of sea ice in some regions due to enhanced Ekman drift in the ocean that favors northward advection of sea ice (Stammerjohn et al., 2008). Dr. Hobbs noted that increased westerlies can also lead to a decrease in sea ice because the Ekman transport brings up warm, deep water that can melt the sea ice. The SAM has been experiencing a positive trend since the mid-1960s and is forced by GHGs and ozone.
Dr. John Fyfe, Environment and Climate Change Canada, said that model studies show that Southern Hemisphere surface westerlies account for about 25% of the Antarctic sea ice anomaly. Models participating in CMIP5 suggest that externally forced strengthening of the westerlies may have impacted Antarctic sea ice coverage. There is little agreement between models and reanalyses (1950 to the present) in terms of the strength and trends in the westerlies, but there is a zonal pattern.
However, from 1979 to the present, the strength of the trend in the westerlies for the austral summer is fairly consistent. All of the other seasons span from negative to positive trends. The annual mean does not exhibit a shift because the winter shift is balanced by the summer shift. Patterns of change from 1988 to 2011 show no zonal structure; rather, it is a dipole pattern, suggesting a larger role of internal variability over that time period. Dr. Fyfe noted that the Antarctic trend in the last 7 years is outside of anything observed and the pattern of change is dissimilar from the CMIP5 average pattern. He concluded that an externally forced westerly wind impact on Antarctic sea ice coverage is plausible, but solid evidence has yet to emerge. Further progress has been hindered by the lack of long-term observations, the wide range of reanalysis estimates, the influence of internal variability, and the systematic bias across models.
Amundsen Sea Low
Another atmospheric driver of Antarctic sea ice variability is the ASL. The ASL controls meridional winds near West Antarctica (in the Amundsen, Bellingshausen, and Ross Seas), as well as sea ice motion. Dr. Hobbs said that spring trends in wind and sea ice concentration from 1992 to 2010 show that a deepening of the ASL is bringing warm air into the Bellingshausen Sea and cooler air over the Ross Sea. However, when the data are extended back to 1979, this trend is not apparent. The location of the ASL has shifted and also does not line up with the increases in sea ice concentration in the western Ross Sea. Thus, said Dr. Hobbs, he is skeptical about a connection between the increase in sea ice concentration over the western Ross Sea and the ASL.
Dr. Fogt noted that the ASL deepened in every season except winter over 1979-2008 (Turner et al., 2013a). Model studies suggest that the summer strengthening of the ASL can be at least partially attributed to ozone depletion (Turner et al., 2009; the role of ozone is discussed in more detail below). However, the deepening in autumn appears to be model-dependent because not all model studies find this relationship between the ASL and ozone (Fogt and Zbacnik, 2014; Turner et al., 2009). Other changes in the ASL are more strongly tied to internal variability, especially tropical forcing (Fogt and Wovrosh, 2015; Raphael et al., 2016; Turner et al., 2015). The features of the ASL need to be adequately simulated in order to accurately depict regional sea ice trends.
Influence of Stratospheric Ozone Depletion
There was additional workshop discussion on the influence of stratospheric ozone on Antarctic sea ice variability through its connection to local winds. Since the 1970s, westerly winds have strengthened and moved poleward, exhibiting a positive SAM-like pattern. It is thought that the primary driver is ozone depletion (Polvani et al., 2011), but it may also reflect internal variability (Deser et al., 2012). As discussed above, increased westerlies may enhance sea ice formation or decrease it.
There is an observed correlation between ozone depletion and sea ice expansion (e.g., Goose et al., 2009). However, Dr. Polvani said that all available CMIP-class model studies specifically designed to isolate the effects of increasing chlorofluorocarbons and stratospheric ozone depletion show decreased sea ice extent over Antarctica due to warming of the surface ocean (Bitz and Polvani, 2012; Sigmond and Fyfe, 2010).
To reconcile these two points of view, Dr. David Ferreira, University of Reading, did a modeling experiment and found that ocean–sea ice response to abrupt ozone depletion has two phases in the high latitudes: cooling and then warming (Ferreira et al., 2015). Initially, the positive SAM-like pattern (forced by ozone depletion) enhances northward Ekman drift in high latitudes but weakens it in the lower latitudes. This leads to SST cooling in high latitudes and warming in lower latitudes. This phase typically lasts for a few years. Over longer time scales, this dipole response slowly evolves into a hemispheric warming; the high-latitude enhanced northward Ekman drift leads to upwelling of warm waters from below the mixed layer. This warming eventually overtakes the cooling from anomalous Ekman drift due to sustained bursts of westerly
winds as a result of ozone hole depletion. The two time scales emerge through ocean dynamics. This results in sea ice expansion followed by a decrease, in phase with the high-latitude SST cooling and warming.
The time scale of the transition between the cold and warm SST responses appears very uncertain (between 3 and 20 years), with several sources of uncertainty, including air-sea fluxes (clouds/shortwave), strength and shape of the wind stress response, and ocean eddy processes (control upwelling rate). In the face of these large uncertainties, Dr. Ferreira believes that scientists should refrain from making statements about ozone depletion contributing or not to recent Antarctic sea ice trends.
The implications of the two time scales goes beyond the SAM/ozone context: The complex ocean dynamics observed in the ozone case is likely to be triggered by other sources of SAM variability (internal variability, tropical teleconnection, and CO2 forcing) and by other modes of atmospheric variability. The two–time scale behavior also implies that the relationship between SAM and SST/sea ice is not the same on all time scales, an assumption often made when analyzing observations. For example, the ocean–ice response to a SAM trend is not necessarily a trend.
Connections Between Tropical Ocean Variability and Antarctic Sea Ice
Tropical Pacific Teleconnections
Dr. David Schneider, NCAR, said that changes in tropical SSTs have played the dominant role in deepening the ASL during the satellite era. He believes that the tropics may be setting the pace of the changes in the Antarctic, i.e., the tropics are the “pacemaker” of Antarctic anomalies.
Dr. Schneider described a study he did using coupled simulations of Antarctic sea ice and related variables to look at this pacemaker hypothesis. He used a large ensemble of 30 members with forcings similar to CMIP5 historical experiments (up to 2005) and Representative Concentration Pathway 8.5 (after 2005). The Pacemaker ensemble is comprised of 10 members where SST anomalies are restored to observed values in the eastern tropical Pacific. He hypothesized that the inclusion of tropical SST variability in the Pacemaker runs would improve the wind trends, which would in turn improve the sea ice trends. In comparing the runs from the large ensemble and the Pacemaker runs, the Pacemaker runs simulate a richer pattern in zonal winds that captures the trade winds and is more similar to reanalysis. However, the model still loses sea ice. Dr. Schneider believes this is due to subsurface ocean processes because the atmosphere is constrained by observations.
Dr. Graham Simpkins, University of California, said that the influence of Pacific SST variability (ENSO) on Southern Hemisphere high-latitude climate has long been known (Karoly, 1989; Mo, 2000; Mo and Higgins, 1998), and there is a distinct regionality and seasonality on resulting teleconnections.
To highlight this regionality and seasonality, Dr. Simpkins discussed SST anomalies in the east Pacific (Canonical El Niño; EP) and the central Pacific (El Niño Modoki; CP) and the resulting teleconnections to the Antarctic (Ciasto et al., 2015). On interannual time scales, both EP and CP SST variability drive pronounced perturbations to the Antarctic surface climate, but with marked
seasonal dependence. In the winter, EP and CP SST variability promotes very similar teleconnection structures with a westward shift in CP compared to EP. These teleconnections are characterized by a stationary Rossby wave train. Anticyclonic circulation anomalies (and associated winds) over the ASL drive anomalous sea ice variability in the West Antarctic region (Ciasto and Thompson, 2008; Ding and Steig, 2013; Karoly, 1989; Liu et al., 2004; Schneider et al., 2012b; Simpkins et al., 2012; Stammerjohn et al., 2008; Turner, 2004; Yuan, 2004).
However, in the summer, differences are observed in the atmospheric structures of EP and CP. The EP teleconnection projects onto the negative phase of the SAM, whereas the CP exhibits a weak teleconnection. The Antarctic impacts of the EP and CP are somewhat similar in terms of spatial structure, but CP anomalies are weaker. Anticyclonic circulation (and associated winds) promote a dipole pattern in sea ice concentration between the Ross/Amundsen and Bellingshausen Seas (Ding et al., 2012; Fogt and Bromwich, 2006; Fogt et al., 2011; Karoly, 1989; L’Heureux and Thompson, 2006; Simpkins et al., 2012; Stammerjohn et al., 2008).
Given these interannual relationships, Dr. Simpkins said claims have also been made regarding longer-term impacts on the Antarctic climate, driven by Pacific SST trends. These impacts are largely linked to the CP/South Pacific Convergence Zone region. A somewhat uncertain connection has been made with CP in the wintertime, but the reanalyses might not support it. In the springtime, there appear to be Pacific South American links. While Pacific teleconnections potentially exist on these longer-term time scales, they explain only a component of the trends in specific regions. There are many confounding processes, including the Atlantic.
Tropical Atlantic Teleconnections
Tropical Atlantic SSTs are another potential mechanism for Antarctic sea ice variability. According to Dr. Xichen Li, University of California, San Diego, this mechanism can be explored through comparisons of statistical analyses and coupled-model simulations. North Atlantic SSTs have increased by more than a half degree, and this is impacting the Antarctic, said Dr. Li.
Atlantic SST variability can impact the Antarctic atmospheric circulation directly through stationary Rossby waves. The Atlantic can also first influence the Pacific, which further generates the Rossby wave chains to the Antarctic. These Rossby wave trains in western Antarctica modify the regional atmospheric circulation and thus the Antarctic sea ice distribution.
Several numerical models confirm that Atlantic SST variability deepens the ASL, which impacts the Antarctic sea ice. This is a strong teleconnection, particularly in wintertime. Atlantic SSTs may also interact with SST changes in the Indian Ocean and Pacific through the Rossby and Kelvin wave dynamics.
Although these mechanisms are robust, Dr. Li noted that there are also multiple pathways for the different ocean basins to interact, which is a complicating factor in the tropical-polar teleconnection.
Mechanisms in the Context of Regional Variability
Dr. Stammerjohn said that global and continental-scale factors likely altered the probability for years with high sea ice extents (2012-2014). For example, the SAM was mostly positive, and ENSO was neutral during the 2012-2014 record years (Fogt and Scambos, 2013, 2014; Fogt and Wovrosh, 2015; Reid and Massom, 2015). In contrast, fewer regional- and continental-scale positive sea ice extent anomalies characterized 2015, a year with a strongly positive El Niño. Despite the fact that these processes are known to influence sea ice variability, Stammerjohn emphasized that the state of SAM and ENSO cannot explain variability in all seasons and regions and thus Antarctic sea ice variability more generally (Liu et al., 2004; Yuan and Li, 2008). For example, they cannot explain all of the variability contributing to the record high sea ice anomalies in 2012-2014. Instead, the influence of local and regional climate patterns and their influence on local wind and ocean conditions were critical:
- Positive sea ice anomalies in the Weddell Sea were associated with preconditioning by cool SST anomalies that persisted from the previous year, driving very early advance of the sea ice. These anomalies in the Weddell Sea may have also influenced later positive anomalies in the Indian Ocean through advection.
- Early and deep formation of the ASL correlated with positive sea ice anomalies in the fall and winter in the Ross Sea and Bellingshausen and Amundsen Seas.
- Mid-winter formation of a weaker than normal zonal wave 3 pattern may have influenced late winter anomalies in the Ross Sea.
FUTURE NEEDS AND OPPORTUNITIES
This section draws from all of the workshop discussions to synthesize several recurrent and overarching themes, with particular attention to the needs for future observations and research. As in earlier sections, the themes presented here do not necessarily represent a consensus view among the participants, the view of the planning committee, or the view of the National Academies. Rather, these ideas are those of individuals or groups of workshop participants.
Observations
Improving the Satellite Record
Many workshop participants said the satellite record could be improved with the addition of the following satellite observations:
- Improved and validated satellite retrievals of large-scale sea ice edge and concentration, thickness, and snow cover and depth, including independent data for determining the
-
accuracy, bias, and precision of satellite sea ice concentration and extent algorithm and data (i.e., in marginal ice zone, covering seasons and regions);
- Ice volume;
- Ice velocity;
- Ice mass balance;
- Precipitation and snow accumulation and loss; and
- Large-scale motion, dynamics, and deformation at high resolution.
Oceanographic Measurements
Oceanographic measurements were also identified by many participants as important for understanding Antarctic sea ice variability. For example:
- In situ ocean observations to assess vertical and horizontal distributions of heat and freshwater anomalies. Such observations could also be used to assess seasonal persistence, propagation or (re)emergence of ocean thermal and freshwater anomalies.
- In situ ice and ocean observations to assess controls on seasonal ice and snow thickness evolution, interactions between the ocean and ice shelves, and regions of active upwelling (e.g., shelf break, canyon heads).
- Deep ocean measurements to assess temperature and salinity variability related to changes in sea ice and the impact of melt water at different depths.
Several participants said that new technology (e.g., autonomous surface vessels, gliders, tagged marine mammals, and cables) would be useful for making key oceanographic measurements such as
- Full-depth hydrographic profiles under ice and in winter (e.g., temperature and salinity);
- Lateral ocean circulation changes;
- Vertical heat flux as a function of time to better understand overturning circulation;
- Position of Antarctic Circumpolar Current fronts to determine if they move over time;
- Ice production and melt in polynyas and elsewhere;
- Stratification and mixed layer depth everywhere, as a function of time;
- Geochemical tracers for decomposing ocean freshwater budget;
- Four-dimensional ocean circulation fields, including time-varying overturning; and
- Vertical and isopycnal mixing changes.
Generating Longer Records of Sea Ice Variability
Several participants emphasized the importance of generating longer records of sea ice variability. Satellite data give good coverage of sea ice variability (e.g., extent, concentration, and area) and trends in recent era; however, it is necessary to reconstruct data before 1979 in order to
better understand recent trends and help with attribution. Extending the historical record would also facilitate comparison with models to understand recent trends and the future. Some participants said that obtaining data from even just a few years can make a significant difference in understanding the system. Several participants also highlighted the benefits of using complementary observations (e.g., SST, MSLP) together with sparse sea ice extent observations. Options for extending the record before 1979 include
- Homogenization of ESMR data with post-1979 record,
- Gap filling with ice charts,
- Calibration of Nimbus record (e.g., 1964 and 1966 anomalies),
- Recalibration of the present data (post-2000) with scatterometer data against passive microwave data to better define sea ice extent (problems with 15% contour),
- Ice core chemistry (MSA record; for limited regions),
- Sediment records,
- Early ship/whaling records, and
- Penguin colony records.
Coupled Reanalysis Products
Several participants expressed significant concerns about reanalysis, especially given that it limits assessment of the sea ice trend and the role of westerly winds. It is difficult to assess the uncertainty of reanalysis and construct a homogenous record. Observations of ice thickness, depth of snow on top of ice, trends of ice drift, snow accumulation rates and patterns, precipitation, and clouds (e.g., shortwave) could help to constrain the reanalyses. Other participants suggested choosing specific problems and/or regions (e.g., Ross Sea) that are highlighted by models and use proxy data to test and validate the reanalysis. However, there was some skepticism that the proxy data could be trusted enough for this kind of validation. Many participants said there is promise for coupled reanalysis products, which use physics and other observations that go back further in time. Such products would be the only independent check to look back before 1970. They would also serve as another tool to compare with CMIP-level models.
Observations for Model Assessment
Many participants noted that observations are critical to support model assessment. The Southern Ocean State Estimate could be a good dataset for model evaluation; it has shown surface fluxes are critical for correctly estimating water masses. There has also been a push to do more projections and large ensembles rather than emphasizing finer scales to resolve eddies, polynyas, and katabatic winds. Other observations for improving models include surface energy balance and ocean temperature and salinity profiles under the ice.
Models
Improvements in Model Parameterizations
Several participants said that enhancements in model parameterizations are needed to improve model representation of sea ice trends and variability. Examples of parameterizations that need improvements include polynyas, ice drift (in particular, ice drag coefficients), mixed layer schemes under the sea ice, the role of clouds (especially given that the Southern Ocean is among the cloudiest12 places on Earth; e.g., McCoy et al., 2015), and wave–sea ice interaction.
Modeling Studies and Intercomparisons
Workshop participants also discussed modeling studies and intercomparisons to advance understanding of Antarctic sea ice variability. Some participants said that there might be a value in doing experiments with a high-resolution atmospheric model, especially in the Ross Sea. Others suggested research to test how the sea ice response differs if the model is forced (nudged) toward the observed mean state would be useful. Another idea is to analyze a process-based budget to look at interannual variability (e.g., thermodynamics versus transport).
Because it is not always clear whether the trends are captured for the correct reasons, modeling studies that diagnose whether sea ice trends are captured for the right or wrong process reasons are critical, said several participants. This requires developing a set of hypotheses to test model sensitivities to certain processes. Then, focused process studies could be conducted to test these hypotheses.
Process-Based Understanding
Many participants said that process-based understanding is critical for improving understanding of the mechanisms of Antarctic sea ice variability. Process studies also provide validation of global coupled models. Such process studies could be comprised of drifting stations, could take into account the seasonal cycle, and could be supplemented by autonomous devices and high-resolution passive microwave observations (e.g., of marginal ice zone, ice concentration, and floe size). This approach was successfully executed in autumn 2015 in the Arctic on the Office of Naval Research SeaState campaign and is planned for the Ross Sea in autumn 2017. Examples of key processes to address in any Antarctic process study include understanding the roles of
- Spring/summer heat and freshwater anomalies in impacting subsequent ice-edge advance and growth processes;
- Winds in amplifying or dampening the seasonal ice-ocean feedbacks;
___________________
12 Percentage of cloud cover year round.
- Ocean stratification in affecting these processes and thus the seasonal evolution of sea ice thickness;
- Concurrent changes in snow on sea ice in amplifying or dampening the response;
- Extreme environmental events in amplifying the impact or tipping the sea ice response;
- The marginal ice zone, interior, polynyas/coastal (e.g., polynya ice production rates) dynamics versus thermodynamics; and
- Waves in sea ice formation and melt.
Several participants also emphasized the importance of understanding the relationship between sea ice and shelf ice, in particular the role of sea ice in ocean–ice shelf interactions—for example, whether freshwater affects ice growth at the surface. It is also important to assess the response of sea ice to changes in coastal icescapes (polynyas, fast ice, glacier tongues, and iceberg fields), according to some participants.
Many workshop participants identified several regions of particular geographic interest for further study, particularly as part of a process study. The western Ross Sea is particularly anomalous, and scientists have not been able to identify any drivers for the trends there. The optimal time for studying this region is during sea ice advance. The Weddell Sea in summer is another outlier and candidate for further study.
Communicating to the Public
One theme that emerged from the discussion is the importance of communicating Antarctic sea ice trends to the public. Sea ice is an oft-referred symbol in public conversations about the evidence for human-caused climate warming. While the widely cited decline in Arctic sea ice is a powerful example of emerging climate change impacts, the modest sea ice increase in Antarctica, along with the record-breaking maximum years of 2012-2014, are occasionally and erroneously cited as evidence that human-caused climate change is not happening (Perovich, 2011).
Some participants said a schematic is needed to compare and contrast Arctic and Antarctic sea ice. Such a schematic could highlight the Antarctic’s large overlying atmospheric variability compared to the Arctic, the different geographies of the two regions, and the different ocean circulation and heat exchange processes. Dr. Katy Barnhart, Annenberg Public Policy Center, University of Pennsylvania, said that she is conducting research to assist the climate science community with communicating to the public that Antarctic sea ice increase does not
- demonstrate that climate change is not happening,
- indicate that concern about Arctic sea ice decline is unwarranted, or
- mean that climate models are not to be trusted.
The lack of a ready explanation of Antarctic sea ice variability and its drivers, as well as discrepancies between models and observations, contributes to a lingering public misconception
that recent trends in Antarctic sea ice disprove human-caused climate warming, or that contrasting trends in sea ice at the two poles somehow cancel each other out.
Given the importance of sea ice in the Earth system, many participants said that it is critical to advance understanding of the sea ice variability and change in the Southern Ocean surrounding Antarctica. Key observations, model impovements, and new research that were discussed during the workshop might clarify the processes and mechanisms that control observed sea ice variability and improve prediction of Antarctic sea ice.


