
Appendix A
Population Health Impact and Cost-Effectiveness of Chronic Hepatitis B Diagnosis, Care, and Treatment in the United States
Mehlika Toy
Asian Liver Center
Department of Surgery
Stanford University School of Medicine
ABSTRACT
To study the population health impact and cost-effectiveness of increasing chronic hepatitis B (CHB) diagnosis, care, and antiviral treatment on risks of hepatocellular carcinoma, cirrhosis, and hepatitis B virus (HBV)-related deaths, a Markov model was constructed with disease progression estimates, liver transplantation, and background mortality rates. Age-specific HBsAg prevalence was estimated by race, ethnicity, and nativity, and a 2015 study cohort was constructed from age-group prevalence of HBsAg, HBeAg, chronic active hepatitis, and cirrhosis. Among the estimated 1.29 million people (confidence interval [CI]: 855,000 to 2.02 million) or 0.4 percent of the population living with CHB in the United States in 2015, an estimated 25.8 percent or 333,978 would be eligible for antiviral treatment because they either have chronic active hepatitis or cirrhosis. The scenarios analyzed included Base 2015 current practice with diagnosis, care, and treatment rates at 34.6, 33.3, and 45 percent; Department of Health and Human Services (HHS) 2020 target increasing diagnosis to 66 percent; HHS 2020 target with increased care and treatment at 80 percent; hypothetical 80/80/80 scenario; World Health Organization (WHO) 2030 target at 90/90/80; and idealistic 100/100/100 scenario. If the current diagnosis, care, and treatment cascade remains unchanged, as many as 6 percent of the cohort would develop hepatocellular carcinoma, 10.3 percent cirrhosis, and 9.4 percent would die from HBV-related death by 2030. Compared to current practice, the HHS 2020 diagnosis target would only reduce death by 4.5 percent if care and treatment are not increased.
The hypothetical 80/80/80 scenario and WHO 2030 target will prevent new cases of hepatocellular carcinoma and cirrhosis, and HBV-related deaths in 15 years by 26, 34, and 36 percent and 35, 45, and 50 percent, respectively. Increasing CHB diagnosis, care, and antiviral treatment is cost-effective. The incremental cost-effectiveness ratio (ICER) of the hypothetical and WHO 2030 target are $17,748 to $43,745 and $26,242 to $60,147, respectively, compared to current practice.
INTRODUCTION
Viral hepatitis is increasingly recognized as a leading cause of death and disability worldwide. In 2013 viral hepatitis took the lives of about 1.45 million people and was the seventh leading cause of death in the world (Stanaway et al., 2016). Chronic infection with HBV and hepatitis C virus (HCV) accounts for 95 percent of the deaths and causes 80 percent of hepatocellular carcinoma, the most common type of liver cancer worldwide. Among the estimated 400 million people living with chronic viral hepatitis, 250 million have CHB, which carries a 15 to 25 percent risk of premature death from liver cirrhosis and liver cancer without care and antiviral treatment. In 2016, in response to the 2030 Agenda for Sustainable Development to combat viral hepatitis, the WHO issued the first ever global health sector strategy on viral hepatitis (WHO, 2016). Apart from setting important prevention and vaccination targets, the strategy’s global targets for CHB aimed to have a 30 percent diagnosis rate, 5 million people on treatment, and a 10 percent reduction in liver-related deaths by 2020, with the ultimate goal of a 90 percent diagnosis rate, 80 percent treatment rate of eligible persons for treatment, and 65 percent reduction in liver-related deaths by 2030.
In the United States, there are an estimated 850,000 to 2.2 million people living with CHB according to the Centers for Disease Control and Prevention (CDC) (CDC, 2015). After the successful adoption of the hepatitis B vaccine into the routine infant immunization schedule, CHB infection acquired from domestic infection is uncommon. By CDC estimates, as many as 53,800 CHB cases were imported to the United States yearly between 2004 and 2008 through immigration and about 95 percent of new cases of CHB infection in the United States are imported (Mitchell et al., 2011). Persons born in high endemic regions such as Asia and Africa and countries with a prevalence of CHB infection of 2 percent or greater are at the highest risk for chronic infection (Din et al., 2011; Kowdley et al., 2012). Asian Americans alone account for over half of the CHB cases (Roberts et al., 2016). At present, there are no CHB curative therapies. However, diagnosis, monitoring, and viral suppression with recommended antiviral therapy when indicated can reduce the risk of cirrhosis, hepatocel-
lular carcinoma, and liver-related death (Lok et al., 2016; Terrault et al., 2016). Hutton et al. found it is cost effective to screen adult Asian Americans for CHB, treat those who are chronically infected and ring vaccinate their unprotected household contacts or sex partners (Hutton et al., 2007). Since 2014, USPSTF1 recommended routine hepatitis B screening beyond pregnant women to include persons born in countries with CHB prevalence of 2 percent or greater (USPSTF, 2016). Routine hepatitis B screening in the primary care setting in accordance to USPSTF recommendation also became officially covered by the Centers for Medicare & Medicaid Services in 2016 (CMS, n.d.). In the United States, only an estimated one-third of those living with CHB are diagnosed (Lin et al., 2007), and among them, a third are receiving care (Hu et al., 2013) and 45 percent of those who are eligible for treatment based on treatment guidelines are receiving treatment (Kim et al., 2014). One of the four overarching goals of the HHS Action Plan for the Prevention, Care, and Treatment of Viral Hepatitis is to double the proportion of persons aware of their CHB infection from 33 to 66 percent by 2020 (HHS, 2015).
The National Academies of Sciences, Engineering, and Medicine convened a consensus committee to analyze the question of hepatitis B and C elimination in the United States. The committee concluded in its phase one report (NASEM, 2016) published in 2016 that hepatitis B and C could both be eliminated as public health problems, but that would take considerable will and resources; disease control might be more manageable in the short term. The aim of this study is to model the potential population health impact of increasing CHB diagnosis, care, and treatment in reducing the risks of hepatocellular carcinoma, cirrhosis, and HBV-related deaths in the United States and the cost-effectiveness of the various target scenarios compared with current practice.
MATERIALS AND METHODS
Overview
We developed a Markov model to simulate long-term outcomes, such as cirrhosis, hepatocellular carcinoma, and CHB-related death, under each scenario. Patients begin the simulation in one of the starting states (see Figure A-1): inactive CHB, active CHB HBeAg+, active CHB HBeAg–, and cirrhosis. The proportion of patients in each state depends on the rates for each scenario tested and whether there is a larger proportion of patients who remain undiagnosed and will follow the natural history of disease.
___________________
1 Officially, the U.S. Preventive Services Task Force.
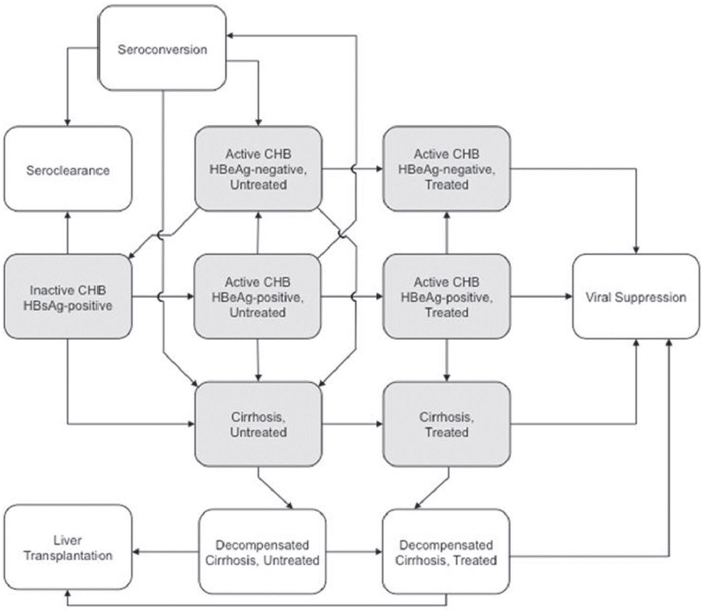
NOTES: Starting health states in the Markov model are Inactive HBsAg+, Active chronic hepatitis B HBeAg+ and HBeAg–, and Cirrhosis. The model assumes that individuals in the decompensated health state are being treated with antivirals depending on the scenario they are in. All health states are subject to background mortality and death due to hepatocellular carcinoma. CHB = chronic hepatitis B; HBeAg = hepatitis B e antigen; HBsAg = hepatitis B surface antigen.
Following the recent AASLD2 guidelines (Terrault et al., 2016), disease activity is defined by an elevation of ALT >2 ULN or evidence of significant histological disease plus elevated HBV DNA above 2,000 IU/mL for HBeAg– and above 20,000 IU/mL for HBeAg+. In the model once people with inactive CHB develop active hepatitis, depending on the level of care and treatment they receive, they would be less likely to develop liver-related complications such as hepatocellular carcinoma and cirrhosis.
___________________
2 Officially, the American Association for the Study of Liver Diseases.
Study Cohort
The population in the United States in 2015 by age, race, ethnicity, and nativity was obtained from the Census Bureau (Census Bureau, n.d.). The 2015 CHB study cohort was estimated based on race, ethnicity and nativity, and age-specific HBsAg prevalence studies for the various racial and ethnic groups in the United States (Din et al., 2011; Hyun et al., 2016; Jung et al., 2016; Lin et al., 2007; Roberts et al., 2016; Shuler et al., 2009; Tanaka et al., 2011; Ugwu et al., 2008). CHB disease activity was categorized by HBeAg+ rate of 26.3 percent and chronic active hepatitis in 14 percent who are HBeAg+ and in 26 percent who are HBeAg–, based on data from the Hepatitis B Research Network study (Ghany et al., 2015) that collected data on clinical characteristics of adult CHB infections who were enrolled in a multisite North America cohort study. The proportion of the CHB cohort with cirrhosis was based on studies by Iloeje et al. (2006) and Kim et al. (2014). Estimated new cases of CHB due to migration of Asian and Pacific Islander and black people into the United States from year 2015 to 2060 was calculated from the U.S. census migration projection estimates (Census Bureau, n.d.) by nativity and race/ethnicity.
Model
The Markov model was developed using TreeAge Pro 2014 (TreeAge Software, Williamstown, Massachusetts). The model was adapted from our previous study on the population health impact and cost-effectiveness of CHB treatment in Shanghai, China (Toy et al., 2014). Transitions in the Markov model were calculated in 1-year cycles and were governed by disease progression estimates (see Table A-1) and treatment-related estimates (see Table A-2). The natural history disease progression estimates were derived from recent cohort studies and meta-analysis mainly from North America (Campsen et al., 2013; Chen et al., 2010; Chu and Liaw, 2007, 2009; Fattovich et al., 2008; Kanwal et al., 2006; Lin et al., 2005; Raffetti et al., 2016; Thiele et al., 2014). Treatment effectiveness estimates were expressed as reductions in progression risks and are shown in Table A-2 (Heathcote et al., 2011; Lok et al., 2016; Papatheodoridis et al., 2015; Tenney et al., 2009; Wong et al., 2013). The nucleoside analogue entecavir and nucleotide analogue tenofovir are both highly potent antivirals and have high barriers to viral resistance (Lok et al., 2016; Marcellin et al., 2013). We assumed that the effectiveness for both these drugs were similar and are equally effective in prevention progression from chronic active hepatitis to cirrhosis in both HBeAg+ or HBeAg– patients and they are used as first line treatment in the United States. The model also assumed that the few patients who developed drug resistance to entecavir will be switched to
TABLE A-1 Annual Transition Estimates for Natural History of Chronic Hepatitis B by Initial State
| Transition | Age Group | Estimate (%) | Range | References |
|---|---|---|---|---|
| From inactive, HBsAg+ | ||||
| To seroclearance | <30 years | 0.8 | (0.38-1.15) | Chu and Liaw, 2007 |
| 30-39 years | 1.1 | (0.53-1.60) | ||
| 40-49 years | 1.7 | (0.82-2.47) | ||
| 50+ years | 1.8 | (0.91-2.74) | ||
| To active CHB, HBeAg+ | <30 years | 0.9 | (0.4-1.3) | Chu and Liaw, 2007, 2009 |
| 30-39 years | 1.4 | (0.7-2.1) | ||
| 40-49 years | 2.8 | (1.4-4.1) | ||
| 50+ years | 2 | (1.0-3.0) | ||
| To cirrhosis | <30 years | 0.038 | (0.019-0.057) | Chu and Liaw, 2009 |
| 30-39 years | 0.049 | (0.024-0.073) | ||
| 40-49 years | 0.068 | (0.034-0.102) | ||
| 50+ years | 0.15 | (0.052-0.202) | ||
| To HCC | All ages | 0.17 | (0.02-0.62) | Raffetti et al., 2016 |
| From active CHB, HBeAg+ | ||||
| To seroconversion | All ages | 7 | (2.0-23) | Kanwal et al., 2006 |
| To active CHB, HBeAg– | All ages | 1.9 | (1.0-3.8) | Fattovich et al., 2008 |
| To cirrhosis | All ages | 2.4 | (2.1-2.6) | Lin et al., 2005 |
| To HCC | All ages | 0.48 | (0.22-0.91) | Raffetti et al., 2016 |
| To HBV-related death | All ages | 0.11 | (0.09-0.14) | Thiele et al., 2014 |
| From active CHB, HBeAg– | ||||
| To inactive CHB, HBsAg+ | All ages | 1.6 | (0.0-11) | Kanwal et al., 2006 |
| To cirrhosis | All ages | 2.4 | (1.3-3.4) | Lin et al., 2005 |
| To HCC | All ages | 0.48 | (0.22-0.91) | Raffetti et al., 2016 |
| To HBV-related death | All ages | 0.11 | (0.09-0.14) | Thiele et al., 2014 |
| From seroconversion | Chen et al., 2010 | |||
| To active CHB, HBeAg– | <30 years | 2.9 | (1.4-4.3) | |
| 31-40 years | 3.8 | (1.9-5.7) | ||
| 40+ years | 8.6 | (4.3-12.9) | ||
| Transition | Age Group | Estimate (%) | Range | References |
|---|---|---|---|---|
| To cirrhosis | <30 years | 0.2 | (0.1-0.3) | |
| 31-40 years | 1 | (0.5-1.5) | ||
| 40+ years | 4.2 | (2.1-6.3) | ||
| To HCC | <30 years | 0.1 | (0.05-0.15) | |
| 31-40 years | 0.2 | (0.1-0.3) | ||
| 40+ years | 0.6 | (0.3-0.9) | ||
| To seroclearance | <30 years | 0.8 | (0.4-1.2) | |
| 31-40 years | 0.7 | (0.3-1.0) | ||
| 40+ years | 0.3 | (0.1-0.4) | ||
| From seroclearance | ||||
| To HCC | All ages | 1.55 | (0.092-2.61) | Liu et al., 2012 |
| From cirrhosis | ||||
| To decompensated cirrhosis | All ages | 3.9 | (3.2-4.6) | Lin et al., 2005 |
| To HCC | All ages | 3.16 | (2.58-3.74) | Thiele et al., 2014 |
| To HBV-related death | All ages | 4.89 | (3.16-6.63) | Thiele et al., 2014 |
| From decompensated cirrhosis | ||||
| To liver transplantation | All ages | 1.2 | (1.0-3.0) | HRSA, n.d. |
| To HCC | All ages | 7.1 | (3.5-10.0) | Lin et al., 2005 |
| To HBV-related death | All ages | 15 | (9.9-20.0) | Lin et al., 2005 |
| From HCC | ||||
| To liver transplantation | All ages | 7 | (5.0-9.0) | HRSA, n.d. |
| To HBV-related death | All ages | 35.1 | (18.0-45.0) | Hutton et al., 2007 |
| From liver transplantation | Campsen et al., 2013 | |||
| To HBV-related death year 1 | All ages | 5.7 | (4.5-6.8) | |
| To HBV-related death year 3 | All ages | 12.9 | (10.3-15.5) | |
| To HBV-related death year 5 | All ages | 14.7 | (11.8-17.6) | |
NOTE: CHB = chronic hepatitis B; HBeAg = hepatitis B e antigen; HBsAg = hepatitis B surface antigen; HBV = hepatitis B virus; HCC = hepatocellular carcinoma; HCV = hepatitis C virus.
TABLE A-2 Annual Transition Estimates for Treatment Strategies with First Line Antiviral Therapy
| Transition | Annual probability, % (range) | Reference |
|---|---|---|
| From active CHB, long-term treatment | ||
| To active CHB, drug resistant | 0.012 (0.0-0.01) | Heathcote et al., 2011; Lok et al., 2016; Tenney et al., 2009 |
| To HCC | 0.2 (0.1-0.5) | Papatheodoridis et al., 2015; Wong et al., 2013 |
| From cirrhosis, long-term treatment | ||
| To cirrhosis, drug resistant | 0.012 (0.0-0.01) | Heathcote et al., 2011; Lok et al., 2016; Tenney et al., 2009 |
| To decompensated cirrhosis | 1.8 (0.9-3.8) | Wong et al., 2013 |
| To HCC | 1.6 (0.8-3.2) | Papatheodoridis et al., 2015; Wong et al., 2013 |
| To HBV-related death | 2.4 (1.6-3.3) | Papatheodoridis et al., 2015; Wong et al., 2013 |
| From decompensated cirrhosis, long-term treatment | ||
| To HCC | 3.5 (1.7-5.0) | Papatheodoridis et al., 2015; Wong et al., 2013 |
| To HBV-related death | 7.5 (4.9-10.0) | Papatheodoridis et al., 2015; Wong et al., 2013 |
NOTE: CHB = chronic hepatitis B; HBV = hepatitis B virus; HCC = hepatocellular carcinoma.
tenofovir and continue treatment. The primary goal of antiviral treatment is to suppress replication of HBV, thereby preventing progression to cirrhosis and reducing the risk of hepatocellular carcinoma. Based on recent findings, we assumed that it was possible to develop hepatocellular carcinoma while on treatment, but with a 50 percent reduction in the rate decrease from natural history (Arends et al., 2015; Marcellin et al., 2013). Causes of death that were not related to CHB were included in the model, based on age-specific mortality rates from the National Vital Statistics Report, United States Life Tables (Arias, 2015). Annual probabilities of receiving a liver transplant for decompensated cirrhosis and hepatocellular carcinoma if CHB-infected (1.2 and 7 percent, respectively) were calculated based on data from the Organ Procurement and Transplantation Network (OPTN) (HRSA, n.d.). If progression rates were reported, these were transformed
into annual probabilities using a standard formula (P=1-e–r×t), where P is the probability, e is the base of the natural logarithm, r is the event rate, and t is the time interval.
Cost and Utility Estimates
The annual wholesale prices for entecavir 0.5mg were $8,400 for the generic drug (range $4,740 to $12,796) and $16,464 for the brand drug, and tenofovir 300mg (only brand available) was $11,964 (Truven Health Analytics, 2016). We obtained medical management costs for CHB, cirrhosis, decompensated cirrhosis, and hepatocellular carcinoma from Liu et al. (Liu et al., 2012), liver transplantation cost from OPTN, and annual monitoring cost from Hutton et al. (Hutton et al., 2007) (see Table A-3). All costs were adjusted for inflation using the U.S. consumer price index to reflect 2015 U.S. dollars (Bureau of Labor Statistics, n.d.). An assumption in the model pertaining to costs was that patients achieving seroconversion from the CHB active state continued to incur annual costs for CHB management. The utilities were obtained from a health state utility and quality of life study on CHB (Woo et al., 2012) (see Table A-3). Outcomes included 15 year and lifetime disease and HBV-related death risk, discounted costs, quality-adjusted life years (QALYs) gained, and incremental cost-effectiveness ratios (ICERs) for each scenario. Results are presented as weighted averages over age. All costs and QALYs were discounted at a rate of 3 percent per year.
Scenarios
The following diagnosis, care, and treatment scenarios were examined (see Table A-4):
- Base 2015 Current Practice: According to the literature we assumed that 34.6 percent of CHB is diagnosed in the United States (Lin et al., 2007), 33.3 percent receive care (Hu et al., 2013), and 45 percent receive treatment if eligible according to treatment guidelines (Kim et al., 2014), where 85 percent adhere to treatment (Chotiyaputta et al., 2011). We assume here that 35.1 percent of patients adhere to monitoring recommendations, which has the observed level of adherence to monitoring at least once every 12 months (Juday et al., 2011).
- HHS 2020 Screening Target: One of the national goals (HHS, 2015) for reducing the burden of viral hepatitis by 2020 was to increase the proportion of persons who are aware of their hepatitis B infection from 33 to 66 percent. In this scenario we examined the
TABLE A-3 Cost and Utility Estimates
| Variable | Base Case | Range |
|---|---|---|
| Cost (U.S. dollars) $ | ||
| Entecavir (0.5mg) (generic) Entecavir (0.5mg) |
$8,400 $16,464 |
$4,740-$12,796 $16,464-$19,752 |
| Tenofovir (300mg) | $11,964 | $11,964-$14,364 |
| Annual monitoring | $710 | $347-$1,390 |
| Chronic hepatitis B | $1,483 | $154-$5,956 |
| Cirrhosis | $4,414 | $154-$5,408 |
| Decompensated cirrhosis | $11,690 | $3,735-$28,256 |
| Hepatocellular carcinoma | $46,538 | $22,443-$67,321 |
| Liver transplantation 1st year | $159,220 | $127,376-$191,064 |
| Liver transplantation 2nd year | $22,820 | $18,256-$27,384 |
| Health state utilities | ||
| Active CHB | 0.85 | (0.80-0.92) |
| Cirrhosis | 0.87 | (0.78-0.88) |
| Inactive CHB | 0.95 | (0.90-0.99) |
| Decompensated cirrhosis | 0.82 | (0.49-0.82) |
| Hepatocellular carcinoma | 0.84 | (0.77-0.85) |
| Liver transplantation | 0.86 | (0.72-0.84) |
| Seroclearance | 0.99 | (0.90-1.00) |
| Viral suppression | 1 | (0.95-1.00) |
NOTES: All costs are adjusted for inflation using the U.S. consumer price index to reflect 2015 U.S. dollars. CHB = chronic hepatitis B.
SOURCES: Hutton et al., 2007; Liu et al., 2012; Truven Health Analytics, 2016. Red Book drug prices accessed January 13, 2017.
-
impact of only increasing diagnosis to 66 percent, but care, treatment, adherence to monitoring, and treatment remain unchanged.
- HHS 2020 Target with Improved Care and Treatment: In this hypothetical scenario we increased the rates for care and treatment by 80 percent along with the 66 percent of diagnosis target. Adherence to monitoring and treatment was kept at 35.1 and 85 percent, respectively.
- Hypothetical scenario: In this scenario, we assume that the diagnosis, care, treatment, and adherence to monitoring increased to 80 percent and adherence to treatment to 95 percent.
- WHO 2030 Target: The WHO has made viral hepatitis a priority
TABLE A-4 Scenario Analysis Rates
| Scenario | Diagnosed | Received HBV Care | Treatment Rate Among Treatment Eligible Patients | Adherence to Monitoring | Adherence to Treatment |
|---|---|---|---|---|---|
| Natural History | — | — | — | — | — |
| Current Practice | 34.6%a | 33.3%b | 45%c | 35.1%d | 85%e |
| HHS 2020 Target | 66% | 33.3% | 45% | 35.1% | 85% |
| HHS 2020 Target + Improved Rx | 66% | 80% | 80% | 35.1% | 85% |
| Hypothetical Scenario | 80% | 80% | 80% | 80% | 95% |
| WHO 2030 Target | 90% | 90% | 80% | 100% | 100% |
| Idealistic (Utopian) | 100% | 100% | 100% | 100% | 100% |
NOTE: HBV = hepatitis B virus; HHS = Department of Health and Human Services; WHO = World Health Organization.
-
and has set targets to eliminate viral hepatitis as a public health threat by year 2030 (WHO, 2016). We adopted these targets into this scenario where diagnosis and care is increased to 90 percent and treatment to 80 percent and assumed 100 percent adherence to monitoring and treatment.
- Idealistic scenario: In this scenario we examined the impact if that all (100 percent) CHB cases are diagnosed, cared for and treated, and adhere to monitoring and treatment.
Sensitivity Analysis
Sensitivity analyses were performed using the low and high ranges of the transition estimates (see Tables A-1, A-2, and A-3). The best case scenario was assessed by applying the low ranges to the estimate of disease progression and costs and applying the low estimates to the utilities. The worst case scenario was assessed by applying the high ranges to the estimates of disease progression and costs and applying the low estimates to the utilities. We also performed a probabilistic sensitivity analysis to examine the effect of uncertainty around the cost-effectiveness outcomes of the various scenarios.
RESULTS
In 2015, an estimated 1.29 million (CI: 855,000 to 2.02 million) or 0.40 percent (CI: 0.27 to 0.63 percent) of the population in the United States lived with CHB, with the highest prevalence among ages 30 to 59 years (see Table A-5). Among them, 25.8 percent or 333,978 would be eligible for antiviral treatment because they either have chronic active hepatitis (295,556 [47,638 HBeAg+ and 247,918 HBeAg–]) or cirrhosis (38,422). HBsAg prevalence estimates by race and nativity are shown in Table A-6. An estimated 72.6 percent were foreign born Asian and Pacific Islander and black. Based on census projected migration data of black and Asian and Pacific Islander to the United States in the next 15 years, the number of CHB cases is estimated to increase by 23,370 (CI: 17,800 to 31,660) annually due to migration alone. By year 2030, the number of people living with CHB in the United States is projected to increase to an estimated 1.64 million. Table A-7 shows the baseline population distributions for the entry of the Markov model.
If the current diagnosis, care, and treatment practices remain unchanged, as many as 6 percent of the 2015 CHB cohort will have developed hepatocellular carcinoma, 10.31 percent will have developed cirrhosis, and 9.40 percent will have died from HBV-related deaths by year 2030 (see Table A-8). Doubling the current diagnosis rate to 66 percent (HHS 2020
TABLE A-5 Age-Specific Population Level Prevalence Estimate of Chronic Hepatitis B in the United States in 2015
| Age Group (years) | HBsAg+ | CI (lower bound) | CI (upper bound) |
|---|---|---|---|
| 0-19 | 79,016 (0.10%) | 52,597 (0.06%) | 141,759 (0.17%) |
| 20-29 | 160,806 (0.36%) | 93,926 (0.21%) | 270,006 (0.60%) |
| 30-39 | 240,381 (0.57%) | 161,489 (0.38%) | 356,986 (0.85%) |
| 40-49 | 267,593 (0.65%) | 187,482 (0.46%) | 387,991 (0.94%) |
| 50-59 | 244,119 (0.55%) | 173,398 (0.39%) | 348,416 (0.79%) |
| 60-69 | 182,157 (0.52%) | 116,601 (0.33%) | 312,350 (0.89%) |
| 70-79 | 81,263 (0.41%) | 50,177 (0.26%) | 127,554 (0.65%) |
| 80+ | 38,463 (0.32%) | 19,492 (0.16%) | 73,189 (0.61%) |
| Total | 1,293,798 (0.40%) | 855,162 (0.27%) | 2,018,251 (0.63%) |
NOTE: CHB = chronic hepatitis B; CI = confidence interval; HBeAg = hepatitis B e antigen; HBsAg = hepatitis B surface antigen.
target) without an associated increase in care and treatment would only prevent new cases of hepatocellular carcinoma, cirrhosis, and HBV-related deaths by 2.7, 1.6, and 4.5 percent, respectively, by 2030 (see Table A-9). However, if the HHS 2020 target is accompanied with an increased care and treatment rate of 80 percent, then it would prevent hepatocellular carcinoma, cirrhosis, and HBV-related death by 12, 12.6, and 19 percent, respectively. Compared to the current practice, the hypothetical scenario and WHO 2030 target will prevent new cases of hepatocellular carcinoma, cirrhosis, and HBV-related deaths by 26, 34, and 36 percent and 35, 45, and 50 percent, respectively. And if everyone with chronic HBV is diagnosed, receiving care and treatment (the idealistic scenario), it will prevent 48 and 63 percent of new cases of hepatocellular carcinoma and cirrhosis, respectively, and 70 percent of HBV-related deaths by 2030. In the current practice, the 2015 cohort’s lifetime risk for hepatocellular carcinoma, cirrhosis, and HBV-related death risk is 14, 22.5, and 26 percent (see Table A-10), respectively. If diagnosis, care, and treatment rates are increased to 90, 90, and 80 (WHO 2030 target), lifetime risk can drop from 14 to 9 percent for hepatocellular carcinoma, 22.5 to 16 percent for cirrhosis, and 26 to 12 percent for HBV-related death.
The lifetime cost of treatment including drug cost for the current practice is $48,774 and $50,747 with generic and brand entecavir, respectively;
TABLE A-6 Age-Specific Estimates of 1.29 Million Chronic Hepatitis B Cases in the United States by Race/Ethnicity and Nativity in 2015
| Age Group | All | White | Hispanic | Black | Asian and Pacific Islander | ||
|---|---|---|---|---|---|---|---|
| U.S. + Foreign Born | U.S. + Foreign Born | U.S. | Foreign Born | U.S. | Foreign Born | ||
| 0-19 | 79,015 | 15,595 | 4,336 | 2,939 | 40,670 | 7,236 | 8,239 |
| 20-59 | 912,898 | 109,167 | 88,805 | 20,576 | 123,515 | 26,327 | 544,508 |
| ≥60 | 301,880 | 42,302 | 23,499 | 7,973 | 50,981 | 6,302 | 170,823 |
| Total | 1,293,793 | 167,068 (12.9%) |
116,640 (9.0%) |
31,488 (2.4%) |
215,166 (16.6%) |
39,865 (3.1%) |
723,570 (56.0%) |
TABLE A-7 Baseline Population Distribution for the Entry of the Markov Model of Chronic Hepatitis B in the United States
| Model Entry Health State | Scenario | |||||
|---|---|---|---|---|---|---|
| Current Practice D35/C33/T45 | HHS 2020 Target D66/C33/T45 | HHS + Improved Rx D66/C80/T80 | Hypothetical Scenario D80/C80/T80 | WHO 2030 Target D90/C90/T80 | Idealistic D100/C100/T100 | |
| Inactive (monitor) | 8.9% | 17.0% | 40.7% | 49.4% | 62.5% | 77.2% |
| Active HBeAg+ treatment | 0.2% | 0.3% | 1.4% | 1.6% | 2.1% | 3.2% |
| Active HBeAg– treatment | 0.9% | 1.6% | 7.0% | 8.5% | 10.8% | 16.7% |
| Cirrhosis treatment | 0.2% | 0.3% | 1.3% | 1.5% | 1.9% | 3.0% |
| Natural history inactive | 68.3% | 60.2% | 36.4% | 27.8% | 14.7% | 0.0% |
| Natural history active HBeAg+ | 3.0% | 2.9% | 1.9% | 1.6% | 1.1% | 0.0% |
| Natural history active HBeAg– | 15.8% | 15.0% | 9.6% | 8.1% | 5.9% | 0.0% |
| Natural history cirrhosis | 2.8% | 2.7% | 1.7% | 1.4% | 1.0% | 0.0% |
NOTES: D35/C33/T45, 35% diagnosed, 33% in care, 45% in treatment when treatment is appropriate; D66/C33/T45, 66% diagnosed, 33% in care, 45% in treatment when treatment is appropriate; D66/C80/T80, 66% diagnosed, 80% in care, 80% in treatment when treatment is appropriate; D80/C80/T80, 80% diagnosed, 80% in care, 80% in treatment when treatment is appropriate; D90/C90/T80, 90% diagnosed, 90% in care, 80% in treatment when treatment is appropriate; D100/C100/T100, 100% diagnosed, 100% in care, 100% in treatment when treatment is appropriate. HBeAg = hepatitis B e antigen; HHS = Department of Health and Human Services; WHO = World Health Organization.
TABLE A-8 Cumulative Risks of Hepatocellular Carcinoma, Cirrhosis, and HBV-Related Deaths by 2030 in the 2015 Cohort of Chronic HBV-Infected Persons in the United States
| Cumulative Risk | Scenario | |||||
|---|---|---|---|---|---|---|
| Current Practice D35/C33/T45 | HHS 2020 Target D66/C33/T45 | HHS + Improved Rx D66/C80/T80 | Hypothetical Scenario D80/C80/T80 | WHO 2030 Target D90/C90/T80 | Idealistic D100/C100/T100 | |
| Hepatocellular carcinoma | 6.00% | 5.84% | 5.27% | 4.46% | 3.91% | 3.14% |
| Cirrhosis | 10.31% | 10.15% | 9.01% | 6.84% | 5.70% | 3.79% |
| HBV-related death | 9.40% | 8.98% | 7.60% | 5.98% | 4.66% | 2.84% |
NOTE: HBV = hepatitis B virus; HHS = Department of Health and Human Services; WHO = World Health Organization.
TABLE A-9 Cumulative Reduction in Hepatocellular Carcinoma, Cirrhosis, and HBV-Related Deaths in the 2015 Cohort of Chronic HBV-Infected Persons with Various Improved Diagnosis, Care, and Treatment Scenarios Compared with the Base Scenario (D35/C33/T45) in 15 Years
| Cumulative Reduction | Scenario | ||||
|---|---|---|---|---|---|
| HHS 2020 Target D66/C33/T45 | HHS + Improved Rx D66/C80/T80 | Hypothetical Scenario D80/C80/T80 | WHO 2030 Target D90/C90/T80 | Idealistic D100/C100/T100 | |
| Hepatocellular carcinoma cases | 2.66% | 12.16% | 25.66% | 34.83% | 47.66% |
| Cirrhosis cases | 1.55% | 12.60% | 33.65% | 44.71% | 63.23% |
| HBV-related death | 4.46% | 19.14% | 36.38% | 50.42% | 69.78% |
NOTE: HBV = hepatitis B virus; HHS = Department of Health and Human Services; WHO = World Health Organization.
TABLE A-10 Lifetime Risks of Hepatocellular Carcinoma, Cirrhosis, and HBV-Related Deaths and Discounted Costs, QALYs, and ICERs of Each Target Scenario
| Lifetime | Scenario | |||||
|---|---|---|---|---|---|---|
| Current Practice D35/C33/T45 | HHS 2020 Target D66/C33/T45 | HHS + Improved Rx D66/C80/T | Hypothetical Scenario 80 D80/C80/T80 | WHO 2030 Target D90/C90/T80 | Idealistic D100/C100/T100 | |
| Hepatocellular carcinoma risk | 14.03% | 13.74% | 12.59% | 10.65% | 9.05% | 7.26% |
| Cirrhosis risk | 22.45% | 22.35% | 21.24% | 17.31% | 15.68% | 13.22% |
| HBV-related death | 25.85% | 24.96% | 21.69% | 16.81% | 12.31% | 7.32% |
| QALYs | ||||||
| Total cohort | 17.97 | 18.09 | 18.49 | 18.98 | 19.45 | 20.01 |
| Active CHB subgroup | 15.53 | 15.82 | 17.05 | 17.61 | 18.28 | 19.91 |
| Cirrhosis subgroup | 7.42 | 7.92 | 11.15 | 12.62 | 14.55 | 18.66 |
| Costs for total cohort ETV (generic) | $48,774 | $52,426 | $64,233 | $66,699 | $87,612 | $102,723 |
| Costs for total cohort ETV | $50,747 | $58,870 | $85,854 | $94,929 | $139,765 | $174,382 |
| Costs for total cohort TDF | $49,668 | $55,274 | $73,789 | $79,176 | $110,662 | $134,394 |
| ICER for total cohort (compared to current practice) ETV (generic) | — | $30,433 | $29,729 | $17,748 | $26,242 | $26,446 |
| ICER for total cohort (compared to current practice) ETV | — | $67,692 | $67,513 | $43,745 | $60,147 | $60,605 |
| ICER for total cohort (compared to current practice) TDF | — | $46,717 | $46,387 | $29,216 | $41,212 | $41,532 |
NOTE: CHB = chronic hepatitis B; ETV = entecavir; HBV = hepatitis B virus; HHS = Department of Health and Human Services; ICER = incremental cost-effectiveness ratio; QALY = quality-adjusted life year; TDF = tenofovir; WHO =World Health Organization.
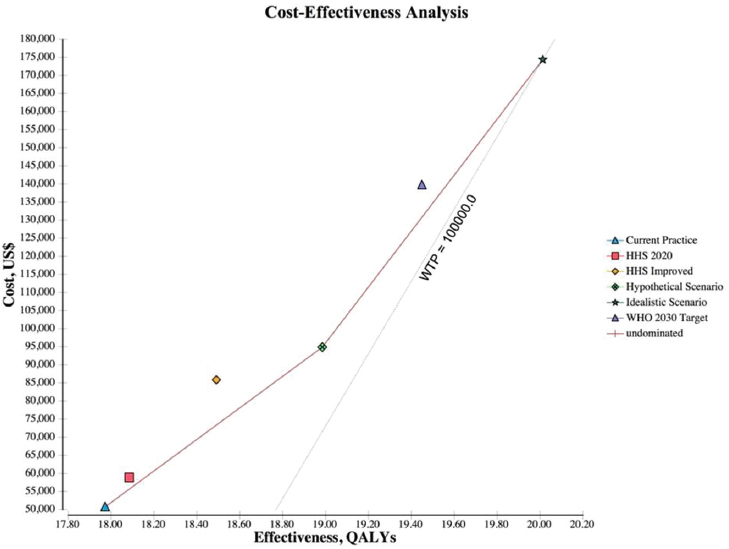
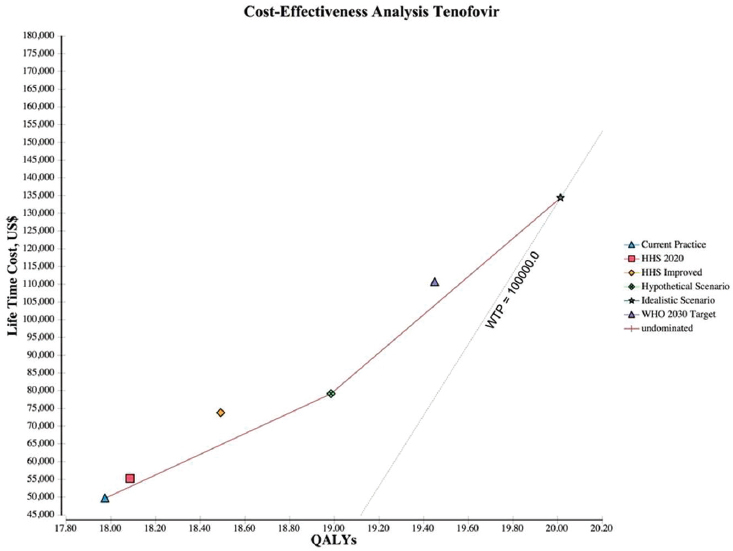
NOTES: The graph plots the incremental discounted life-time costs (y-axis) and the incremental discounted QALYs (x-axis) for each scenario. The solid line represents the cost-effectiveness frontier, those strategies that are potentially cost-effective, and the dotted line represents the WTP, which is a $100,000/QALY. HHS = Department of Health and Human Services; QALY = quality-adjusted life year; WHO = World Health Organization; WTP = willingness to pay.
and $49,668 with tenofovir, and results in 17.97 discounted QALYs per patient (see Table A-10). The hypothetical scenario and WHO 2030 target cost $66,699 to $94,929 and $87,612 to $139,765, respectively. Increasing the cascade of diagnosis, care, and treatment is cost-effective across all the scenarios examined. The ICER for the hypothetical, WHO 2030, and idealistic scenario are $17,748 to $43,745, $26,242 to $60,147, and $26,446 to $60,605, respectively. Figure A-2 shows the cost-effectiveness frontier for all scenarios, those scenarios that are potentially cost-effective depending on the willing to pay per QALY. The hypothetical scenario was the lowest cost alternative and dominated HHS 2020 target and HHS improved scenarios. The idealistic scenario was the next best option, which
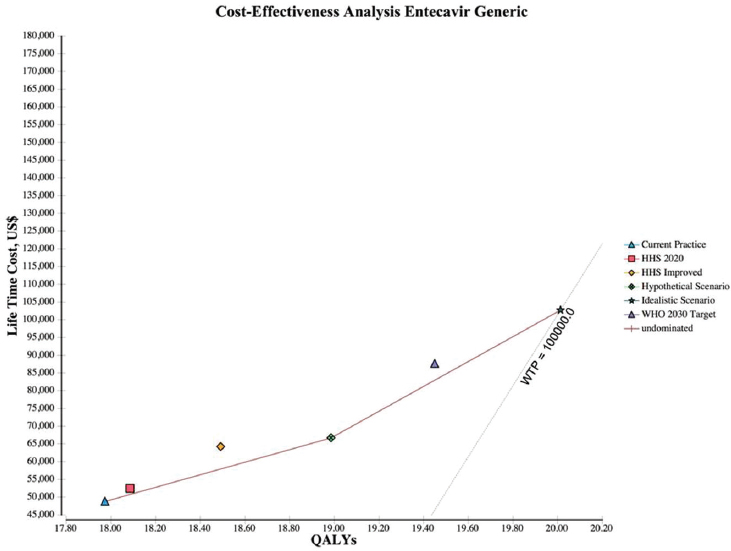
NOTES: The graph plots the incremental discounted life-time costs (y-axis) and the incremental discounted QALYs (x-axis) for each scenario. The solid line represents the cost-effectiveness frontier, those strategies that are potentially cost-effective, and the dotted line represents the WTP, which is a $100,000/QALY. HHS = Department of Health and Human Services; QALY = quality-adjusted life year; WHO = World Health Organization; WTP = willingness to pay.
adds 1.05 QALYs over the hypothetical scenario and 2.04 QALYs over the current practice at a cost of $26,446 for entecavir generic (see Figure A-3), $60,605 for entecavir brand (see Figure A-4), and $41,532 for tenofovir (see Figure A-5) per QALY.
SENSITIVITY ANALYSIS
We performed one-way sensitivity analysis over estimated data ranges for all variables. Monte Carlo probabilistic analysis recalculates expected values in the Markov model numerous times and is used to understand the uncertainties on the model results. The results were sensitive to several
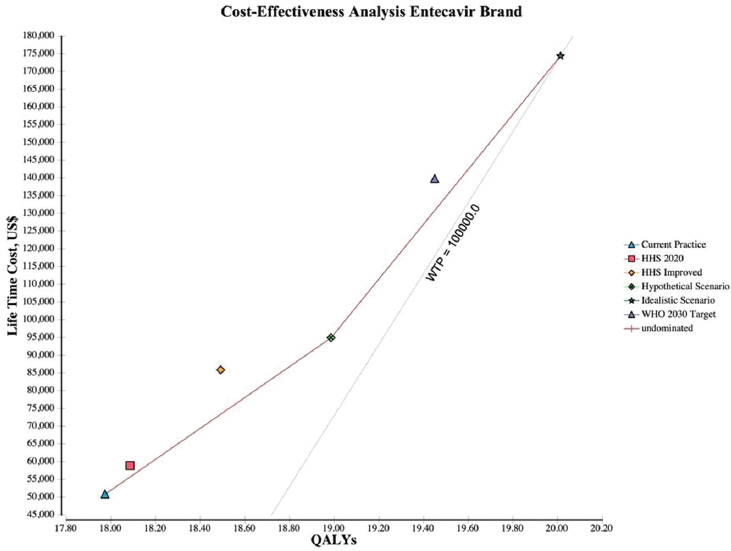
NOTES: The graph plots the incremental discounted life-time costs (y-axis) and the incremental discounted QALYs (x-axis) for each scenario. The solid line represents the cost-effectiveness frontier, those strategies that are potentially cost-effective, and the dotted line represents the WTP, which is a $100,000/QALY. HHS = Department of Health and Human Services; QALY = quality-adjusted life year; WHO = World Health Organization; WTP = willingness to pay.
variables, including the utility of CHB, cirrhosis, and seroclearance (loss of HBsAg), and the probability of transitioning from inactive CHB to hepatocellular carcinoma, from seroclearance to hepatocellular carcinoma, from inactive to active CHB, from inactive CHB to seroclearance, from active hepatitis to hepatocellular carcinoma, and from hepatocellular carcinoma to HBV-related death (see Figures A-6, A-7, A-8, A-9, A-10, and A-11). Sensitivity analysis of the health outcome and lifetime costs, QALYs and ICERs associated with the various increased diagnosis, care, and treatment scenarios is shown in Table A-11 and Table A-12. The sensitivity analysis showed the risk of the 2015 cohort for HBV-related death by 2030 can be
NOTES: The graph plots the incremental discounted life-time costs (y-axis) and the incremental discounted QALYs (x-axis) for each scenario. The solid line represents the cost-effectiveness frontier, those strategies that are potentially cost-effective, and the dotted line represents the WTP, which is a $100,000/QALY. HHS = Department of Health and Human Services; QALY = quality-adjusted life year; WHO = World Health Organization; WTP = willingness to pay.
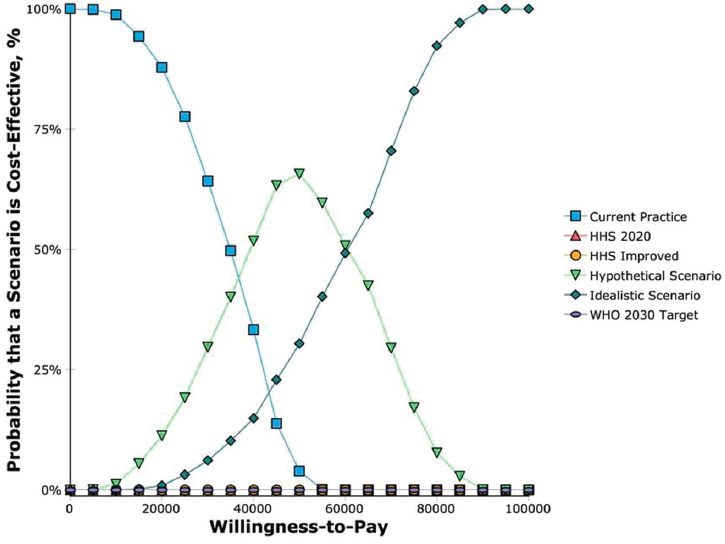
as low as 2.7 percent or as high as 10.6 percent with the WHO 2030 target compared with 4.9 to 17.6 percent with current practice. At a willingness to pay threshold of $50,000 per QALY, the hypothetical scenario D80/C80/T80 was optimal (cost-effective) 65 percent of the time while the idealistic scenario was optimal 30 percent of the time. At a willingness to pay threshold of $100,000 per QALY, the idealistic scenario was optimal 100 percent of the time (see Figure A-12). If the idealistic scenario was to be left out of the competing scenarios, the WHO 2030 target is the most optimal scenario at a willingness to pay threshold of $100,000.
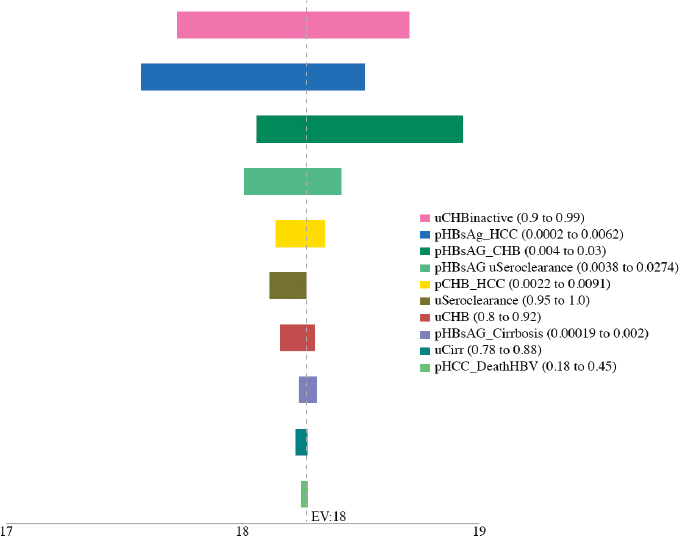
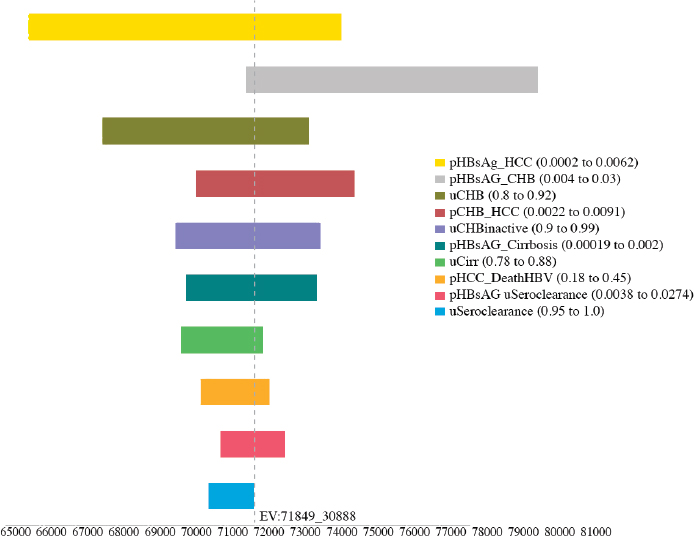
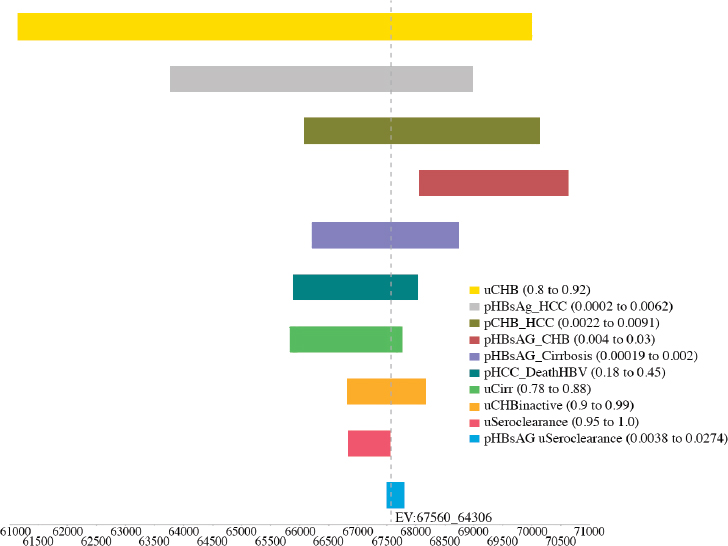
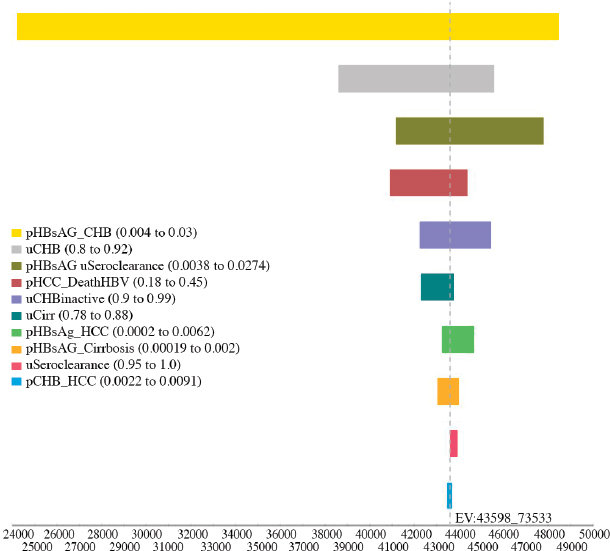
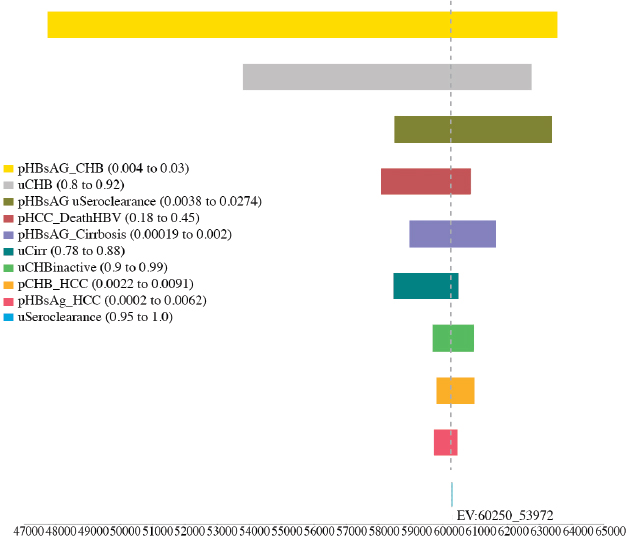
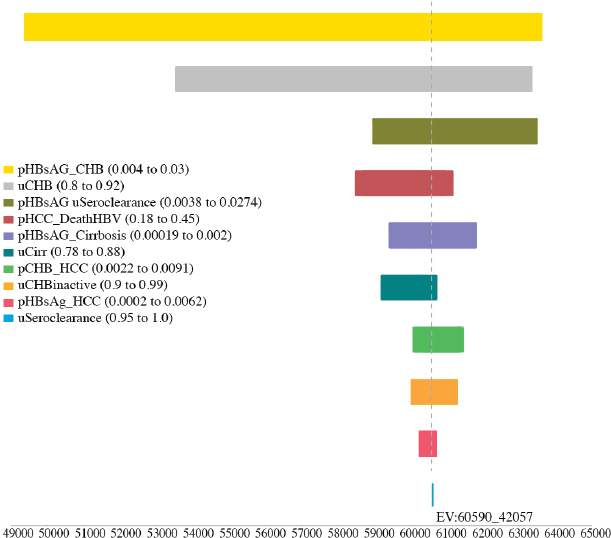
TABLE A-11 Sensitivity Analysis of the Best and Worst Case in Cumulative Risks for Hepatocellular Carcinoma, Cirrhosis, and HBV-Related Deaths by 2030 in the 2015 Cohort
| Cumulative Risk | Scenario | |||||
|---|---|---|---|---|---|---|
| Current Practice D35/C33/T45 | HHS 2020 Target D66/C33/T45 | HHS + Improved Rx D66/C80/T80 | Hypothetical Scenario D80/C80/T80 | WHO 2030 Target D90/C90/T80 | Idealistic D100/C100/T100 | |
| Hepatocellular carcinoma | 3.78%-12.63% | 3.67%-12.40% | 3.40%-11.45% | 3.03%-10.49% | 2.72%-9.52% | 2.33%-8.33% |
| Cirrhosis | 4.30%-14.52% | 4.23%-14.24% | 4.17%-12.47% | 2.96%-9.55% | 2.75%-7.68% | 2.24%-4.76% |
| HBV-related death | 4.91%-17.61% | 4.67%-17.02% | 4.03%-14.92% | 3.30%-12.70% | 2.69%-10.61% | 1.85%-8.28% |
NOTE: HBV = hepatitis B virus; HHS = Department of Health and Human Services; WHO = World Health Organization.
TABLE A-12 Sensitivity Analysis of the Best and Worst Case in Lifetime Discounted Costs, QALYs, and ICERs of Each Target Scenario
| Lifetime | Scenario | |||||
|---|---|---|---|---|---|---|
| Current Practice D35/C33/T45 | HHS 2020 Target D66/C33/T45 | HHS + Improved Rx D66/C80/T80 | Hypothetical Scenario D80/C80/T80 | WHO 2030 Target D90/C90/T80 | Idealistic D100/C100/T100 | |
| QALYs | 14.98-19.87 | 15.15-19.93 | 15.77-20.12 | 16.50-20.34 | 17.29-20.52 | 18.08-20.77 |
| Costs for total cohort ($4,740-19,752 annual) | $16,425-114,197 | $18,470-123,465 | $25,743-152,993 | $24,782-172,822 | $35,193-228,392 | $43,500-266,642 |
| ICER for total cohort (compared to current practice) | — | $34,083-54,518 | $37,272-49,109 | $17,781-38,569 | $28,874-49,435 | $30,083-49,176 |
NOTE: HHS = Department of Health and Human Services; ICER = incremental cost effectiveness ratio; QALY = quality-adjusted life year; WHO = World Health Organization.
NOTE: HHS = Department of Health and Human Services; WHO = World Health Organization.
DISCUSSION
This is the first study undertaken to model the population health impact and cost-effectiveness of increasing CHB diagnosis, care, and treatment in the United States. The study found implementing programs that would substantially increase rates of CHB diagnosis, care, and viral suppressive therapy with the potent and low-resistance medications can prevent 19 to 70 percent of the HBV-related deaths in 15 years depending on the rates achieved.
In the HHS national action plan for the prevention, care, and treatment of viral hepatitis, among the four overarching goals is to double the number who are aware of their CHB infection to 66 percent by 2020 (HHS, 2015). This study found that merely doubling the number of people diagnosed with CHB to 66 percent would only result in a 4 percent drop in HBV-related death in 15 years if there was no associated increase in care and treatment rates. Increasing care and treatment combined with increased
rates of diagnosis could result in a reduction in new cases of hepatocellular carcinoma by 12 to 48 percent, cirrhosis by 13 to 63 percent, and HBV-related death by 19 to 70 percent in 15 years. The WHO target of 90 percent diagnosis and 80 percent treatment would prevent 50 percent of the HBV-related liver deaths. If we can reach an idealistic scenario where almost everyone is diagnosed, cared for and treated if indicated, and adherent to monitoring and treatment, the mortality rate can decrease by 70 percent in 15 years. These estimates would come close to the WHO 2030 target to reduce CHB-related mortality by 65 percent (WHO, 2016).
Increasing the cascade of CHB diagnosis, care, and treatment would also provide high value for money and is cost-effective in all the scenarios examined with an ICER of $17,748 to $30,433 for generic entecavir, $43,745 to $67,692 for brand entecavir, and $29,216 to $46,717 for tenofovir. Increasing the diagnosis and treatment rates to 90 and 80 percent, respectively (WHO 2030 targets), would be cost-effective with an estimated ICER ranging from $26,242 to $60,605, depending on the antiviral drug used. For patients with cirrhosis, great health gain of 7.13 healthy life years can be gained by increasing diagnosis, care, and treatment rates to the WHO 2030 targets compared with current practice. Such an increase in healthy life years is comparable to HIV antiretroviral treatment versus no treatment with a health gain of 8.5 years (Walensky et al., 2013).
This study had several limitations. The model did not include additional program costs (e.g., outreach, campaigns, and awareness programs) for the different scenarios if care, treatment, and adherence to monitoring and treatment were to be increased. In the cost-effectiveness calculations, only medical management (diagnosis, monitoring, managing the disease) and treatment costs were included. Consequently, future research could look into various elements of which type of programs could be implemented locally and nationally and calculate their costs. The model also assumes all the patients who are eligible for treatment received recommended first line suppressive therapy that are highly effective and have very low rates of drug resistance. The broad ranges for some variables in the model come from published cohort studies. These ranges were used for the sensitivity analysis, and, as a result, some ranges in the best and worst case scenarios are broad as well.
According to the National Cancer Institute, liver cancer screening in high-risk patients does not result in reduction in mortality although screening with twice a year ultrasound for early detection of hepatocellular carcinoma is recommended by AASLD for HBsAg+ persons who are at increased risk. The model did not calculate the potential survival benefit of liver cancer screening among CHB patients that received care and the potential survival benefit of antiviral therapy in hepatocellular carcinoma patients.
The estimated prevalence of CHB in 2015 in this study is 1.29 million
and ranged from 855,000 to 2.01 million, which is similar to the CDC estimates of 850,000 to 2.2 million. Mitchell et al. estimated 95 percent of new cases of CHB in the United States are imported with an annual increase of 53,800 cases between 2004 and 2008 from immigration (Mitchell et al., 2011). In this study, an estimated 72.5 percent living in the United States in 2015 are foreign born black and Asian and Pacific Islander (see Table A-6). Based on U.S. Census projected migration of blacks and Asian and Pacific Islanders in the next 15 years, the number of new cases of CHB is estimated to increase by 23,370 per year to approximately the 1.64 million by 2030. These estimates did not include migration from the Middle East or Eastern Europe.
The proportion of the 2015 CHB cohort who are HBeAg+, HBeAg+ with active hepatitis, HBeAg– with active hepatitis, and CHB with normal ALT was estimated based on a U.S. multicenter cohort study in adults, but there was no information on cirrhosis (Ghany et al., 2015). Our study has a limitation that we had to estimate the proportion with cirrhosis from two other cohort studies (Iloeje et al., 2006; Kim et al., 2014). By applying the same chronic active hepatitis and cirrhosis estimates in adults to the age group 0 to 19 years, the numbers in the 2015 cohort that would require treatment may be overestimated. However, given that this age group only represents 6.1 percent of the 2015 cohort, the effect would be small.
Recent findings in a United States CHB cohort study (Spradling et al., 2016) found CHB patients were insufficiently monitored for disease status and, among those with cirrhosis, for hepatocellular carcinoma and viremia. In order to convince their patients of the long-term risks of CHB, providers need to be first convinced and educated themselves so that they can manage and increase their patients’ adherence to monitoring and treatment. Nationwide programs need to be implemented to increase the rates of diagnosis, care, and treatment for CHB infection in order to eliminate CHB as a public health problem in the United States.
Funding source: This study was commissioned by the National Academies of Sciences, Engineering, and Medicine.
REFERENCES
Arends, P., M. J. Sonneveld, R. Zoutendijk, I. Carey, A. Brown, M. Fasano, D. Mutimer, K. Deterding, J. G. Reijnders, Y. Oo, J. Petersen, F. van Bommel, R. J. de Knegt, T. Santantonio, T. Berg, T. M. Welzel, H. Wedemeyer, M. Buti, P. Pradat, F. Zoulim, B. Hansen, H. L. Janssen, and Virgil Surveillance Study Group. 2015. Entecavir treatment does not eliminate the risk of hepatocellular carcinoma in chronic hepatitis B: Limited role for risk scores in caucasians. Gut 64(8):1289-1295.
Arias, E. 2015. United States life tables, 2011. National Vital Statistics Reports 64(11). http://www.cdc.gov/nchs/data/nvsr/nvsr64/nvsr64_11.pdf (accessed July 2016).
Bureau of Labor Statistics. n.d. CPI inflation calculator. http://www.bls.gov/data/inflation_calculator.htm (accessed July, 2016).
Campsen, J., M. Zimmerman, J. Trotter, J. Hong, C. Freise, R. Brown, A. Cameron, M. Ghobrial, I. Kam, R. Busuttil, S. Saab, C. Holt, J. Emond, J. Stiles, T. Lukose, M. Chang, and G. Klintmalm. 2013. Liver transplantation for hepatitis B liver disease and concomitant hepatocellular carcinoma in the United States with hepatitis B immunoglobulin and nucleoside/nucleotide analogues. Liver Transplantation 19(9):1020-1029.
CDC (Centers for Disease Control and Prevention). 2015. Hepatitis B FAQs for health professionals. http://www.cdc.gov/hepatitis/hbv/hbvfaq.html#overview (accessed July 2016).
Census Bureau. n.d. United States Census Bureau. http://www.census.gov (accessed July 2016).
Chen, Y. C., C. M. Chu, and Y. F. Liaw. 2010. Age-specific prognosis following spontaneous hepatitis B e antigen seroconversion in chronic hepatitis B. Hepatology 51(2):435-444.
Chotiyaputta, W., C. Peterson, F. A. Ditah, D. Goodwin, and A. S. Lok. 2011. Persistence and adherence to nucleos(t)ide analogue treatment for chronic hepatitis B. Journal of Hepatology 54(1):12-18.
Chu, C. M., and Y. F. Liaw. 2007. HBsAg seroclearance in asymptomatic carriers of high endemic areas: Appreciably high rates during a long-term follow-up. Hepatology 45(5): 1187-1192.
Chu, C. M., and Y. F. Liaw. 2009. Incidence and risk factors of progression to cirrhosis in inactive carriers of hepatitis B virus. American Journal of Gastroenterology 104(7): 1693-1699.
CMS (Centers for Medicare & Medicaid Services). n.d. Decision memo for screening for hepatitis B virus (HBV) infection (CAG-00447N). https://www.cms.gov/medicare-coverage-database/details/nca-decision-memo.aspx?NCAId=283 (accessed February 21, 2017).
Din, E. S., A. Wasley, L. Jacques-Carroll, B. Sirotkin, and S. Wang. 2011. Estimating the number of births to hepatitis B virus-infected women in 22 states, 2006. Pediatric Infectious Disease Journal 30(7):575-579.
Fattovich, G., F. Bortolotti, and F. Donato. 2008. Natural history of chronic hepatitis B: Special emphasis on disease progression and prognostic factors. Journal of Hepatology 48(2):335-352.
Ghany, M. G., R. Perrillo, R. Li, S. H. Belle, H. L. Janssen, N. A. Terrault, M. C. Shuhart, D. T. Lau, W. R. Kim, M. W. Fried, R. K. Sterling, A. M. Di Bisceglie, S. H. Han, L. M. Ganova-Raeva, K. M. Chang, A. S. Lok, and Hepatitis B Research Network. 2015. Characteristics of adults in the hepatitis B research network in North America reflect their country of origin and hepatitis B virus genotype. Clinical Gastroenterology and Hepatology 13(1):183-192.
Heathcote, E. J., P. Marcellin, M. Buti, E. Gane, R. A. De Man, Z. Krastev, G. Germanidis, S. S. Lee, R. Flisiak, K. Kaita, M. Manns, I. Kotzev, K. T chernev, P. Buggisch, F. Weilert, O. O. Kurdas, M. L. Shiffman, H. Trinh, S. Gurel, A. Snow-Lampart, K. Borroto-Esoda, E. Mondou, J. Anderson, J. Sorbel, and F. Rousseau. 2011. Three-year efficacy and safety of tenofovir disoproxil fumarate treatment for chronic hepatitis B. Gastroenterology 140(1):132-143.
HHS (Department of Health and Human Services). 2015. Action plan for the prevention, care, and treatment of viral hepatitis: 2014-2016. HHS, Office of the Assistant Secretary for Health, Office of HIV/AIDS and Infectious Disease Policy. https://www.aids.gov/pdf/viral-hepatitis-action-plan.pdf (accessed October 26, 2016).
HRSA (Health Resources and Services Administration). n.d. Organ Procurement and Transplantation Network. https://optn.transplant.hrsa.gov/data/view-data-reports/build-advanced (accessed July 2016).
Hu, D. J., J. Xing, R. A. Tohme, Y. Liao, H. Pollack, J. W. Ward, and S. D. Holmberg. 2013. Hepatitis B testing and access to care among racial and ethnic minorities in selected communities across the United States, 2009-2010. Hepatology 58(3):856-862.
Hutton, D. W., D. Tan, S. K. So, and M. L. Brandeau. 2007. Cost-effectiveness of screening and vaccinating Asian and Pacific Islander adults for hepatitis B. Annals of Internal Medicine 147(7):460-469.
Hyun, C. S., S. Kim, S. Y. Kang, S. Jung, and S. Lee. 2016. Chronic hepatitis B in Korean Americans: Decreased prevalence and poor linkage to care. BMC Infectious Diseases 16(1):415.
Iloeje, U. H., H. I. Yang, J. Su, C. L. Jen, S. L. You, and C. J. Chen. 2006. Predicting cirrhosis risk based on the level of circulating hepatitis B viral load. Gastroenterology 130(3):678-686.
Juday, T., H. Tang, M. Harris, A. Z. Powers, E. Kim, and G. J. Hanna. 2011. Adherence to chronic hepatitis B treatment guideline recommendations for laboratory monitoring of patients who are not receiving antiviral treatment. Journal of General Internal Medicine 26(3):239-244.
Jung, M., M. H. Kuniholm, G. Y. Ho, S. Cotler, H. D. Strickler, B. Thyagarajan, M. Youngblood, R. C. Kaplan, and J. Del Amo. 2016. The distribution of hepatitis B virus exposure and infection in a population-based sample of U.S. Hispanic adults. Hepatology 63(2):445-452.
Kanwal, F., M. Farid, P. Martin, G. Chen, I. M. Gralnek, G. S. Dulai, and B. M. Spiegel. 2006. Treatment alternatives for hepatitis B cirrhosis: A cost-effectiveness analysis. American Journal of Gastroenterology 101(9):2076-2089.
Kim, L. H., V. G. Nguyen, H. N. Trinh, J. Li, J. Q. Zhang, and M. H. Nguyen. 2014. Low treatment rates in patients meeting guideline criteria in diverse practice settings. Digestive Diseases and Sciences 59(9):2091-2099.
Kowdley, K. V., C. C. Wang, S. Welch, H. Roberts, and C. L. Brosgart. 2012. Prevalence of chronic hepatitis B among foreign-born persons living in the United States by country of origin. Hepatology 56(2):422-433.
Lin, S. Y., E. T. Chang, and S. K. So. 2007. Why we should routinely screen Asian American adults for hepatitis B: A cross-sectional study of Asians in California. Hepatology 46(4):1034-1040.
Lin, X., N. J. Robinson, M. Thursz, D. M. Rosenberg, A. Weild, J. M. Pimenta, and A. J. Hall. 2005. Chronic hepatitis B virus infection in the Asia-Pacific region and Africa: Review of disease progression. Journal of Gastroenterology and Hepatology 20(6):833-843.
Liu, S., L. E. Cipriano, M. Holodniy, D. K. Owens, and J. D. Goldhaber-Fiebert. 2012. New protease inhibitors for the treatment of chronic hepatitis C: A cost-effectiveness analysis. Annals of Internal Medicine 156(4):279-290.
Lok, A. S., B. J. McMahon, R. S. Brown, Jr., J. B. Wong, A. T. Ahmed, W. Farah, J. Almasri, F. Alahdab, K. Benkhadra, M. A. Mouchli, S. Singh, E. A. Mohamed, A. M. Abu Dabrh, L. J. Prokop, Z. Wang, M. H. Murad, and K. Mohammed. 2016. Antiviral therapy for chronic hepatitis B viral infection in adults: A systematic review and meta-analysis. Hepatology 63(1):284-306.
Marcellin, P., E. Gane, M. Buti, N. Afdhal, W. Sievert, I. M. Jacobson, M. K. Washington, G. Germanidis, J. F. Flaherty, R. Aguilar Schall, J. D. Bornstein, K. M. Kitrinos, G. M. Subramanian, J. G. McHutchison, and E. J. Heathcote. 2013. Regression of cirrhosis during treatment with tenofovir disoproxil fumarate for chronic hepatitis B: A 5-year open-label follow-up study. Lancet 381(9865):468-475.
Mitchell, T., G. L. Armstrong, D. J. Hu, A. Wasley, and J. A. Painter. 2011. The increasing burden of imported chronic hepatitis B—United States, 1974-2008. PLoS One 6(12):e27717.
NASEM (National Academies of Sciences, Engineering, and Medicine). 2016. Eliminating the public health problem of hepatitis B and C in the United States: Phase one report. Washington, DC: The National Academies Press.
Papatheodoridis, G. V., H. L. Chan, B. E. Hansen, H. L. Janssen, and P. Lampertico. 2015. Risk of hepatocellular carcinoma in chronic hepatitis B: Assessment and modification with current antiviral therapy. Journal of Hepatology 62(4):956-967.
Raffetti, E., G. Fattovich, and F. Donato. 2016. Incidence of hepatocellular carcinoma in untreated subjects with chronic hepatitis B: A systematic review and meta-analysis. Liver International 36(9):1239-1251.
Roberts, H., D. Kruszon-Moran, K. N. Ly, E. Hughes, K. Iqbal, R. B. Jiles, and S. D. Holmberg. 2016. Prevalence of chronic hepatitis B virus (HBV) infection in U.S. households: National Health and Nutrition Examination Survey (NHANES), 1988-2012. Hepatology 63(2):388-397.
Shuler, C. M., A. E. Fiore, R. Neeman, B. P. Bell, W. Kuhnert, S. Watkins, K. Kilgour, and K. E. Arnold. 2009. Reduction in hepatitis B virus seroprevalence among U.S.-born children of foreign-born Asian parents—Benefit of universal infant hepatitis B vaccination. Vaccine 27(43):5942-5947.
Spradling, P. R., J. Xing, L. B. Rupp, A. C. Moorman, S. C. Gordon, E. T. Teshale, M. Lu, J. A. Boscarino, C. M. Trinacty, M. A. Schmidt, and S. D. Holmberg. 2016. Infrequent clinical assessment of chronic hepatitis B patients in United States general healthcare settings. Clinical Infectious Diseases 63(9):1205-1208.
Stanaway, J. D., A. D. Flaxman, M. Naghavi, C. Fitzmaurice, T. Vos, I. Abubakar, L. J. Abu-Raddad, R. Assadi, N. Bhala, B. Cowie, M. H. Forouzanfour, J. Groeger, K. Mohd Hanafiah, K. H. Jacobsen, S. L. James, J. MacLachlan, R. Malekzadeh, N. K. Martin, A. A. Mokdad, A. H. Mokdad, C. J. Murray, D. Plass, S. Rana, D. B. Rein, J. H. Richardus, J. Sanabria, M. Saylan, S. Shahraz, S. So, V. V. Vlassov, E. Weiderpass, S. T. Wiersma, M. Younis, C. Yu, M. El Sayed Zaki, and G. S. Cooke. 2016. The global burden of viral hepatitis from 1990 to 2013: Findings from the Global Burden of Disease Study 2013. The Lancet 388(10049):1081-1088.
Tanaka, J., T. Koyama, M. Mizui, S. Uchida, K. Katayama, J. Matsuo, T. Akita, A. Nakashima, Y. Miyakawa, and H. Yoshizawa. 2011. Total numbers of undiagnosed carriers of hepatitis C and B viruses in Japan estimated by age- and area-specific prevalence on the national scale. Intervirology 54(4):185-195.
Tenney, D. J., R. E. Rose, C. J. Baldick, K. A. Pokornowski, B. J. Eggers, J. Fang, M. J. Wichroski, D. Xu, J. Yang, R. B. Wilber, and R. J. Colonno. 2009. Long-term monitoring shows hepatitis B virus resistance to entecavir in nucleoside-naive patients is rare through 5 years of therapy. Hepatology 49(5):1503-1514.
Terrault, N. A., N. H. Bzowej, K. M. Chang, J. P. Hwang, M. M. Jonas, and M. H. Murad. 2016. AASLD guidelines for treatment of chronic hepatitis B. Hepatology 63(1):261-283.
Thiele, M., L. L. Gluud, A. D. Fialla, E. K. Dahl, and A. Krag. 2014. Large variations in risk of hepatocellular carcinoma and mortality in treatment naive hepatitis B patients: Systematic review with meta-analyses. PLoS One 9(9):e107177.
Toy, M., J. A. Salomon, H. Jiang, H. Gui, H. Wang, J. Wang, J. H. Richardus, and Q. Xie. 2014. Population health impact and cost-effectiveness of monitoring inactive chronic hepatitis B and treating eligible patients in Shanghai, China. Hepatology 60(1):46-55.
Truven Health Analytics. 2016. Red Book. http://micromedex.com/products/product-suites/clinical-knowledge/redbook (accessed July 2016).
Ugwu, C., P. Varkey, S. Bagniewski, and T. Lesnick. 2008. Sero-epidemiology of hepatitis B among new refugees to Minnesota. Journal of Immigrant and Minority Health 10(5):469-474.
USPSTF (U.S. Preventive Services Task Force). 2016. USPSTF A and B recommendations. http://www.uspreventiveservicestaskforce.org (accessed January 9, 2017).
Walensky, R. P., P. E. Sax, Y. M. Nakamura, M. C. Weinstein, P. P. Pei, K. A. Freedberg, A. D. Paltiel, and B. R. Schackman. 2013. Economic savings versus health losses: The cost-effectiveness of generic antiretroviral therapy in the United States. Annals of Internal Medicine 158(2):84-92.
WHO (World Health Organization). 2016. Global health sector strategy on viral hepatitis, 2016-2021: Towards ending viral hepatitis. Geneva, Switzerland: WHO. http://apps.who.int/iris/bitstream/10665/246177/1/WHO-HIV-2016.06-eng.pdf (accessed July 19, 2016).
Wong, G. L., H. L. Chan, C. W. Mak, S. K. Lee, Z. M. Ip, A. T. Lam, H. W. Iu, J. M. Leung, J. W. Lai, A. O. Lo, H. Y. Chan, and V. W. Wong. 2013. Entecavir treatment reduces hepatic events and deaths in chronic hepatitis B patients with liver cirrhosis. Hepatology 58(5):1537-1547.
Woo, G., G. Tomlinson, C. Yim, L. Lilly, G. Therapondos, D. K. Wong, W. J. Ungar, T. R. Einarson, M. Sherman, J. E. Heathcote, and M. Krahn. 2012. Health state utilities and quality of life in patients with hepatitis B. Canadian Journal of Gastroenterology and Hepatology 26(7):445-451.


