
Appendix B
Modeling the Elimination of Hepatitis C in the United States
Homie Razavi
Center for Disease Analysis
Chronic hepatitis C virus infection (HCV) is a leading cause of cirrhosis, hepatocellular carcinoma (HCC) and liver transplantation in the United States (NIDDK, 2016; HRSA, 2016; Yang et al., 2012). The advent of direct-acting antiviral (DAA) therapies in recent years means that HCV can be treated with sustained viral response (SVR) rates in excess of 90 percent, and treatment regimens continue to become more efficacious and easier to tolerate for patients (Martinello and Dore, 2016). Achieving SVR has positive health, quality of life, and economic implications for cured patients (Smith-Palmer et al., 2015). This analysis considers the impact of treatment uptake on disease burden at the national level under four different scenarios. Understanding future disease burden and potential strategies to mitigate burden is critical for the elimination of HCV in the United States (NASEM, 2016).
METHODS
Model
The HCV disease progression model has been described in detail previously (Blach et al., 2016; Razavi et al., 2014). The model was designed using Microsoft Excel® (Microsoft Corp., Redmond, Washington) to track the viremic HCV infected population by disease stage through 2030. The model estimated the annual number of incident HCV infections, after accounting for spontaneous cure (Seeff, 2002). Fibrosis progression of all cases was followed over time through 2030. The number of cases at any stage of liver
disease was calculated and tracked by age and gender. The population was aged in 1 year age cohorts through age 84 and cases aged ≥85 years were tracked as a single cohort. The population in each age group, except for the ≥85 year cohort, was moved to the next age each year to simulate aging. Background population data for the United States were obtained from the United Nations’ population database by age, gender, and one year age cohort (United Nations, 2015).
Disease progression was estimated through fibrosis and liver disease stages with annual adjustment for background mortality (United Nations, 2015). Cases by disease stage were calculated by multiplying the progression rate and the total cases at previous stages of the disease in the previous year. Background mortality was adjusted to account for increased mortality among the portion of the viremic population who are people who inject drugs (PWID) and people with a history of blood transfusion. Based on U.S. data showing that 0.3 percent of individuals aged ≥13 years were active PWID and that 43.126 percent were anti-HCV positive (Lansky et al., 2014), it was estimated that there are 251,900 viremic active PWID, assuming a 75 percent viremia rate (Edlin et al., 2015; Seeff, 2002). A standardized mortality ratio (SMR) of 10.0 was estimated (Bjornaas et al., 2008; Engstrom et al., 1991; Frischer et al., 1997; Hickman et al., 2003; Oppenheimer et al., 1994; Perucci et al., 1991) and applied to background mortality rates for the 7.3 percent of viremic cases who are active PWID aged 15-44 years. In addition, an estimated 6.5 percent of the infected population reported a history of transfusion (Daniels et al., 2009); an SMR of 1.5 (Kamper-Jørgensen et al., 2008) was applied to background mortality rates for these cases.
HCV Prevalence
Based on data from the 2003-2010 National Health and Nutrition Examination Survey (NHANES), there were an estimated 3.6 million individuals positive for HCV antibody and approximately 75 percent (Edlin et al., 2015; Seeff, 2002) were HCV RNA-positive (viremic), equivalent to 2.7 million chronically infected individuals (Denniston et al., 2014). NHANES potentially undersamples several groups with elevated risk for HCV infection, including incarcerated people, homeless people, hospitalized patients, nursing home residents, active-duty military, and Native Americans living on reservations. Analyses that accounted for these high-risk groups, in addition to data from NHANES, resulted in updated prevalence estimates of 4.6 million individuals who are HCV antibody positive and 3.5 million individuals who are HCV-RNA positive (Edlin et al., 2015). The HCV model tracked only viremic individuals, and assumed a prevalent popula-
tion of 3.5 million viremic cases in 2010, at the end of the NHANES data period analysis.
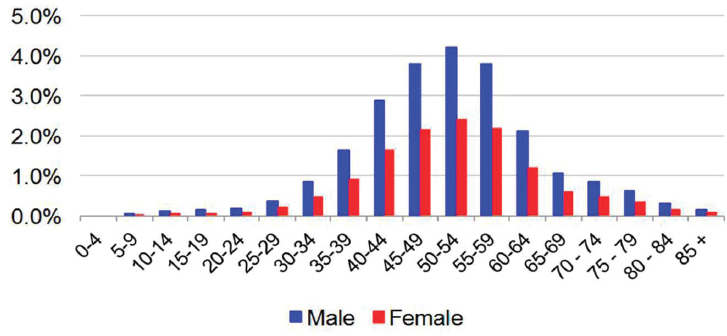
The distribution of cases by age and gender was based on data reported from NHANES (2003-2010) by age and gender, where the proportion of viremic cases among males (63.6 percent) exceeded that of females (36.4 percent) by a factor of 1.75 (Denniston et al., 2014). The reported distribution of viremic cases by age group was extrapolated to the national level with the assumption of decreasing prevalence among persons aged <20 years not represented in NHANES (see Figure B-1). The age of prevalent cases was further validated by estimating the projected proportion of cases by birth cohort in 2010 and comparing that to published estimates, demonstrating that approximately three-quarters of infected persons in the United States were born during 1945-1965 (Smith et al., 2012). The genotype distribution of the prevalent population in the United States was based upon NHANES laboratory data files (CDC, 2015). Genotype data from survey cycles during 2003-2014 were summed and the distribution was input as 57.0 percent (G1a), 22.1 percent (G1b), 0.5 percent (G1 other), 10.9 percent (G2), 8.1 percent (G3), 0.8 percent (G4) and 0.5 percent (G6). Prevalent cases were described by subpopulation; reported proportions of cases captured by NHANES, and underrepresented groups were extrapolated to model outputs in 2015 (Edlin et al., 2015). Similarly, reported proportions of infected persons by insurance coverage category were applied to prevalent cases in 2015 (Fitch et al., 2013).
HCV Incidence
Total HCV cases in a given year were assumed to be the sum of existing and new HCV cases after adjustment for mortality and spontaneous cure. The number of new infections was back-calculated using a two-step process that first calculated the annual number of new infections, followed by the age and gender distribution of these cases. The annual number of new cases was calibrated to the estimated prevalence of HCV in 2010 (Edlin et al., 2015). Annual relative incidence values were used to describe changes in the annual number of new HCV infections, and were based upon published estimates that were available from 1982 to 2014 (CDC, 2016). Based on the number of reported acute infections with an underascertainment multiplier, the Centers for Disease Control and Prevention (CDC) estimated that 180,000 new infections occurred in 1982 increasing to a peak of 291,000 new infections in 1989. In 2014, there were an estimated 30,500 (24,200-104,200) new HCV infections (CDC, 2016). Excel® Solver was used to determine a constant that, when multiplied by the relative incidence, resulted in the sum of all new cases since 1950 achieving the target model prevalence of HCV in 2010, after adjustment for mortality.
Diagnosed/Treated
The number of diagnosed cases was calculated in the model in order to better understand potential constraints on treatment uptake. Analyses of NHANES data have demonstrated that 51 percent of infected cases were already aware of their infection (Denniston et al., 2014; Volk et al., 2009). However, this may be an underestimate due to the underrepresentation of high risk groups in NHANES (Edlin et al., 2015). For modeling purposes, it was assumed that 45 percent of the viremic population was previously diagnosed in 2010, equivalent to 1,575,000 diagnosed viremic cases. In addition, it was assumed that 110,000 new cases would be diagnosed annually based on reported acute cases in sentinel centers (Klevens et al., 2009), along with an underascertainment multiplier adjusting for undercounting based on the proportions of infected persons developing symptoms and seeking care, as well as the proportion of those diagnosed who were reported to surveillance systems (Klevens et al., 2014).
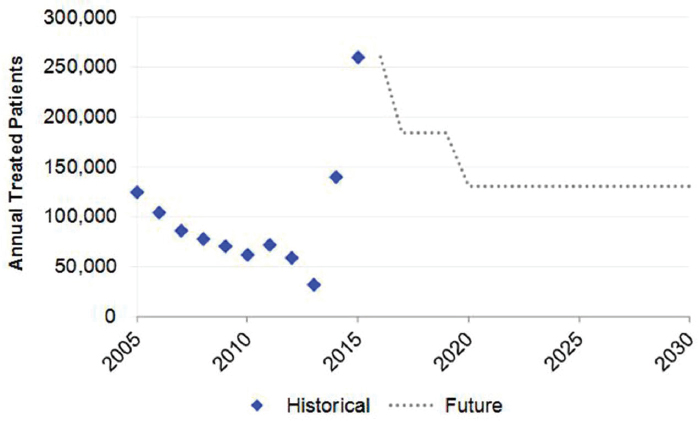
The annual number of treated patients was based on sales unit data reported for pegylated interferon during 2004-2012. During this time period, annual treated ranged from 124,800 cases (2005) to 59,000 cases (2012). In later years, expert feedback and published estimates were used to estimate total treated patients. Assumptions for treatment efficacy varied by scenario, as described below.
The total number of annual liver transplants by diagnostic category was
available from the Organ Procurement and Transplantation Network for the years 1988 to 2015. All transplants in five diagnostic categories (acute hepatic necrosis [AHN] with HCV, AHN with hepatitis B virus [HBV] and HCV, alcoholic cirrhosis with HCV, cirrhosis with HBV and HCV, and cirrhosis with HCV) were assumed to be HCV-related, and 23.6 percent to 41.6 percent (Yang et al., 2012) of transplants in two additional categories (HCC, HCC and cirrhosis) were assumed to be HCV-related. These were summed to estimate total HCV-related transplants in a given year. In 2015, there were 7,127 liver transplants performed in the United States (HRSA, 2016) and 2010 (28 percent) were attributed to HCV.
Sensitivity Analysis
For key model inputs, low and high ranges were entered based on published ranges and expert input (see Table B-1). Model generated uncertainty intervals (UIs) were calculated using high/low Beta-PERT distributions around inputs and conducting Monte Carlo analysis using Oracle Crystal Ball® (Oracle Corp., Redwood City, California). Uncertainty around total viremic cases and liver deaths during 2015-2030 under the 2015 Base scenario were calculated. In addition, leading drivers of uncertainty for viremic prevalence, incident decompensated cirrhosis, incident HCC and HCV-related mortality in 2030 were identified.
Model Validation
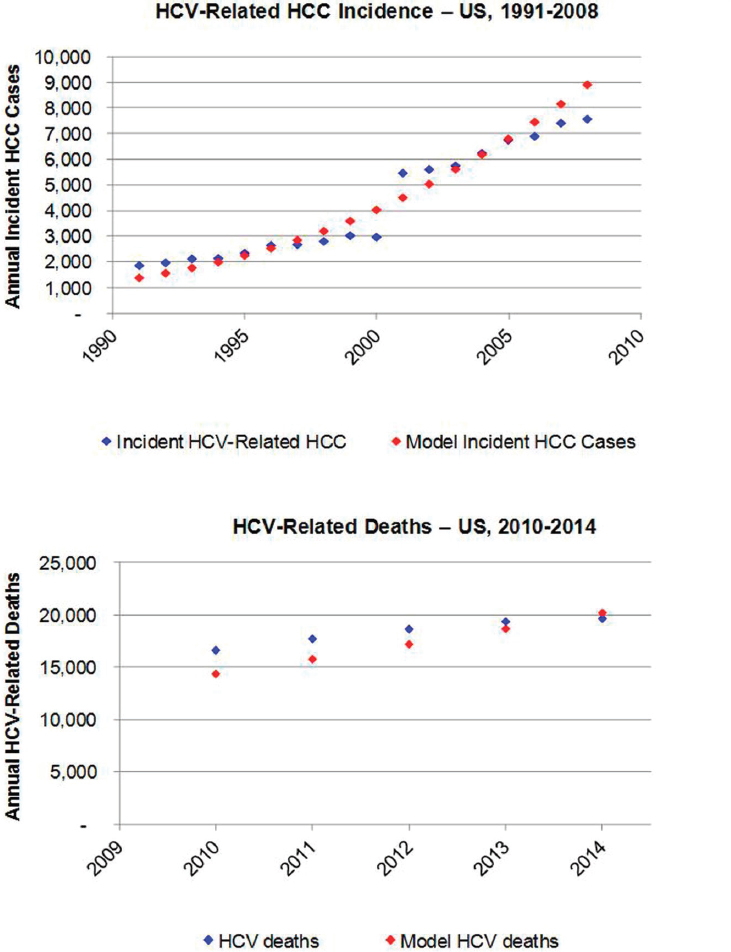
To validate model outputs, the annual number of incident HCC cases attributable to chronic HCV infection was considered. Total annual incident cases of liver and intrahepatic bile duct cancer are reported by the Surveillance, Epidemiology, and End Results Program (SEER) (SEER Program, 2015). Based on an analysis of SEER data collected during 2000-2010, it was assumed that 72 percent of liver and intrahepatic duct cancers would be classified as HCC (Altekruse et al., 2014). Analysis of incident HCC cases in Olmsted County, Minnesota, reported HCC attributable to HCV alone and to HCV and alcohol in combination (Yang et al., 2012), during 1991-2000 and 2001-2008. For the purposes of validating the model, it was assumed that 100 percent of HCC cases attributed to HCV alone, and 80 percent of cases attributed to HCV and alcohol, would be HCV-related. It was calculated that 23.6 percent of incident HCC cases would be attributed to HCV during 1991-2000, increasing to 41.6 percent of incident HCC during 2001-2008. It was estimated that there were 1869 incident HCV-related HCC cases at the national level in 1991, increasing to 7,582 cases by 2008. These data were plotted and compared to model estimated HCC incident cases during 1991-2008 (see Figure B-2). The annual number of
TABLE B-1 Sensitivity Analysis Inputs, United States, 2015 Base Scenario
| Category | Low | High | Source |
|---|---|---|---|
| Annual new infections (2017-2030) | 2,760 | 217,000 | Expert input, Massachusetts Department of Public Health, 2016; Onofrey et al., 2015 |
| Viremic cases (2010) | 2,500,000 | 4,700,000 | Edlin et al., 2015 |
| Annual treated (2017-2030) | 65,000 | 260,000 | Drug unit sales, expert input |
| Mild to moderate fibrosis – Transition probability multiplier | 0.59 | 1.53 | Harris et al., 2014 |
| Mod to cirrhosis – Transition probability multiplier | 0.57 | 1.9 | Harris et al., 2014 |
| Transfusion SMR | 1.3 | 17.6 | Kamper-Jørgensen et al., 2008 |
| Injection Drug Use SMR | 9.5 | 29.9 | Bjornaas et al., 2008; Engstrom et al., 1991; Frischer et al., 1997; Hickman et al., 2003; Oppenheimer et al., 1994; Perucci et al., 1991 |
| Cirrhosis to HCC – Transition probability multiplier | 0.74 | 1.32 | Harris et al., 2014 |
| Cirrhosis to decompensated cirrhosis – Transition probability multiplier | 0.70 | 1.36 | Harris et al., 2014 |
| HCC to liver death (year 1) – Transition probability | 58.9% | 74.2% | Bernfort et al., 2006; Ries et al., 2007 |
| HCC to liver death (subsequent years) – Transition probability | 13.5% | 19.5% | Ries et al., 2007 |
| Decompensated cirrhosis to liver death – Transition probability multiplier | 0.80 | 1.20 | Harris et al., 2014 |
| Annual diagnosed (2017-2030) | 27,500 | 110,000 | Klevens et al., 2014; Klevens et al., 2009 |
NOTE: HCC = hepatocellular carcinoma; SMR = standardized mortality ratio.
liver-related deaths was calculated in the model and compared to national estimates for the number of HCV-related deaths based on death certificates during 2010-2014 (CDC, 2016) (see Figure B-2).
Scenarios
Four scenarios were developed to estimate the disease burden associated with varying levels of treatment efficacy, treatment and screening levels, and new infections. Changes occurred over time waves and were based on estimates reported in the literature and national reports, as well as expert input (see Table B-2).
2013 Base
The 2013 Base scenario was based on data from historical treatment regimens of pegylated interferon and ribavirin. This scenario was considered in order to show the impact of recent increases in treatment with more efficacious regimens. Under this scenario, it was assumed that 60 percent of diagnosed patients would be medically eligible for treatment (see Table B-2). Treated patients experienced SVR rates of 55 percent (G1), 70 percent (G2/G3), 48 percent (G4) and 55 percent (other and mixed genotypes). The annual number of treated patients was held constant at 32,000, and annual diagnosed patients gradually declined from 110,000 cases during 2013-2015 to 55,000 cases during 2025-2030. The number of new infections was held relatively constant at approximately 30,000 new infections annually.
2015 Base
The 2015 Base scenario was based upon the latest treatment data, and reflects the recent uptake of DAA regimens. In 2015, it was estimated that the treated population increased to 260,000 treated cases (see Figure B-3). It was assumed that annual treatment would gradually decline by 50 percent to 130,000 annual treated cases by 2020. The efficacy of treatment was assumed to increase from 55 percent (2013) to 95 percent (2017), and treatment eligibility also reached 95 percent. Treatment eligibility was restricted to people with moderate fibrosis (≥F2) beginning in 2014 as new regimens were introduced. It was assumed that individuals aged 15-64 years were eligible for treatment until 2020, when treatment was expanded to individuals aged 15-74 years (see Table B-2). Assumptions for annual diagnosed cases and new infections were identical to the 2013 Base scenario.
NOTE: HCC = hepatocellular carcinoma; HCV = hepatitis C virus.
SOURCES: Altekruse et al., 2014; CDC, 2016; SEER Program, 2015; Yang et al., 2012.
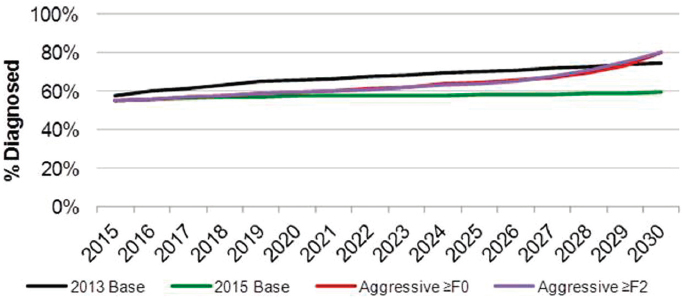
Aggressive ≥F0
The Aggressive ≥F0 scenario was based on a continuation of the high levels of treatment observed in 2015 continuing into the future. This scenario applied the same assumptions as the 2015 Base scenario for treatment efficacy and eligibility, but assumed that treatment continued at a high level (260,000 annually treated) through 2030. In addition, the number diagnosed was calculated so that 80 percent of all prevalent cases would be diagnosed by 2030 (see Figure B-4). To achieve this, annual diagnosed decreased from 110,000 annually to 71,700 annually by 2025. Under this scenario, new infections were assumed to decline sharply as a result of dramatically increased treatment and reduced transmission. A reduction from 30,000 new infections to 2,700 new infections annually by 2025 was modeled. In order to assess the impact of treating less advanced cases, treatment was expanded to ≥F1 cases in 2015 and ≥F0 cases in 2017.
Aggressive ≥F2
The Aggressive ≥F2 scenario applied the same assumptions as the Aggressive ≥F0 scenario, but assumed that treatment was limited to ≥F2 patients for the entirety of the time period. As cases with no/minimal fibrosis were not treated in this scenario, it was assumed that HCV transmission would not decline substantially and annual new cases remained constant at approximately 30,000 cases. Applying an 80 percent limit on total diagnosed in 2030, the number of newly diagnosed was estimated to decline to 83,700 cases by 2025. Annual treated was held constant at 260,000, but fibrosis restrictions resulted in the model running out of diagnosed eligible patients to treat beginning in 2026. By 2030, there were an estimated 118,600 treated patients due to depletion of the eligible pool of potential patients.
RESULTS
Scenarios
For each scenario, annual estimates for prevalence and incidence (total and by disease stage) were plotted through 2030. The relative increase or decrease in cases by 2030 was compared to the caseload in 2015. Outputs from the 2015 Base scenario were compared against results from the other scenarios. Finally, the cumulative number of incident decompensated cirrhosis, incident HCC, and liver-related deaths during 2015-2030 were calculated and compared against values for the 2015 Base scenario to estimate percentage reductions in disease burden as compared to the current
TABLE B-2 Scenario Assumptions, United States, 2013-2030
| Scenario | Assumption | Wave 1 | Wave 2 | Wave 3 | Wave 4 | Wave 5 |
|---|---|---|---|---|---|---|
| Base 2013 | Years | 2013-2015 | 2016-2017 | 2018-2019 | 2020-2024 | 2025-2030 |
| Annual Treated | 32,000 | 32,000 | 32,000 | 32,000 | 32,000 | |
| Annual Newly Diagnosed | 110,000 | 110,000 | 77,780 | 55,000 | 55,000 | |
| Fibrosis Stage | ≥F0 | ≥F0 | ≥F0 | ≥F0 | ≥F0 | |
| Annual New Infections | 29,690 | 30,270 | 30,100 | 29,980 | 29,800 | |
| Treated Age | 15-64 | 15-64 | 15-64 | 15-64 | 15-64 | |
| SVR | 58% | 58% | 58% | 58% | 58% | |
| Base 2015 | Years | 2013-2014 | 2015-2016 | 2017-2019 | 2020-2024 | 2025-2030 |
| Annual Treated | 32,000 | 260,000 | 183,800 | 130,000 | 130,000 | |
| Annual Newly Diagnosed | 110,000 | 110,000 | 77,780 | 55,000 | 55,000 | |
| Fibrosis Stage | ≥F0 | ≥F2 | ≥F2 | ≥F2 | ≥F2 | |
| Annual New Infections | 29,690 | 30,340 | 30,160 | 29,980 | 29,830 | |
| Treated Age | 15-64 | 15-64 | 15-74 | 15-74 | 15-74 | |
| SVR | 58% | 90% | 95% | 95% | 95% |
| Aggressive ≥F0 | Years | 2013-2014 | 2015-2016 | 2017-2019 | 2020-2024 | 2025-2030 |
| Annual Treated | 32,000 | 260,000 | 260,000 | 260,000 | 260,000 | |
| Annual Newly Diagnosed | 110,000 | 110,000 | 110,000 | 88,790 | 71,660 | |
| Fibrosis Stage | ≥F0 | ≥F1 | ≥F0 | ≥F0 | ≥F0 | |
| Annual New Infections | 29,690 | 30,340 | 22,620 | 11,150 | 2,730 | |
| Treated Age | 15-64 | 15-64 | 15-74 | 15-74 | 15-74 | |
| SVR | 58% | 90% | 95% | 95% | 95% | |
| Aggressive ≥F2 | Years | 2013-2014 | 2015-2016 | 2017-2019 | 2020-2024 | 2025-2030 |
| Annual Treated | 32,000 | 260,000 | 260,000 | 260,000 | 260,000 | |
| Annual Newly Diagnosed | 110,000 | 110,000 | 110,000 | 95,940 | 83,670 | |
| Fibrosis Stage | ≥F0 | ≥F2 | ≥F2 | ≥F2 | ≥F2 | |
| Annual New Infections | 29,690 | 30,330 | 30,150 | 29,960 | 29,800 | |
| Treated Age | 15-64 | 15-64 | 15-74 | 15-74 | 15-74 | |
| SVR | 58% | 90% | 95% | 95% | 95% |
NOTE: SVR = sustained virologic response.
treatment paradigm. The results for the 2013 Base scenario were included only for illustration purposes as this scenario was not considered a likely future option (treatment with the older therapies).
2015 Base
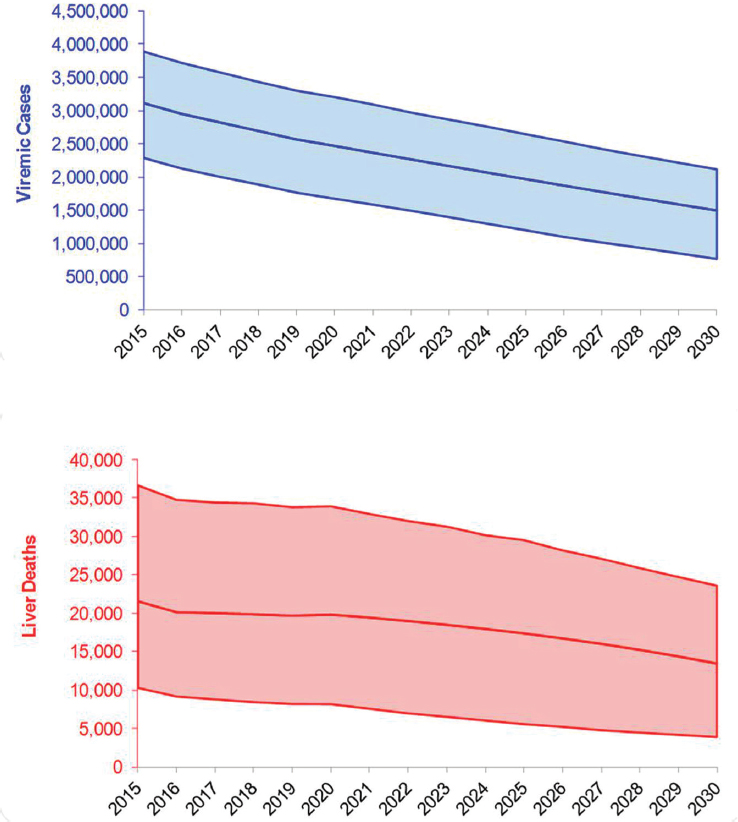
There were an estimated 3,117,000 viremic cases in 2015, declining over 10 percent from 3,500,000 cases in 2010. Viremic cases decreased
from 3,117,000 (UI: 2,290,000-3,892,000) in 2015 to 1,495,000 (762,000-2,116,000) in 2030, a decrease of 50 percent (see Figures B-5 and B-6). Under this scenario, prevalent compensated and decompensated cirrhotic cases declined 35 percent during 2015-2030, to 302,800 and 28,900 cases, respectively. Prevalent HCC decreased 40 percent between 2015 and 2030 to 13,600 cases in 2030. Cumulative incident decompensated cirrhosis and HCC were estimated at 188,000 and 188,800 cases, respectively. An-
NOTE: HCC = hepatocellular carcinoma.
nual liver deaths were estimated at 13,500 (UI: 3900-23,600) for 2030, a decline of 40 percent from 2015 when there were 21,600 (10,300-36,700) deaths (see Figure B-5), while cumulative deaths over the time period were estimated at 289,200 deaths. The 2015 treatment and diagnosis rate has averted 215,100 deaths relative to the treatment and diagnosis rate in 2013 Base scenario (see Table B-3). This represents a 55 percent decrease as compared to the 2013 Base scenario.
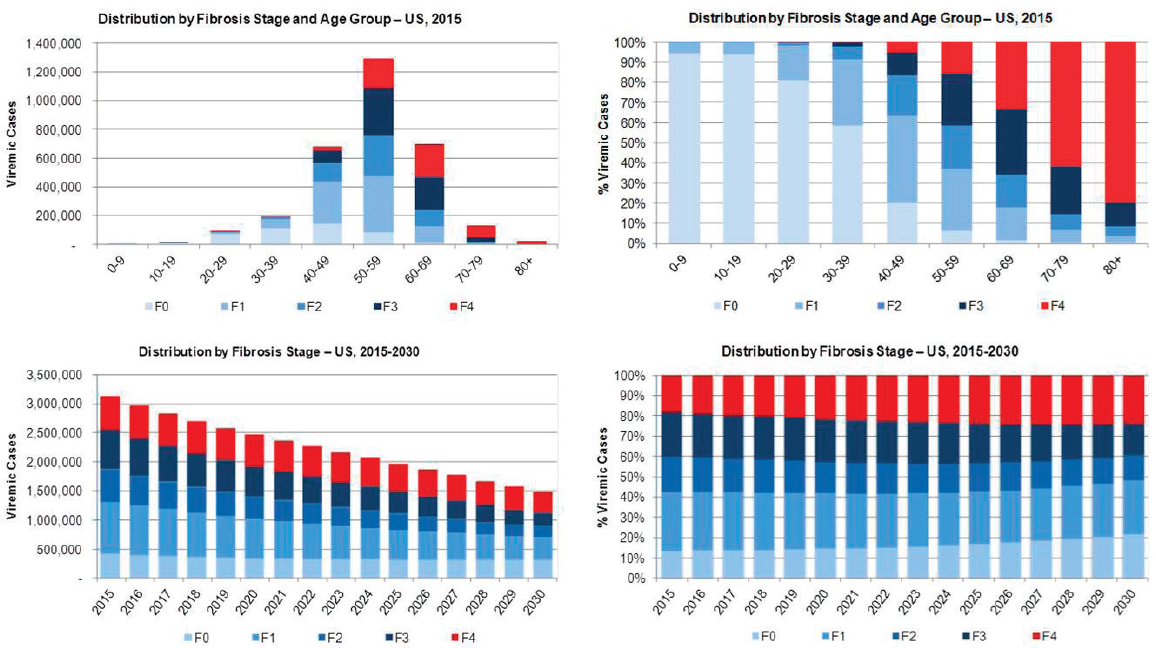
Viremic cases were characterized using model outputs under the 2015 Base Scenario. In 2015, there were an estimated 1,290,000 cases in the 50-59 year old age group, over 40 percent of all cases (see Figure B-7). The burden of advanced fibrosis and cirrhosis was concentrated in older age groups with 85 percent and 95 percent of F3 and F4 (compensated cirrhosis, decompensated cirrhosis, HCC and liver transplant) cases among persons aged ≥50 years, respectively. The prevalent number of F4 cases declined 35 percent during 2015-2030 from 565,700 cases to 356,500 cases, but the proportion of total cases classified as F4 increased from 20 percent to 25 percent (see Figure B-7).
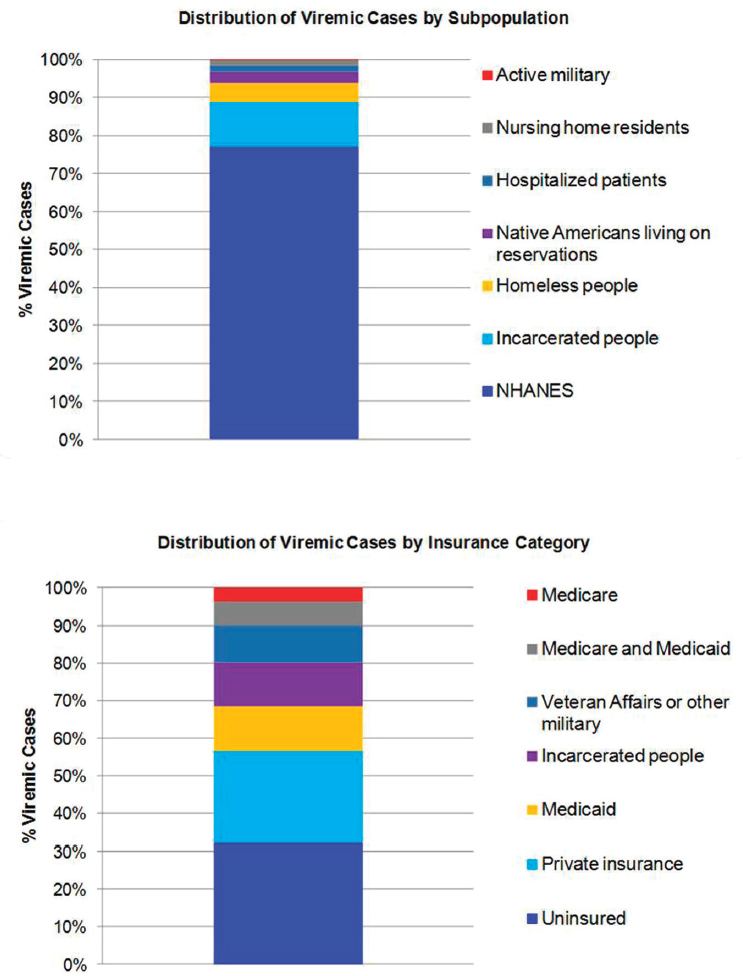
The distribution of viremic cases by subpopulation in 2015 calculated how many cases would be represented by the NHANES sample, and how many additional cases would occur in underrepresented groups. In 2015, subpopulations were estimated at 2,404,800 NHANES (77 percent), 361,000 incarcerated people (12 percent), 158,700 homeless people (5 percent), 88,000 Native Americans living on reservations (2.8 percent), 53,300
TABLE B-3 Key Model Output Summary by Scenario, United States, 2015-2030
| Scenario: | Base 2015 | Aggressive ≥F0 | Aggressive ≥F2 |
|---|---|---|---|
| Relative to: | Base 2013 | Base 2015 | Base 2015 |
| Reduction in viremic infections | 910,000 | 1,105,100 | 515,500 |
| Liver deaths averted | 215,000 | 28,800 | 98,500 |
| Total new HCC cases averted (2015-2030) | 123,000 | 19,000 | 57,700 |
| Total new decompensated cirrhosis cases averted (2015-2030) | 124,000 | 19,000 | 58,200 |
| Total number of new infections averted (2015-2030) | (200) | 279,400 | 0 |
NOTE: HCC = hepatocellular carcinoma.
hospitalized patients (1.7 percent), 46,500 nursing home residents (1.5 percent) and 5000 active-duty military (0.2 percent) (see Figure B-8). Insurance type in 2015 was extrapolated at 997,900 uninsured (32 percent), 767,400 privately insured (25 percent), 371,400 Medicaid (12 percent), 361,000 incarcerated (12 percent), 307,400 Veterans Affairs or other military (10 percent), 198,000 dual Medicare and Medicaid (6 percent) and 115,300 Medicare (4 percent) (see Figure B-8).
2013 Base
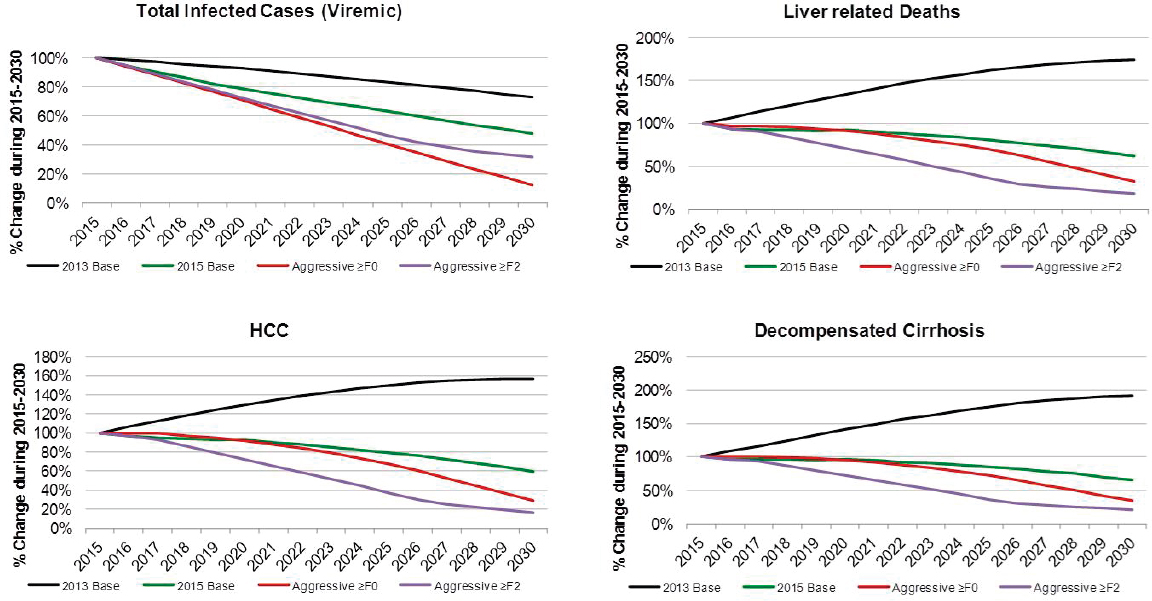
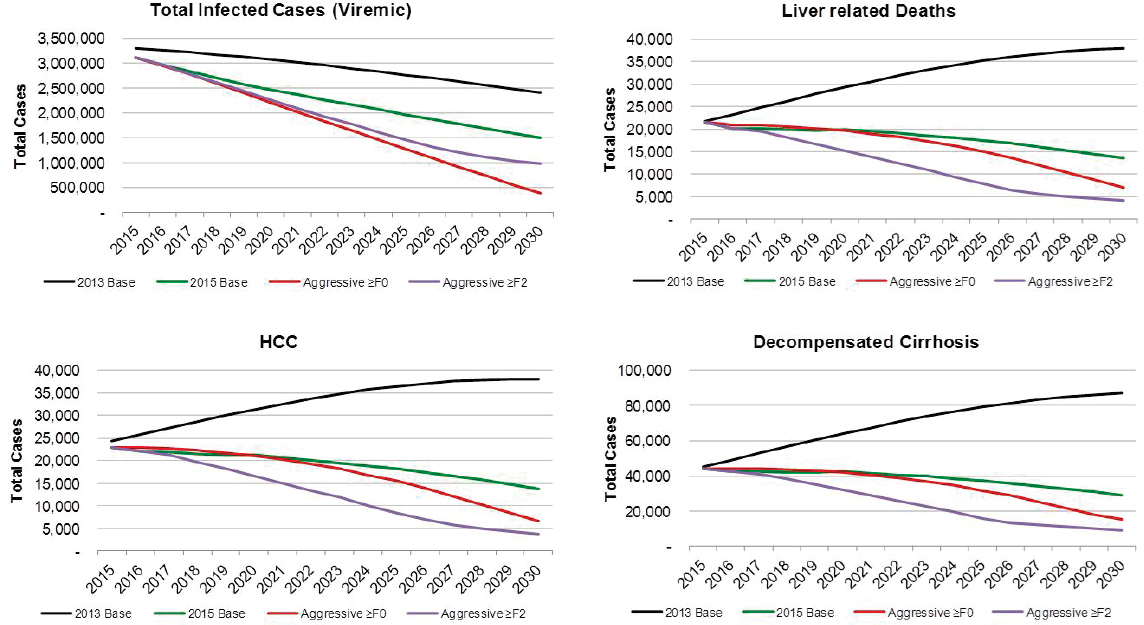
Under the 2013 Base scenario, the number of prevalent cases was projected to decline 25 percent from 3,302,000 cases in 2015 to 2,406,000 cases in 2030, largely due to aging of the population and mortality (see Figure B-9). Prevalent compensated cirrhosis cases were projected to increase 45 percent from 520,900 to 764,900 cases during 2015-2030, while decompensated cirrhosis cases were projected to increase from 45,300 to 86,900 (90 percent increase) as shown in Figure B-9. Prevalent HCC cases increase from 24,300 to 38,000, a 55 percent increase. Cumulative incidence of decompensated cirrhosis and HCC during 2015-2030 was estimated at 311,700 and 312,100 incident cases, respectively. Under this scenario, annual liver-related deaths were projected to increase 75 percent from 21,800 in 2015 to 38,000 in 2030, and cumulative deaths during the time period were estimated at 504,300 deaths.
Aggressive ≥F0
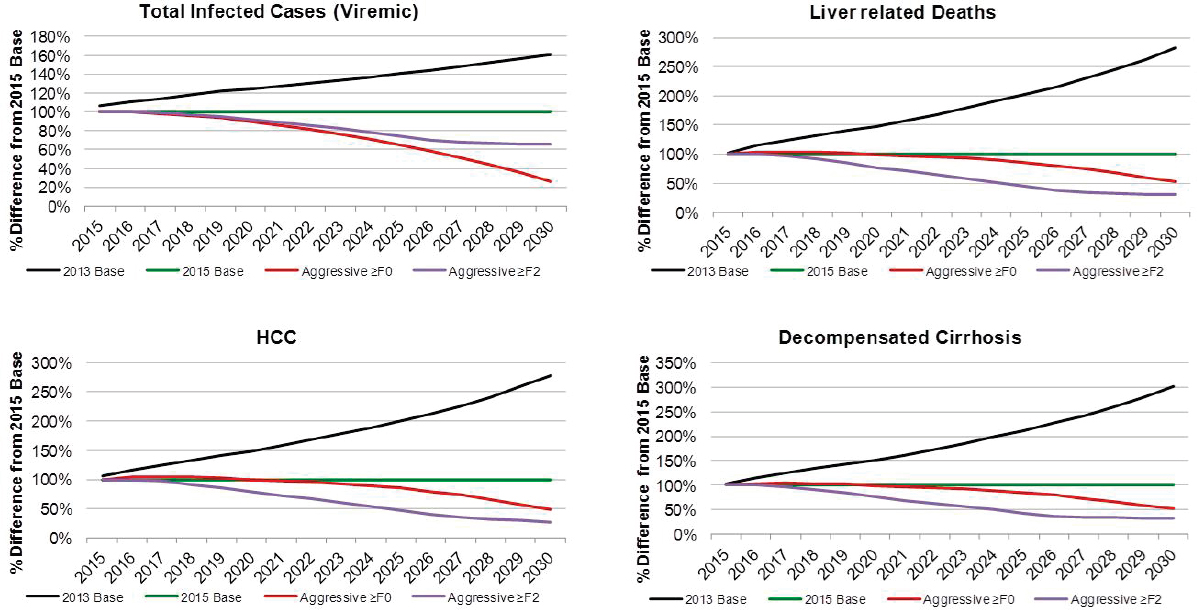
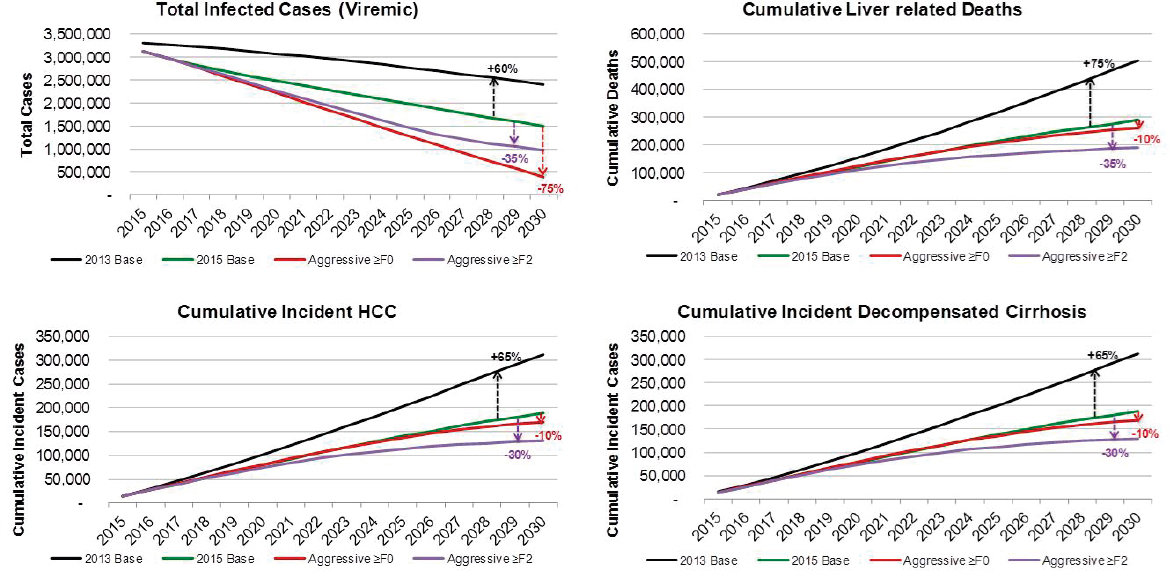
Under the Aggressive ≥F0 scenario, viremic cases decline 85 percent to 390,000 cases by 2030 (see Figure B-9). Prevalent compensated and decompensated cirrhosis decline 70 percent and 65 percent, to 145,000 and 15,200 prevalent cases in 2030, respectively. Prevalent HCC also declines 70 percent to 6,600 cases in 2030, while annual liver deaths decline 65 percent to 7,100 deaths in 2030. As compared to the 2015 Base scenario, there were 75 percent fewer viremic cases in 2030, 50 percent fewer compensated cirrhosis, decompensated cirrhosis and HCC cases (see Figure B-10). Liver-related deaths also declined to 50 percent of level expected in the 2015 Base scenario, and cumulative liver deaths were estimated at 260,400, a 10 percent decrease from the 2015 Base scenario (see Figure B-11). Cumulative incident decompensated cirrhosis and HCC both declined by 10 percent as compared to the 2015 Base scenario with a total of 168,900 and 169,900 cases, respectively. By 2030, this scenario had achieved the greatest reduction in viremic prevalence.
NOTE: NHANES = National Health and Nutrition Examination Survey.
NOTE: HCC = hepatocellular carcinoma.
NOTE: HCC = hepatocellular carcinoma.
NOTE: HCC = hepatocellular carcinoma.
NOTE: HCC = hepatocellular carcinoma; LRD = liver-related death; SMR = standardized mortality ratio.
Aggressive ≥F2
The Aggressive ≥F2 scenario resulted in a 70 percent reduction in cases to 980,000 viremic infections in 2030 (see Figures B-9 and B-6). Prevalent compensated and decompensated cirrhosis cases declined 80 percent over the time period to 87,300 and 9,300 cases in 2030, while HCC cases declined 85 percent to 3,700 cases. Liver-related deaths declined 80 percent to 4,100 deaths in 2030 (see Figure B-9). As compared to the 2015 Base scenario, there were 35 percent fewer viremic cases in 2030, as well as 70 percent fewer compensated cirrhotic, decompensated cirrhotic, and HCC cases (see Figure B-10). Liver deaths in 2030 declined 70 percent as compared to the 2015 Base scenario, and cumulative liver deaths declined by 35 percent (190,700 deaths) (see Figure B-11). Cumulative incident decompensated cirrhosis and HCC during 2015-2030 were estimated at 129,800 and 131,100 cases, respectively, and were 30 percent less than estimates for the 2015 Base scenario. The Aggressive ≥F2 scenario had the largest impact in reducing end stage liver disease and liver-related mortality.
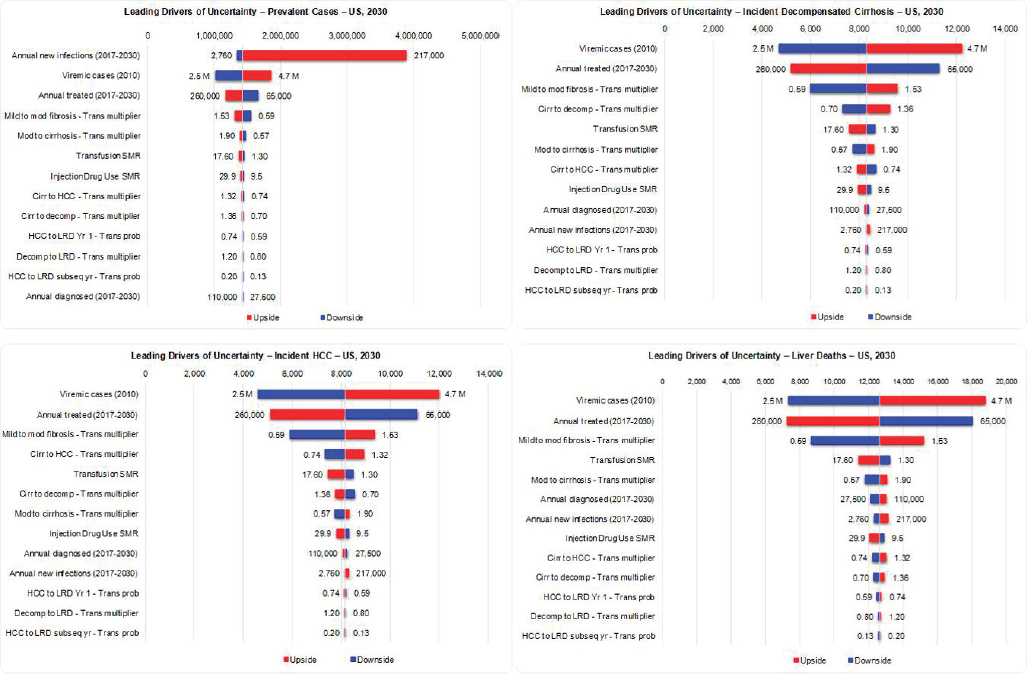
Sensitivity Analysis
For total viremic infections in 2030, inputs for annual new infections, base prevalence and annual treated were the greatest drivers of uncertainty, together accounting for >95 percent of uncertainty (see Figure B-12). For incident decompensated cirrhosis, HCC, and liver deaths in 2030, inputs for base prevalence, annual treated, and the mild to moderate fibrosis transition probability multiplier were found to have the largest impact on uncertainty, with these factors accounting for approximately 95 percent of uncertainty (see Figure B-12).
DISCUSSION
The analysis presented here provides a range of future outcomes under different scenarios, but does not define a specific future scenario. Key insights are derived by comparing scenarios and identifying the factors that are important. Specific measures at different points in time were examined as a function of all uncertainties—viremic infections, liver-related deaths, number of individuals with HCV-related HCC and the number of decompensated cirrhosis cases. Although cirrhotic cases have been used as a measure of disease burden in the past, this disease stage can contain individuals with compensated and decompensated cirrhosis. The latter was selected since it is associated with a high mortality rate and potentially more accurate reporting.
The uncertainties considered as part of this analysis had a different
level of impact on the measures we considered. For example, of all the uncertainties considered, incidence had the largest impact on the forecasted total number of viremic HCV cases (prevalent cases) in the United States in 2030 (see Figure B-12). In 2011, the CDC estimated 16,500 (7,200-43,400) new HCV infections. This figure increased to 30,500 (24,200-104,200) new infections per year by 2014 (CDC, 2016). The increase in new HCV infections is explained by the rapid rise of PWID in the United States and this population is not distributed homogeneously across the country (Suryaprasad et al., 2014). When HCV incidence rates in Massachusetts were applied to the United States population, an estimated 217,000 new HCV infections could be occurring in the United States (Massachusetts Department of Public Health, 2016; Onofrey et al., 2015) (see Figure B-12). Thus, the biggest driver of uncertainty in the future prevalence of HCV is the uncertainty in the number of new infections. The number of people diagnosed, treated, or progressing to advanced liver disease had a much smaller impact on total viremic infections in the United States. As a result, this analysis indicated that future HCV infection forecasts in the United States would benefit from important studies to develop more accurate estimates of current and future new infections in the United States and developing strategies to minimize new infections.
As injection drug use is the leading risk factor for new infections (CDC, 2016), it is important to consider requirements to reduce HCV infections among PWID. New PWID tend to be young (ages 15-35) and are infected by sharing needles and injection paraphernalia with those already infected (CDC, 2011). HCV disease progression is a function of age and duration of infection (Poynard et al., 2001), which would mean that the majority of this population has no fibrosis (F0) or early stage fibrosis (F1-F2). Studies have shown that an increase in harm reduction programs (opioid substitution therapy and syringe exchange programs) are effective in reducing the number of new HCV infections (Martin et al., 2013b; Nolan et al., 2014; Tsui et al., 2014; Turner et al., 2011; White et al., 2014). In the absence of vaccines, treatment of this population can also reduce the viral pool of this population resulting in a reduction in total and new infections over time (Martin et al., 2013a). However, current policies in a number of states do not provide access to HCV treatment for PWID and/or those in early stages of fibrosis. A reduction in the number of new HCV infections will require programs to reduce the number of people starting injection drug use, expanding harm reduction programs for those already injecting, and providing HCV treatment to PWID and those in early stages of fibrosis (F0-F2) (Bruggmann and Grebely, 2015).
Reducing incidence of new infections is among the World Health Organization (WHO) targets for eliminating HCV as a public health threat (WHO, 2016) (see Figure B-13). In addition, countries are required to re-
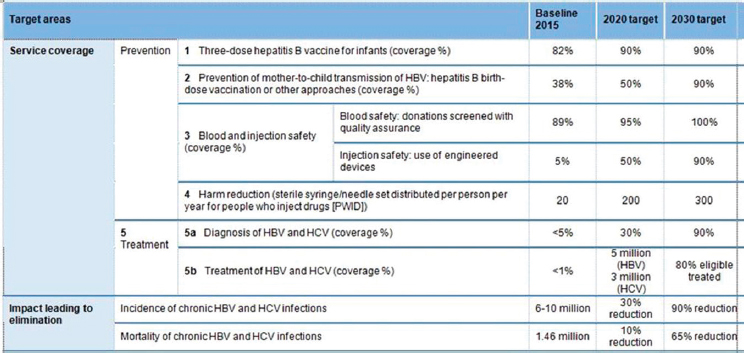
NOTE: HBV = hepatitis B virus; HCV = hepatitis C virus; WHO = World Health Organization.
SOURCE: WHO, 2016.
duce mortality from HCV infections. To meet this requirement, a reduction in advanced liver disease (HCC and decompensated cirrhosis) is needed.
The sensitivity analysis showed that the number of new infections has a very small impact on the forecasted number of liver-related deaths in 2030 (see Figure B-12). Individuals newly infected with HCV will not progress to advanced liver disease for a long period (Pradat et al., 2007), and the impact of new HCV infections on mortality is unseen for several decades. Instead, to meet the reduction in mortality target, we have to manage those already infected with HCV. The key drivers of uncertainty in the number of liver-related deaths in 2030 is the number of individuals already infected with HCV, the number of patients treated per year, and the progression probability from mild to moderate fibrosis (see Figure B-12). The HCV prevalence estimates provided by NHANES (Denniston et al., 2014) may underestimate the total number of infections due to undersampling in some populations (homeless people, incarcerated people, etc.). However, a number of studies have examined these populations and report a higher number of infections (Chak et al., 2011; Edlin et al., 2015). The key driver of uncertainty in our forecast of the number of liver-related deaths in 2030 is the total number of HCV infections; additional studies to narrow this range can improve the quality of our forecast. The next driver of uncertainty is how many people will be treated annually. Achieving SVR
is effective in halting or slowing progression to advanced liver disease and it is not surprising that treatment has a substantive impact on liver-related deaths (Simmons et al., 2015).
The last variable that had a large impact on forecasted liver related deaths was the rate of progression from mild to moderate fibrosis. This progression rate is influenced by alcohol consumption and body mass (Hourigan et al., 1999; Poynard et al., 1997). Additional longitudinal studies in the U.S. population are needed to reduce this uncertainty, especially given ongoing high rates of obesity (Ogden et al., 2014) and associated risk of fibrosis development (Poynard et al., 2010).
The above discussion focused on quantifying the main drivers of uncertainties for total infections and liver-related deaths. As part of this analysis, we also examined what is required to achieve WHO targets. Relative to the treatment paradigm represented by the 2013 Base scenario, great advances have already been made. Increased treatment and higher SVR will result in 215,000 averted deaths and 910,000 fewer HCV infections (see Table B-3). Here, we assume the total number of treated patients will decline to 130,000 per year (50 percent of 2015 value) and the number of newly diagnosed will also decline by 50 percent as it will become more difficult to find undiagnosed individuals.
However, maintaining the annual number of treated patients at 260,000 and expansion of screening to diagnose 80 percent of HCV infections by 2030 would have even greater impact in averting liver deaths and reducing total infections. Under this scenario, treatment restrictions will have a large impact on outcomes. With a continued focus on treating ≥F2 patients, 98,500 deaths may be averted by 2030 relative to the 2015 base scenario (see Table B-3). Those with advanced fibrosis are more likely to progress to advanced liver disease, thus concentrating treatment on these individuals will have a large impact on averting HCC and decompensated cirrhosis cases. Yet most new infections are occurring among younger individuals infected by those with no or early stages of fibrosis (F0-F2). Therefore, focusing treatment on ≥F2 will have minimal impact on new infections (see Table B-3). To reduce new infections, treatment has to be expanded to all. Under this scenario (Aggressive ≥F0), we project 28,000 deaths averted and >90 percent reduction in the number of new infections in the United States corresponding to 279,400 total new infections averted (see Table B-3). This scenario will require expansion of HCV screening as well as expansion of harm reduction programs for PWID. Although the number of treated patients in 2015 indicates that the healthcare system in the United States can already treat 260,000 patients per year, expansion of HCV treatment to general practitioners will be required to provide access to patients without access to major treatment centers and specialists.
In conclusion, the only way to achieve WHO targets is to remove treatment restrictions and provide access to all, expand screening to diagnose 80 percent of infected persons by 2030, and continue to treat 260,000 patients per year. This strategy will reduce infections by 90 percent and avert nearly a quarter million deaths in the next 14 years.
REFERENCES
Altekruse, S. F., S. J. Henley, J. E. Cucinelli, and K. A. McGlynn. 2014. Changing hepatocellular carcinoma incidence and liver cancer mortality rates in the United States. American Journal of Gastroenterology 109(4):542-553.
Bernfort, L., K. Sennfält, and O. Reichard. 2006. Cost-effectiveness of peginterferon alfa-2b in combination with ribavirin as initial treatment for chronic hepatitis C in Sweden. Scandinavian Journal of Infectious Diseases 38(6-7):497-505.
Bjornaas, M. A., A. S. Bekken, A. Ojlert, T. Haldorsen, D. Jacobsen, M. Rostrup, and O. Ekeberg. 2008. A 20-year prospective study of mortality and causes of death among hospitalized opioid addicts in Oslo. BMC Psychiatry 8(1).
Blach, S., S. Zeuzem, M. Manns, I. Altraif, A.-S. Duberg, D. H. Muljono, I. Waked, S. M. Alavian, M.-H. Lee, F. Negro, F. Abaalkhail, A. Abdou, M. Abdulla, A. A. Rached, I. Aho, U. Akarca, I. Al Ghazzawi, S. Al Kaabi, F. Al Lawati, K. Al Namaani, Y. Al Serkal, S. A. Al-Busafi, L. Al-Dabal, S. Aleman, A. S. Alghamdi, A. A. Aljumah, H. E. Al-Romaihi, M. I. Andersson, V. Arendt, P. Arkkila, A. M. Assiri, O. Baatarkhuu, A. Bane, Z. Ben-Ari, C. Bergin, F. Bessone, F. Bihl, A. R. Bizri, M. Blachier, A. J. Blasco, C. E. B. Mello, P. Bruggmann, C. R. Brunton, F. Calinas, H. L. Y. Chan, A. Chaudhry, H. Cheinquer, C.-J. Chen, R.-N. Chien, M. S. Choi, P. B. Christensen, W.-L. Chuang, V. Chulanov, L. Cisneros, M. R. Clausen, M. E. Cramp, A. Craxi, E. A. Croes, O. Dalgard, J. R. Daruich, V. de Ledinghen, G. J. Dore, M. H. El-Sayed, G. Ergör, G. Esmat, C. Estes, K. Falconer, E. Farag, M. L. G. Ferraz, P. R. Ferreira, R. Flisiak, S. Frankova, I. Gamkrelidze, E. Gane, J. García-Samaniego, A. G. Khan, I. Gountas, A. Goldis, M. Gottfredsson, J. Grebely, M. Gschwantler, M. G. Pessôa, J. Gunter, B. Hajarizadeh, O. Hajelssedig, S. Hamid, W. Hamoudi, A. Hatzakis, S. M. Himatt, H. Hofer, I. Hrstic, Y.-T. Hui, B. Hunyady, R. Idilman, W. Jafri, R. Jahis, N. Z. Janjua, P. Jarčuška, A. Jeruma, J. G. Jonasson, Y. Kamel, J.-H. Kao, S. Kaymakoglu, D. Kershenobich, J. Khamis, Y. S. Kim, L. Kondili, Z. Koutoubi, M. Krajden, H. Krarup, M.-s. Lai, W. Laleman, W.-c. Lao, D. Lavanchy, P. Lázaro, H. Leleu, O. Lesi, L. A. Lesmana, M. Li, V. Liakina, Y.-S. Lim, B. Luksic, A. Mahomed, M. Maimets, M. Makara, A. O. Malu, R. T. Marinho, P. Marotta, S. Mauss, M. S. Memon, M. C. M. Correa, N. Mendez-Sanchez, S. Merat, A. M. Metwally, R. Mohamed, C. Moreno, F. H. Mourad, B. Müllhaupt, K. Murphy, H. Nde, R. Njouom, D. Nonkovic, S. Norris, S. Obekpa, S. Oguche, S. Olafsson, M. Oltman, O. Omede, C. Omuemu, O. Opare-Sem, A. L. H. Øvrehus, S. Owusu-Ofori, T. S. Oyunsuren, G. Papatheodoridis, K. Pasini, K. M. Peltekian, R. O. Phillips, N. Pimenov, H. Poustchi, N. Prabdial-Sing, H. Qureshi, A. Ramji, D. Razavi-Shearer, K. Razavi-Shearer, B. Redae, H. W. Reesink, E. Ridruejo, S. Robbins, L. R. Roberts, S. K. Roberts, W. M. Rosenberg, F. Roudot-Thoraval, S. D. Ryder, R. Safadi, O. Sagalova, R. Salupere, F. M. Sanai, J. F. S. Avila, V. Saraswat, R. Sarmento-Castro, C. Sarrazin, J. D. Schmelzer, I. Schréter, C. Seguin-Devaux, S. R. Shah, A. I. Sharara, M. Sharma, A. Shevaldin, G. E. Shiha, W. Sievert, M. Sonderup, K. Souliotis, D. Speiciene, J. Sperl, P. Stärkel, R. E. Stauber, C. Stedman, D. Struck, T.-H. Su, V. Sypsa, S.-S. Tan, J. Tanaka, A. J. Thompson, I. Tolmane, K. Tomasiewicz, J. Valantinas, P. Van Damme, A. J. van der
Meer, I. van Thiel, H. Van Vlierberghe, A. Vince, W. Vogel, H. Wedemeyer, N. Weis, V. W. S. Wong, C. Yaghi, A. Yosry, M.-f. Yuen, E. Yunihastuti, A. Yusuf, E. Zuckerman, and H. Razavi. 2016. Global prevalence and genotype distribution of hepatitis C virus infection in 2015: A modelling study. The Lancet Gastroenterology & Hepatology 2(3): 161-176.
Bruggmann, P., and J. Grebely. 2015. Prevention, treatment and care of hepatitis C virus infection among people who inject drugs. International Journal of Drug Policy 26:S22-S26.
CDC (Centers for Disease Control and Prevention). 2011. Hepatitis C virus infection among adolescents and young adults: Massachusetts, 2002-2009. Morbidity and Mortality Weekly Report 60(17):537-541.
CDC. 2015. National Health and Nutrition Examination Survey data, 2003-2014. https://www.cdc.gov/nchs/nhanes (accessed January 11, 2017).
CDC. 2016. Viral hepatitis–Statistics & surveillance. https://www.cdc.gov/hepatitis/statistics (accessed November 11, 2016).
Chak, E., A. H. Talal, K. E. Sherman, E. R. Schiff, and S. Saab. 2011. Hepatitis C virus infection in USA: An estimate of true prevalence. Liver International 31(8):1090-1101.
Daniels, D., S. Grytdal, and A. Wasley. 2009. Surveillance for acute viral hepatitis, United States, 2007. Morbidity and Mortality Weekly Report 58(S S03):1-27.
Denniston, M. M., R. B. Jiles, J. Drobeniuc, R. M. Klevens, J. W. Ward, G. M. McQuillan, and S. D. Holmberg. 2014. Chronic hepatitis C virus infection in the United States, National Health and Nutrition Examination Survey, 2003 to 2010. Annals of Internal Medicine 160(5):293-300.
Edlin, B. R., B. J. Eckhardt, M. A. Shu, S. D. Holmberg, and T. Swan. 2015. Toward a more accurate estimate of the prevalence of hepatitis C in the United States. Hepatology 62(5):1353-1363.
Engstrom, A., C. Adamsson, P. Allebeck, and U. Rydberg. 1991. Mortality in patients with substance abuse: A follow-up in Stockholm County, 1973-1984. International Journal of the Addictions 26(1):91-106.
Fitch, K., K. Iwasaki, B. Pyenson, and T. Engel. 2013. Health care reform and hepatitis C: A convergence of risk and opportunity. New York: Milliman, Inc.
Frischer, M., D. Goldberg, M. Rahman, and L. Berney. 1997. Mortality and survival among a cohort of drug injectors in Glasgow, 1982–1994. Addiction 92(4):419-427.
Harris, R. J., B. Thomas, J. Griffiths, A. Costella, R. Chapman, M. Ramsay, D. De Angelis, and H. E. Harris. 2014. Increased uptake and new therapies are needed to avert rising hepatitis C-related end stage liver disease in England: Modelling the predicted impact of treatment under different scenarios. Journal of Hepatology 61(3):530-537.
Hickman, M., Z. Carnwath, P. Madden, M. Farrell, C. Rooney, R. Ashcroft, A. Judd, and G. Stimson. 2003. Drug-related mortality and fatal overdose risk: Pilot cohort study of heroin users recruited from specialist drug treatment sites in London. Journal of Urban Health 80(2):274-287.
Hourigan, L. F., G. A. Macdonald, D. Purdie, V. H. Whitehall, C. Shorthouse, A. Clouston, and E. E. Powell. 1999. Fibrosis in chronic hepatitis C correlates significantly with body mass index and steatosis. Hepatology 29(4):1215-1219.
HRSA (Health Resources and Services Administration). 2016. Organ Procurement and Transplantation Network. https://optn.transplant.hrsa.gov/data (accessed October 28, 2016).
Kamper-Jørgensen, M., M. Ahlgren, K. Rostgaard, M. Melbye, G. Edgren, O. Nyrén, M. Reilly, R. Norda, K. Titlestad, and E. Tynell. 2008. Survival after blood transfusion. Transfusion 48(12):2577-2584.
Klevens, R. M., J. Miller, C. Vonderwahl, S. Speers, K. Alelis, K. Sweet, E. Rocchio, T. Poissant, T. M. Vogt, and K. Gallagher. 2009. Population-based surveillance for hepatitis C virus, United States, 2006–2007. Emerging Infectious Diseases 15(9):1499-1502.
Klevens, R. M., S. Liu, H. Roberts, R. B. Jiles, and S. D. Holmberg. 2014. Estimating acute viral hepatitis infections from nationally reported cases. American Journal of Public Health 104(3):482-487.
Lansky, A., T. Finlayson, C. Johnson, D. Holtzman, C. Wejnert, A. Mitsch, D. Gust, R. Chen, Y. Mizuno, and N. Crepaz. 2014. Estimating the number of persons who inject drugs in the United States by meta-analysis to calculate national rates of HIV and hepatitis C virus infections. PLoS One 9(5):e97596.
Martin, N., P. Vickerman, A. Clements, M. Cramp, D. De Angeles, J. Dillon, S. Fahey, G. Foster, D. Goldberg, and F. Gordon. 2013a. Are current treatment rates sufficient to reduce HCV prevalence among people who inject drugs? Model projections in seven UK settings. Journal of Hepatology 58(Suppl 1):S356.
Martin, N. K., M. Hickman, S. J. Hutchinson, D. J. Goldberg, and P. Vickerman. 2013b. Combination interventions to prevent HCV transmission among people who inject drugs: Modeling the impact of antiviral treatment, needle and syringe programs, and opiate substitution therapy. Clinical Infectious Diseases 57(Suppl 2):S39-S45.
Martinello, M., and G. J. Dore. 2016. Editorial commentary: Interferon-free hepatitis C treatment efficacy from clinical trials will translate to “real world” outcomes. Clinical Infectious Diseases 62(7):927-928.
Massachusetts Department of Public Health. 2016. Bureau of Infectious Disease. http://www.mass.gov/eohhs/gov/departments/dph/programs/id (accessed November 1, 2016).
NASEM (National Academies of Sciences, Engineering, and Medicine). 2016. Eliminating the public health problem of hepatitis B and C in the United States: Phase one report. Washington, DC: The National Academies Press.
NIDDK (National Institute of Diabetes and Digestive and Kidney Diseases). 2016. Cirrhosis. https://www.niddk.nih.gov/health-information/liver-disease/cirrhosis (accessed November 15, 2016).
Nolan, S., V. Dias Lima, N. Fairbairn, T. Kerr, J. Montaner, J. Grebely, and E. Wood. 2014. The impact of methadone maintenance therapy on hepatitis C incidence among illicit drug users. Addiction 109(12):2053-2059.
Ogden, C. L., M. D. Carroll, B. K. Kit, and K. M. Flegal. 2014. Prevalence of childhood and adult obesity in the United States, 2011-2012. JAMA 311(8):806-814.
Onofrey, S., J. Aneja, G. A. Haney, E. H. Nagami, A. DeMaria, G. M. Lauer, K. Hills-Evans, K. Barton, S. Kulaga, and M. J. Bowen. 2015. Underascertainment of acute hepatitis C virus infections in the U.S. surveillance system: A case series and chart review. Annals of Internal Medicine 163(4):254-261.
Oppenheimer, E., C. Tobutt, C. Taylor, and T. Andrew. 1994. Death and survival in a cohort of heroin addicts from London clinics: A 22-year follow-up study. Addiction 89(10):1299-1308.
Perucci, C. A., M. Davoli, E. Rapiti, D. D. Abeni, and F. Forastiere. 1991. Mortality of intravenous drug users in Rome: A cohort study. American Journal of Public Health 81(10):1307-1310.
Poynard, T., P. Bedossa, and P. Opolon. 1997. Natural history of liver fibrosis progression in patients with chronic hepatitis C. The Lancet 349(9055):825-832.
Poynard, T., V. Ratziu, F. Charlotte, Z. Goodman, J. McHutchison, and J. Albrecht. 2001. Rates and risk factors of liver fibrosis progression in patients with chronic hepatitis C. Journal of Hepatology 34(5):730-739.
Poynard, T., P. Lebray, P. Ingiliz, A. Varaut, B. Varsat, Y. Ngo, P. Norha, M. Munteanu, F. Drane, and D. Messous. 2010. Prevalence of liver fibrosis and risk factors in a general population using non-invasive biomarkers (FibroTest). BMC Gastroenterology 10(40).
Pradat, P., N. Voirin, H. L. Tillmann, M. Chevallier, and C. Trépo. 2007. Progression to cirrhosis in hepatitis C patients: An age-dependent process. Liver International 27(3):335-339.
Razavi, H., I. Waked, C. Sarrazin, R. Myers, R. Idilman, F. Calinas, W. Vogel, M. Correa, C. Hézode, P. Lázaro, U. Akarca, S. Aleman, I. Balık, T. Berg, F. Bihl, M. Bilodeau, A. Blasco, C. Brandão Mello, P. Bruggmann, M. Buti, J. Calleja, H. Cheinquer, P. Christensen, M. Clausen, H. Coelho, M. Cramp, G. Dore, W. Doss, A. Duberg, M. El-Sayed, G. Ergör, G. Esmat, K. Falconer, J. Félix, M. L. G. Ferraz, P. Ferreira, S. Frankova, J. García-Samaniego, J. Gerstoft, J. Giria, F. J. Gonçales, E. Gower, M. Gschwantler, M. Guimarães Pessôa, S. J. Hindman, H. Hofer, P. Husa, M. Kåberg, K. Kaita, A. Kautz, S. Kaymakoglu, M. Krajden, H. Krarup, W. Laleman, D. Lavanchy, R. Marinho, P. Marotta, S. Mauss, C. Moreno, K. Murphy, F. Negro, V. Nemecek, N. Örmeci, A. Øvrehus, J. Parkes, K. Pasini, K. Peltekian, A. Ramji, N. Reis, S. Roberts, W. Rosenberg, F. Roudot-Thoraval, S. Ryder, R. Sarmento-Castro, D. Semela, M. Sherman, G. Shiha, W. Sievert, J. Sperl, P. Stärkel, R. Stauber, A. Thompson, P. Urbanek, P. Van Damme, I. van Thiel, H. Van Vlierberghe, D. Vandijck, H. Wedemeyer, N. Weis, J. Wiegand, A. Yosry, A. Zekry, M. Cornberg, B. Müllhaupt, and C. Estes. 2014. The present and future disease burden of hepatitis C virus (HCV) infection with today’s treatment paradigm. Journal of Viral Hepatitis 21(Suppl 1):34-59.
Ries, L. A. G., J. L. Young, Jr., G. E. Keel, M. P. Eisner, Y. D. Lin, and M.-J. D. Horner. 2007. SEER Survival Monograph: Cancer survival among adults: U.S. SEER Program, 1988-2001, patient and tumor characteristics. NIH pub. no. 07-6215. Bethesda, MD: National Cancer Institute, SEER Program.
Seeff, L. B. 2002. Natural history of chronic hepatitis C. Hepatology 36(5 Suppl 1):S35-S46.
SEER (Surveillance, Epidemiology, and End Results) Program. 2015. SEER*Stat Database: Incidence - SEER 9 Regs Research Data, Nov 2015 Sub (1973-2013).
Simmons, B., J. Saleem, K. Heath, G. S. Cooke, and A. Hill. 2015. Long-term treatment outcomes of patients infected with hepatitis C virus: A systematic review and meta-analysis of the survival benefit of achieving a sustained virological response. Clinical Infectious Diseases 61(5):730-740.
Smith, B. D., R. L. Morgan, G. A. Beckett, Y. Falck-Ytter, D. Holtzman, and J. W. Ward. 2012. Hepatitis C virus testing of persons born during 1945–1965: Recommendations from the Centers for Disease Control and Prevention. Annals of Internal Medicine 157(11):817-822.
Smith-Palmer, J., K. Cerri, and W. Valentine. 2015. Achieving sustained virologic response in hepatitis C: A systematic review of the clinical, economic and quality of life benefits. BMC Infectious Diseases 15(19).
Suryaprasad, A. G., J. Z. White, F. Xu, B.-A. Eichler, J. Hamilton, A. Patel, S. B. Hamdounia, D. R. Church, K. Barton, C. Fisher, K. Macomber, M. Stanley, S. Guilfoyle, K. Sweet, S. Liu, K. Iqbal, R. Tohme, U. Sharapov, B. Kupronis, J. Ward, and S. Holmberg. 2014. Emerging epidemic of hepatitis C virus infections among young non-urban persons who inject drugs in the United States, 2006–2012. Clinical Infectious Diseases 59(10):1411-1419.
Tsui, J. I., J. L. Evans, P. J. Lum, J. A. Hahn, and K. Page. 2014. Association of opioid agonist therapy with lower incidence of hepatitis C virus infection in young adult injection drug users. JAMA Internal Medicine 174(12):1974-1981.
Turner, K. M. E., S. Hutchinson, P. Vickerman, V. Hope, N. Craine, N. Palmateer, M. May, A. Taylor, D. De Angelis, and S. Cameron. 2011. The impact of needle and syringe provision and opiate substitution therapy on the incidence of hepatitis C virus in injecting drug users: Pooling of U.K. evidence. Addiction 106(11):1978-1988.
United Nations. 2015. World population prospects: The 2015 revision, key findings and advance tables. Working paper no. ESA/P/WP.241. New York: United Nations, Department of Economic and Social Affairs, Population Division.
Volk, M. L., R. Tocco, S. Saini, and A. S. Lok. 2009. Public health impact of antiviral therapy for hepatitis C in the United States. Hepatology 50(6):1750-1755.
White, B., G. J. Dore, A. R. Lloyd, W. D. Rawlinson, and L. Maher. 2014. Opioid substitution therapy protects against hepatitis C virus acquisition in people who inject drugs: The HITS-c study. Medical Journal of Australia 201(6):326-329.
WHO (World Health Organization). 2016. Combating hepatitis B and C to reach elimination by 2030. Geneva, Switzerland: WHO.
Yang, J. D., B. Kim, S. O. Sanderson, J. L. S. Sauver, B. P. Yawn, R. A. Pedersen, J. J. Larson, T. M. Therneau, L. R. Roberts, and W. R. Kim. 2012. Hepatocellular carcinoma in Olmsted County, Minnesota, 1976-2008. Mayo Clinic Proceedings 87(1):9-16.
This page intentionally left blank.


