
2
Changing Landscape: Demographics, Health Status, and Nutritional Needs
In the opening session, moderated by Pamela Starke-Reed, deputy administrator for nutrition, food safety, and quality, Agricultural Research Service, U.S. Department of Agriculture, speakers provided an overview of the demographics, health status, and nutritional needs of the older U.S. population.
Drawing on the most recent report issued by the Federal Interagency Forum on Aging-related Statistics—Older Americans 2016: Key Indicators of Well-Being (Federal Interagency Forum on Aging-related Statistics, 2016), which itself draws on multiple data sources—Jennifer Madans, associate director for science, National Center for Health Statistics, described trends in six categories of key indicators of well-being in the U.S. population of older adults. Mary Ann Johnson, Bill and Jane Flatt professor in foods and nutrition, College of Family and Consumer Sciences, and interim director, Institute of Gerontology, College of Public Health, University of Georgia, then discussed healthy aging as not only living a long life but also living in good health, and reviewed several different methodological approaches researchers have been using to identify biomarkers of healthy aging.
THE CHANGING FACE OF OLDER AMERICANS: KEY INDICATORS OF WELL-BEING1
Drawing exclusively on the most recent report of the Federal Interagency Forum on Aging-related Statistics (2016)—Older Americans 2016:
___________________
1 This section summarizes information presented by Dr. Madans.
Key Indicators of Well-Being—Madans described trends in the following six categories of key indicators of well-being in the older U.S. population: population characteristics, economic indicators, health status, health risks and behavior, health care, and environmental indicators.
The Federal Interagency Forum on Aging-related Statistics, Madans explained, was established in 1986 by the National Institute on Aging of the National Institutes of Health in cooperation with the National Center for Health Statistics and the U.S. Census Bureau. Today it includes 16 federal agencies. The group was formed, Madans explained, to foster collaboration among federal agencies that either produce or use statistical data on the older population, to improve cooperation across agencies and disciplines, and to improve consistency in how data on the aging population are reported. One way for the forum to carry out its mission, she said, is to compile periodic reports on indicators of well-being for this population from across the federal data system. Madans noted that although these reports are issued every 3-4 years, the data tables are updated online more frequently. The report covers 41 indicators in the six categories cited above. Additionally, every report also has a special feature. The special feature in the 2016 report is on informal caregiving.
Madans explained that the indicators she would be presenting were among those that are related to nutrition; moreover, because the report itself draws on multiple data sources, some of the data cover the entire U.S. population, while other data cover only the civilian noninstitutionalized (i.e., household) population. She emphasized that the report contains a wealth of information on the well-being of older Americans that could not be covered in her brief presentation.
Population Characteristics
Madans reported that the number of people in the United States aged 65 and over increased from about 3 million in 1900 to about 46 million in 2014. She highlighted the especially large increase in the number of people in this age group in 2011, which is when the baby boomers (those born after the end of World War II, between 1946 and 1964) began turning 65 (see Figure 2-1). This large increase in the number of people aged 65 and over is expected to continue, she observed, but the growth rate is projected to slow after 2030, when the last of the baby boomers turn 65. Although the numbers of people in this age group will continue to increase, she remarked that they will plateau as a percentage of the total U.S. population at around 21 percent sometime between 2020 and 2030. The population aged 85 and over is projected to see rapid growth after 2030 as the baby boomers enter this age range. Compared with about 100,000 in 1900, Madans noted, an
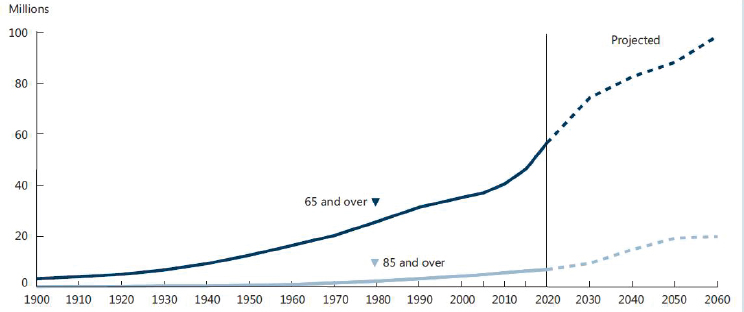
SOURCES: Presented by J. Madans, September 13, 2016. From Federal Interagency Forum on Aging-related Statistics, 2016.
expected 20 million people over age 85 will be living in the United States by 2060 according to projections.
Madans explained that the future projections illustrated in Figure 2-1—for example, that 90 million people aged 65 and older are projected out to 2060—are a function of assumptions about mortality rates. She noted that these assumptions are more accurate for the near than for the more distant future.
Not only are the numbers of people aged 65 and 85 and older increasing, Madans continued, but the demographic characteristics of these populations are also changing. She highlighted education first, she said, because it is related to so many other factors, such as income, as well as to lifestyle characteristics that affect nutrition. The percentages of the U.S. population aged 65 and older with a high school diploma and with a bachelor’s degree have been increasing since 1965 (see Figure 2-2). By 2015, 84 percent of the U.S. population had at least a high school education, and 27 percent had a bachelor’s degree or higher.
In addition to educational attainment, Madans continued, living arrangements can have major effects on people’s lives. She showed data on living arrangement for 2015 by both sex and race/ethnicity. She remarked that people sometimes think of the 65 and older population “monolithically,” as though they were all the same, but, she said, “That is certainly not true.” She argued that examining indicators by sex and by race/ethnicity provides insight into this population’s heterogeneity. Most individuals aged
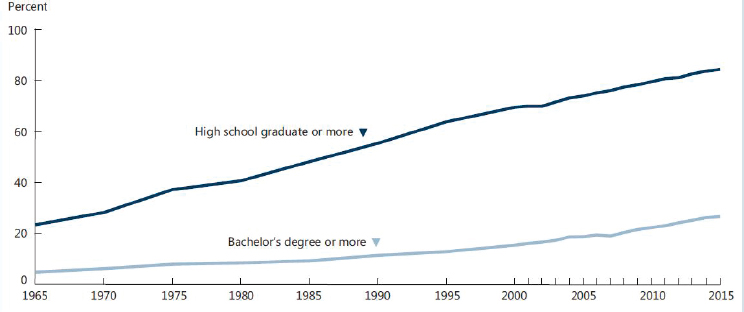
SOURCES: Presented by J. Madans, September 13, 2016. From Federal Interagency Forum on Aging-related Statistics, 2016.
65 and older still live in the community, she said. The majority, especially among men, are living with a spouse, with implications for shopping, eating (nutrition), and health care. Madans reported that among those aged 65 and older, 45 percent of women are living with a spouse, compared with 70 percent of men; women are more likely to live alone (36 percent) or with other relatives (16 percent) compared with men (20 percent and 6 percent, respectively). She emphasized the variation by race and ethnicity in these characteristics. Among black women, for example, compared with other racial/ethnic groups, higher percentages live alone (43 percent) or with other relatives (30 percent), and a lower percentage live with a spouse (24 percent). Similarly for black men, a higher percentage live alone (30 percent, compared with 20 percent across all racial/ethnic groups).
Economic Indicators
Madans reported that since 1974 there has been a relatively large increase in the percentage of the population aged 65 and over living at 400 percent or greater above the federal poverty threshold. In 2014, she noted, 36 percent of the 65 and over population was in this higher income group. Meanwhile, she said, the percentage of people 65 and over living in poverty has declined, to about 10 percent in 2014. The percentage living at 100 to 199 percent above the poverty threshold has declined as well, to 23 percent in 2014. In 2014, 31 percent of the population 65 and older was
living at between 200 and 399 percent above the poverty threshold. This overall improvement in the income distribution among this older population is due to many factors, Madans said, including education and changes in public policies.
With respect to sources of income, Madans continued, overall, 86 percent of this population in 2014 lived in families with income from social security, 59 percent were receiving income from pensions, and 67 percent were receiving some income from assets. More specifically, she noted, income from social security accounted for 49 percent of family income, income from earnings for 24 percent, and pensions for 16 percent. She observed that the percentage distribution of per capita income for those 65 and older varies across income quintiles (i.e., lowest through highest fifth). In the lowest quintile, she said, social security is a much greater sole source of income (67 percent of people in this age group) relative to the highest quintile (18 percent). She went on to report that, relative to the lowest quintile, those in the highest quintile receive much more of their income only from earnings (40 percent) or pensions (26 percent).
With respect to how this money is spent, Madans said, housing continues to be the largest expenditure, as it is among those aged 55-64, accounting for 32 to 37 percent of income among individuals aged 65 and older. She finds it interesting that the amount spent on food does not change much with age, accounting for 13 percent of income among those aged 65 and older, compared with 12 percent among those aged 55-64. She went on to note that health care expenditures show a slight increase, from 9 percent among those 55-64 to 12 percent among those 65-74 and 16 percent among those 75 and older.
Health Status
Madans noted that health status indicators include life expectancy, which since 1981 and at both ages 65 and 85 has increased for both women and men and among both the white and black populations. Additionally, she pointed out, variation in life expectancy among these groups (at both ages 65 and 85) has declined over time (i.e., since 1981). Today (based on 2014 data), life expectancy at age 65 is higher for the white than for the black population, but that differential, which is about 3.4 years at birth, drops to 1.1 years at age 65 and then switches at age 85, with the black population having a higher life expectancy of about half a year. It has been suggested, Madans noted, that this pattern may reflect in part the fact that death rates in the black population are higher in the younger age groups, so that the surviving cohort may be more robust. There have also been some issues with misreporting of age, she observed, particularly on death certificates, on which, mainly in the past, age tended to be overestimated.
Regarding the sex differential in life expectancies, women continue to have longer life expectancies than men at birth at both ages 65 and 85.
Another health status indicator, Madans continued, is cause of death. Since 1981, there has been a major decline in death rates due to heart disease among individuals 65 and older. In fact, she remarked, death rates have declined for all leading causes of death except Alzheimer’s disease and unintended injuries. She commented that many people are watching the death rate trajectories for heart disease and cancer, wondering whether and when cancer will become the leading cause of death. Although this has not yet happened nationally, she noted that it has happened in some states and among some age groups. In her opinion, the greater issue of concern with respect to cause of death is that most mortality statistics are based on underlying cause of death. This is an issue, she explained, because there can be only one underlying cause of death per death certificate, yet it can be very difficult to disentangle the underlying cause of death (i.e., the cause that set in motion the process that ultimately led to death) from the other, often multiple, causes listed on the certificate. The number of chronic conditions increases with age, she noted, so more conditions contribute to death. Moreover, she emphasized, there is a difference between dying from a disease and dying with that disease. This is particularly an issue for Alzheimer’s disease death rates, she remarked, when Alzheimer’s may not be the underlying cause of death but have contributed to the death or when it may be present but not related to the death. The same is true of diabetes, she said. In her opinion, more information about mortality in the older population can be obtained from examining multiple causes of death, although doing so creates a statistical challenge because of double counting. She believes these issues should be considered in evaluating mortality statistics based on underlying causes of death in populations with multiple chronic conditions.
The most prevalent chronic health conditions in the noninstitutionalized population aged 65 and older are similar to the leading causes of death, Madans observed. In addition to heart disease and hypertension, however, this population experiences high rates of arthritis, which, although it does not affect death, does affect functioning.
Older Americans 2016 provides information on three oral health indicators: dental insurance, dental visits per year, and natural teeth. Dental insurance decreases with age, Madans noted, with 30 percent of people aged 65-74 and over carrying this insurance compared with 20 percent of those aged 75-84 and 16 percent of those aged 85 and over. Dental visits in the past year decline as well, she reported, from 66 percent of people aged 65-74 to 58 percent of those aged 75-84 and 56 percent of those aged 85 and over. The percentage of people with no natural teeth rises from 16 percent
of people aged 65-74 to 25 percent of those aged 75-84 and 31 percent of those aged 85 and over.
Dementia is a major health issue for this age group, Madans continued. Data on dementia in Older Americans 2016 are based on a combination of diagnosed dementia and cognitive testing, she noted. The percentage of the non-nursing home population aged 65 and over with dementia increases with age among both men and women, she observed: 5 percent and 3 percent, respectively, for those aged 65-74; 11 percent and 13 percent, respectively, for those aged 75-84; and 24 percent and 30 percent, respectively, for those 85 and over.
Looking a little more broadly at functional limitations in general (i.e., including limitations in vision, hearing, mobility, communication, cognition, and self-care), Madans reported that in 2014, 19 percent of men and 24 percent of women aged 65 and over had any of these limitations. Of the specific functional limitations included in this indicator, mobility limitations are the most prevalent, she said, affecting 11 percent of men and 17 percent of women in this age group.
Health Risks and Behavior
In the category of health risks and behavior, Madans observed that the quality of the diet of older Americans does not meet recommended standards, especially with respect to sodium; only whole fruit and total protein Healthy Eating Index (HEI)-2010 scores were at or close to 100 (i.e., the standard), which reflects an average diet. The same is true of physical activity, she reported. Although some increase has been seen over time (i.e., since 1998) with respect to the percentage of people aged 65 and older meeting the 2008 federal guidelines for physical activity, still only 12 percent met these guidelines in 2014. Finally, obesity rates among older adults have been increasing since the 1980s, with rates being higher among the younger old (i.e., aged 65 to 74) than among the older old (i.e., 75 and older). In 2011-2014, about 40 percent of people aged 65-74 and about 30 percent of those aged 75 and older had obesity.
Health Care
Health care expenditure data indicate large age differences in spending on health care over time, Madsen reported, with people aged 85 and older spending the most but with the differences between the older age groups becoming smaller over time (i.e., from 1992 to 2012). Annual health care costs for those 85 and older decreased between 1992 and 2012, she noted, compared with a slight increase among younger old-age groups (i.e., 65-74
and 75-84). Most of these expenditures are going to physician and outpatient care, she observed, a consistent trend from 2008 through 2012.
In terms of residential services being provided to the 65 and older population, Madans reiterated that most of this population is living in the community. Among those 85 and older, she reported, 77 percent are living in the community, 15 percent in long-term care facilities, and 8 percent in community housing with services (e.g., meal preparation, transportation, housekeeping).
Looking more broadly at providers of long-term care, Madans noted that most users of such care are receiving home care (i.e., care provided by home health agencies). Home health care is distributed fairly equally among the different old-age categories (i.e., 65-74, 75-84, and 85 and older), she said, but a greater percentage of those 85 and older relative to those 65-74 and 75-84 are receiving care in nursing homes and hospices.
Environmental Indicators
Finally, with respect to environmental indicators of well-being in the older population, Madans focused on how time is used. Across all older age categories, the largest percentage of the day is spent sleeping. Madans noted that this percentage increases slightly with age from 35 percent among people 55-64, to 37 percent among those 65-74, and 38 percent among those 75 and over.
Also with age, Madans added, people spend more time engaged in leisure activities, which account for 33 percent of time among people 75 and older, compared with 29 percent among those 65-74 and 23 percent among those 55-64. Most leisure time is spent watching television, which represents 56 percent of leisure time among people 75 and over, compared with 58 percent and 60 percent among people 65-74 and 55-64, respectively. Madans suggested that what people eat while they watch television may explain many of the trends she had described.
Finally, Madans reported that leisure time spent socializing and communicating decreases with age, from 11 percent of leisure time among those 55-64 and 65-74 to 9 percent among those 75 and older, while time spent reading increases, from 7 percent and 9 percent in the 55-64 and 65-74 age groups, respectively, to 14 percent among those 75 and older. Generally, she observed, solitary leisure time increases with age.
HEALTHY AGING PERSPECTIVE2
Johnson began by asking, “What is health?” The World Health Organization (WHO) defines health as “a state of complete physical, mental, and social well-being and not merely the absence of disease or infirmity” (WHO, 1948). Johnson asserted that nutritionists usually think about health from the physical perspective, but that the concept is much broader than this.
What Is Healthy Aging?
Next, Johnson asked, “What is healthy aging?” She described it as not only living a long life but also living in good health. Living a long life, she said, is a result of interactions between genes and the environment, including the nutritional environment. Over the course of the lives of many people living today, she said, living conditions have improved. This improvement, she observed, has resulted in decreased mortality, relaxed evolutionary pressures for early survival and reproduction, greater resource investment in body maintenance and repair, and increased average life expectancies and maximum lifespans (Westendorp, 2006). Healthy aging involves not only reductions in mortality, she argued, but also reductions in morbidity, including chronic conditions, mobility limitations, limitations in activities of daily living (i.e., eating, bathing, dressing, toileting, transferring/walking, continence), sensory changes, and declining cognition.
Johnson continued by stating that population-level metrics of healthy aging include both life expectancy and healthy life expectancy. She defined the latter as life expectancy minus years lived in less than full health as a result of disease and/or injury. In 2013, she noted, average life expectancy across the Americas at birth was 77 years, but average healthy life expectancy was only 67 years (UN, 2015). Another way to look at healthy life expectancy, she said, is to focus on age 65 (as opposed to at birth). In the United States, she reported, healthy life expectancy at age 65 varies among states (see Figure 2-3), from 80 or greater (i.e., an additional 15 years or more) in some states to less than 78 (i.e., fewer than 13 more years) in others (CDC, 2013). She asserted that this variation reflects significant health disparities, particularly in the southern region of the United States.
Biomarkers of Healthy Aging
Johnson said she used to think that biomarkers were things that could be measured only in the blood. But in older adults, she said, biomarkers
___________________
2 This section summarizes information presented by Dr. Johnson.
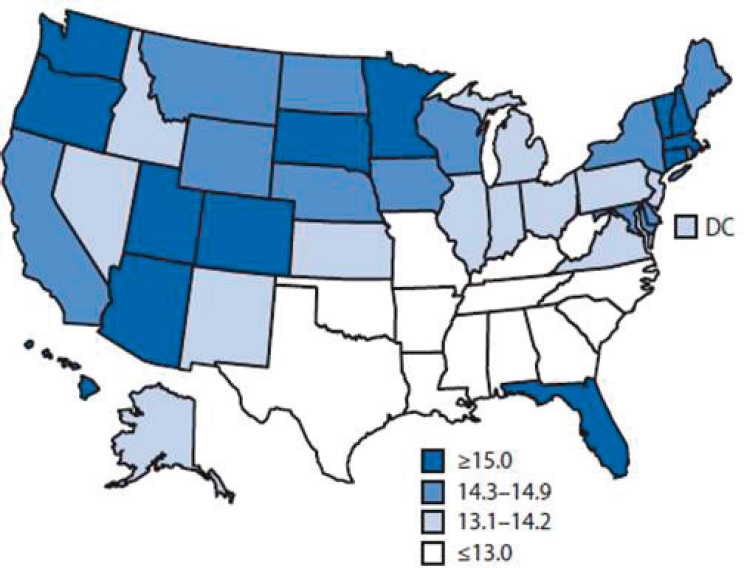
NOTE: Healthy life expectancy is calculated from a combination of mortality data and morbidity or health status data.
SOURCES: Presented by M. A. Johnson, September 13, 2016. From CDC, 2013.
are about “so much more.” Biomarkers of healthy aging, she noted, include markers of disease onset, progression, and severity; physiological function; endocrine and immune function; and inflammatory responses. They also include genetic markers. But what becomes increasingly important as people age, Johnson asserted, both for older adults themselves and for the people who care for them, is physical and mental capability, including concerns about averting cognitive decline and Alzheimer’s disease, maintaining independence (e.g., being able to live in one’s own home and do things by oneself), avoiding nursing home admissions, and preventing hospital readmissions.
Johnson provided several examples of different ways in which investigators search for biomarkers of healthy aging. In her opinion, it is important to consider the rationale behind the different biomarkers when thinking about which biomarker to use in designing a new food, for example, or studying a disease or care process.
First, Johnson explained, are aging rates used in cellular and animal studies, which show that the expression of age-related diseases begins in midage and that changing the diet by reducing calories, reducing protein, or balancing micronutrients can delay this expression and lead to healthy aging and longevity (Dato et al., 2016). However, she cautioned against directly translating results from cellular and animal studies to humans, as Dato and colleagues (2016) also caution. With respect to reducing protein, for example, she remarked that the human protein requirement may be higher than current recommended levels. With respect to caloric restriction, she continued, there is a high level of food insecurity in populations with the highest chronic disease incidence, prevalence, and severity.
Next are biologic age biomarkers being examined in the MARK-AGE study, a large, collaborative study across Europe that has recruited more than 3,000 people aged 35-74 (Bürkle et al., 2015). In most such studies, Johnson said, learning something unique about the oldest group of people requires understanding what is going on in younger age groups as well. In addition to recruiting across a wide age range, she explained, the researchers are selecting people from long-lived families, such as 90-year-old sibling pairs, and some of the participants will also undergo a longitudinal phase of the study. Finally, she noted, the researchers have recruited a small number of participants with aging-related genetic disorders, such as progeria (accelerated aging).
Johnson described some of the work behind the MARK-AGE study, beginning with recruitment (i.e., figuring out how to recruit). She reported that the researchers are collecting data on a number of markers, including DNA-based markers, markers based on proteins and their modifications, immunological markers, clinical chemistry markers, hormones, markers of metabolism, and oxidative stress markers. She noted that such a massive amount of data has required addressing data analysis and bioinformatics challenges. Finally, she said, the researchers have been challenged by the many ethical issues that come with knowing so much about so many people. She suggested that as the data become available, this will be a “study to watch.”
Another approach to identifying healthy aging biomarkers, Johnson continued, involved developing a longevity phenotype and creating what is called a Healthy Aging Index (Sanders et al., 2014). Here, she said, rather than generating a large set of potential biomarkers, the researchers wanted to identify a subset of markers that are very good predictors of mortality and are heritable. The data examined for this study came from the Cardiovascular Health Study, an ongoing study of risk for cardiovascular disease in about 6,000 participants aged 65 and older. Through a series of analyses, Johnson explained, the researchers identified five indicators of mortality: (1) systolic blood pressure, (2) pulmonary vital capacity, (3)
serum creatinine (for kidney function), (4) fasting glucose, and (5) cognitive function (based on the modified Mini-Mental Status Examination). They combined these five indicators by assigning each a score of 0, 1, or 2 based on clinical cutoff, with a maximum Healthy Aging Index score of 10 for an individual. When they compared the worst- and best-tertile scores, the mortality hazard ratio was 2.62. Johnson suggested, that given how predictive of decreased mortality the above five biomarkers were, one way to study how nutrition impacts mortality would be to see how it impacts these biomarkers.
Reflecting on the heritable nature of the biomarkers identified by Sanders and colleagues (2014), which the researchers analyzed in a separate study, Johnson highlighted the importance of being mindful of the genetic underpinning of any biomarker for healthy aging. “Nutrition can do a lot,” she said, “but it’s going to be working in concert with our genetics.”
There have been so many studies of mortality predictors, Johnson continued, that it now is possible to conduct systematic reviews of these studies. She highlighted a review of 23 cohort studies that met the researchers’ inclusion criteria (Barron et al., 2015)—that the predictors be blood markers (because of their noninvasive nature) and that the baseline sample age be between 50 and 75 (which is how Barron and colleagues [2015] define midage). Among these 23 studies, she observed, the researchers found 51 potential biomarkers. Of these, they identified 20 actual biomarkers, including 25-hydroxyvitamin D, but for only a few of those 20 were enough data available (i.e., from multiple studies) to enable meta-analysis. Among these final few, Johnson said, the researchers identified three that were associated with all-cause mortality: (1) C-reactive protein; (2) white cell count; and (3) NT-proBNP (N-terminal pro brain natriuretic peptide), which is also a good predictor of heart function and failure.
Finally, Johnson reported, researchers have been searching for functional, or “geriatric,” markers of healthy aging. As an example, she described a literature review conducted by John Mather’s group at Newcastle University, United Kingdom, in response to a request from the Medical Research Council (MRC) (Lara et al., 2015). The group solicited expert feedback and hosted a workshop, and their work was also overseen by the MRC Population Health Sciences Group. Johnson explained that the researchers developed functional biomarkers of healthy aging in five domains: (1) physiological functioning (i.e., cardiovascular function, lung function, glucose metabolism, and musculoskeletal function); (2) endocrine function (i.e., hypothalamic-pituitary-adrenal [HPA] axis, sex hormones, growth hormones); (3) physical capability (i.e., strength, balance, dexterity, locomotion); (4) cognitive function (i.e., memory, processing speed, executive function); and (5) immune function (i.e., inflammatory markers).
In Johnson’s opinion, biomarkers of physical capability and cognitive
function are particularly important and are the ones aging specialists “really look at.” Poor balance, for example, is a risk factor for falls. One of every three older people fall at least once per year, Johnson remarked, and falls are a leading cause of traumatic brain injuries and hip and other bone fractures. She also emphasized the important role of cognition in maintaining independence.
Where Does Nutrition Fit in?
Johnson then posed the question, “Where does nutrition fit in?” She noted that nutrition plays a role in biological pathways of aging and in prevention and treatment of disease, including obesity. Like Madans, she observed that the prevalence of obesity among older adults is increasing. Not only does obesity increase the risk for many chronic diseases, she said, but there is also good evidence to suggest that it is a risk factor for early admission to a nursing home.
Johnson emphasized that nutrition also plays a role in meeting current dietary recommendations. She referred to Madans’s remarks on the overall low quality of the diet of older Americans. She believes that current research on protein could result in a change in the recommendations on dietary protein and noted that sodium recommendations will be reevaluated as well and may change.
Johnson reiterated that a large number of older people are food insecure, a condition that in 2008 characterized more than 8 percent of households nationally (Lee et al., 2010) and close to 30 percent of households in some vulnerable subgroups (USDA, 2016). When thinking about nutrition interventions for biomarkers, she asserted, it is important to ensure that people are well nourished and to be mindful of whether they will benefit from the intervention.
Johnson also encouraged greater participation in the national conversation on health economy. For example, she observed, several of the quality care measures for affordable care organizations (e.g., depression, HbA1c, blood pressure, heart failure, cardiovascular disease) are related to healthy aging.
Finally, Johnson emphasized the need to think about where nutrition interventions for biomarkers fit into care transitions (e.g., when someone is discharged from a hospital and sent home but with no meal support), readmissions to hospitals, and rehabilitation facilities. Although older adults want to live independently, she said, “things happen,” and many people end up in acute or long-term care. She also called attention to the existence of a social service health system for older adults that encompasses home- and community-based services, including the provision of meals (e.g., Meals on Wheels). She mentioned an ongoing national conversation on how the
medical health and social services health systems can work together and suggested that meals are an important link between the two.
DISCUSSION WITH THE AUDIENCE
In the discussion period following the presentations of Madans and Johnson, a wide range of topics were addressed.
Studying Nutrition in Assisted Living Facilities
There was considerable discussion around the challenge of evaluating nutrition in assisted living facilities and the lack of data in this area. This discussion was initiated by Johanna Dwyer, workshop planning committee member, who suggested the need for more information on this subject and asked how assisted living facilities are grouped in national surveys. She mentioned having recently eaten dinner in what she described as a “very fancy assisted living place” in Boston with a group of people who were all older than 80, including a Nobel laureate. At the table, people were having all sorts of problems eating, she said, either because they had Parkinson’s disease, because they could not see the plate, or for some other reason. She wanted to know what is going on in terms of nutrition, she said, “in these very expensive facilities.”
Madans replied that she saw this as an interesting question from an operational point of view. She noted that assisted living facilities vary in characteristics and usually are not considered institutions, so the people living in them are not part of the institutional population. Her concern, she said, is that when a household survey is being conducted, the interviewer shows up at such a facility and thinks it is a nursing home, and therefore excludes it from the survey. Likewise, when a nursing home survey is being conducted, the interviewer realizes that an assisted living facility is not a nursing home and therefore excludes it from that survey as well. As a result, assisted living facilities can get lost in the survey process. When she first started working in this field, Madans said, there were clear distinctions between homes and nursing homes, whereas now there is a continuum. She mentioned efforts to define aspects of living arrangements and living places so that data samples can be drawn from across this continuum. Another challenge, she added, is that most assisted living facilities are state regulated. Because of inconsistencies across states, the data on these facilities need to be analyzed in terms of services offered. Madans agreed that this is a growing area in which more information is needed. In her opinion, another area that needs to be addressed is care being provided in the home.
Johnson added that housing with community services can be anything from a U.S. Department of Housing and Urban Development (HUD) facility
for low-income residents to a private-pay upscale residence. These facilities would vary widely in terms of nutritional services being provided, if at all.
Sharon Donovan, workshop presenter, mentioned a study conducted in Ireland on the gut microbiome among older adults who lived at home and then moved into long-term care. The researchers found that when people moved into long-term care, their microbiota became much less diverse, as well as more similar to those of the other residents in the facility. Additionally, Donovan commented on what has been learned about the importance of exercise among older adults, for example, with respect to cognition.
The Evolution of Nutritional Intervention
David Goldman, Food Forum member, commented on what he described as the “myriad” of biomarkers for healthy aging and how, collectively, they have been well described with respect to their associations with various conditions. He wondered whether this work will evolve to considering when an intervention is appropriate and how to evaluate that intervention. Additionally, he speculated as to whether nutritional intervention is transitioning beyond simply telling people what they should and should not eat. Johnson replied that a considerable amount of data needs to be translated into action (i.e., interventions that help people), and that there is growing recognition that just telling people what they should be eating is not working. She said that based on her experience, older adults are highly motivated, but that as people age they lose some of their ability to do what they want, such as go to the store to shop. She agreed that the field needs to become more action oriented.
Research to Design Better Nutritional Programs for the Aging Population
Dwyer asked Madans her view on the best way for the National Center for Health Statistics to use additional resources, should they become available, to design better nutritional programs for the aging population. Madans replied that no one thing would lead to everyone living longer, healthier lives. Teasing apart the multiple indicators at play at the national level, including among the oldest old, will require larger studies, she observed. Additionally, while cross-sectional studies are, she said, “absolutely key,” she believes the field would benefit from more longitudinal studies. She suspects that people are aging healthier today than in the past. Finally, she called for more studies from the provider perspective, which she said has not attracted as much attention from researchers, or as much funding, as the people perspective. So while the National Center for Health Statistics has started to conduct residential care surveys, she noted, they cannot do so very often, and the result is a gap in the knowledge base.
Sugar, Stress, Raw Foods, and Blue Zone Diets: Miscellaneous Comments and Questions
There was some discussion around the role of sugar in healthy aging and whether added and “natural” sugars differ. Specifically, an audience member asked whether anyone is studying the impact of added sugar on telomeres, inflammation, Alzheimer’s, diabetes, obesity, and other chronic diseases in older adults. Johnson replied that generally, added sugars do not function differently from natural sugars in terms of any disease outcome, although she was uncertain about inflammation. The broadest thinking, she said, is that overconsumption of any form of sugar will lead to problems. An audience member stated that it is an established fact that sugar, added sugar in particular, plays a significant role in the development of both metabolic and respiratory acidosis, which she claimed is the foundation of all disease. Johnson replied that excess consumption of any form of sugar can have metabolic consequences.
The audience member then added that, in addition to nutrition, chronic stress and cortisol play important roles in healthy aging to the extent that they affect what people eat and how nutritious it is, and commented on the difference between raw food and highly prepared, packaged foods, particularly with respect to the level of acrylamide in prepared foods. Johnson replied that as some people age, they lose their ability to chew and that certain kinds of processing are among the modifications made to keep food safe and accessible for these people.
Vivica Kraak, Food Forum member, asked whether any lessons can be learned from “Blue Zone” diets with respect to indicators of healthy aging, and commented on how the longevity of people who eat such diets reinforces the need for a more holistic view of physical, mental, and nutritional well-being. Johnson agreed that what is being learned about these communities supports the latter point. (Some of what is being learned about Blue Zone aging came up later in the workshop, in Cindy Davis’s presentation on the microbiome; see Chapter 4.)


