
3
Ecology and Epidemiology of Brucella abortus in the Greater Yellowstone Ecosystem
1. REVIEW OF BRUCELLOSIS CASES SINCE 1998
At the time of the last National Research Council (NRC) report in 1998, there had been no Brucella abortus infected cattle herds detected in the Greater Yellowstone Area (GYA) for several years. Between 2002 and 2016, a total of 22 cattle herds and 5 privately owned bison herds were infected (see Figure 3-1 and Table 3-1). These cases were distributed across all three states in the GYA (Idaho, Montana, and Wyoming), and the number of cases appears to be increasing over time (Cross et al., 2013c). Available field and molecular epidemiologic information on these herds suggests that elk are the most likely source of infection in each of these cases (Rhyan et al., 2013; Kamath et al., 2016).
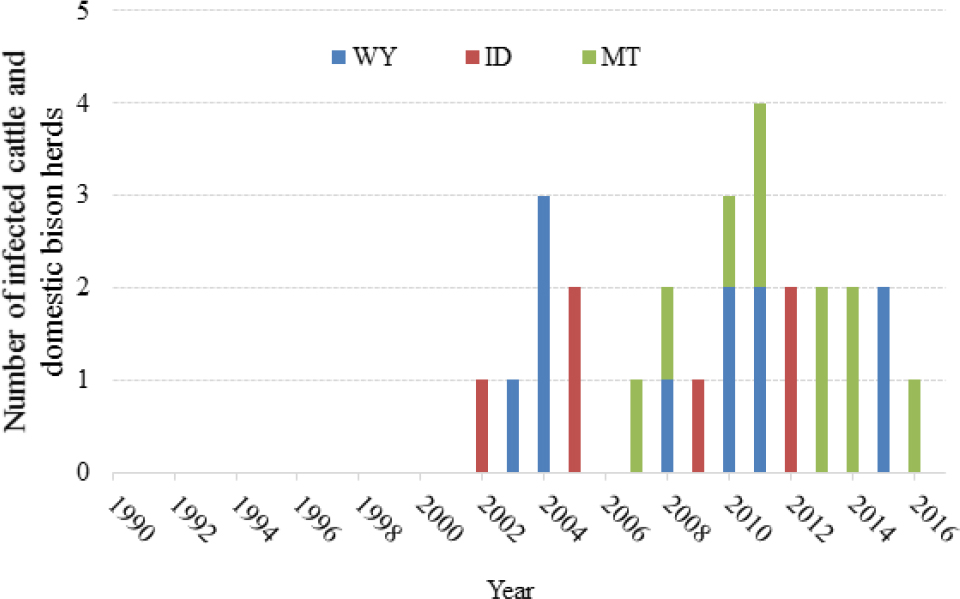
TABLE 3-1 Brucellosis Herds Detected in the GYA, 2002-2016
| State | Month | Year | Herd Type | Herd Size | County | Method of Detection | Disposition | Trace Out States |
|---|---|---|---|---|---|---|---|---|
| ID | Apr | 2002 | Beef cattle | 50 | Fremont | Herd test conducted due to culture positive elk in the area | Depopulated | ID, NE, WY |
| Nov | 2005 | Beef cattle | Unavailable | Bonneville | MCI trace | Depopulated | CA, CO, ID, MT, NE, UT | |
| Nov | 2005 | Beef cattle | 60 | Butte | Epidemiologic link to Bonneville herd | Depopulated | Unavailable | |
| Nov | 2009 | Beef cattle | 589 | Jefferson | Slaughter surveillance | Partially depopulated | Unavailable | |
| Apr | 2012 | Beef cattle | 65 | Fremont (outside of DSA) | California slaughter trace | Test and remove | AZ, ID, TX, UT | |
| Mar | 2012 | Bison | 268 | Bonneville | DSA relatedtest | Test and remove | ID | |
| MT | May | 2007 | Beef cattle | 260 | Park (Carbon) | Pre-interstate shipment test at a livestock auction market. Cowhad aborted twice prior to sale | Depopulated | CA, CO, ID, IL, KS, MN, MO, MT, NE, SD, TX, WI, WY |
| May | 2008 | Beef cattle | 28 | Park | Herd tested as part of MT effort to develop risk mitigation herd plans near Yellowstone National Park | Depopulated | HI, ID, MN, MT, ND, SD, WA, WY | |
| Nov | 2010 | Bison | 3,250 | Gallatin | DSA herd management plan test | Test and remove | CO, ID, KS, MT, NE, SD, TX, WY | |
| Sep | 2011 | Beef cattle | 275 | Park | DSA related movement test | Test and remove | ID, MN, MT, NE, SD, UT, WA | |
| Nov | 2011 | Bison | 1,550 | Madison | Trace herd test due to epidemiological link to the 2010 bison herd | Test and remove | Unavailable | |
| Sep | 2013 | Beef cattle | 1,500 | Madison | DSA related pre-slaughter test of a 2-year-old female | Test and remove | CA, CO, IA, KS, MN, MT, NE, SD | |
| Oct | 2013 | Beef cattle | 700 | Park | Brucellosis certified annual herd test | Test and remove | CA, MN, MT, NE, SD, TX | |
| Oct | 2014 | Beef cattle | 650 | Park/Carbon | DSA related movement test | Test and remove | Pending | |
| Nov | 2014 | Beef cattle | 2,340 | Madison | DSA related movement test | Test and remove | Pending | |
| Nov | 2016 | Bison | 178 | Beaverhead | Voluntary DSA herd test | Test and remove | GA, SD | |
| WY | Nov | 2003 | Beef cattle | 400 | Sublette | Slaughter surveillance | Depopulated | Unavailable |
| Jan | 2004 | Beef feedlot | 800 | Washakie | Trace herd test due to epidemiologic link with the 2003 Sublette County herd | Depopulated | Unavailable | |
| Jun | 2004 | Beef cattle | 600 | Teton | Interstate movement test | Depopulated | CO, ID, KS, MT, NE, SD, TX, WY | |
| Nov | 2004 | Beef cattle | 800 | Teton | Trace herd test, contact with June 2004 Teton County herd | Depopulated | Unavailable |
| State | Month | Year | Herd Type | Herd Size | County | Method of Detection | Disposition | Trace Out States |
|---|---|---|---|---|---|---|---|---|
| Jun | 2008 | Beef cattle | 800 | Sublette | First-point test at a WYlivestock auction market | Depopulated | CA, CO, ID, KS, MN, MT, NE, SD, WY | |
| Oct | 2010 | Beef cattle | 500 | Park | DSA related change of ownership testing at a WY livestock auction market | Test and remove | MT, WY | |
| Nov | 2010 | Bison | 1,067 | Park | DSA related pre-sale movement testing of yearling heifers | Test and remove | CO, MT, NV, WY | |
| Feb | 2011 | Beef cattle | 500 | Park | DSA related movement test at a MT livestock auction market, 5-year-old cull cow | Test and remove | MT | |
| Jul/Sep | 2011 | Beef cattle | 500 | Park | DSA related on-farm, pre-sale test of 13-month-old heifers | Test and remove | Unavailable | |
| Oct | 2015 | Beef cattle | 515 | Park | DSA herd plan test | Test and remove | Unavailable | |
| Nov | 2015 | Beef cattle | 717 | Sublette | DSA herd plan test | Test and remove | CO, WY |
1.1 Idaho
Between April 2002 and 2012, four cattle herds and one privately owned bison herd in Idaho were infected with brucellosis. Idaho lost Class Free status in January 2006, and a brucellosis action plan was created resulting in Class Free status being regained in July 2007. Due to changes to the federal brucellosis regulations in 2010 relative to the requirements for retention of that status, Idaho has maintained Class Free status despite finding three additional affected herds since 2009, including a Fremont County cattle herd that was located outside of Idaho’s designated surveillance area (DSA). No herds remain quarantined for brucellosis as of March 2016.
1.2 Montana
Between May 2007 and November 2016, seven beef cattle herds and three privately owned bison herds were diagnosed with brucellosis in Montana. The infected herds found in 2007 and 2008 were slaughtered with federal indemnity, while all herds identified thereafter have undergone a test-and-remove protocol under state quarantine. The Montana Department of Livestock developed and implemented a Brucellosis Action Plan in May 2009, and the state successfully regained Class Free status in July 2009.
1.3 Wyoming
From 1989 to November 2003, no brucellosis-infected herds were identified in Wyoming; but, between November 2003 and November 2015, 10 cattle herds and 1 domestic bison herd were infected. Wyoming lost Class Free status in 2004, and the Governor of Wyoming appointed a Wyoming Brucellosis Coordination Team to develop a Brucellosis Management Plan. The state regained Class Free status in 2006 and subsequently identified 6 cattle herds and 1 privately owned bison herd as infected with B. abortus.
1.4 Impacts Outside the GYA
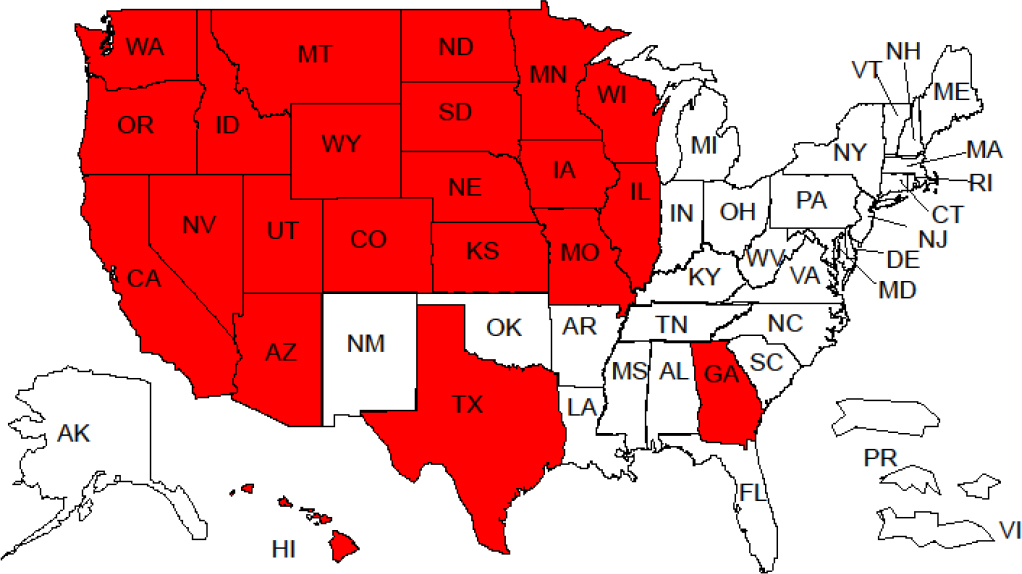
As a result of the disclosure of brucellosis in cattle and privately owned bison herds, animals that left those herds prior to diagnosis are required to be traced and their disease status investigated. More than 15,000 animals that had left the affected herds were required to be traced, and a number of those animals were found in non-GYA states (see Figure 3-2). The extensive movement of cattle from the DSA has implications for the implementation of the DSA, because it relates to the likelihood of an infected animal moving out of the area as well as the cost of testing to ensure that contact herds remain uninfected.
2. DISEASE DYNAMICS IN BISON AND ELK
As noted in the previous NRC report (1998), wild bison in the GYA have a relatively high seroprevalence of brucellosis. In bison from the National Elk Refuge (NER) in Wyoming, the seroprevalence of brucellosis ranged from 40% to 83% from 2000 to 2008 (mean = 64%, 95% confidence interval[CI] = 0.58, 0.69) (Scurlock and Edwards, 2010). The seroprevalence among adult females is relatively steady over time in Yellowstone National Park (YNP) at 60%, despite large changes in population size (Hobbs et al., 2015). This suggests that the population size of bison may not be a strong determinant of brucellosis transmission rates in bison (Hobbs et al., 2015). By combining serological data with culture results, active infections are more likely among 2- to 4-year-old Yellowstone bison. Older bison, while likely to be seropositive, are less likely to be culture positive (Treanor et al., 2011). However, this does not necessarily mean that those animals are not infected. In chronically infected animals, there are often fewer organisms per gram of tissue, making it more difficult to obtain a positive culture.
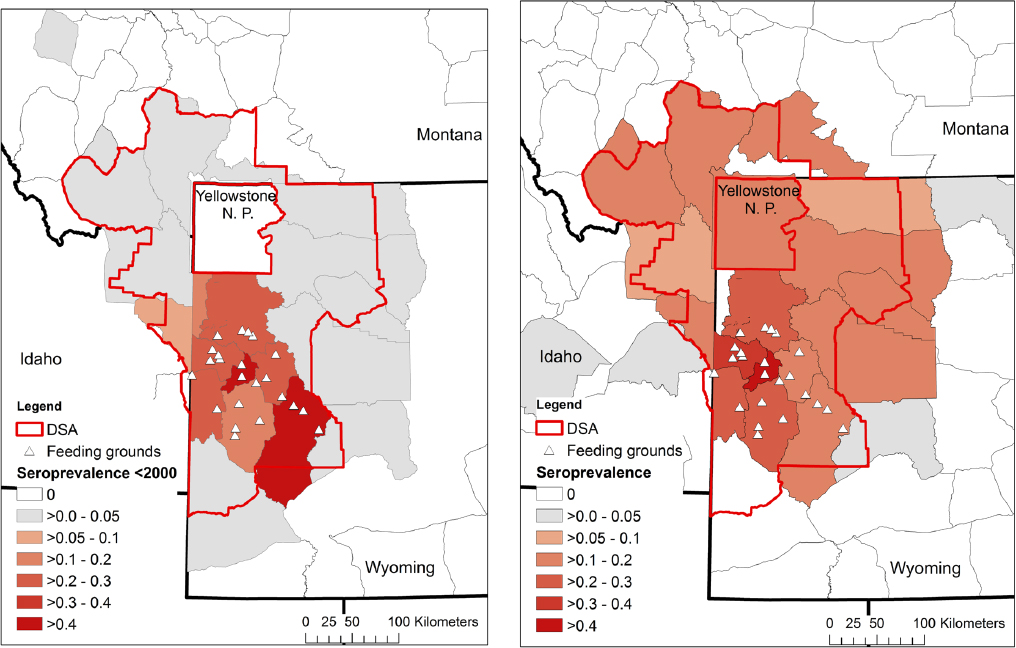
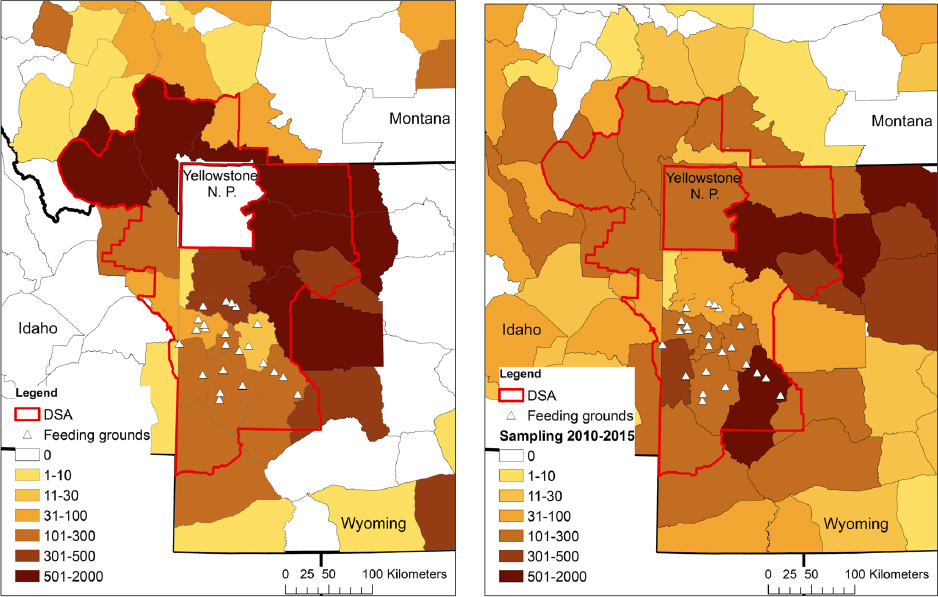
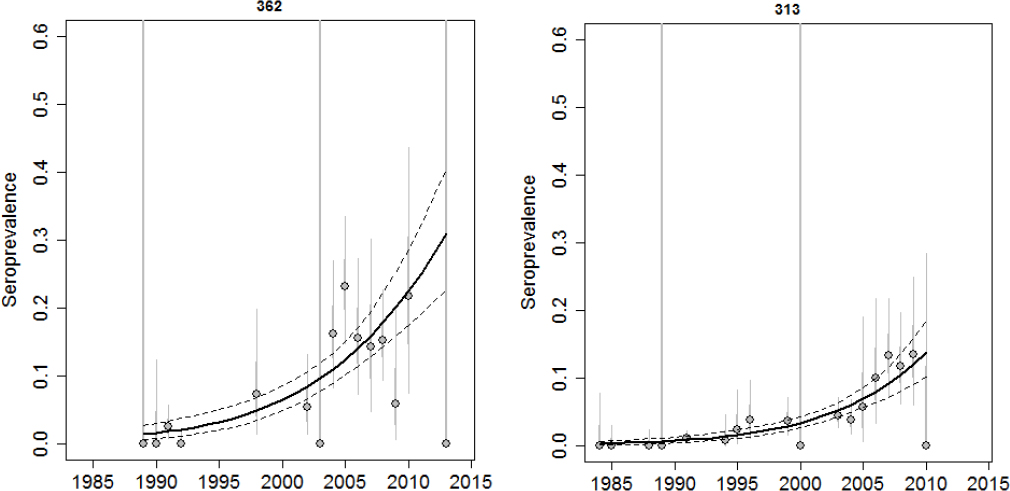
One of the significant findings of the 1998 NRC report was that “B. abortus is unlikely to be maintained in elk if elk winter-feedgrounds were closed.” This was also the consensus of the respondents to the 1998 NRC questionnaire as well as the conclusion of McCorquodale and Digiacomo (1985). This conclusion was due in part to the low seroprevalence in elk anywhere outside of the supplemental feedgrounds prior to 2000 (see Figure 3-3). Data collected after the 1998 NRC report, however, cast this earlier conclusion into doubt, because elk seroprevalence in some management units is now comparable to areas with supplemental feedgrounds (see Figure 3-3). This does not appear to be due to a lack of sampling in areas that were previously at low seroprevalence (see Figure 3-4). While the numbers of samples in any given year may be low, the data, in aggregate, across many years suggest that these increases are not an artifact of sampling error but are consistent changes over a long time period (e.g., see Figures 3-5 and 3-6).
Whole genome sequencing of brucellosis isolates collected from 1985 to 2013 in cattle, elk, and bison across the GYA suggest that brucellosis was introduced into GYA bison and elk on at least five separate occasions, presumably from cattle (Kamath et al., 2016). One of these five lineages is associated with bison within Yellowstone and a few elk isolates from the same area. The Brucella isolates from many of the unfed elk in Montana and Wyoming, however, originated from the Wyoming feedgrounds instead of Yellowstone bison. This suggests that control efforts implemented in bison within YNP are unlikely to have any effect on these unrelated lineages in elk populations outside of YNP. Two different lineages were able to move from Wyoming feedgrounds to western Montana, potentially in the 1990s to early 2000s, followed by subsequent local transmission rather than repeated invasions from the feedgrounds (Kamath et al., 2016). This timing is coincident with increases in the seroprevalence in elk in these regions (see Figure 3-5), and it suggests that elk are able to maintain the infection locally after those introductions. The B. abortus isolates from elk in the Wiggins Fork region of Wyoming also derive from the feedgrounds, but the extent of local transmission among elk there is less clear as there are a large number of isolates that connect directly back to the feedgrounds rather than other local isolates (Kamath et al., 2016). Finally, genetics data have been used to estimate a diffusion rate of the disease over time, which averaged 3-8 km/yr overall but appeared more recently to be increasing in speed. The two fastest lineages were expanding at a rate of 12 km/yr as of 2013 (Kamath et al., 2016).
Brucellosis seroprevalence in elk appears to be increasing in several herds in Montana. From 2001-2013, seroprevalence in elk from district 323 was estimated at 28% (n = 36, 95% CI = 0.14, 0.45) even though the elk tracking data from that area do not suggest much overlap with either bison or elk from the Wyoming feedgrounds (MDFWP, 2015; Proffitt et al., 2015). More recent testing in the Mill Creek area of Paradise Valley, Montana, showed elk seroprevalence at 53% (n = 32, 95% CI = 0.32, 0.68). Montana’s elk management units (EMUs) 362 and 313 are two areas where there are sufficient data through time to conclude that the seroprevalence does appear to be increasing (see Figure 3-5).
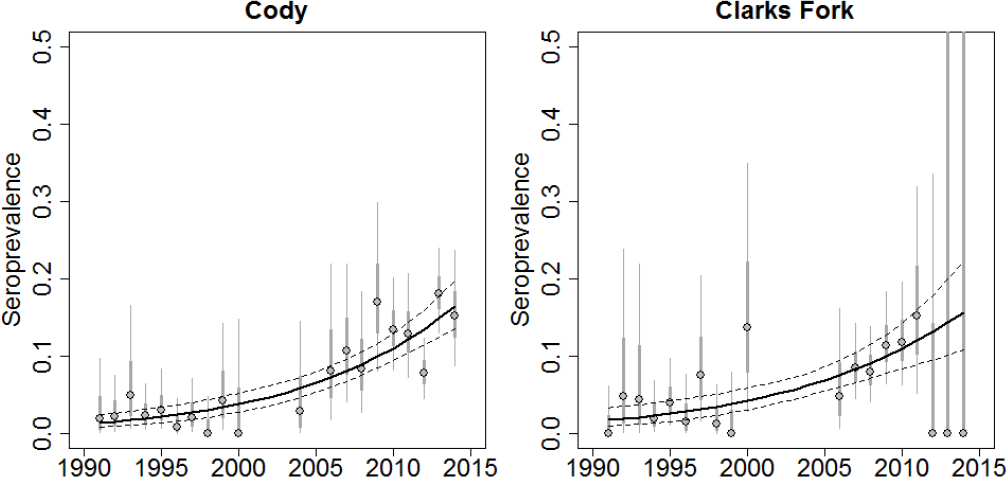
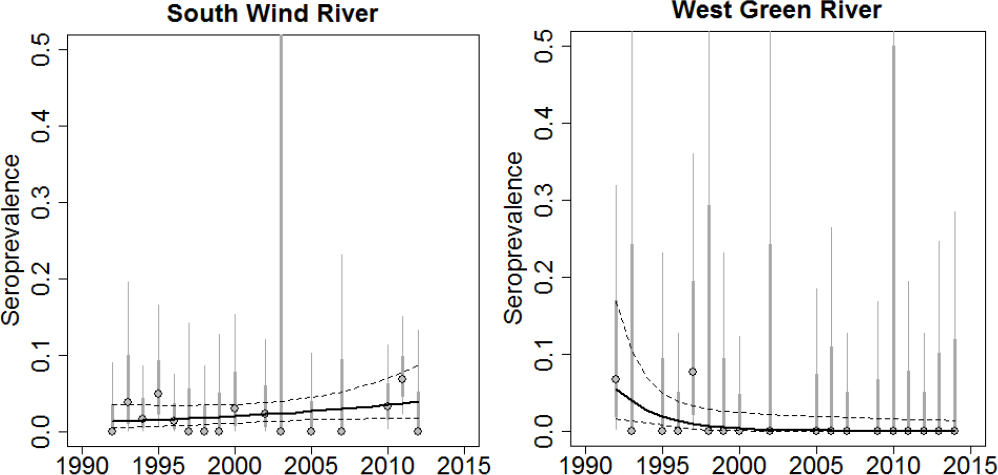
Several studies have been published on the seroprevalence of brucellosis in Wyoming elk. The seroprevalence in elk on supplemental feedgrounds is strongly correlated with the length of the feeding season, which overlaps with the presumed abortion period in the third trimester of pregnancy (Cross et al., 2007). An increase in the end date of the feeding season is correlated with an increase from 10% to 30% seroprevalence. Furthermore, the end date of the feeding season is highly correlated with the winter snowpack from one year to the next. Excluding the NER, point estimates of elk population size or density are not significantly associated with seroprevalence. Thus, disease transmission in this system may be driven by an interaction between host density and the timing of disease transmission. Sample testing data from 1993-2009 are aggregated over time for both on and off of supplemental feedgrounds in order to have sufficient sample sizes to make comparisons across regions (Scurlock and Edwards, 2010). However, there is some indication that seroprevalence may be increasing over time in some elk herds (Scurlock and Edwards, 2010). In examining seroprevalence at the broad herd unit scale as well as at the finer hunt area scale, areas south of the feedgrounds with relatively low elk densities did not appear to have any increase in brucellosis (Cross et al., 2010a,b). Most of the observed increases in elk seroprevalence appear to be in the mid-2000s in both Montana and Wyoming (Cross et al., 2010a,b; see Figure 3-6). Meanwhile some regions show no evidence of increasing seroprevalence despite significant sampling efforts and being adjacent to supplemental feedgrounds (see Figure 3-7).
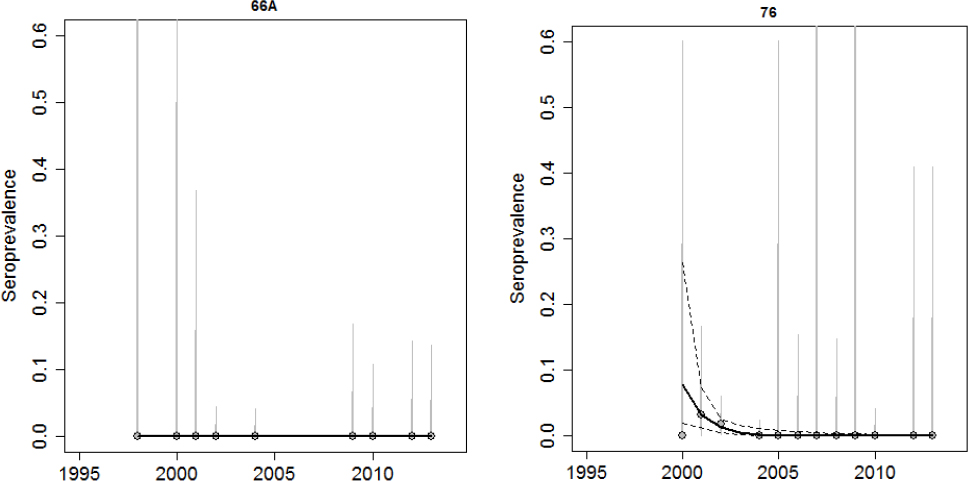
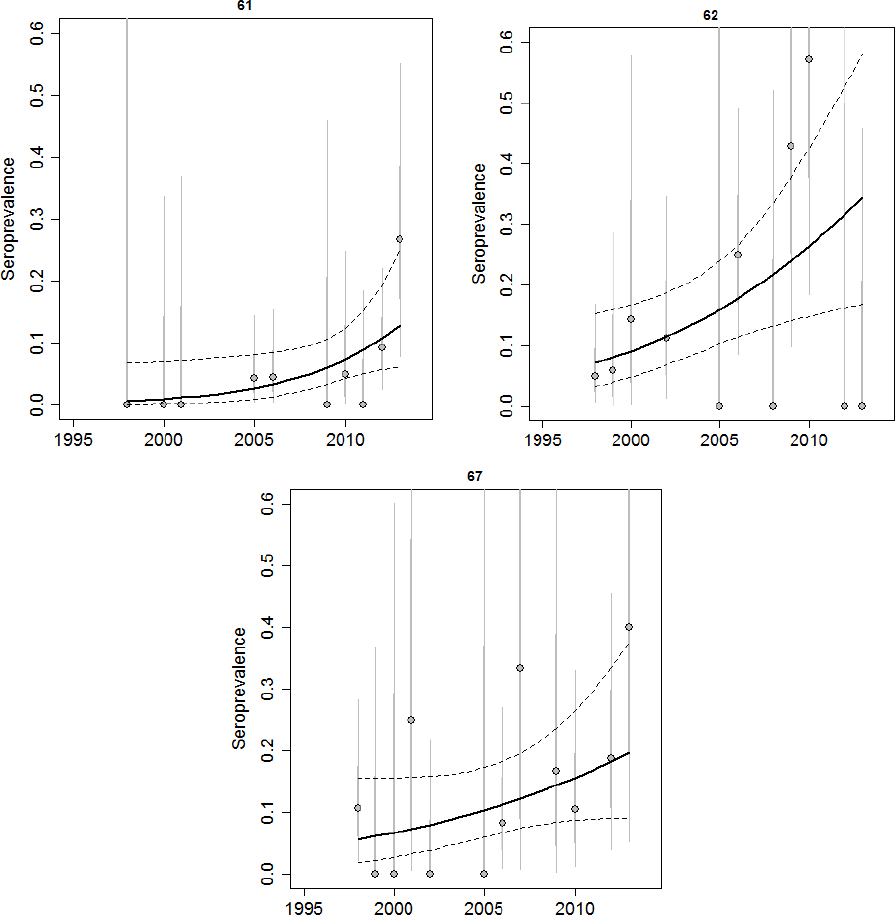
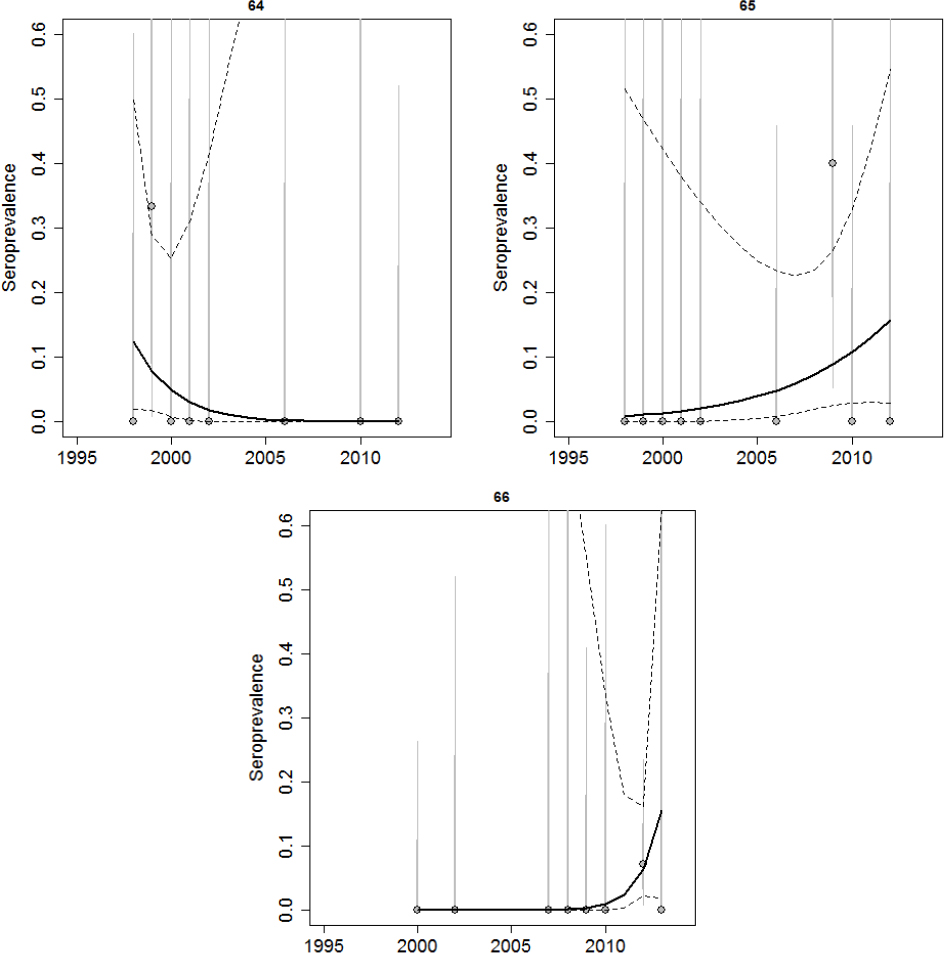
Brucellosis was first observed in Idaho elk in 1998. Prior to 2002, elk seroprevalence was relatively low in all areas tested except Rainey Creek, which was the site of an elk feedground that operated from 1978-2006 and fed between 150 and 600 elk (Etter and Drew, 2006). Since 2002, there have been observed increases in elk seroprevalence in Montana and Wyoming, and although surveillance is being conducted in those areas, there have been no recent studies published using Idaho data aside from Etter and Drew. Data provided to the committee for this review suggest that elk seroprevalence remains low in Districts 66A and 76, which are mostly outside of the DSA (see Figure 3-8). Other regions within the Idaho portion of the DSA appear to have increasing levels of elk seroprevalence (in Districts 61, 62, and 67; see Figure 3-9). Due to the limited sampling in some regions, it is difficult to assess whether the dynamics of brucellosis in some areas are changing (in Districts 64, 65, and 66; see Figure 3-10).
3. EFFECTS OF POPULATION SIZE AND AGGREGATION ON BISON AND ELK TRANSMISSION
To understand the dynamics of infectious diseases and to implement control strategies for effectively addressing brucellosis, it will be important to understand the relationship between host density and parasite transmission (Anderson and May, 1991; McCallum et al., 2001). If transmission and host density are correlated, models predict that the parasite cannot persist below a certain threshold of host density (Kermack and McKendrick, 1927; Getz and Pickering, 1983). This forms the basis for using social distancing (e.g., school closures) to control pandemics (Glass and Barnes, 2007; Cauchemez et al., 2008; Halloran et al., 2008). In natural populations, the distribution and abundance of a host species can be affected by manipulating hunting pressure (Conner et al., 2007), artificial food and water sources (Miller et al., 2003; Rudolph et al., 2006; Cross et al., 2007), and predator distributions (White et al., 2012).
For directly transmitted parasites, contact rates may be more related to local measures of host density (i.e., density or number of hosts in a group) rather than broader scale measures (i.e., density of a region with many groups). Furthermore, many ungulate group size distributions, including elk, are highly right-skewed whereby most groups are small, but there are a few very large groups (Cross et al., 2009, 2013c; Brennan et al., 2015). This may result in super-spreader dynamics at the group level whereby a few large groups drive disease dynamics (Lloyd-Smith et al., 2005). This issue has been addressed in human systems under the “core-groups” moniker (e.g., intravenous drug users [see Hethcote, 1978; May and Anderson, 1984; Becker and Dietz, 1995; Dushoff and Levin, 1995]) but it has not had much application to natural populations. In social species like elk and bison, management approaches that alter group size distributions may be more effective at reducing disease transmission than lowering overall population densities.
There are a number of scientific challenges involved in relating host density to disease transmission. First, transmission is not directly observable; therefore, seroprevalence is often used as a surrogate. However, exposure could have occurred anytime from birth to the sampling date. Meanwhile, individual elk shift among groups relatively frequently. This makes it difficult to relate serology to group size metrics (Cross et al., 2013a). Second, it is unclear what the denominator should be when calculating elk density. Cross and colleagues investigated the relationship between the rate of increase in elk seroprevalence and elk density at the broad herd unit scale (2010a) as well as the finer hunt area scale (2010b). In both cases, the area used in the calculation of elk density was the total area of the management unit, which probably includes a large amount of area that is not elk habitat. By further investigating multiple different metrics of
elk density, Brennan and colleagues (2014) found that while all the springtime elk density metrics were correlated with the increases in brucellosis, there was not one particular metric of elk density that did much better than the others. Third, elk population size, density, and seroprevalence are factors that change over time, and seroprevalence is likely to respond to changes in elk density at a lag. This is not an easy problem to solve because the temporal changes in both elk population size and brucellosis seroprevalence are relatively slow, requiring a long time-series in any one location to be informative. As a result, the spatial variation among regions may be more informative than the annual variation. Within Montana, elk density is associated with the seroprevalence of brucellosis (Proffitt et al., 2015). An equilibrium assumption is being made that sites have higher prevalence due to elk density; that assumption, however, does not account for how some sites may be changing over time, whereby some areas may still be of low seroprevalence because the disease was only recently introduced in that location. Due to many of these challenges, it is likely that the effects of host density on brucellosis transmission will tend to be underestimated.
At a more local scale, measuring contact rates in free-ranging wildlife populations has traditionally been difficult. Proximity loggers, however, are a recent technological advance that records the duration and time when two loggers are within a predesigned distance from one another (Prange et al., 2006). Ideally, a proximity logger would be placed on aborted fetuses to record subsequent contacts. Fetuses recovered from other management activities could be used as a proxy to record elk-fetus contact rates (Creech et al., 2012). By feeding elk across a broader area (low-density feeding), >70% reductions in elk-fetus contact rates occurred on the feedgrounds (Creech et al., 2012). No contacts were recorded with fetuses that were randomly placed away from feedgrounds (Maichak et al., 2009). Elk-elk contacts could be considered as a surrogate for elk-fetus contacts. The contact rate (within ~2m) for a given elk pair declines with increasing group size, but the individual contact rate strongly increases with elk group size, because the number of total pairs increases with group size (Cross et al., 2013b). This suggests that large elk groups may be driving much of the transmission of brucellosis within elk populations, but this pattern is hard to observe in seroprevalence data due to the frequent mixing of individuals across groups of different sizes. Therefore, additional research may consider treatments (e.g., targeted hunting, increased predator tolerance in some areas, hazing operations) that affect the group size distribution (and in particular, large groups).
Within bison, a frequency dependent model of brucellosis transmission appears to be more consistent with the available data compared to a density dependent model (Hobbs et al., 2015). During the time-series where seroprevalence data were available, the bison population size ranged from 2,000-5,000 individuals, while the seroprevalence remained relatively constant. This may be due to the grouping behavior of bison in YNP, whereby the bison group size distribution appears to be relatively constant even when the population size is dramatically reduced by boundary removals (Cross et al., 2013c). Thus, although fetus exposure rates may be higher in larger groups of bison (i.e., density dependent transmission at the group scale), more groups are created as the bison population gets larger. As a result, group sizes are relatively constant, so that disease transmission at the population scale appears frequency dependent. Therefore, the indiscriminant reduction of bison populations is unlikely to affect brucellosis transmission in bison.
4. SUPPLEMENTAL FEEDGROUNDS
The previous NRC review in 1998 highlighted the role of the supplemental feedgrounds in exacerbating brucellosis in elk. None of the research conducted since that review refutes that conclusion. The seroprevalence of disease on the feedgrounds remains high (~20%) relative to elk populations in other regions, particularly outside of the Greater Yellowstone Ecosystem (Scurlock and Edwards, 2010). As noted above, feedground sites that were fed for longer and later into the spring had higher levels of seroprevalence (Cross et al., 2007). This is probably because abortion events appear to be about five times more frequent in March, April, and May than they are in February; no abortion events have been recorded in January (Cross et al., 2015).
Supplemental feedgrounds played a role in the historic seeding of B. abortus infections in other, distant elk populations (Kamath et al., 2016) and in increased local elk-elk transmission (Cross et al., 2007).
Feedgrounds, however, potentially mitigate local cattle risk compared to an area with similar elk seroprevalence without feedgrounds because they separate elk from cattle during the majority of the transmission season. From 2002-2014, only 3 of the 22 affected cattle herds were in regions with feedgrounds despite the high seroprevalence in elk during that entire time span on feedgrounds, whereas the seroprevalence in elk in other regions has only more recently increased (Brennan, 2015).
5. POTENTIAL EFFECTS OF PREDATORS AND SCAVENGERS ON BRUCELLOSIS
Wolves were reintroduced in the GYA in 1995 and were only briefly mentioned in the previous NRC report (1998). But, the potential role that wolves may have on elk or bison demography, space-use, and aggregation patterns has been an active area of research since that time. Predators may preferentially kill infected prey and may in turn reduce the level of disease (Packer et al., 2003). The mortality hazard of brucellosis-infected African buffalo (Syncerus caffer) is about two times higher than of uninfected individuals (95% CI = 1.1-3.7) (Gorsich et al., 2015). Predation on brucellosis-infected hosts may occur due to arthritis and lower body conditions that are associated with brucellosis infections (Gorsich et al., 2015). However, if these complications occur after the infectious period of the disease, predation is unlikely to affect the transmission dynamics. The direct effects of predation on disease dynamics are higher for diseases where infected individuals are weakened prior to and during the infectious period. For Wyoming feedground elk, evidence does not suggest a decreased survival rate of elk infected with brucellosis (Benavides et al., 2017). A better test of selective predation would be in areas of more intensive wolf presence, but the seroprevalence of brucellosis in YNP elk has historically been relatively low, making it difficult to study the survival rates of seropositive and seronegative elk or bison (Ferrari and Garrott, 2002; Barber-Meyer et al., 2007). Outside the borders of national parks, hunting is the dominant cause of adult elk mortality, and hunters are unlikely to be selective for infected elk. Thus, there is no current evidence to suggest that predators are selective for brucellosis-infected elk or bison.
Wolves may affect brucellosis transmission by altering population size, distribution, or aggregation patterns (see Chapter 2), which may then affect contact and disease transmission rates. The behavioral effects of wolves on elk aggregation patterns would likely occur on shorter rather than longer time frames, and they are unlikely to have longer-term population level effects of reduced survival and/or recruitment. Creel and Winnie (2005) found that the mean elk group size declined on days when wolves were present from 22 to 9. Similarly, Proffitt and colleagues (2009) found that in the presence of wolves, elk were more disaggregated in sagebrush areas. In grassland areas, however, elk were aggregated in larger average group sizes in response to increasing wolf predation risk (Gower et al., 2009; Proffitt et al., 2009). Even though the majority of elk groups are relatively small in size, the majority of elk (as individuals) tend to be in the largest groups (Hebblewhite and Pletscher, 2002; Brennan et al., 2015). In combination with increasing contact rates in the largest groups, this suggests that the majority of disease transmission may occur in large groups (Cross et al., 2013b). Thus, average elk group sizes may not be an important metric for inference about disease transmission. Wolves may shift the spatial distribution of elk either by affecting elk behavior and dispersal or altering the population growth rate of elk. While the impacts of wolves on elk calves are well documented (Wright et al., 2006), evidence is limited, which indicates that wolves have behaviorally shifted elk distributions at broad spatial scales.
Wolves appear to be attracted to large elk group sizes, as the 90th percentile of the elk group size distribution is positively correlated with wolf abundance on open and private lands (Brennan et al., 2015). Over the longer term, wolves are likely to reduce elk population sizes, although the degree of reduction that is directly attributable to wolves remains contested due to the potential confounding effects of hunting, changing climate, and other predators (Vucetich et al., 2005; Middleton et al., 2013; Christianson and Creel, 2014). An interesting correlation has been found between fecal progesterone, the number of calves per 100 adult female elk, and the ratio of wolves to elk, which suggest that wolves may reduce elk reproduction (Creel et al., 2007). While the strength of this finding has been disputed (White et al., 2011; Creel et al., 2013; Christianson and Creel, 2014; Proffitt et al., 2014), if it is true, wolves would potentially directly reduce brucellosis transmission by reducing the primary mechanism of transmission—pregnancy and the
associated abortion events. Finally, in the northern range of Yellowstone the percentage of elk spending the winter outside of YNP has increased coincident with the arrival of wolves (MacNulty, 2015). Migratory elk in the Clarks Fork region of Wyoming had reduced pregnancy and calf:cow ratios relative to nonmigratory elk, which had lower exposure to wolves and bears (Middleton et al., 2013). Over time, this would result in higher populations of elk remaining on private lands throughout the year. Due to the relatively slow changes in elk populations and brucellosis seroprevalence along with many potential confounding factors, it is difficult to currently assess these short- and long-term effects of wolves on brucellosis in elk.
The previous NRC report (1998) reviewed the number of carnivores seropositive for brucellosis, presumably due to consuming infectious material. Even though Davis and colleagues (1988) demonstrated that coyotes were able to infect cattle when held in a confined space and B. abortus could remain viable in coyote feces and urine, carnivores are probably dead-end hosts and not likely to reinfect ungulates (NRC, 1998). To date, there has been no subsequent research that would further support or contradict that conclusion. Aune and colleagues (2012) found that half of fetuses were moved over 100m and one was moved almost 2 miles by a red fox, confirming that carnivores play a role in locally transporting infectious material to new locations (NRC, 1998). However, the 1998 NRC report suggested that “a healthy complement of predators [is] almost certain to be a major factor in reducing the probability of B. abortus transmission within the wildlife community and between wildlife and domestic stock. Predation and scavenging by carnivores likely biologically decontaminate the environment of infectious B. abortus with an efficiency unachievable in any other way.” Since 1998, several studies of fetus contact and fetus removal rates have been completed. Cook and colleagues (2004) found that the disappearance rate of bovine fetuses was, on average, 27 hrs at the NER, 40 hrs at other Wyoming feedgrounds, and 58 hrs at the Grand Teton National Park and coyotes were the dominant scavenger. Similarly, Maichak and colleagues (2009) found that 70% (28 of 40) of elk fetuses were removed within 24 hrs from the Wyoming state feedgrounds, while only 38% (3 of 8) were removed within 24 hrs from neighboring winter range locations. In contrast, fetus removal rates around YNP averaged 18 days, with a maximum of 78 days (Aune et al., 2012). Also, B. abortus remained viable on the underside of fetuses for a median of 30 days, but exposed areas had a median survival time of 10 days (Aune et al., 2012). Collectively, these data suggest that scavengers are removing fetuses faster from the feedgrounds than from other areas, which may be one reason why the seroprevalence in elk at the feedgrounds (20%) is roughly equivalent to the seroprevalence in some non-fed elk populations despite the more intense aggregations on the feedgrounds. Despite the potential positive role coyotes might have on scavenging to reduce brucellosis transmission, coyotes are removed by the U.S. Department of Agriculture’s Animal and Plant Health Inspection Service’s Wildlife Services at the request of landowners to reduce predation and livestock losses. In addition, coyotes are not regulated and can be shot year-round without a license in Idaho, Montana, and Wyoming. The effects these removals may have on brucellosis transmission are poorly known and require further study.
6. EFFECT OF DISEASE ON BISON AND ELK POPULATIONS
Although B. abortus induces abortion events and has the potential to have significant impact on individual animals (such as testicular abscesses, retained placentas, arthritis, death of neonates), it is not generally considered a direct threat to the sustainability of either elk or bison populations. Fuller and colleagues (2007) estimated that the complete eradication of brucellosis from bison would increase bison population growth rate by 29%, and similar results were found by others (Ebinger et al., 2011; Hobbs et al., 2015). This increase in population growth would most likely result in increased bison removals at the boundary. Cross and colleagues (2015) estimated that 16% (95% CI = 10, 23) of seropositive pregnant female elk will abort every year. Based on those estimates, the expectation is that an area with 30% seroprevalence would only experience a 5% decline in the population growth rate even if there were no compensatory shifts in calf mortality due to brucellosis. However, Foley and colleagues (2015) found no relationship between brucellosis seroprevalence and the ratio of elk calves to adult females at the EMU scale.
REFERENCES
Anderson, R.M., and R.M. May. 1991. Infectious Diseases of Humans: Dynamics and Control. Oxford, UK: Oxford University Press.
Aune, K.E., J.C. Rhyan, R. Russell, T.J. Roffe, and B. Corso. 2012. Environmental persistence of Brucellaabortus in the Greater Yellowstone Area. Journal of Wildlife Management 76(2):253-261.
Barber-Meyer, S.M., P.J. White, and L.D. Mech. 2007. Survey of selected pathogens and blood parameters of northern Yellowstone elk: Wolf sanitation effect implications. American Midland Naturalist 158:369-381.
Becker, N.G., and K. Dietz. 1995. The effect of household distribution on transmission and control of highly infectious diseases. Mathematical Biosciences 127:207-219.
Benavides, J.A., D. Caillaud, B.M. Scurlock, E.J. Maichak, W.H. Edwards, and P.C. Cross. 2017. Estimating loss of Brucellaabortus antibodies fromage-specific serological data in elk. Eco Health 1-10.
Brennan, A. 2015. Landscape-scale Analysis of Livestock Brucellosis. USDA’s Animal and Plant Health Inspection Service.
Brennan, A., P.C. Cross, M.D. Higgs, W.H. Edwards, B.M. Scurlock, and S. Creel. 2014. A multi-scale assessment of animal aggregation patterns to understand increasing pathogen seroprevalence. Ecosphere 5(10):art138.
Brennan, A., P.C. Cross, S. Creel, and P. Stephens. 2015. Managing more than the mean: Using quantile regression to identify factors related to large elk groups. Journal of Applied Ecology 52(6):1656-1664.
Cauchemez, S., A. Valleron, P. Boëlle, A. Flahault, and N.M. Ferguson. 2008. Estimating the impact of school closure on influenza transmission from sentinel data. Nature 452:750-754.
Christianson, D., and S. Creel. 2014. Ecosystem scale declines in elk recruitment and population growth with wolf colonization: A before-after-control-impact approach. PLOS ONE 9(7).
Conner, M.M., M.W. Miller, M.R. Ebinger, and K.P. Burnham. 2007. A meta-BACI approach for evaluating management intervention on chronic wasting disease in mule deer. Ecological Applications 17(1):140-153.
Cook, W.E., E.S. Williams, and S.A. Dubay. 2004. Disappearance of bovine fetuses in northwestern Wyoming. Wildlife Society Bulletin 32(1):254-259.
Creech, T., P.C. Cross, B.M. Scurlock, E.J. Maichak, J.D. Rogerson, J.C. Henningsen, and S. Creel. 2012. Effects of low-density feeding on elk-fetus contact rates on Wyoming feedgrounds. Journal of Wildlife Management 76(5):877-886.
Creel, S., and J.A. Winnie. 2005. Responses of elk herd size to fine-scale spatial and temporal variation in the risk of predation by wolves. Animal Behaviour 69:1181-1189.
Creel, S., D. Christianson, S. Liley, and J.A.J. Winnie. 2007. Predation risk affects reproductive physiology and demography of elk. Science 315(5814):960.
Creel, S., J.A. Winnie, Jr., and D. Christianson. 2013. Underestimating the frequency, strength and cost of antipredator responses with data from GPS collars: An example with wolves and elk. Ecology and Evolution 3(16):5189-5200.
Cross, P.C., W.H. Edwards, B.M. Scurlock, E.J. Maichak, and J.D. Rogerson. 2007. Effects of management and climate on elk brucellosis in the Greater Yellowstone Ecosystem. Ecological Applications 17(4):957-964.
Cross, P.C., J. Drew, V. Patrek, G. Pearce, M.D. Samuel, and R.J. Delahay. 2009. Wildlife population structure and parasite transmission: implications for disease management. Pp. 9-29 in Management of Disease in Wild Mammals. R.J. Delahay, G.C. Smith, and M.R. Hutchings, eds. Tokyo, Japan:Springer.
Cross, P.C., E.K. Cole, A.P. Dobson, W.H. Edwards, K.L. Hamlin, G. Luikart, A.D. Middleton, B.M. Scurlock, and P.J. White. 2010a. Probable causes of increasing elk brucellosis in the Greater Yellowstone Ecosystem. Ecological Applications 20(1):278-288.
Cross, P.C., D.M. Heisey, B.M. Scurlock, W.H. Edwards, M.R. Ebinger, and A. Brennan. 2010b. Mapping brucellosis increases relative to elk density using hierarchical Bayesian models. PLOS ONE 5(4):e10322.
Cross, P.C., D. Caillaud, and D.M. Heisey. 2013a. Underestimating the effects of spatial heterogeneity due to individual movement and spatialscale:infectious disease as an example. Land scape Ecology 28(2):247-257.
Cross, P.C., T.G. Creech, M.R. Ebinger, K. Manlove, K. Irvine, J. Henningsen, J. Rogerson, B.M. Scurlock, and S. Creel. 2013b. Female elk contacts are neither frequency nor density dependent. Ecology 94(9):2076-2086.
Cross, P.C., E.J. Maichak, A. Brennan, B.M. Scurlock, J. Henningsen, and G. Luikart. 2013c. An ecological perspective on Brucellaabortus in the western United States. Revue Scientifiqueet Technique Office International des Epizooties 32(1):79-87.
Cross, P.C., E.J. Maichak, J.D. Rogerson, K.M. Irvine, J.D. Jones, D.M. Heisey, W.H. Edwards, and B.M. Scurlock. 2015. Estimating the phenology of elk brucellosis transmission with hierarchical models of cause-specific and baseline hazards. Journal of Wildlife Management 79(5):739-748.
Davis, D.S., F.C. Heck, J.D. Williams, T.R. Simpson, and L.G. Adams. 1988. Interspecific transmission of Brucella abortus from experimentally infected coyotes (Canis latrans) to parturient cattle. Journal of Wildlife Diseases 24(3):533-537.
Dushoff, J., and S. Levin. 1995. The effects of population heterogeneity on disease invasion. Mathematical Biosciences 128(1-2):25-40.
Ebinger, M.R., P.C. Cross, R.L. Wallen, P.J. White, and J. Treanor. 2011. Simulating sterilization, vaccination, and test-and-remove as brucellosis controlmeasures in bison. Ecological Applications 21(8):2944-2959.
Etter, R., and M.L. Drew. 2006. Brucellosis in elk of eastern Idaho. Journal of Wildlife Diseases 42(2):271-278.
Ferrari, M.J., and R.A. Garrott. 2002. Bison and elk: Brucellosis seroprevalence on a shared winter range. Journal of Wildlife Management 66(4):1246-1254.
Foley, A.M., P.C. Cross, D.A. Christianson, B.M. Scurlock, and S. Creel. 2015. Influences of supplemental feeding on winter elk calf:cow ratios in the southern Greater Yellowstone Ecosystem. Journal of Wildlife Management 79(6):887-897.
Fuller, J., B. Garrott, P.J. White, K.E. Aune, T.J. Roffe, and J.C. Rhyan. 2007. Reproduction and survival of Yellowstone Bison. Journal of Wildlife Management 71(7):2365-2372.
Getz, W.M., and J. Pickering. 1983. Epidemic models: thresholds and population regulation. American Naturalist 121:892-898.
Glass, K., and B. Barnes. 2007. How much would closing schools reduce transmission during an influenza pandemic? Epidemiology 18(5):623-628.
Gorsich, E.E., V.O. Ezenwa, P.C. Cross, R.G. Bengis, and A.E. Jolles. 2015. Context-dependent survival, fecundity and predicted population-level consequences of brucellosis in African buffalo. Journal of Animal Ecology 84(4):999-1009.
Gower, C.N., R.A. Garrott, P.J. White, S. Cherry, and N.G. Yoccoz. 2009. Elk group size and wolf predation: A flexible strategy when faced with variable risk. Pp. 401-422 in The Ecology of Large Mammals in Central Yellowstone—Sixteen Years of Integrated Field Studies. R.A. Garrott, P.J. White, and F. Watson, eds. San Diego, CA: Academic Press.
Halloran, M.E., N.M. Ferguson, S. Eubank, I.M. Longini, D.A. Cummings, B. Lewis, S. Xu, C. Fraser, A. Vullikanti, T.C. Germann, D. Wagener, R. Beckman, K. Kadau, C. Barrett, C.A. Macken, D.S. Burke, and P. Cooley. 2008. Modeling targeted layered containment of an influenza pandemic in the United States. Proceedings of the Academy of Natural Sciences of Philadelphia 105(12):4639-4644.
Hebblewhite, M., and D. Pletscher. 2002. Effects of elk group size on predation by wolves. Canadian Journal of Zoology-Revue Canadienne De Zoologie 80(5):800-809.
Hethcote, H.W. 1978. Immunization model for a heterogeneous population. Theoretical Population Biology 14(3):338-349.
Hobbs, N.T., C. Geremia, J. Treanor, R. Wallen, P.J. White, M.B. Hooten, and J.C. Rhyan. 2015. State-spacemodeling to support management of brucellosis in the Yellowstone bison population. Ecological Monographs 85(4):525-556.
Kamath, P.L., J.T. Foster, K.P. Drees, G. Luikart, C. Quance, N.J. Anderson, P.R. Clarke, E.K. Cole, M.L. Drew, W.H. Edwards, J.C. Rhyan, J.J. Treanor, R.L. Wallen, P.J. White, S. Robbe-Austerman, and P.C. Cross. 2016. Genomics reveals historic and contemporary transmission dynamics of a bacterial disease among wildlife and livestock. Nature Communications 7:11448.
Kermack, W.O., and A.G. McKendrick. 1927. Contributions to the mathematical theory of epidemics. Proceedings of the Royal Society of Edinburgh 115:700-721.
Lloyd-Smith, J.O., S.J. Schreiber, P.E. Kopp, and W.M. Getz. 2005. Superspreading and the effect of individual variation on disease emergence. Nature 438(7066):355-359.
MacNulty, D. 2015. Presentation at the First Committee Meeting on Revisiting Brucellosis in the Greater Yellowstone Area, July 1-2, 2015, Bozeman, MT.
Maichak, E.J., B.M. Scurlock, J.D. Rogerson, L.L. Meadows, A.E. Barbknecht, W.H. Edwards, and P.C. Cross. 2009. Effects of management, behavior, and scavenging on risk of brucellosis transmission in elk of western Wyoming. Journal of Wildlife Diseases 45(2):398-410.
May, R.M., and R.M. Anderson. 1984. Spatial heterogeneity and the design of immunization programs. Mathematical Biosciences 72(1):83-111.
McCallum, H., N. Barlow, and J. Hone. 2001. How should pathogen transmission be modelled? Trends in Ecology and Evolution 16(6):295-300.
McCorquodale, S.M., and F. Digiacomo. 1985. The role of wild North American ungulates in the epidemiology of bovine brucellosis: A review. Journal of Wildlife Diseases 21(4):351-357.
MDFWP (Montana Department of Fish, Wildlife & Parks). 2015. Presentation at the First Committee Meeting on Revisiting Brucellosis in the Greater Yellowstone Area, July 1, 2015, Bozeman, MT.
Middleton, A.D., M.J. Kauffman, D.E. McWhirter, M.D. Jimenez, R.C. Cook, J.G. Cook, S.E. Albeke, H. Sawyer, and P.J. White. 2013. Linking anti-predator behaviour to prey demography reveals limited risk effects of an actively hunting large carnivore. Ecology Letters 16(8):1023-1030.
Miller, R.E., J.B. Kaneene, S.D. Fitzgerald, and S.M. Schmitt. 2003. Evaluation of the influence of supplemental feeding of white-tailed deer (Odocoileus virginianus) on the prevalence of bovine tuberculosis in the Michigan wild deer population. Journal of Wildlife Diseases 39(1):84-95.
NRC (National Research Council). 1998. Brucellosis in the Greater Yellowstone Area. Washington, DC: National Academy Press.
Packer, C., R.D. Holt, P.J. Hudson, K.D. Lafferty, and A.P. Dobson. 2003. Keeping the herds healthy and alert: Implications of predator control for infectious disease. Ecology Letters 6:797-802.
Prange, S., T. Jordan, C. Hunter, and S.D. Gehrt. 2006. New radiocollars for the detection of proximity among individuals. Wildlife Society Bulletin 34(5):1333-1344.
Proffitt, K.M., J.L. Grigg, K.L. Hamlin, and R.A. Garrott. 2009. Contrasting effects of wolves and human hunters on elk behavioral responses to predation risk. Journal of Wildlife Management 73(3):345-356.
Proffitt, K.M., J.A. Cunningham, K.L. Hamlin, and R.A. Garrott. 2014. Bottom-up and top-down influences on pregnancy rates and recruitment of northern Yellowstone elk. Journal of Wildlife Management 78(8):1383-1393.
Proffitt, K.M., N. Anderson, P. Lukacs, M.M. Riordan, J.A. Gude, and J. Shamhart. 2015. Effects of elk density on elk aggregation patterns and exposure to brucellosis. Journal of Wildlife Management 79(3):373-383.
Rhyan, J.C., P. Nol, C. Quance, A. Gertonson, J. Belfrage, L. Harris, K. Straka, and S. Robbe-Austerman. 2013. Transmission of brucellosis from elk to cattle and bison, Greater Yellowstone area, U.S.A., 2002-2012. Emerging Infectious Diseases 19(12):1992-1995.
Rudolph, B.A., S.J. Riley, G.J. Hickling, B.J. Frawley, M.S. Garner, and S.R. Winterstein. 2006. Regulating hunter baiting for white-tailed deer in Michigan: Biological and social considerations. Wildlife Society Bulletin 34(2):314-321.
Scurlock, B.M., and W.H. Edwards. 2010. Status of brucellosis in free ranging elk and bison in Wyoming. Journal of Wildlife Diseases 46(2):442-449.
Treanor, J.J., C. Geremia, P.H. Crowley, J.J. Cox, P.J. White, R.L. Wallen, and D.W. Blanton. 2011. Estimating probabilities of active brucellosis infection in Yellowstone bison through quantitative serology and tissue culture. Journal of Applied Ecology 48(6):1324-1332.
Vucetich, J.A., D.W. Smith, and D.R. Stahler. 2005. Influence of harvest, climate and wolf predation on Yellowstone elk, 1961-2004. Oikos 111(2):259-270.
White, P.J., R.A. Garrott, K.L. Hamlin, R.C. Cook, J.G. Cook, and J.A. Cunningham. 2011. Body condition and pregnancy in northern Yellowstone elk:Evidence for predation risk effects? Ecological Applications 21(1):3-8.
White, P.J., K.M. Proffitt, and T.O. Lemke. 2012. Changes in elk distribution and group sizes after wolf restoration. The American Midland Naturalist 167(1):174-187.
Wright, G.J., R.O. Peterson, D.W. Smith, and T.O Lemke. 2006. Selection of Northern Yellowstone Elk by Gray Wolves and Hunters. Journal of Wildlife Management 70(4):1070-1078.


