


Below is the uncorrected machine-read text of this chapter, intended to provide our own search engines and external engines with highly rich, chapter-representative searchable text of each book. Because it is UNCORRECTED material, please consider the following text as a useful but insufficient proxy for the authoritative book pages.
1. User's Guide 2. Mode and Service Concepts 3. Operations Concepts 4. Quality of Service Concepts 5. Quality of Service Methods 6. Bus Transit Capacity 7. Demand-Responsive Transit 8. Rail Transit Capacity 9. Ferry Transit Capacity 10. Station Capacity 11. Glossary and Symbols 12. Index Transit Capacity and Quality of Service Manual, 3rd Edition CHAPTER 2 MODE AND SERVICE CONCEPTS CONTENTS 1. INTRODUCTION ........................................................................................................................ 2-1 How to Use This Chapter ................................................................................................................... 2-1 Other Resources .................................................................................................................................... 2-1 2. TRANSIT MODES ...................................................................................................................... 2-2 Bus Transit .............................................................................................................................................. 2-2 Demand-Responsive Transit ........................................................................................................... 2-6 Vanpool .................................................................................................................................................. 2-13 Rail Transit ........................................................................................................................................... 2-13 Ferry Transit ....................................................................................................................................... 2-27 3. OPERATING ENVIRONMENTS ........................................................................................... 2-31 Mixed Traffic ....................................................................................................................................... 2-31 Semi-exclusive .................................................................................................................................... 2-32 Exclusive ............................................................................................................................................... 2-34 Grade Separated ................................................................................................................................ 2-35 4. SERVICE PATTERNS ............................................................................................................. 2-36 Fixed Route .......................................................................................................................................... 2-36 Demand Responsive ......................................................................................................................... 2-42 5. REFERENCES ........................................................................................................................... 2-48 Chapter 2/Mode and Service Concepts Page 2-i Contents I
Organization of Chapter 2. www.ntdprogram.gov www.apta.com Transit Capacity and Quality of Service Manual, 3rd Edition 1. INTRODUCTION Chapter 2 of the Transit Capacity and Quality of Service Manual (TCQSM) is the first of three chapters that presents basic concepts that are applied in later chapters presenting capacity and quality of service methods. This chapter introduces the transit modes used in the U.S. and Canada and discusses how service using these modes can be developed. ⢠Section 2 describes and illustrates each of the transit modes-bus, demand responsive, van pool, rail, and ferry transit-and their submodes. ⢠Section 3 describes the operating environments (rights-of-way) that transit service can operate in, along with general descriptions of their impacts on capacity, speed, and reliability. ⢠Section 4 describes the service patterns applied by fixed route and demand- responsive transit services and the situations in which they are typically used. ⢠Section 5 is a list of references used to develop the material in this chapter. HOW TO USE THIS CHAPTER This chapter introduces the various transit modes and how they operate. While readers who are new to the transit industry will get the most benefit out of this chapter, other readers may find value in the summaries of industry trends in vehicle design, propulsion, and transit agency usage; technology; and service types. Because industry terminology is not standardized, this chapter also serves as a reference that defines the transit modes and operating environments presented in subsequent chapters. Unlike previous editions of the TCQSM, no lists of transit agencies operating particular modes are provided, nor are lists of ridership and other details of specific agencies or transit lines provided. This material ages rapidly and readers are referred instead to the up-to-date information available through the National Transit Database (NTD) and the American Public Transportation Association's (APT A's) annual Public Transportation Fact Book. OTHER RESOURCES Other TCQSM material related to this chapter includes: ⢠The "What's New" section of Chapter 1, User's Guide, which describes the changes made in this chapter from the 2nd Edition; ⢠Chapter 3, Operations Concepts, which describes the effects of operating environment on achievable transit vehicle speeds and capacities; and ⢠The manual's CD-ROM, which provides links to of all of the TCRP reports referenced in this chapter. Chapter 2/Mode and Service Concepts Page 2-1 Introduction I
Transit Capacity and Quality of Service Manual, 3'd Edition 2. TRANSIT MODES BUS TRANSIT Overview The bus is the most commonly used form of public transport in North America. In 2011, it accounted for 52% of all U.S. passenger trips by transit and 56% of transit trips on larger Canadian transit systems that reported to APT A. There were estimated to be more than 1,200 bus systems in operation in the U.S. in 2010 (1). The bus mode is highly flexible in that service can be provided by many different types of vehicles (discussed below), can operate on many different types of rights-of-way (discussed in Section 3), and can implement a variety of stopping patterns (discussed in Section 4). Vehicle Types Bus service can be provided by vehicle types ranging from minibuses to articulated and double-deck buses, allowing the type of bus used to be matched to the type and quality of service desired to be operated and the required capacity. The standard 40-ft (12-m) bus has historically been the most widely used type of bus in the U.S., but its share of the total bus fleet dropped noticeably during the first decade of the 2000s, as shown in Exhibit 2-1, as usage of both larger and smaller buses increased. Share of U.S. Bus Fleet Bus Size 2001 2010 Articulated bus (60-ft/18-m length) 3.0% 5.7% Standard bus (non-articulated, >35 seats) 71.1% 59.9% Small bus (25-35 seats) 11.6% 16.5% Minibus (<25 seats) 14.3% 17.9% Source: Federal Transit Administration (2). Diesel fuel has historically been the most common power source for transit buses in the U.S., but the use of alternative fuels increased noticeably during the first decade of the 2000s (Exhibit 2-2). Reasons for choosing alternative fuels can include environmental benefits (e.g., reduced or eliminated bus exhaust emissions), noise concerns (e.g., quieter operation with hybrid or electric-only buses), ride comfort (e.g., electric-only buses have no transmission), improved hill-climbing ability (electric trolleybuses), and operating cost savings (e.g., reduced fuel costs). Share of U.S. Bus Fleet Power Source 2001 2010 Diesel 90.1% 65.8% Natural gas (CNG, LNG, and blends) 9.0% 18.6% Biodiesel 0.0% 7.7% Electric and hybrid 0.1% 7.0% Gasoline 0.4% 0.7% Other 0.3% 0.2% Source: American Public Transportation Association (1). Totals may not sum to 100% due to rounding. Note: CNG =compressed natural gas, LNG= liquefied natural gas. Exhibit 2-1 Trends in U.S. Bus Sizes Exhibit 2-2 Trends in U.S. Bus Vehicle Power Sources Transit Modes Page 2-2 Chapter 2/Mode and Service Concepts
Transit Capacity and Quality of Service Manual, 3rd Edition The combination of vehicle size and power source affects a bus' acceleration characteristics, which impacts how quickly a bus can reach its cruising speed and its overall average speed. Chapter 6, Bus Transit Capacity, provides information about the acceleration characteristics of selected bus types in Exhibit 6-2. Low-floor buses, which allow easier boarding for all passengers by eliminating the need for steps and wheelchair lifts, are becoming the predominant type of bus used in transit service, increasing from 20% of all bus orders in 1997 (3) to 90°/o of bus orders in 2010 ( 4). As discussed in Chapter 6, the lack of steps on low-floor buses speeds up the passenger boarding and alighting process, which can benefit bus speeds and bus stop capacity. At the same time, low-floor buses offer fewer seats than high-floor buses of comparable length, which affects the bus' person-carrying capacity and, potentially, the quality of service offered to passengers. Partial low-floor designs, where only the area from the rear door forward is low floor, typically provide 3-5 fewer seats than a comparable high-floor bus, as the front wheelwells protrude into the seating area. Buses with 100% low-floor designs provide even fewer seats than comparable partial low-floor designs, as both the front and rear wheelwells replace seating area. The wheelwheel space is not necessary wasted, as it can be used for other purposes, such as a cabinet for the bus' electronics (passenger counting, vehicle location, video camera recorders, etc.), or storage space for larger items that would otherwise block the aisle. In addition to constraints posed by the vehicle's floor height, the number of seats provided on a given bus also reflects trade-offs in seat orientation (e.g., facing forward, facing the aisle, facing each other), seat pitch (i.e., distance between seats), number and width of doors provided, and accommodations for users with strollers, bicycles, luggage, or other large objects. These factors can influence passenger capacity, boarding and alighting time, quality of service, or a combination of these. Exhibit 2-3 illustrates some of the different types of buses used in North American bus service, describes typical applications for these buses, and discusses their associated capacity and quality of service considerations. Chapter 2/Mode and Service Concepts Page 2-3 Transit Modes I
Transit Capacity and Quality of Service Manual, 3rd Edition Bus Type (a) Standard low-floor (c) Community bus Transit Modes Typical Applications ⢠Typical local bus service ⢠Local bus service on streets without curbs or sidewalks ⢠Routes requiring a little more capacity than what a low-floor bus offers ⢠Bus service on lower-volume routes ⢠Bus service that operates on neighborhood streets with tight turning radii ⢠Routes where added capacity is desired without adding more buses ⢠Routes where reduced number of buses, but same capacity, is desired ⢠Commuter bus service ⢠Intercity passenger service ⢠Heavier-duty bus for high-speed running ⢠Can carry luggage or bicycles in compartments underneath bus ⢠Custom designed for a particular application, for example : o Doors on both sides for BRT routes with center stations o Minimal seats for downtown circulator/distributor routes ⢠Similar capacity/headway reasons as articulated buses ⢠Tall bus stands out ⢠Tourist-oriented or high-volume routes ⢠Tourist-oriented circulator service ⢠Special event service (e.g., city festival , county fair) Page 2-4 Capacity/Quality of Service Factors ⢠Faster boarding times, particularly for mobility devices ⢠Fewer seats than comparable high-floor bus ⢠Prefer streets developed with curbs for ramp deployment ⢠Wheelchair lift works better than ramps in areas without curbs and sidewalks ⢠Typically provides 3-5 more seats than a comparable low-floor bus ⢠Longer boarding times (stairs) ⢠Can allow bus service to be provided in areas difficult to serve with a standard-size bus ⢠Most or all passengers will be seated ⢠50% more seats and standing capacity than standard bus ⢠High or low floor ⢠Reducing frequency may increase passenger service times and overall travel times ⢠Larger, more comfortable seats ⢠May offer internet service, tray tables, overhead storage, and other amenities ⢠Typically no standees allowed ⢠High floor ⢠Doors on both sides provide operating flexibility ⢠Replacing seats with standing area provides greater passenger capacity ⢠Potentially longer boarding/ alighting times due to stairs needed to access upper deck ⢠Good views from upper deck ⢠More capacity than a standard bus ⢠Distinctive vehicle reassures passengers this is their bus ⢠Increases transit service visibility ⢠Seats may be less comfortable ⢠High floor Exhibit 2-3 Bus Vehicle Type Examples Photo locations: (a) Victoria, B.C. (b) Tallahassee (c) San Jose {d) Edmonton (e) Cleveland (f) Eugene (g) Victoria, B.C. (h) Albuquerque Chapter 2/Mode and Service Concepts
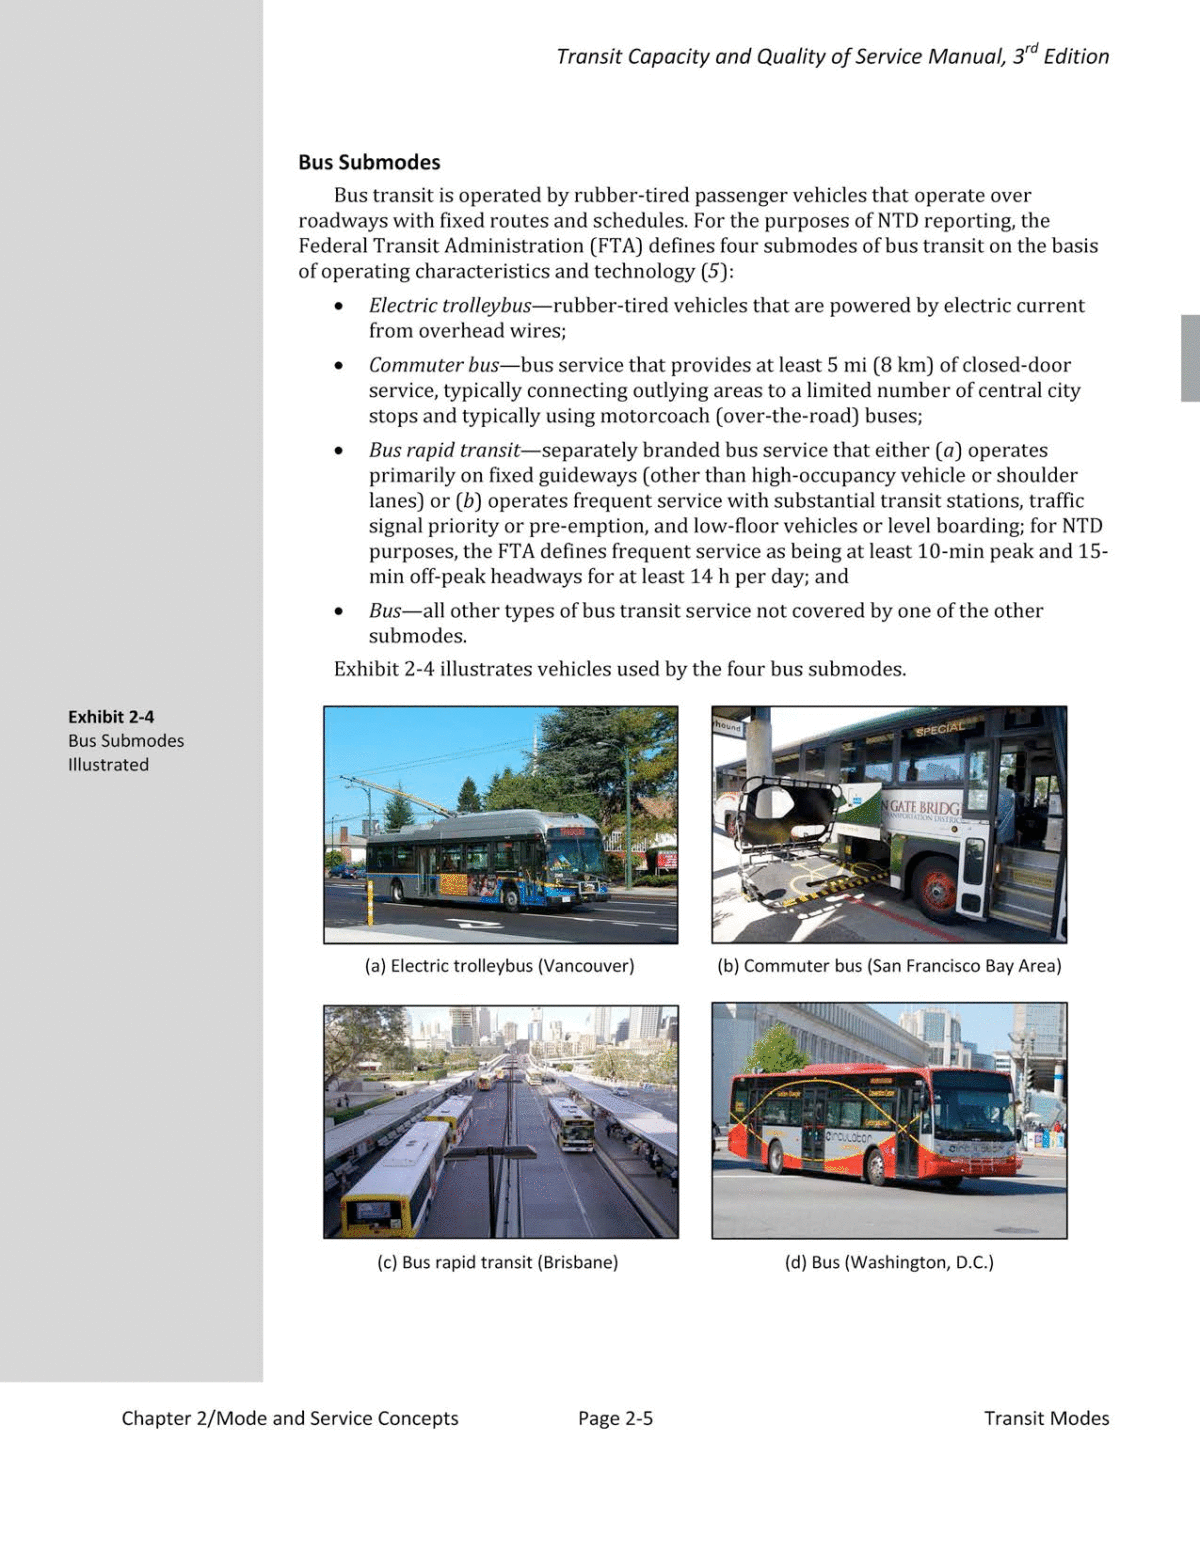
Exhibit 2-4 Bus Submodes Illustrated Transit Capacity and Quality of Service Manual, 3'd Edition Bus Submodes Bus transit is operated by rubber-tired passenger vehicles that operate over roadways with fixed routes and schedules. For the purposes of NTD reporting, the Federal Transit Administration (FTA) defines four submodes of bus transit on the basis of operating characteristics and technology (5): ⢠Electric trolleybus-rubber-tired vehicles that are powered by electric current from overhead wires; ⢠Commuter bus-bus service that provides at least 5 mi (8 km) of closed-door service, typically connecting outlying areas to a limited number of central city stops and typically using motorcoach (over-the-road) buses; ⢠Bus rapid transit-separately branded bus service that either (a) operates primarily on fixed guideways (other than high-occupancy vehicle or shoulder lanes) or (b) operates frequent service with substantial transit stations, traffic signal priority or pre-emption, and low-floor vehicles or level boarding; for NTD purposes, the FTA defines frequent service as being at least 10-min peak and 15- min off-peak headways for at least 14 h per day; and ⢠Bus-all other types of bus transit service not covered by one of the other submodes. Exhibit 2-4 illustrates vehicles used by the four bus submodes. (a) Electric trolleybus (Vancouver) (b) Commuter bus (San Francisco Bay Area) (c) Bus rapid transit (Brisbane) (d) Bus (Washington, D.C.) Chapter 2/Mode and Service Concepts Page 2-5 Transit Modes I
Transit Capacity and Quality of Service Manual, 3rd Edition DEMAND-RESPONSIVE TRANSIT Overview Demand-responsive transit (DRT) is a form of public transportation characterized by flexible routing and scheduling of small to medium-size vehicles (Exhibit 2-5) operating in shared-ride mode between pick-up and drop-off locations according to passengers' needs. Historically, DRT has been referred to as dial-a-ride service- passengers call the transportation operator, who then dispatches a vehicle to pick up the passengers and transport them to their destinations. However, in more recent years, DRT has evolved to include a range of user-oriented forms of public transportation that have been referred to as "flexible transit services," which share attributes of pure DRT and fixed-route service. (a) DRT van (Chillicothe, Missouri) (b) Small bus (Northern Virginia) DRT and its related flexible services share a common element of a trip reservation. The reservation may be made once when an individual books the initial trip for subscription service, reservations may be made each time an individual requests a trip, or the reservation may be made by a passenger on board a vehicle requesting a specific stop. However, a passenger's personal request for a reservation or service consideration is one of the service characteristics that make DRT and its variants distinct from traditional fixed-route, fixed-schedule service ( 6). A defining attribute of DRT is its flexibility, and this has generated variations of DRT, ranging from DRT as a specialized transportation service for human service agencies and their clients, to DRT as a feeder to fixed-route bus and rail, to flexible-route segments and route deviation service (also known as flex route). There is a wide range of DRT variants, sharing the common attributes that they are not fixed-route and fixed- schedule and include some form of individual trip request. Beyond this, the services differ in their degree of flexibility, the rider groups they serve, and their operational and performance attributes. Development of DRT as a Mode Origins of DRT DRT emerged as a distinct transportation mode in the 1960s and 1970s, based on early work done by MIT, Northwestern University, Ford Motor Company, and GM Motors Research Laboratories (7). DRT services were implemented in a variety of communities, providing "many-to-many" or "few-to-few" service, as well as feeder Exhibit 2-5 Examples of Vehicles Used in Demand- Responsive Transit DRTtrip patterns (e.g., many-to-many) are discussed in more detail in Section 4. Transit Modes Page 2-6 Chapter 2/Mode and Service Concepts
Transit Capacity and Quality of Service Manual, 3'd Edition service to other transit modes ("many-to-one"). By the early 1970s, about 25 DRT systems were known to exist in North America. Most of these used small buses or vans and several were taxi-based (7). In the later 1970s and the 1980s, the DRT mode spread to many communities across the U.S. as a way to provide community-based public transportation service to either the general public or to older adults and persons with disabilities, as a mode better suited in lower-density areas than traditional fixed-route bus. DRT became particularly popular in a number of states, including Michigan and California. Some of these early DRT services continue to operate today. DRT service gained attention in the 1970s with the U.S. Congress' passage of Section 504 of the Rehabilitation Act (in 1973) and DOT -implementing regulations (in 1979). This law required federally assisted transportation programs to be accessible to persons with disabilities, including wheelchair users. To meet this requirement, public transportation agencies had some flexibility in the way each agency approached serving the transportation needs of people with disabilities. Some transit systems bought accessible buses for fixed-route services, some provided para transit services only, and some provided a combination of accessible buses and paratransit services. Progress towards meeting Section 504 requirements was mixed, and more agencies opted to provide paratransit rather than accessible fixed-route. DRT and the Americans with Disabilities Act Passage of the Americans with Disabilities Act (ADA) in 1990 and implementing regulations the following year eliminated the flexibility that had been available under Section 504. The ADA established the requirement that all transit vehicles used for fixed-route service must be accessible to people with disabilities. For people who cannot access or use accessible fixed-route service because of their disability, the ADA mandates a DRT service known as ADA complementary para transit. The ADA requires transit agencies that provide fixed-route service to also provide para transit that complements the fixed routes, and this complementary paratransit service is highly prescribed by the federal regulations. The term paratransit, originally coined to refer to the wide range of services that fall between traditional fixed-route/fixed-schedule service and the private car, is used by some to refer just to the required ADA complementary paratransit service, although its original definition reflects a more comprehensive perspective. Emergence of Flexible Transit Services The 1980s and 1990s also saw the emergence of new types of flexible transit service, variants of traditionally-defined DRT. As communities responded to new growth patterns and economic trends, they implemented services that combined attributes affixed-route, fixed-schedule service and DRT. TCRP Synthesis 53: Operational Experiences with Flexible Transit Services categorized these flexible services into six types: demand-response connector service (also known as feeder service), zone routes, point deviation, route deviation (also called flex route), flexible-route segments, and request stops (8). The most common of these six types are route deviation, request stop, and demand-response connector (9). These flexible services generally operate in limited service areas that are considered difficult to serve because of the demographics, land development pattern, or street Chapter 2/Mode and Service Concepts Page 2-7 Transit Modes I
Transit Capacity and Quality of Service Manual, 3'd Edition layout. Transit agencies may operate DRT or other flexible services during low-demand time periods, substituting for fixed-route transit when ridership levels do not justify fixed-route/fixed-schedule service. DRT service may be the only transit in small and low-density areas, particularly rural communities and some suburban areas. Transit agencies that operate flexible services attempt to balance efficiency and flexibility, using strategies that reduce the inefficiency of pure DRT service. This means there are typically limits to the degree of pure DRT service that is provided (8). Types of DRT Service General Public DRT Description and Applications General public DRT provides flexibly routed, shared ride service that responds to requests from the general public. The flexible routing is typically "many-to-many," providing trips from many different origins to many destinations within the defined service area as well as "many-to-few," with trips from many origins to a small number of frequented destinations. Scheduling may be immediate response, similar to taxi service, or it may be advance reservation, so that trip requests are required a day to several days or more in advance. Alternatively, the policy on scheduling may allow for both immediate and advance requests. General public DRT may be an appropriate transportation service in a low-density community with a geographic dispersion of trip generators, or in a rural community with limited demand for public transportation. Where population densities exceed about 1,000 persons per square mile and where there is some linear pattern to trip demand, transit planners generally look beyond DRT to service that incorporates some aspect of fixed-route or fixed-schedule service. Performance The performance of general public DRT varies in terms of its productivity (passenger trips per revenue hour) and depends on numerous factors, particularly the size of the service area, locations of trip generators, and nature of trip demand. Data from representative general public DRT systems in urban areas show productivity ranging from 2.9 to 4.7 passenger trips per revenue hour (10). Some transit agencies modify general public DRT to incorporate some aspects of fixed-route transit to achieve higher productivity. These DRT variants are discussed later in this chapter. General public DRT is commonly provided in rural communities. Based on 2009 research, 86 percent of the more than 1,300 rural transit providers provide DRT service (11). Rural DRT productivity varies considerably by the size of the service area. An analysis of Rural NTD data from 2007 shows that rural DRT systems serving smaller, municipal-only areas had an average productivity of 4.4, those serving single-county areas had an average productivity of 3.1, and those serving multi -county areas had an average productivity of 2.9 (6). Many rural DRT providers, whether community-based or serving larger county and multi-county areas, serve long-distance trips to medical facilities in urban areas as part of their service mix. These long trips result in lower productivity and higher vehicle mileage, affecting performance as well as operating cost. Transit Modes Page 2-8 Chapter 2/Mode and Service Concepts
Transit Capacity and Quality of Service Manual, 3rd Edition Technology The technology used by transit agencies that provide DRT service includes traditional information technology, defined as computer-based information systems, communications technology such as the Internet and cell phones, as well as advanced systems designed specifically for demand-responsive transportation. These technology applications may help improve service on the street, enable an increase in productivity, and improve customer service. Examples of advanced technology include software that automates scheduling and dispatching functions from a central control center and on- vehicle technology that identifies the vehicle location in real-time. Technology enhancements have enabled a new model of DRT that eliminates the need for a control center to handle trip reservations, scheduling, and dispatch, generally for DRT in a limited service area. For example, the Denver Regional Transportation District provides general public DRT in a number of lower-density service areas within its larger transit district. The DRT service, marketed as "Call-n-Ride," uses a mobile device for vehicle drivers to handle trip requests (and subsequent scheduling) from prospective riders via cell phone or online booking. GPS-enabled tablet computers with a mobile application, Web-based software, wireless access, and cell phone technology make this new model possible. Limited Eligibility DRT Description and Applications Limited eligibility DRT operates similarly to general public DRT except that only defined rider groups are served, often older adults and people with disabilities. Limited eligibility DRT services may be referred to as specialized transportation and may serve as a supplement to fixed-route service, recognizing that some residents of a community have difficulty using traditional transit service and benefit from a more flexible and personalized service. Some limited eligibility systems restrict not only the rider groups they serve, but also trip purposes. Where funding is constrained, the system may prioritize trips, with preference for trips to medical appointments, work, school, grocery shopping, and other life-sustaining trips. Other trip purposes, such as those for social purposes and other quality-of-life trips, may be served only if space is available, or may not be served at all. Many rural DRT services have their origins as specialized transportation, expanding to serve general public riders once they receive funding from federal Section 5311, Formula Grants for Other than Urbanized Areas. Productivity Productivity for limited eligibility DRT services ranges from 1.5 to 4.35 passenger trips per revenue hour, based on representative data from urban systems (10). DRT providers that group trips to common destinations such as senior centers and human service agencies, using many-to-one scheduling, tend to have higher productivity. Chapter 2/Mode and Service Concepts Page 2-9 Transit Modes I
Transit Capacity and Quality of Service Manual, 3'd Edition ADA Paratransit Description In urban areas with fixed-route service, ADA complementary paratransit is the predominant public DRT service. The ADA requires any public transit agency-urban or rural-that provides fixed-route service to also provide ADA complementary paratransit to "ADA paratransit eligible individuals," defined as individuals whose disabilities, permanent or temporary, prevent their access to and/or independent use of the fixed-route service. Transit agencies must establish an eligibility process to determine which individuals qualify for ADA paratransit service. Regulatory Requirements ADA regulations stipulate that six service criteria must be met, ensuring that paratransit service is comparable to service by fixed route. These service criteria state that the ADA complementary paratransit service must, at a minimum: 1. Operate in the same service area as the fixed-route system, which generally includes a %-mile corridor on either side of bus routes and around rail stations. 2. Have a comparable response time as fixed route, where response time is defined as the elapsed time between a request for service and the provision of service. Comparability is defined as accommodating trip requests for ADA paratransit-eligible individuals at any requested time on a particular day in response to a request for service made during normal business hours on the previous day. 3. Have comparable fares as fixed route. Comparability is defined as fares that are no more than twice the base, non-discounted adult fare for fixed-route services. Companions of the ADA rider may be charged the same fare as the ADA rider, but personal care attendants must ride free. 4. Meet requests for any trip purpose, that is, there may be no trip purpose restrictions. 5. Operate during the same days and hours as the fixed-route service. 6. Operate without capacity constraints for ADA trips requested by ADA-eligible passengers, meaning no waiting lists, trip caps, or patterns and practices of a substantial number of trip denials, untimely pick-ups, or excessively long trips. This last requirement has been one of the more difficult mandates of the ADA for transit agencies required to provide ADA complementary paratransit. According to ADA regulations and subsequent interpretations, capacity constraints means the transit agency cannot deny trips for eligible riders, as long as the trips are within the prescribed service area and service hours of the fixed-route service; the only exceptions are an insubstantial number of trips that are beyond the control of the transit agency. The prohibition of capacity constraints also means that the transit provider must ensure its ADA paratransit service achieves high standards for on-time performance, onboard trip length (measured by travel time), and telephone availability for trip reservations. Transit Modes Page 2-10 Chapter 2/Mode and Service Concepts
http://www.fta.dot.gov /12325 3891.html Transit Capacity and Quality of Service Manual, 3rd Edition While the ADA essentially defines several service measures related to capacity constraints (e.g., on-time performance) and requires high standards of performance related to those measures, policies related to the measures (such as the length and definition of the on-time window) and the specific standards for achievement (e.g., on- time performance standard might be 90%, 92%, 93%, 95%, etc.) are determined locally. ADA guidance has been provided since the regulations were first published to clarify aspects of service provision. This guidance has clarified, for example, the requirement that ADA para transit must be origin to destination. According to the guidance, a transit agency may establish the ADA paratransit service policy as either curb-to-curb or door- to-door, but the agency must ensure that riders can actually get from their origin point to their destination point. This means the transit provider will need to go beyond the curb to assist some riders to or from their doors if the established policy is curb-to-curb. Significantly, the ADA-established six service criteria, as well as the service measures and requirements for high standards of performance related to the prohibition of capacity constraints, mean that transit agencies have less latitude to make operational changes to their ADA paratransit services to affect service and performance. Premium Service Transit agencies with an ADA paratransit obligation must meet the minimum requirements set out in the regulations, as outlined above, but they may chose to go beyond these requirements. For example, a transit agency may serve an area larger than the% mile corridors, serve individuals who do not meet the ADA's disability definition (such as older adults without disabilities), or exceed other ADA para transit mandates. These beyond-ADA paratransit services are referred to as premium services. Some transit agencies have chosen to offer service to a larger area than required, such as to the entire city or county, rather than just the %-mile corridors around fixed routes, essentially establishing two tiers, with the first tier being the required service area and the second extending to the jurisdictional limits. While the fare in the first tier can be no more than twice the fixed route fare in keeping with ADA regulations, fares for tier two trips can be higher, more than twice the fixed route fare. The transit agency can also adopt differing policies for the premium second tier, such as more limited service hours, denials of service once capacity is reached, and so forth. Productivity ADA paratransit productivity levels are generally lower than other types of DRT services, in part because trip patterns of ADA paratransit tend to be many-to-many. Representative data from urban systems show that the largest city transit agencies achieve productivity levels from 1.3 to 2.3 passenger trips per revenue hour, with most below 2. Transit agencies in large cities have productivities ranging from 1.8 to 2.7 and, in small cities, from 1.8 to 3.8 passenger trips per revenue hour (10). Productivity is impacted by various factors and these should be considered when assessing productivity data. Such factors include, among others, the size of the service area and trip demand density, the nature of travel patterns, the length of the on-time window, the number of no-shows, and the level of traffic congestion. In major metropolitan regions, for example, ADA paratransit productivity may be as low as 1 passenger trip per hour, impacted by a large service area, many-to-many travel Chapter 2/Mode and Service Concepts Page 2-11 Transit Modes I
Transit Capacity and Quality of Service Manual, 3'd Edition patterns, and traffic-congested streets with limited curbside parking for passenger boarding and alighting. Human Service Transportation Description and Applications Human service transportation is shared-ride, advance-scheduled transportation for users and clients of human service programs. This type of DRT allows older adults, persons with disabilities, lower-income persons, disadvantaged children, and others with social service needs to access health care, adult day care, job training, pre- kindergarten enrichment programs, and other non-profit and public human service programs as appropriate for their needs. Human service transportation is an ancillary service provided by many human service agencies, offered so that their clients can access the agency's primary mission, whether that is healthcare, job training, or another human service. These agencies may purchase transportation services from public or private providers, may purchase vehicles that they operate directly to transport their own clients, or may facilitate their clients' use of public transportation, both fixed-route and DRT. Human service agencies may establish formal agreements for client transportation from the public transit agency, or clients of human service agencies may use the public transit services as unaffiliated riders to access their needed programs. Shifts in Demand from Human Service Transportation to ADA Paratransit In some cities, human service transportation has been a factor in the large growth in demand for public transit agencies' ADA paratransit service, as human service agencies may shift their clients to the ADA paratransit program because of their own agency funding constraints or with the intent of better integrating their clients into public, albeit specialized, transportation. Since many of those clients have disabilities, public transit agencies must absorb this growth within their ADA paratransit programs (assuming the passengers meet ADA paratransit eligibility criteria), because of the ADA prohibition on capacity constraints. This growth in demand for ADA paratransit service stemming from trip-shifting from human service agencies to public transit agencies, coupled with the beginning of the age wave, with a projected 79% increase in people aged 65 and above between 2010 and 2030 (12), has become a significant issue for some public transit agencies. Coordinated Transportation Human service transportation is noteworthy as the object of industry efforts to coordinate transportation for more than 30 years. Research has identified more than 60 different federal programs that fund some type of human service transportation, with the largest number funded through the federal Health and Human Services Department, resulting in myriad different transportation services at the local level. Efforts to coordinate human service transportation stem from requirements of the FTA's funding programs that support specialized transportation. The FTA now requires a locally developed, coordinated public transit-human services transportation plan as a prerequisite for Section 5310 (Formula Grants for Enhanced Mobility of Seniors and Individuals with Disabilities) funding and for funding to support access to jobs under Transit Modes Page 2-12 Chapter 2/Mode and Service Concepts
ADA requirements for von pools can be satisfied by having a stand-by, wheelchair- accessible vehicle available to serve a person who wishes to join a van pool and who requires a wheelchair- accessible van. Not all vans need be wheelchair-accessible. Transit Capacity and Quality of Service Manual, 3'd Edition the Section 5307 (Urbanized Area Formula Grants) and Section 5311 (Formula Grants for Other than Urbanized Areas) programs. Resulting experience with the coordinated plans, which have been developed at the local, regional, and statewide level, has been mixed, although participants have reported enhanced transportation access for the target populations (13). Jitney The jitney is a demand-responsive transit mode open to the general public for which passenger cars or vans are operated on fixed routes without fixed schedules or stops, often by private owner-operators or small companies. In many developing countries, they are the primary form of public transportation, but are banned in many U.S. cities due to competition with regulated taxicab and public transit service (14). (Jitneys may compete for riders on the most heavily used-and productive-transit routes, resulting in reduced revenue for the transit system and a reduction in its ability to provide service on less-productive routes.) Where they are allowed in the U.S., they may be regulated on the basis of: ⢠Insurance, safety, and ADA requirements only, with no restrictions on service area or number of vehicles operated, as was the case in Hudson County, New Jersey in 2010 (15); ⢠A franchise or permit, with defined routes or service areas, as in Houston (16); ⢠An association, with limits on the number of vehicles operated, as in Atlantic City, New Jersey (17); ⢠A privately owned and operated, publicly regulated (e.g., routes, fares) public transit service, as with the publico systems in Puerto Rico (5); or ⢠Some combination of the above. VAN POOL Vanpools provide shared rides in vans or buses between homes or a central location (e.g., a park-and-ride lot) to a regular destination. The same group of riders uses the vehicle each day; driving duties may be assigned to one of the riders (possibly in exchange for a reduced or eliminated fare or limited after-hours use of the vehicle) or rotated among the riders. In a public transit context, the service is available and promoted to the general public, is not restricted a priori to a particular employer, provides seven or more seats per van, and meets ADA requirements (5). Vans used in public transit service are typically owned by the public transit agency and riders are charged a weekly or monthly fare, sometimes on the basis of the number of van pool participants relative to the van's seating capacity. Some of the larger public van pool programs in U.S. in 2010 were located in the Seattle, Los Angeles, Houston, San Diego, and Chicago areas, each of which had more than 600 vanpools sponsored by a single transit agency (18). RAIL TRANSIT Overview Rail transit systems in the U.S. and Canada carry more than 5.4 billion passengers each year. As of 2010, a total of 91 systems were in operation for the four major rail Chapter 2/Mode and Service Concepts Page 2-13 Transit Modes I
Transit Capacity and Quality of Service Manual, 3'd Edition transit submodes-heavy rail, light rail, commuter rail, and automated guideway transit (AGT). Minor rail submodes include monorails, funicular railways (inclined planes), aerial ropeways, and cable cars. Collectively, as part of public transit operations, minor rail submodes served more than 14 million annual unlinked passenger trips in 2011 (1). The New York region dominates U.S. rail transit usage. The largest operator is MTA- New York City Transit, which carried over 2.4 billion passengers in 2010, 54% of the U.S. rail total. Adding all rail operators together in the New York City area, more than 2.8 billion passengers were carried, or more than 62% of the U.S. total (18). In Canada, the Toronto and Montreal systems dominate, with a combined 747 million annual rail passengers in 2010, or about two-thirds of the Canadian rail total (19). Intercity passenger rail service, including Amtrak and future high-speed passenger rail services, is not considered public transit and is not addressed in this manual. Rail Transit Submodes Heavy Rail Definition and Applications Heavy rail transit (Exhibit 2-6) is characterized by fully grade-separated rights-of- way, high-level platforms, and high-speed, electric multiple-unit cars. Power is generally collected from a third rail, but can also be received from overhead wires as in Cleveland and a portion of the Blue Line in Boston. Third-rail power collection, frequent service, and high operating speeds generally necessitate the use of grade-separated pedestrian and vehicular crossings. A small number of grade crossings is an unusual feature of the Chicago system. (a) Chicago (b) Toronto (c) Cleveland (d) San Francisco Bay Area Heavy rail is also known as subway, elevated, rapid transit, metro, and rapid rail. Exhibit 2-6 Heavy Rail Transit Examples Transit Modes Page 2-14 Chapter 2/Mode and Service Concepts
Transit Capacity and Quality of Service Manual, 3rd Edition Using trains of up to 11 cars running frequently, heavy rail systems can serve very high volumes of passengers, and are thus the dominant transit mode in the largest metropolitan areas in North America and in many other metropolises worldwide. Loading and unloading of passengers at stations is rapid due to level access and multiple double-stream doors. U.S. and Canadian heavy rail systems generally fall into two groups according to their time of initial construction. Pre-war systems are often characterized by high passenger densities and closely spaced stations, although the postwar systems in Toronto and Montreal also fall into this category. The newer U.S. systems that opened primarily in the 1970s and 1980s tend to place a higher value on passenger comfort and operating speed, as expressed by a greater usage of interior railcar space for seating and a more distant spacing of stations, especially in suburban areas. Most U.S. cities with the necessary population and job density to support heavy rail already have at least a starter system in place; therefore, only one new U.S. system has opened since the mid-1990s (in San Juan, Puerto Rico). Looking forward, all of the heavy rail projects in the New Starts pipeline as of 2012 consist of extensions to existing systems, except for a new automated heavy rail line proposed for Honolulu (20). Relationship to Other Rail Submodes Some overlap exists between heavy rail and other rail submodes: ⢠Some postwar heavy rail systems extend far into the suburbs and have long outer station spacings more typical of commuter rail systems-BART in the San Francisco Bay Area being a prime example. Because of their completely grade- separated nature and steel-wheel-on-rail technology, this manual treats these systems as heavy rail. ⢠Some newer heavy rail systems worldwide, such as Vancouver's SkyTrain and the Copenhagen Metro, have had fully automated operation (a characteristic of AGT), shorter trains and, in some cases, proof-of-payment fare collection (characteristics often associated with light rail). Some have termed these types of systems advanced light rail transit. Again, because of their completely grade- separated nature and steel-wheel-on-rail technology, this manual treats these systems as heavy rail. ⢠Philadelphia's Norristown high-speed line is entirely grade-separated, uses the third rail, and has high platforms (characteristics often associated with heavy rail), but uses one or two-car trains, makes many stops only on demand, and has on board fare collection (characteristics often associated with light rail). Southeastern Pennsylvania Transportation Authority (SEPTA), the FTA, and this manual classify it as heavy rail. Operating Characteristics Regardless, operating characteristics are of much greater interest than the label given to a particular transit service. As discussed in Sections 3 and 4, the operating environment and service pattern are key to determining a service's capacity and quality of service. Heavy rail services using short trains and operating at relatively long headways can provide less capacity and (in some respects) poorer quality of service than more frequent light rail or bus rapid transit services. On the other hand, long Chapter 2/Mode and Service Concepts Page 2-15 Transit Modes I
Transit Capacity and Quality of Service Manual, 3'd Edition heavy rail trains operating at short headways provide capacity unmatched by any other rail transit mode, providing the means to develop and serve the extremely dense downtowns of the largest cities. Light Rail Definition and Applications Light rail transit, often known simply as LRT, began as an evolutionary development of the streetcar to allow higher speeds and increased capacity. Light rail transit is characterized by its versatility of operation, as it can operate separated from other traffic below grade, at-grade, or on an elevated structure, or can operate together with motor vehicles on the surface. Service can be operated with single cars or multiple-car trains. Electric traction power is typically obtained from an overhead wire, thus eliminating the restrictions imposed by having a live third rail at ground level. (At the time of writing, Washington, D.C. was investigating options to allow streetcars to operate wirelessly over short segments to preserve viewsheds). This flexibility helps keep construction costs low in comparison to heavy rail and helps explains the popularity this mode has experienced since the late 1970s. Types of Light Rail Operations Three major types of light rail operations exist (Exhibit 2-7): ⢠Light rail, with relatively frequent service along mostly exclusive or segregated rights-of-way, using articulated cars and up to four-car trains. ⢠Streetcars, operating along mostly shared or segregated rights-of-way, with one- car (or rarely, two-car) trains. Vehicle types and ages can vary greatly. ⢠Vintage trolleys provide mainly tourist- or shopper-oriented service, often at relatively low frequencies, using either historic vehicles or newer vehicles designed to look like historic vehicles. Light rail and streetcar systems in a few cities-Boston, Cleveland, New Orleans, Newark, Philadelphia, Pittsburgh, San Francisco, and Toronto-survived the general trend of replacing streetcars with bus service in the middle of the 20th century. Most of those systems date from the 19th century, although most now operate with modern light rail vehicles. The modern North American LRT era began in 1978 in Edmonton. These newer LRT systems have adopted a much higher level of segregation from other traffic than earlier streetcar systems enjoyed, with most having extensive stretches of grade-separated or exclusive right-of-way with minimal interference from automobile traffic. As of 2011, 20 modern LRT systems were operating in the U.S. and Canada, all in larger cities, an increase of six systems from 2000. The modern streetcar was introduced in Portland in 2001, using a European-built low-floor design. As of 2010, modern streetcar lines were also operating in Tacoma and Seattle. These initial lines serve downtown circulation or distribution functions, and were developed in conjunction with redevelopment plans along the lines. Other cities have also included streetcars as part of redevelopment plans, but have chosen to operate these lines with vintage trolleys. Six such lines were in operation in 2010, an increase ofthree from 2000. Transit Modes Page 2-16 Chapter 2/Mode and Service Concepts
Exhibit 2-7 Light Rail Examples Transit Capacity and Quality of Service Manual, 3'd Edition (a) High-floor light rail (Denver) (b) Low-floor light rail (Portland) (c) High-floor streetcar (Philadelphia) (d) Modern low-floor streetcar (Seattle) (e) Vintage trolley (Memphis) (f) Diesel light rail (San Diego County) Diesel Light Rail (Hybrid Rail) Another recent trend is the introduction of diesel light rail cars, with three lines in operation as of 2010 in the U.S. and Canada. These vehicles do not meet the strict definition of light rail, as they are not electrically operated (the FT A now terms them hybrid rail), nor do they meet the strict definition of commuter rail, due to short trains and (often) lack of direct service to a central city. The TCQSM's rail capacity procedures can be applied to diesel light rail, with suitable modifications to reflect differences in vehicle performance and train signaling. The vehicles are designed to be operated on existing railroad tracks without the need to add electrical infrastructure. As the vehicles do not meet Federal Railroad Administration carbody strength standards with respect to collisions with other trains, passenger service on the tracks can only occur during times of the day when there is no freight service (and vice versa). None of the three lines is a traditional downtown-focused light rail line; two of the lines (Ottawa and northern San Diego County) do not serve the center city at all and the third (southern New Jersey) Chapter 2/Mode and Service Concepts Page 2-17 Transit Modes I
Transit Capacity and Quality of Service Manual, 3'd Edition resembles an old-style interurban line in route structure, with a few closely spaced stops in Trenton and Camden and more widely spaced stops at the towns in between. All three connect with high-capacity transit services at one or both ends of the line. Wheelchair Access Providing wheelchair access to LRT and streetcar vehicles is an important design consideration, with both capacity and quality-of-service implications. When the first modern LRT systems came into operation, high-floor vehicles were the only vehicle type available. With an entirely off-street system, as in Edmonton, high-level platforms could be provided, allowing level boarding into the vehicles. However, most LRT systems and all streetcar systems involve some on-street operation. Some light rail systems with street running, such as in Calgary, use high platforms throughout, but this is not applicable for streetcar service. As discussed in Chapter 8, Rail Transit Capacity, a number of systems have been devised to overcome the elevation difference, all of which take some time to operate. Newer light rail systems have adopted the low-floor vehicle technology that has entered the market, and some older systems have added low-floor vehicles to their fleet. Slide-out ramps allow wheeled mobility device users to roll directly onto the train, with minimal impacts on dwell time. Commuter Rail Definition and Applications Commuter rail (Exhibit 2-8) is generally a long-distance transit mode using trackage that is part of the general railroad system, although portions may be used exclusively for passenger movement. A few commuter rail operations, such as the Long Island Rail Road and the New Canaan branch ofMTA Metro-North's New Haven line, were built solely for passenger movement. Short portions of in -street trackage are rare, such as on the South Shore Line in Michigan City, Indiana. Track may be owned by the transit system or access may be by agreement with a freight railroad. Similarly, train operation may be by the transit agency, the track owner, or a third-party contractor. Service is heavily oriented towards the peak commuting hours, particularly on the smaller systems. All-day service is operated on many of the mainlines of the larger commuter rail systems and the term regional rail is more appropriate in these cases. As of 2011, 27 commuter rail services were in operation in the U.S. and Canada (not including intercity services), an increase of seven from 2000. Transit Modes Page 2-18 Chapter 2/Mode and Service Concepts
Exhibit 2-8 Commuter Rail Examples Multiple-unit cars are self-propelled, as opposed to needing a locomotive to provide power. Transit Capacity and Quality of Service Manual, 3'd Edition (a) Bi-level car (Toronto) (b) Bi-level gallery car (Chicago) (c) Bi-level car (San Francisco Bay Area) (d) Single-level car (Baltimore) Scheduling Commuter rail scheduling is often tailored to the peak travel demand rather than operating consistent head ways throughout the peak period. Where track arrangements and signaling permit, operations can be complex with the use of local trains, limited- stop express trains, and zoned express trains. Zoned express trains are commonly used on busy lines with many stations where express trains serve a group of stations then run non-stop to the major destination station(s). Service is typically focused toward the downtown of a major city (e.g., New York, Chicago) or between major cities within a region (e.g., Baltimore-Washington, San Francisco-San Jose, Dallas-Ft. Worth). Metrolink's Inland Empire-Orange County service in the Los Angeles area is an exception, connecting major cities of suburban counties to each other. The FT A considers a few intercity passenger trains (e.g., Harrisburg-Philadelphia and Portland, Maine-Boston) to be commuter rail operations because more than SO% of the ridership uses the service at least 3 days a week (5); however, these services are outside the scope of this manual. Power Sources Diesel and electric power are both used for traction on commuter rail lines. Electric traction is capital intensive but permits faster acceleration while reducing noise and air pollution. It is used mainly on busy routes, particularly where stops are spaced closely together or where long tunnels are encountered. Both power sources can be used for locomotive or multiple-unit operation. All cars in a multiple-unit train can be powered, Chapter 2/Mode and Service Concepts Page 2-19 Transit Modes I
Transit Capacity and Quality of Service Manual, 3'd Edition or some can be unpowered "trailer" cars that must be operated in combination with powered cars. Electric multiple-unit cars are used extensively in the New York, Philadelphia, and Chicago regions, and the entire SEPT A regional rail system in Philadelphia is electrified. The Trinity Railway Express between Dallas and Ft. Worth operates diesel multiple-unit cars during off-peak periods and TriRail in South Florida also supplements its service with diesel multiple-unit cars. Locomotive-hauled commuter trains are standard for diesel operation. They have also been used to serve lines where different voltages are used on different track sections (e.g., New Jersey Transit's Midtown Direct service) and to supplement electric locomotives when the diesel locomotives' slower acceleration does not unduly impact operations (e.g., certain peak-period express trains operated by SEPTA). Other systems, such as SEPTA, Metra's Electric District (Chicago), and the South Shore Line (Indiana- Chicago), value the flexibility of multiple-unit cars in varying train length. Montreal's STCUM commuter rail system replaced a mixed fleet with a standard electric multiple- unit design. Train Length Commuter rail train length can be tailored to demand with cars added and removed as ridership dictates. This is particularly easy with multiple-unit equipment and can result in trains of anywhere from one to twelve cars in length. Where train length is constant all day, unneeded cars can be closed to passengers to reduce staffing needs and the risk of equipment damage. Passenger Comfort and Car Design Commuter rail is unique among the rail transit modes in that a high priority is placed on passenger comfort, as journeys are often long and the main source of competition is the automobile. All lines operate with a goal of a seat for every passenger except for the busy inner portions of routes where many lines funnel together and frequent service is provided. Such is the case for the 20-min journey on the Long Island Rail Road between Jamaica and Penn Stations. Service between these points is very frequent (trains on this four-track corridor operate as close as 1 min apart in the peak hours) as trains from multiple branches converge at Jamaica to continue to Manhattan. Railcar Access Passenger access to commuter rail trains can be from platform (high) or ground level (low). High-level boarding is commonly used on busy lines or at major stations to speed passenger movements. Standard railway type "traps" in the stepwells allow cars to use both types of platform but require the train crew to raise and lower the trap door above the steps. The electric multiple-unit cars used by the South Shore Line employ an extra set of doors at the center of the cars that are used exclusively at high platform stations while the car end doors are fitted with traps in the conventional manner for use at high and low platform stations. This arrangement is also used on the electric multiple-unit cars used on Montreal's Deux-Montagnes tunnel line. Commuter rail cars can be designed with passenger seating on one or two levels, with the hi-level designs offering more seats per car and thus greater passenger capacity. Transit Modes Page 2-20 Chapter 2/Mode and Service Concepts
Transit Capacity and Quality of Service Manual, 3rd Edition Automated Guideway Transit Definition and Applications As their name indicates, AGT systems are completely automated (vehicles without drivers), with personnel limited to a supervisory role. Their automated nature requires the guideways to be fully grade-separated. Because a number of other rail modes are also capable of being automated when grade-separated, the National Transit Database narrows the definition of AGT to exclude steel-wheel-on-rail technologies (5). AGT technologies in use vary widely and include rubber-tired electrically propelled vehicles, monorails, cable-hauled vehicles, belt-driven systems, air levitation, and magnetic levitation (21, 22). Cars are generally small and service is frequent-the name "people mover" is often applied to these systems, which can take on the role of horizontal elevators. AGT systems operate in four types of environments, as illustrated in Exhibit 2-9: ⢠Airports; ⢠Institutions (universities, shopping malls, government buildings); ⢠Leisure and amusement parks; and ⢠Public transit systems. Airport Systems AGT use in the airport environment is increasing markedly. Nine new airport systems opened in the U.S. and Canada in the first decade of the 2000s, along with 11 others elsewhere in the world (22). Some of these airport systems-for example, the AirTrain at New York's JFK Airport and the MIA Mover at Miami International Airport- connect to regional transit systems. Although the TCQSM's capacity concepts are applicable to airport AGT systems, special attention must be given to the highly peaked passenger flows associated with flight arrivals and passengers' luggage needs, which differ from normal transit operations. ACRP Report 37: Guidebook for Planning and Implementing Automated People Mover Systems at Airports (22) provides guidance on estimating airport AGT capacities. Institutional and Other Systems As of 2003, nine institutional AGT systems operated in the U.S., along with 10 leisure systems (23). One of the largest institutional systems is located at the West Virginia University campus in Morgantown. This 3-mi (5-km) line features off-line stations that enable close headways, down to 15 s, and permit cars to bypass intermediate stations. The cars are small, accommodating only 21 passengers, and are operated singly. On- demand service is possible during off-peak hours. As of 2010, three public transit AGT systems operated in the U.S. (unchanged from 2000), serving the downtown areas of Detroit, Jacksonville, and Miami. Chapter 2/Mode and Service Concepts Page 2-21 Transit Modes I
Transit Capacity and Quality of Service Manual, 3rd Edition (a) Airport shuttle (Newark) (b) Downtown people mover (Miami) (c) Institutional (Honolulu) (d) Leisure (Memphis) Monorail Although often thought of as being relatively modern technology, monorails (Exhibit 2-10) have existed for over 100 years, with the first monorail, in Wuppertal, Germany, having opened in 1901 (24). Monorail vehicles straddle or are suspended from a single rail. Driverless monorails, such as the Jacksonville Skyway, fall into the category of AGT. The 0.9-mi (1.5-km) Seattle Center monorail, originally constructed for the 1962 World's Fair, is the only existing U.S. example of a non-automated public transit monorail. About one dozen privately operated monorails are in use at North American zoos and amusement parks. Outside the United States, a number of monorails are used for public transit service similar to an elevated heavy rail line. Examples include seven systems in Japan (25). (a) Straddle (Seattle) (b) Suspended (Wuppertal, Germany) Exhibit 2-9 AGT Examples Exhibit 2-10 Monorail Examples Transit Modes Page 2-22 Chapter 2/Mode and Service Concepts
Exhibit 2-11 Funicular and Elevator Examples Transit Capacity and Quality of Service Manual, 3'd Edition Funiculars, Inclines, and Elevators Funicular railways (Exhibit 2-11 ), also known as inclined planes or simply inclines, are among the oldest successful forms of mechanized urban transport in the United States, with the first example, Pittsburgh's Monongahela Incline, opening in 1870 and still in operation today. Funiculars are well suited for hilly areas, where most other transportation modes would be unable to operate, or at best would require circuitous routings. The steepest funicular in North America operates on a 100% ( 45°) slope, and a few international funiculars have even steeper grades. . \ .. . . ~.·.· · ~-,......- f (a) Passenger incline (Pittsburgh) (b) Vehicle incline (Johnstown, PA) (c) Passenger incline (Murren, Switzerland) (d) Inclined elevator (Ketchikan, Alaska) Historical Usage Early funiculars were used to transport railroad cars and canal boats in rural areas, as well as to provide access to logging areas, mines, and other industrial sites. Funiculars have played a role in many transit systems, moving not just people, but cars, trucks, and streetcars up and down steep hillsides. An example of a remaining vehicle- carrying incline that is part of a transit system is in Johnstown, Pennsylvania. Nearby, in Pittsburgh, the Port Authority owns the two remaining inclines from a total of more than 15 that once graced the hilly locale. Current Applications The number of remaining inclined planes in North America is small, but they are used extensively in other parts of the world to carry people up and down hillsides in both urban and rural environments. Switzerland alone has over 50 funiculars, including urban funiculars in Zurich and Lausanne. Many other cities worldwide have funiculars, including Barcelona, Budapest, Haifa, Heidelberg, Hong Kong, Paris, Prague, and Valparaiso, Chile (which has 15). In addition, funiculars are still being built for access to Chapter 2/Mode and Service Concepts Page 2-23 Transit Modes I
Transit Capacity and Quality of Service Manual, 3'd Edition industrial plants, particularly dams and hydroelectric power plants, and occasionally, ski resorts. New funiculars, primarily in Europe, also provide subway or metro station access. New designs rarely handle vehicles and make use of hauling equipment and controls derived from elevators. Design Most typical design involves two cars counterbalancing each other, connected by a fixed cable, using either a single railway-type track with a passing siding in the middle or double tracks. Single-track inclined elevators have just one car and often do not use railway track-see, for example, the Ketchikan example in Exhibit 2-ll(d). When passing sidings are used, the cars are equipped with steel wheels with double flanges on one set of outer wheels per car, forcing the car to always take one side of the passing siding without the need for switch movement. Earlier designs used a second emergency cable, but this is now replaced by automatic brakes, derived from elevator technology, that grasp the running rails when any excess speed is detected. Passenger compartments can either be level, with one end supported by a truss, or sloped, with passenger seating areas arranged in tiers. To minimize wear-and-tear on the cable, and make the design mechanically simpler, an ideal funicular alignment is a straight line, with no horizontal or vertical curves. To achieve this design, a combination of viaducts, cuttings, and/or tunnels may be required, as illustrated in Exhibit 2-ll(c). However, many funiculars have curved alignments. Public Elevators and Escalators Public elevators or escalators are occasionally used to facilitate pedestrian movement up and down steep hillsides where insufficient pedestrian volumes exist to justify other modes. These services allow pedestrians to bypass stairs or long, out-of- direction routes to the top or bottom of the hill. Aerial Ropeways Definition Aerial ropeways (Exhibit 2-12) encompass a number of modes that transport people or freight in a carrier suspended from an aerial rope (wire cable). The carrier consists of the following components: ⢠A device for supporting the carrier from the rope: either a carriage consisting of two or more wheels mounted on a frame that runs along the rope, or a fixed or detachable grip that clamps onto the rope; ⢠A unit for transporting persons or freight: an enclosed cabin, a partially or fully enclosed gondola, or an open or partially enclosed chair; and ⢠A hanger to connect the other two pieces. Transit Modes Page 2-24 Chapter 2/Mode and Service Concepts
Exhibit 2-12 Aerial Ropeway Examples Transit Capacity and Quality of Service Manual, 3'd Edition (a) Aerial tramway (Portland) (b) Detachable-grip gondola (Queenstown, N.Z.) The rope may serve to both suspend and haul the carrier (monocable); or two ropes may be used: a fixed track rope for suspension and a moving haul rope for propulsion (bicable ); or multiple ropes may be used to provide greater wind stability. Carriers can operate singly back-and-forth, or as part of a two-carrier shuttle operation, or as part of a multiple-carrier continuously circulating system. Common Aerial Ropeway Types The common aerial ropeway types are the following: ⢠Aerial tramways, which are suspended by a carriage from one or two stationary track ropes, and propelled by a separate haul rope. Tramways have one or, more commonly, two relatively large (20 to 180 passenger) cabins that move back and forth between two stations. Passenger loading occurs while the carrier is stopped in the station. ⢠Detachable-grip aerial lifts, consisting of a large number of relatively small (six to 15 passenger) gondolas or two to eight passenger chairs that travel around a continuously circulating ropeway. The carriers move at higher speeds along the line, but detach from the line at stations to slow to a creep speed (typically 0.8 ftjs or 0.25 mjs) for passenger loading. ⢠Fixed-grip aerial lifts, which are similar to detachable-grip lifts, with the important exception that the carriers remain attached to the rope through stations. Passenger loading and unloading either occurs at the ropeway line speed (typical for ski lifts), or by slowing or stopping the rope when a carrier arrives in a station (typical for gondolas). Some fixed-grip gondolas are designed as pulse systems, where several carriers are attached to the rope in close sequence. This allows the rope to be slowed or stopped fewer times, as several carriers can be loaded or unloaded simultaneously in stations. ⢠Funitels are a variation of detachable-grip aerial lifts, with the cabin suspended by two hangers from two haul ropes, allowing for longer spans between towers and improved operations during windy conditions. Chapter 2/Mode and Service Concepts Page 2-25 Transit Modes I
Transit Capacity and Quality of Service Manual, 3rd Edition Applications Aerial ropeways are most often associated with ski areas, but are also used to carry passengers across obstacles such as rivers or narrow canyons, and as aerial rides over zoos and amusement parks. Two aerial tramways are used for urban public transportation in the U.S.-New York City's Roosevelt Island Tram and the Portland Aerial Tram-and gondola systems are used internationally in such cities as Medellin, Caracas, Rio de Janeiro, and Algiers (26). A gondola system in Telluride, Colorado, transports residents, skiers, and employees between the historic section of Telluride, the ski area, and the Mountain Village resort area, reducing automobile trips between the two communities and the air pollution that forms in the communities' box canyons. Several North American ski areas use aerial ropeways for site access from remote parking areas, as an alternative to shuttle buses. Route Alignment Aerial ropeway alignments are typically straight lines, but allow changes in grade (vertical curves) over the route. Intermediate stations are most often used when a change in horizontal alignment is required, resulting in two or more separate ropeway segments-detachable-grip carriers can be shuttled between each segment, but passengers must disembark from other types of carriers and walk within the station to the loading area for the next segment. Gondola systems and chair lifts can have changes in horizontal alignment without intermediate stations, but this kind of arrangement is much more mechanically complex and is rarely used. Cable Car Application Cable cars (Exhibit 2-13) now operate only in San Francisco, where the first line opened in 1873. Although associated with San Francisco's steep hills, more than two dozen other U.S. cities, including relatively flat cities such as Chicago and New York, briefly employed this transit mode as a faster, more economical alternative to the horse- drawn streetcar. Most cable lines were converted to electric streetcar lines between 1895 and 1906 due to lower operating costs and greater reliability, but lines in San Francisco, Seattle, and Tacoma that were too steep for streetcars continued well into the 20th century (27). (a) Cable car (San Francisco) (b) Cable-hauled APM (Boston) Exhibit 2-13 Cable Car Examples Transit Modes Page 2-26 Chapter 2/Mode and Service Concepts
Cable-hauled automated people movers often use technology adapted from cable cars and aerial ropeways. The Staten Island Ferry carries more passengers per day than many rail lines. Transit Capacity and Quality of Service Manual, 3'd Edition Design San Francisco's cable cars are pulled along by continuous underground cables (wire ropes) that move at a constant speed of 9 mi/h (15 km/h). A grip mechanism on the car is lowered into a slot between the tracks to grab onto the cable and propel the car. The grip is released from the cable as needed for passenger stops, curves, and locations where other cables cross over the line. This system is not very efficient, as 55 to 75% of the energy used is lost to friction. However, cars can stop and start as needed, more or less independently of the other cars on the system, and a large number of cars can be carried by a small number of ropes (27). Relationship to Modern Automated People Movers Modern automated people movers (APMs) that use cable propulsion have retained many of the original cable car technological concepts, albeit in an improved form. Modern cable-hauled APMs often include gripping mechanisms and, in some cases, turntables at the end of the line. Some of these APMs can be accelerated to line speed out of each station, in a similar manner as detachable-grip aerial ropeways. Once at line speed, a grip on these APMs attaches to the haul rope, and the vehicle is moved at relatively high speed along the line. At the approach to the next station, the vehicle detaches from the rope, and mechanical systems brake the vehicle into the station. This technology addresses two of the major issues with the original cable cars: (a) having only two speeds, stop and line speed, which caused jerky, uncomfortable acceleration for passengers and (b) rope wear each time cars gripped the cable, as the cable slid briefly through the slower-moving grip before the grip took hold and caught up to the cable's speed. The airport shuttle at the Cincinnati-Northern Kentucky Airport is an example of a detachable-grip APM, while the Mystic Transit Center APM (Exhibit 2-13b) is an example of an APM with a permanently attached cable. FERRY TRANSIT Description and Applications Ferry transit provides a water connection between or among points where land routes are interrupted by water, and effectively forms part of the longer land route. Ferry services play a role in the transit systems of a number of North American cities, providing pedestrian, bicycle, and-in some cases-vehicle transport across waterways where transportation connections are desirable but conditions do not justify a bridge or tunnel, or where alternative bridges and tunnels are congested. The busiest ferry route in North America, New York's Staten Island Ferry, carries more passengers per day (65,000) than all but the busiest light rail and commuter rail lines, and more than many heavy rail lines (18). In addition, several private operators provide a variety of commuter services into Brooklyn and Manhattan, as well as special services to New York's major league baseball stadiums. Other services carry more modest numbers of passengers, but still play vital roles in their area's transportation system. Vancouver's SeaBus ferry, for example, operates high-speed vessels between North Vancouver and downtown Vancouver and connects to Vancouver's rapid transit, commuter rail, and bus systems. As of 2012, eight commuter-oriented passenger ferry routes operated on San Francisco Bay and twelve Chapter 2/Mode and Service Concepts Page 2-27 Transit Modes I
Transit Capacity and Quality of Service Manual, 3rd Edition routes with significant commuter ridership operated on Puget Sound. Many of the Puget Sound routes also carry vehicles, including King County Metro buses on one route. Internationally, ferries play an important role in providing cross-harbor transportation, as in Sydney and Hong Kong, and along rivers, as in Brisbane and London. Ferries offer flexible routing, subject only to dock availability, and services can be implemented relatively quickly. This adaptability has helped two metropolitan areas cope with emergencies in the past. For example, when the 1989 Lorna Prieta earthquake closed the Bay Bridge between Oakland and San Francisco for 1 month, new ferry routes from three East Bay communities were open within 1 week, with a fourth route open within 2 weeks. The combination of the four new routes, plus one existing route, carried an average of 20,000 passengers per weekday while the bridge was closed (28, 29). Following the World Trade Center attack in New York in 2001, new trans-Hudson ferry routes were opened to replace the lost capacity resulting from damage to the PATH heavy rail station at the World Trade Center. In the first 6 months following the attacks, trans-Hudson ferry ridership nearly doubled to 67,000 passengers per day (30). Service Types Many different types of ferry services exist, and the vessels used tend to be custom- built to meet the specific needs of the service to be operated. Considerations include passenger and vehicle demand, dock configurations, speed, and environmental issues (e.g., wake and exhaust). The TCQSM focuses on urban scheduled ferry transit services; however, other types of ferry services are described here for completeness. Urban Services Urban ferry services provide trips into or within major cities, and experience similar peaks in passenger demand as other urban transportation modes. Typical travel times range from a few minutes to 45 to 60 min, and service is often provided once per hour or more frequently. There are four major types of urban services: ⢠Point-to-point services, typical of most urban ferry services, crossing harbors or major rivers; ⢠Linear multiple-stop services, either along a river (e.g., the East River service in New York) or a waterfront; ⢠Circulators, with fixed routes but often not fixed schedules, that serve destinations around the edge of, or a designated portion of, a harbor or riverfront via a loop route; and ⢠Water taxis, which have fixed landing sites, but pick up passengers on demand, similar to a regular taxi service. Because ferries can only take passengers to the water's edge, intermodal transfers are usually required at one, and often, both ends of the ferry trip. Options for providing this transfer include park-and-ride lots; feeder bus service; roll-on, roll-offbus service (for auto ferries); and terminals located close to rail service (as in New York and San Francisco). Ferries have quickly provided needed capacity during emergencies. Some harbor circulator and multiple-stop services also call themselves "water taxis," although they operate on fixed routes and sometimes with fixed schedules. Transit Modes Page 2-28 Chapter 2/Mode and Service Concepts
Exhibit 2-14 Ferry Vessel Types Transit Capacity and Quality of Service Manual, 3'd Edition Coastal Services Coastal ferries provide intercity and interisland trips on salt water and large freshwater lakes, such as the Great Lakes. Travel times are typically in the range of one to a few hours, but can be fairly short for service to nearby islands, or more than 1 day (e.g., some of the Alaska Marine Highway routes) . Service frequencies range from several trips per day to one trip per week. Vehicles are often also transported on these ferries, in a roll-on, roll-off mode (or rarely, as cargo, in a lift-on, lift-off mode) . Rural Services Rural ferries cross rivers and narrow lakes in areas where traffic volumes do not justify constructing a bridge. Routes are short and are often operated on demand. Vessels tend to be small (a capacity of six to 12 automobiles is common). Walk-on passengers and bicycles are generally infrequent. Vessel Types Three main vessel types-monohulls, catamarans, and hovercraft-are used for ferry service, although only the first two of these (Exhibit 2-14) are currently used in North America (31) . (a) Monohull passenger ferry (San Francisco) (b) Monohull vehicle/passenger ferry (Seattle) (c) Catamaran passenger ferry (Vancouver) (d) Catamaran passenger ferry (San Francisco) Monohulls have a single hull. They tend to have lower operating and construction costs and are the most common ferry type; large passenger and vehicle ferries are often mono hulls. Several types of hulls are used: ⢠A displacement hull always rides in the water at the same waterline or depth in the water (i.e ., propulsion does not raise the hull) with the same freeboard Chapter 2/Mode and Service Concepts Page 2-29 Transit Modes I
Transit Capacity and Quality of Service Manual, 3'd Edition (height of the main deck above the water). This type of hull is appropriate for low-speed operation. ⢠A semi-planing hull is designed for somewhat higher speeds than a displacement hull. It provides a degree of dynamic lift that causes it to ride up the water and have somewhat greater freeboard. ⢠A planing hull is designed for even higher speeds, with enough dynamic lift to raise the hull significantly up in the water and provide still greater freeboard. The dynamic lifting effect reduces the power required to attain higher speeds; nevertheless, the required propulsion power increases rapidly with speed. Catamarans have two hulls connected by cross-structure, with passengers and vehicles (if any) mainly accommodated in the superstructure above. They provide relatively greater deck area and volume for their weight and generally enable higher speeds than monohulls for a given propulsive power. They can have better maneuverability and a shallower draft (distance from the waterline to the bottom of the keel) than mono hulls. An important characteristic is the height of the cross-deck above water, which reduces wave impacts. As with monohulls, catamarans can be designed with displacement, semi-planing, or planing hulls. Hovercraft are designed for high speed. They are raised entirely above the water surface by a cushion of pressurized air formed beneath it and enclosed by a flexible skirt all around. In exchange for the moderate power required to produce the cushion, the power required for forward movement is greatly reduced, and with sufficient power, high speeds can be attained. Since none of the craft is immersed in the water, an air propulsion system (air propellers) is required. Hovercraft are able to cross dry land and even clear small obstacles. They are useful as ferries where consistently deep-enough water is lacking or where sandbars must be crossed. They have high capital and operating costs as a result of their relative complexity and use ofless rugged materials and equipment. Transit Modes Page 2-30 Chapter 2/Mode and Service Concepts
One mile of street, roadway, or tracks with transit service in two directions equals two directional route miles (regardless of the actual number of routes operated over the section). A revenue mile is one mile operated by one transit vehicle while in passenger service. Transit Capacity and Quality of Service Manual, 3'd Edition 3. OPERATING ENVIRONMENTS This section introduces the different operating environments-or rights-of-way- that are used by the various public transit modes, followed by a discussion of their impacts on transit capacity, speed, and reliability. Capacity refers to how many transit vehicles can be operated over a particular section of roadway or track in an hour, speed refers to how fast the vehicles can operate, and reliability refers to how well the transit service can keep to its schedule. More precise definitions of these terms are given in Chapter 3, Operations Concepts. There are four types of operating environments discussed in this section: ⢠Mixed traffic-shared lane operation with general traffic; ⢠Semi-exclusive-a lane partially reserved for transit use, but also available for other use at certain times or in certain locations; ⢠Exclusive-a lane, portion of a roadway (e.g., the median), or right-of-way reserved for transit use at all times, but still subject to some external traffic interference (e.g., intersections, grade crossings); and ⢠Grade separated-a facility dedicated to the exclusive use of transit vehicles, without at-grade crossings. MIXED TRAFFIC In mixed-traffic operation, transit vehicles share their lanes with other vehicles-in particular, automobiles, trucks, and bicycles-using the same roadway. Transit vehicles are subject to the same kinds of traffic control (e.g., signals, signs) that other vehicles are subject to, although transit may be given preference at some locations. Transit vehicles are also subject to delays caused by turning vehicles, pedestrian crossings, high traffic volumes, parking activities, etc. Mixed-traffic operation is the most common operating scenario in North America for bus and trolleybus service, with more than 98% of directional route miles operated in mixed traffic in 2010 (1). Similar records are not kept for demand-responsive service, but the nature of the service, typically with flexible origins and destinations, requires that nearly all revenue miles occur in mixed traffic, even though demand-responsive vehicles may use exclusive lanes or facilities where these are provided for buses. Among rail modes, only streetcar and light rail can operate in mixed traffic and, in practice, only streetcar has significant amounts of operation in mixed traffic. Exhibit 2-15 illustrates bus and rail operations in mixed traffic. Chapter 2/Mode and Service Concepts Page 2-31 Operating Environments I
Transit Capacity and Quality of Service Manual, 3rd Edition (a) Bus (Los Angeles) (b) Streetcar (Portland) SEMI-EXCLUSIVE A semi-exclusive facility (Exhibit 2-16) is partially dedicated to transit use, but allows certain classes of vehicles to use the facility or allows general traffic use at specific locations or at certain times of the day. As with mixed-traffic facilities, semi- exclusive facilities are primarily used by the bus and streetcar modes. Examples include: ⢠Freeway managed lanes used by buses, and shared with carpools, automobiles that have paid a toll, or both; ⢠Bus lanes on urban streets that allow other vehicles to enter the lane to make right turns at intersections or driveways; ⢠Parking lanes that transform into bus-only lanes during peak periods. (a) Part-time bus lane (Seattle) (b) Bus lane allowing right turns (San Antonio) (c) Bus mall shared with bicycles (Minneapolis) (d) Light rail line with ped access (Portland) Exhibit 2-15 Mixed-Traffic Operation Illustrated Exhibit 2-16 Semi-exclusive Operation Illustrated Operating Environments Page 2-32 Chapter 2/Mode and Service Concepts
The dynamic envelope is the space that may be occupied by a rail vehicle due to, among other things, its lateral motion. Exhibit 2-17 Potential Enforcement Issues with Semi-exclusive and Exclusive Lanes Transit Capacity and Quality of Service Manual, 3'd Edition Restricting non-transit use of a facility to certain classes of vehicles-typically carpools, taxis, or bicycles-often reflects a political compromise, where priority is given to certain desired travel modes, with the intent to use the lane as efficiently as possible, without having too much effect on transit operations. Restricting general traffic use to specific locations (e.g., right turns) reflects a compromise on allocating roadway space among modes, with the result that transit service receives some preference, but not to the detriment of other modes. Restricting transit-only use to peak I periods gives transit priority when most needed to provide high levels of transit capacity and quality of service, and allows others to use the lane during lower-volume periods when transit can operate in mixed traffic without serious problems. The intent of each of these restrictions is to reduce or eliminate certain types of general traffic interference that can slow down transit service, make it less reliable, or reduce its capacity. For the bus mode, 2,173 directional route miles (representing 0.9% of the national total) were on semi-exclusive facilities in 2010 (1). Exhibit 2-16(a) represents an extreme case of trying to balance the use of a downtown lane: parking is allowed outside the peak periods of 6 to 9 a.m. and 3 to 6 p.m. weekdays, bicycles are allowed at all times, and general traffic right turns are allowed during the periods the lane operates as a bus lane. While better than nothing, the preference given to transit in this situation is not particularly high. Enforcement is an issue whenever semi-exclusive and exclusive transit facilities are accessible by other vehicles: ⢠Delivery trucks may park illegally in the lane (Exhibit 2-17[a]); ⢠Parked vehicles may encroach into a streetcar's dynamic envelope (Exhibit 2- 17[b ]); ⢠Parked vehicles may not be moved from the lane by the time a parking lane converts to a bus lane; ⢠Pedestrians may jaywalk across the facility; and ⢠Taxis or other unauthorized vehicles may use the lane illegally. Any of these issues can create unanticipated delays to transit vehicles that result in transit service running behind schedule. As most transit agencies do not have police powers themselves, a good working relationship with local police agencies is necessary to ensure that restrictions are enforced so that transit receives the intended priority. (a) Stopped delivery vehicle (New York) (b) Parking encroachment (Seattle) Chapter 2/Mode and Service Concepts Page 2-33 Operating Environments
Transit Capacity and Quality of Service Manual, 3rd Edition EXCLUSIVE Exclusive transit facilities (Exhibit 2-18) are reserved for the exclusive use of transit vehicles, but allow other travel modes to cross the facility at controlled locations. Examples of such facilities include: ⢠On-street lanes reserved for the exclusive use of transit vehicles at all times and locations; ⢠Bus lanes and light rail tracks in a street median, with vehicle access across the tracks limited to signalized intersections; ⢠Light rail and commuter rail operating on their own rights-of-way, with at-grade crossings provided where roadways cross the tracks; and ⢠Bus rapid transit operating on its own right-of-way, with traffic signals used to control at-grade crossings. (a) Transit mall (Denver) (b) BRT on private right-of-way (Los Angeles) (c) Light rail on private right-of-way (Los Angeles) (d) Light rail in street median (Los Angeles) Restricting facility use to transit vehicles eliminates many of the potential external factors that can interfere with transit operations, and allows transit preferential treatments (e.g., signal priority or preemption, grade crossings) to address most of the rest. As a result, exclusive facilities offer many of the benefits of fully grade-separated facilities at a significantly lower cost. Nevertheless, some issues can remain when exclusive facilities are used, mainly related to potential safety concerns (e.g., speed restrictions at signal-controlled intersections on busways, potential conflicts between left-turning vehicles and transit vehicles operating in a street median). In addition, particularly with exclusive transit lanes, unauthorized facility use or crossings can pose an enforcement challenge. Exhibit 2-18 Exclusive Transit Operation Illustrated Operating Environments Page 2-34 Chapter 2/Mode and Service Concepts
Exhibit 2-19 Grade-Separated Operation Illustrated Transit Capacity and Quality of Service Manual, 3'd Edition GRADE SEPARATED Grade-separated transit facilities (Exhibit 2-19) are reserved for the exclusive use of transit vehicles. All other travel modes (e.g., automobiles, pedestrians) cross over or under the facility. Delays due to traffic signals and potential conflicts with other traffic are eliminated, allowing higher-speed, more-reliable transit operations, but with significantly higher capital costs to construct. Examples of grade-separated facilities include: ⢠Facilities located at grade, where other modes cross over or under the facility; ⢠Below-grade facilities, such as subways and bus tunnels; and ⢠Elevated facilities. (a) Grade-separated busway (Brisbane) (b) Bus/light rail tunnel (Seattle) (c) Subway (New York) (d) Elevated tracks (Chicago) Chapter 2/Mode and Service Concepts Page 2-35 Operating Environments I
Transit Capacity and Quality of Service Manual, 3rd Edition 4. SERVICE PATTERNS FIXED ROUTE Fixed-route services are provided along a designated route and are operated at set times or headways. This section introduces the main types of stopping patterns and route network designs associated with fixed-route service and their impacts on passenger quality of service. More information is available in a number of sources (for example, 32-34). Stopping Patterns Exhibit 2-20 illustrates the main types of stopping patterns that can be offered along a fixed route. Although this exhibit shows different types of services sharing the same stop, it is also possible for operational or branding purposes to locate different services' stops close to each other, but in separate locations. Lower-volume stops Lower-volume stops Lower-volume stops BRT/Rapid/limited bus Local Express bus Park-and-ride Suburban transit center Major activity center Activity nade Transfer paint Activity nade Transfer paint Dawntown/ CBD A local route serves all stops along the route, emphasizing transit access over speed. It can be offered by any fixed-route mode. In small cities, "flag stops" may be used in lieu of designated bus stops, allowing passengers to be picked up and dropped off at any safe location upon request. As ridership increases, flag stop operation tends to create schedule reliability problems, as the effective stop spacing becomes very short (sometimes with stops at each end of a city block) and bus speeds become too slow to maintain the schedule. Flag stop operation can also be offered at night as a passenger security measure, allowing passengers to be dropped off closer to their destination. Limited Stop This type of service balances access with speed. Transit vehicles serve only high- volume stops (e.g., major destinations, transfer points), providing many passengers with a faster trip as a result of the fewer stops between passengers' origins and destinations. This type of service can also potentially be operated with fewer vehicles than a local service (offering lower operating costs), as a vehicle can complete a round trip faster, resulting in fewer vehicles needed to operate the route, compared with local service. BRT routes are frequently limited-stop routes. Limited-stop bus services can be offered in conjunction with local service on a street. Limited-stop rail service typically requires multiple-track corridors (as with New York's express subway lines) or-at a minimum and with potential scheduling difficulty-passing sidings within a corridor, such as at shared stations. Exhibit 2-20 Fixed-Route Stopping Patterns Illustrated Service Patterns Page 2-36 Chapter 2/Mode and Service Concepts
Transit Capacity and Quality of Service Manual, 3'd Edition Express Express services emphasize speed over access and are often used for longer- distance trips. Transit vehicles provide local service near the end points of the route (sometimes with only one pickup point, as with park-and-ride based commuter bus service) and operate non-stop over the majority of the route. As with limited-stop rail service, express rail service typically requires multiple-track corridors. A variant of express rail service can also be offered when only one track per direction exists. In this case, an express train leaves the starting point just before a local train and runs non- stop until it catches up to the local train in front, at which point it must serve all stops again as it cannot overtake the train in front. The ability to run non-stop on the line is a function of the headway-the shorter the headway, the shorter the distance between trains and the shorter the non-stop section will be. Route Network Designs Facility-based Designs The construction of a new transit facility-anything from bus lanes on an urban street to a new rail line-offers improved transit capacity, speed, and reliability characteristics that had not previously existed in the corridor served by the facility. It also provides an opportunity to consider changes to the broader bus network using or feeding the facility. As one source puts it, an approach focused on improving and branding a single route sends the message that this route provides better service, while an approach focused on improving and branding a facility sends the message that all routes on this facility provide better service (35). In outlying areas, a new facility can open opportunities to provide high-quality bus service to areas relatively remote from major destinations, as they allow a transit trip to be made in less time, particularly when combined with some form of express or limited- stop service. In downtown areas, a facility offers the opportunity to consolidate multiple services onto a single street. This improves the ease of understanding of the system to users (passengers know where to go to find transit service) and supports a greater level of infrastructure improvements than might otherwise be possible if only one route was affected. There are two main types of facility-based route designs: (a) trunk-and-branch and (b) feeder service, which are discussed in the following subsections. Trunk-and-Branch In a trunk-and-branch design, the bus or rail facility supports several transit lines on the inner portion of the facility. Moving out along the facility, individual lines branch off from the trunk to serve more localized market areas. The trunk portion provides a higher effective frequency than could be supported by an individual line within the corridor, which creates the potential for additional ridership generation as a result of the higher frequencies. The branches provide local, readily accessible service in the outer portions of the routes. They work well when a feeder route would already be full or nearly full when it reaches the corridor and when most of the passengers have destinations along the corridor. This pattern can also support an all-stops route that serves all stations along the corridor (35). Chapter 2/Mode and Service Concepts Page 2-37 Service Patterns I
Transit Capacity and Quality of Service Manual, 3rd Edition Exhibit 2-21 shows an example of this model in a light rail context. Three light rail lines from Portland's eastern suburbs and the region's airport converge into a trunk corridor that proceeds west toward downtown. The trunk receives more service than any of the branches-three times as frequent service, if each branch operates at the same headway as the others (not a requirement). This type of pattern is also used in light rail systems based on older streetcar systems, such as Boston, Philadelphia, and San Francisco, where multiple routes converge on underground light rail subways. Because light rail facilities are typically constructed with only one track in each direction, all trains operating on the trunk must serve all stations. In a rail context, this pattern also requires reliable operations on the branches, with trains entering the trunk at their scheduled time, so that following trains from other branches are not delayed. Source: TriMet. Exhibit 2-22 shows a trunk-and-branch design in a BRT context. Multiple bus services converge on BRT facilities in Brisbane. Because passing opportunities are provided at stations-in contrast to a light rail line-different stopping patterns can be used for different bus lines. Some lines operate non-stop to downtown (express), others serve major stations only (limited-stop), and some serve all stations (local). The speed and level of transit access offered on a given route can be better matched to the origins and destinations of that route's passengers. This model is also used, for example, on the Ottawa and Pittsburgh busway systems, and on the Columbia Pike corridor in Northern Virginia. Feeder In a feeder pattern, local transit routes bring passengers to a corridor served by a high-frequency bus or rail line. Passengers must transfer to continue their trip along the corridor, but do not have to wait long for connecting service on their inbound trip. In a rail corridor served by buses or other modes, this is the only possible model. In a bus facility context, feeder service can be appropriate where buses are not full when they arrive at the facility (the buses can be used more efficiently by keeping them within their local service area) or when smaller buses are used on the local route. Exhibit 2-21 Trunk-and-Branch LRT Route Design (Portland) Service Patterns Page 2-38 Chapter 2/Mode and Service Concepts
Transit Capacity and Quality of Service Manual, 3'd Edition Exhibit 2-22 Trunk-and-Branch BRT Route Design (Brisbane) CD ~ BUZ network map ~ t) TRANSLink Aspley Hypermarkel Horn Ad ChermsideWeSl John Goss Reserve Craigslea Stafford Heights Stafford Heights SOuth Stafford North Sparkes Hill O Aidertey BanksSt Chapel Hill Atkira Marshall lane Kenmore Churches Kenmore Central Misty Morn Railing Ground Park Diggers Rest OCAT 444 Grandview Ad MtCrosbyRd Sugars Ad Bellbowrie MontanusEast Kangaroo Gully BellbowrieChase Pioneer East Pioneer West Church Ad Moggill Source: Translink. Chapter 2/Mode and Service Concepts w., CityGiider Beaudesert Ad AlgesterEast Algester Ridgewood Parll Ridgewood Heights Browns Plains Greenbank ASL effective June 2012 Key - Route 100- Forest Lake to city - Route 111 -Eight Mile Plains to city - Route 120 - Garden City to clty - Route 130-Aigestertocity - Route 140- Browns Plains to city - Route 150- Browns Plains to city - Route 180- Mount Gravatt to city Route 196- New Farm (Merthyr) to city to Fairfield Gardens - Rou.te 199- New Farm (Teneri tfe Ferry) to c11y to West End Route 200- Cribb Ad East to city Route 222- Carindale to city - Route 333 - Chermside to city - Route 330- Bracken Ridge to City - Route 340 - Carseldine to Woolloongabba - Route 345- Asptey to city - Route 385 - The Gap to city - Route 412 - Stluciatocity - Route 444 - Moggill to city - CityGiider- West End to ci ty to Teneri ffe Ferry 0 Busstop CO Connecting bus stop E1 Busway station 0 Connecting train service I!) Connecting CityCaVCityForry sorvico Q Wheelchair access Oiagrammat ic map-nottoscale. Carindale cfJ Firmistoo Briclgnorth Belmont Primary School Winstanley East Kilmorey Greendale Carinctate Heights Cribb Ad Cribb Ad East 111 BUZ serv ices BUZ services are high frequency bus se rvices operating at least every 10 minutes in peak periods and at least every 15 minutes in oH-peak periods, seven days a week. @) translink.com.au © 1312 30 Page 2-39 Service Patterns I
Transit Capacity and Quality of Service Manual, 3'd Edition A variation of feeder service is a grid route network where, for example, a series of north-south routes intersect an east-west corridor. The north-south routes serve destinations along the street, as well as providing connections to the east-west corridor and to other east-west routes. Los Angeles' Orange Line BRT is example of local and rapid bus service feeding a trunk BRT line (Exhibit 2-23). The Orange Line itself is a feeder to the Red Line subway. 11110111 166-o- 344 -o-152 a 353 162-o- 163 244 243 242 L 750 Orange Line BRT Red Line subway I I I Commuter rail 741 240 236 237 236 237 750--- 158--- 761 734 656 234 233 158 230 Rapid bus line and number Local bus line and number Rail services typically rely on feeder bus service to some degree-less so for urban subway and AGT systems supplemented by surface bus routes and more so for light rail and commuter rail lines, particular in suburban areas. Many South American BRT systems use a feeder service pattern (36). System Design As discussed in more detail in Chapter 4, Quality of Service Concepts, planning transit service involves trade-offs between the area served by transit (service coverage), service frequency, and the time required to make a trip, given a fixed amount of resources for service. Except in the smallest communities, where a loop route can provide (slow, circuitous) service to all major origins and destinations, at least some- and often many-transit trips will require a transfer. The way that transfers are facilitated via the transit system design has quality of service implications. Common system designs in larger communities with multiple transit routes consist of (32-34): ⢠Radial networks, where all routes focus on the downtown area, due to its role as a major source of trip destinations and-often-its central location. Major corridors can be served with high-capacity transit routes. One-seat rides can be provided to downtown, as well as to selected other destinations when routes extend through and past downtown (interlining). Interlining can create schedule reliability problems on the outbound trip when the inbound trip is delayed, as Exhibit 2-23 BRT Feeder Service via Grid Network (Los Angeles) Examples of radial networks include Philadelphia's regional rail lines and the bus networks in Providence and Hartford. Service Patterns Page 2-40 Chapter 2/Mode and Service Concepts
Portland, Oregon is an example of a hybrid network. Edmonton and Omnitrans (San Bernardino area) are examples of hub-and- spoke networks. Chicago, Los Angeles, and Vancouver are examples of grid networks. Exhibit 2-24 Examples of Fixed- Route Networks Transit Capacity and Quality of Service Manual, 3rd Edition schedule recovery opportunities are only available at the outer ends of the route. All other trips with origins and destinations outside the central area require a transfer and a potentially out-of-direction trip through downtown. ⢠Hybrid networks overlay key crosstown routes that directly connect selected major non-downtown origins and destinations and provide connection opportunities to radial routes. Faster, more direct trips are possible for trips involving non-downtown locations. ⢠Hub-and-spoke networks focus local bus service around transit centers, where buses meet on a timed transfer (pulse) basis to transfer passengers, minimizing the time required to make a connection. Other, potentially high-capacity, routes connect transfer centers and the downtown to each other. This design offers relatively direct connections to a variety of locations within a region, but requires good reliability when local service is infrequent, so that passengers do not miss their connection. ⢠Grid networks provide frequent service along major streets and cover a large portion of the region. Many trips require a transfer, but transfer times are minimized due to the frequent service. Exhibit 2-24 illustrates these types of route networks. A region's network will often begin with a radial design when fixed-route service is introduced, but will evolve over many years into one of the other forms, if the region continues to grow. The region's growth provides new areas in which to operate fixed-route service and potentially greater resources for operating the service. (a) Radial (b) Hybrid (c) Hub-and-spoke (d) Grid Chapter 2/Mode and Service Concepts Page 2-41 Service Patterns I
Transit Capacity and Quality of Service Manual, 3'd Edition DEMAND RESPONSIVE DRT and its related flexible services are provided in response to a passenger request for a trip. DRT services-such as those discussed earlier in this chapter-provide flexible scheduling along with flexible routing within the constraints of the trip pattern (e.g., many-to-few) established for the service. Flexible transit services combine elements of DRT and fixed-route service. This section illustrates the types of trip patterns commonly used for DRT service, describes the service attributes of various flexible transit services, and gives examples of transit agency approaches to transitioning a service type to one providing more or less flexibility. DRT Trip Patterns DRT service can be operated using a variety of trip patterns, including many origins to many destinations, many origins to few destinations, few origins to many destinations, few origins to few destinations, and many origins to one destination. These trip patterns are illustrated in Exhibit 2-25: Many-to-Many Many-to-Few Few-to-Many Few-to-Few Flexible Transit Services Many-to-One 6, Origins ⢠Destinations Potential Trips Beyond the types of demand-responsive transit discussed earlier in this chapter, other DRT variants have evolved with service designs that build on the inherent flexibility of DRT but include elements of more traditional fixed-route and fixed- schedule transit to increase productivity. DRT Connector/Feeder Service Definition DRT connector, also referred to as "feeder" service, provides demand-responsive service within a defined zone that has one or more scheduled transfer points to fixed- route transit. The transfer points may be a bus stop for peak-period express or other bus service, or a rail station. The service is designed primarily to offer connections to Exhibit 2-25 Examples of DRT Trip Patterns Service Patterns Page 2-42 Chapter 2/Mode and Service Concepts
Transit Capacity and Quality of Service Manual, 3'd Edition the fixed-route network, but also provides local transportation within the defined zone. Generally, a large percentage of DRT connector trips begin or end at the designated transfer points. Performance data for several feeder services report productivity figures from about two to eight passenger trips per vehicle revenue hour (1 0). Applications Several large transit agencies, including those in Denver, Dallas, and San Diego, have implemented DRT connector services in low-density parts of their service areas to connect with fixed-route bus and light rail service. The transit agency in Denver, for example, provides DRT connector service -called Call 'n Ride-in 21 different defined parts of its large service area, ranging from a mountain community to office campus areas to old and new suburban developments. The Call 'n Ride service areas range from very small (2.2 mi2 or 5.7 km2) to considerably larger (10, 12, and 30 mi2, equivalent to 26, 31, and 78 km2). The agency's first DRT connector service replaced a poor- performing fixed-route bus service in 1999 that carried 1.6 passengers per hour at a $78.46 subsidy per passenger trip. One year after implementation, the Call 'n Ride replacement service served 4.3 passengers per hour for a subsidy of $9.84 per passenger trip. Based on data from 2011, the median Call 'n Ride productivity for an average weekday is 3.9 passenger trips per revenue hour (37). In Dallas, the transit agency initiated its first DRT zone-branded On-Call-in 1999 in areas where population density was too low to support fixed routes. As of 2012, there are eight On-Call zones. On-Call services are neighborhood circulators that also connect to Dallas Area Rapid Transit (DART) fixed-route or light rail services, depending on the zone. Passengers may board an On-Call transit vehicle at one of its regular stops, may book a curb-to-curb pickup in advance, or may call in on the same day of travel (usually at least an hour in advance) to request a pickup. On-Call vehicles operate flexible service during all service hours; during peak commute hours, each On-Call vehicle provides connector service only to and from local transit centers, while midday service also makes other regular stops at shopping centers, medical offices, grocery stores, and similar destinations (38). Potentia/Integration with ADA Paratransit For those transit agencies with DRT connector services, there is an opportunity to integrate the general public DRT service with required ADA para transit in the same service zone. If the two services are fully integrated, the agency does not provide ADA paratransit service as separate from the DRT service, allowing the transit agency to reduce service hours to serve the two rider groups. In such case, the effectiveness of the general public DRT service is measured by comparing the performance of the DRT service to the combined performance of both the fixed-route and ADA services operating concurrently in the same area. This is a positive consideration in favor of general public DRT service in low-density parts of a community as it can be an effective substitute for traditional fixed-route service and its required ADA paratransit in low density environments (10). Zone Routes Zone routes combine DRT service within defined zones along a corridor with scheduled departure and arrival times at one or more end points. This type of flexible Chapter 2/Mode and Service Concepts Page 2-43 Service Patterns I
Transit Capacity and Quality of Service Manual, 3rd Edition service is one of the least common. One application is in rural Washington State, where the service involves one trip per day that leaves the main small city in the county and provides drop-offs and pick-ups within a demand-response corridor that is defined by the road network and natural barriers. Most of the passengers are traveling to or from the small city (8). A more urban example is the nighttime service operated in Charleston, S.C. To serve suburban and some urban areas during lower-demand nighttime hours from 9:30p.m. to 1:00 a.m., the transit agency operates four flexible zone routes. The vehicles serving the four defined zones all meet at a designated downtown stop at scheduled times, and the routes take 60 to 90 min to operate, depending on the specific route. Riders can board at the downtown stop or make a reservation in advance for a pick-up at any established bus stop in the defined route/zone area. Drop-offs are at bus stops on an on- demand basis. The transit agency reports a productivity of three passenger trips per hour on its zone routes (9). This service is designed to provide coverage within lower- density areas during periods of lower demand. Point Deviation Point deviation service, also called checkpoint dial-a-ride, operates within a defined area or zone, providing demand responsive service as well as scheduled service to a limited number of designated stops, without any regular route between the stops. Point deviation services allow considerable time within their schedules for demand responsive trips because of the service design. The time allotted for DRT service for point deviation systems averages 30 min for each service hour (8). Reported productivities for point deviation service range from about 2.5 to 4 passenger trips per vehicle revenue hour. As one example, the transit agency in Oklahoma City uses point deviation service as a substitute for fixed-route service during night hours and Sundays in five zones of the city and for all-day service in one suburban area. The vehicles provide demand-responsive service within each zone, with a limited number of scheduled stops at fixed locations within each defined zone (8). Route Deviation Definition and Applications Also called flexible-route or flex-route service, route deviation is actually one of the less flexible DRT variants, sharing more with fixed-route service than with DRT. Route deviation vehicles operate along a regular route, with or without marked bus stops, and deviate off that route to serve demand-response trips within a zone around the route. The width of that zone, or extent of the deviation, may be precisely defined, for example 1/z mi, or it may be flexible. Formal deviations typically range from %to llfz mi. Less- formal deviation policies may allow the driver to deviate farther, particularly in very rural areas, with deviations of up to several miles or more allowed, assuming the driver maintains the route schedule. The number of deviations allowed depends on the schedule for the route and the extent of the deviation, although the service needs some limits so that travel times for riders boarding and alighting at bus stops are not overly long. Based on TCRP research on flexible services, the time allowed for deviation in schedules varied from 20 min each Service Patterns Page 2-44 Chapter 2/Mode and Service Concepts
Transit Capacity and Quality of Service Manual, 3'd Edition hour, which allows for considerable deviation capability, to only 2.5 min each hour, which gives very limited time for deviations (8). Route deviation is the most common of the DRT variants, often deployed in lower density and rural areas. According to 2009 Rural NTD data, close to 30 percent of rural transit systems operate route deviation services (11). Performance Performance data for route deviation shows a wide range of productivity, ranging from 2.5 to 20 passenger trips per revenue hour, with the high productivity systems providing very limited deviations from the route. Route deviation, as well as other DRT variants, can serve the general public as well as those who need more personalized service, eliminating or reducing the need to operate two separate services-fixed route and DRT. Where funding is very limited, operation of a combined service, such as route deviation, may be the only viable way to provide transit service in a community. ADA Requirements Route deviation is considered demand-responsive service according to the ADA and is not subject to the requirements for ADA complementary paratransit, as long as the service accepts route deviation requests from the general public. However, transit agencies operating such route deviation service do have to provide service to riders with disabilities that is equivalent to the service provided to other passengers, as defined by the ADA If deviations are limited to persons with disabilities, then the deviation service becomes the transit agency's ADA complementary paratransit and must meet the six ADA service criteria, including that the vehicles deviate at least% mile either side of the route, that fares for the deviation be no more than twice the base fare, and so forth. Flexible Route Segments Flexible route segment service is predominately fixed-route service but converts to DRT for a limited and defined portion of the route. For example, the Corpus Christi transit agency operates a route connecting two rural communities to downtown Corpus Christi. The route has one scheduled stop in one community and two in the second, and also provides demand-responsive service within each of the two communities. After its scheduled stops and any requested demand-responsive trips, the service heads to its terminus in Corpus Christi. This service is reversed for trips outbound from Corpus Christi (8). Research on flexible transit services found that that this type is not among those commonly in service. The limited data on performance report productivity at approximately 2.5 to 3 passenger trips per revenue hour (8). Request Stop Request stop service is predominately traditional fixed-route/fixed-schedule service but which also provides service to a limited number of defined stops close by the route at the request of a passenger. This is different from flag stop service in that the request stops are not directly on the route. In one application, the transit agency serves several stops only by passenger requests; these stops are major destinations with poor Chapter 2/Mode and Service Concepts Page 2-45 Service Patterns I
Transit Capacity and Quality of Service Manual, 3rd Edition pedestrian accessibility from the main transit route. The request stop flexibility allows the transit system to better serve those destinations, with more direct service for the riders. Request stop service may also be honored only during specific time periods, for example, during night service to provide the passenger direct access to the final destination. Productivity information for request stop service is limited, with data for one system, which reported approximately six passenger trips per revenue hour (8). Transitioning DRT to More or Less Flexibility As more and more DRT variants are placed into service, transit agencies need criteria or guidelines to determine when to consider implementation of flexible transit and when to transition to more, or less, flexibility in the type of transportation service offered. While research documenting these criteria is limited, the experiences of transit agencies that operate DRT variants provide insight and guidance for planning and transitioning among DRT and its variants. Three transit agencies that have implemented general public DRT and other flexible services as strategies to provide cost-effective transit in lower density areas are the Regional Transportation District (RTD) in Denver, DART, and King County Metro in Seattle. Examples of the types of flexible services implemented by the three agencies include the following: ⢠Zoned, neighborhood demand-responsive service for many-to-few trips within a limited service area, ⢠Feeder j connector service for many-to-one transit from residential areas to rail stations or transit centers, ⢠Point deviation with scheduled checkpoints, ⢠Route deviation (flexible routes), and ⢠Other hybrid services that reflect combinations ofDRT or DRT services blended with fixed route. King County Metro King County Metro emphasizes productive services to control costs. A key strategy to controlling Metro's cost is to develop and implement alternative public transportation, including demand-responsive services where land uses and travel demand patterns do not support fixed-route service. Metro uses two performance metrics to measure the transit performance of all its services: rides per platform hour and passenger miles per platform mile (platform hours and miles include service, layover, and deadhead-non-revenue-miles and hours). Fixed-route services that are in the bottom 25% of both measures become candidates for change that could include conversion to demand-responsive service. Metro service guidelines provide for variable routing where demand is dispersed and fixed route service is unlikely to be successful (40). Denver RTD Denver RTD has developed a family of transit services suited to a variety of travel markets. The goal of this approach is to match the type and level of service to the Service Patterns Page 2-46 Chapter 2/Mode and Service Concepts
Exhibit 2-26 DART Criteria for Fixed-Route and DRT Service Transit Capacity and Quality of Service Manual, 3'd Edition demand in a given service area, thus improving performance and sustainability. RTD operates a variety of DRT services. According to the RTD experience, DRT is not a service with a fixed capacity. Variations on DRT service can make it possible for a transit agency to carry more passengers for a specified amount of resources. Characteristics of RTD's approach include: ⢠The transit agency can maintain the initial level of service for many-to-many DRT and carry more passengers (improve productivity) as demand increases. ⢠If demand increases beyond the initial capacity (trip requests are turned away), the transit agency can add a vehicle to increase the level of service. ⢠At higher levels of demand, the transit agency can convert many-to-many DRT services to structured DRT or flex-route services with higher productivity. ⢠DRT services can also be blended with fixed-route operations via route segments that can deviate when needed. The RTD has shown that structured DRT is able to generate higher productivity than pure demand-responsive transit. RTD reports that most DRT services that are predominantly many-to-many achieve a productivity of 3 to 4.5 passenger trips per vehicle service hour. On the other hand, productivity for more structured services, such point deviation or flexible routes, can achieve 5 to 9 passenger trips per service hour (41). DART Dallas Area Rapid Transit (DART) strives to "right-size" service based on ridership. Exhibit 2-26 illustrates DART criteria to match transit mode to levels of productivity or riders per revenue hour. Mode Fixed-Route Transit Bus Fixed-Route Small Bus Flex-Route On-Call Demand Responsive Shared-Ride Taxi Ridership Demand level High Low to medium Moderate Insufficient ridership to support fixed-route Very sparse ridership that cannot be cost-effectively served through other modes Source: Dallas Area Rapid Transit {42). Typical Riders per Revenue Hour >20 10-20 5-12 3-7 <3 DART sponsors several flex-route services with an average productivity of 8 passengers per hour. When demand reaches 10 passengers per hour for three consecutive performance reporting periods (four reporting periods per year), the agency begins an analysis of the potential for converting the flex route to fixed route (42). Cost-effective flexible services balance efficiency and flexibility, using strategies that reduce the inefficiency of pure DRT service and typically limit the degree of pure DRT that is provided. As demand increases and the need for structure (defined bus stops, scheduled times, and greater frequency of service) increases, DRT variants transition toward more traditional fixed-route, fixed-schedule transit service. Chapter 2/Mode and Service Concepts Page 2-47 Service Patterns I
Transit Capacity and Quality of Service Manual, 3rd Edition 5. REFERENCES 1. American Public Transit Association. 2012 Public Transportation Fact Book. Appendix A: Historical Tables. Washington, D.C., March 2012. http: j jwww.apta.comjresources j statistics/Documents /FactBook/2 012-Fact-Book- Appendix-A.pdf 2. Federal Transit Administration. National Transit Summaries and Trends. National Transit Database 2010 Report Year. Washington, D.C., November 2 011. http:/ jwww.ntdprogram.gov jntdprogramjpubs/NTST /2010%20National%20Tran sit%20Summaries%20and%20Trends-Complete.pdf 3. King, R.D. TCRP Report41: New Designs and Operating Experiences with Low-Floor Buses. TRB, National Research Council, Washington, D.C., 1998. http:/ j onlinepubs.trb.org/ onlinepubsjtcrp jtcrp_rpt_ 41-a.pdf 4. Dawson, C. 2010 Public Transportation Vehicle Database. American Public Transit Association. Washington, D.C., June 2010. 5. Federal Transit Administration. National Transit Database Glossary. http:/ jwww.ntdprogram.gov jntdprogramjGlossary.htm, accessed July 16, 2012. 6. Ellis, E. and B. McCollum. TCRP Report 136: Guidebook for Rural Demand-Response Transportation: Measuring, Assessing, and Improving Performance. Transportation Research Board of the National Academies, Washington, D.C., 2009. http: I I onlinepu bs.trb.org/ onlinepubsjtcrp jtcrp_rpt_13 6. pdf 7. Kirby, R.F., K.U. Bhatt, M.A. Kemp, R.G. McGillivray, and M. Wohl. Paratransit, Neglected Options for Urban Mobility. The Urban Institute, Washington, D.C., 197 4. 8. Koffman, D. TCRP Synthesis 53: Operational Experiences with Flexible Transit Services. Transportation Research Board of the National Academies, Washington, D.C., 2004. http: I I onlinepubs.trb.org/ onlinepubsjtcrp jtcrp_syn_53. pdf 9. Potts, J., M. Marshall, E. Crockett, and J. Washington. TCRP Report 140: A Guide for Planning and Operating Flexible Public Transportation Services. Transportation Research Board of the National Academies, Washington, D.C., 2010. http: I I onlinepubs.trb.org/ onlinepubsjtcrp jtcrp_rpt_140. pdf 10. KFH Group, Inc.; Urbitran Associates, Inc.; McCollom Management Consulting, Inc.; and Cambridge Systematics, Inc. TCRP Report 124: Guidebook for Measuring, Assessing, and Improving Demand-Response Transportation. Transportation Research Board of the National Academies, Washington, D.C., 2008. http: I I onlinepubs.trb.org/ onlinepubsjtcrp jtcrp_rpt_124. pdf 11. Small Urban & Rural Transit Center. Rural Transit Fact Book, 2011. North Dakota State University, Fargo, N.D., 2011. http: j jwww.surtc.orgjtransitfactbook/ downloads /2 0 11_RuralTransitFactBook. pdf 12. Koffman, D., R. Weiner, A. Pfeiffer, and S. Chapman. Funding the Public Transportation Needs of an Aging Population. American Public Transportation Association, Washington, D.C., March 2010. http: I jwww.apta.comjresourcesjreportsand pu blications/Documents/TCRP _J 11_F unding_ Transit_N eeds_of_Aging_Population. pdf Links to the TCRP reports listed here can be found on the accompanying CD-ROM. References Page 2-48 Chapter 2/Mode and Service Concepts
Transit Capacity and Quality of Service Manual, 3'd Edition 13. Carini, S., L. Byala, S. Johnson, E. Randall, and L. Riegel. NCHRP Research Results Digest 354: A Review of Human Services Transportation Plans and Grant Programs. Transportation Research Board of the National Academies, Washington, D.C., July 2011. http:/ jonlinepubs.trb.orgjonlinepubsjnchrpjnchrp_rrd_354.pdf 14. Cervera, R. The Transit Metropolis: A Global Inquiry. Island Press, Washington, D.C., 1998. 15. AECOM Technical Services, Inc., and S.I. Engineering, P.C. Hudson County jitney I Study: Final Report. North Jersey Transportation Planning Authority, Newark, N.J., July 2011. http:/ jwww.njtpa.org/Plan/Studies/ documents/HudsonCountyJitneyStudyFi nalReport.pdf 16. City of Houston, Texas. Code of Ordinances, Chapter 46, Article VI, Jitneys. http:/ /library.municode.comjindex.aspx?clientid=10123, accessed July 17, 2012. 17. Atlantic City Jitney Association website, http:/ /jitneyac.comjabout.php, accessed July 17, 2012. 18. Federal Transit Administration. National Transit Database, 2010 data. Accessed via the Florida Transit Information System, http:j jwww.ftis.org, July 17, 2012. 19. American Public Transportation Association. Public Transportation Ridership Report, Fourth Quarter 2010. Washington, D.C., March 8, 2011. http:/ jwww.apta.comjresourcesjstatistics/Documents/Ridership/2010_q4_riders hip_APT A. pdf 20. Federal Transit Administration. Annual Report on Funding Recommendations: Fiscal Year 2013-Capital Investment and PaulS. Sarbanes Transit in Parks Programs. Washington, D.C., 2012. http:/ jwww.fta.dot.gov / documents/FY13_Annual_Report_main_text_1_30_12.pdf 21. Parkinson, T. and I. Fisher. TCRP Report 13: Rail Transit Capacity. TRB, National Research Council, Washington, D.C., 1996. http:// onlinepubs.trb.org/ onlinepubsjtcrp jtcrp_rpt_13-a. pdf 22. Lea+ Elliott. ACRP Report 37: Guidebook for Planning and Implementing Automated People Mover Systems at Airports. Transportation Research Board of the National Academies, Washington, D.C., 2010. http:/ jonlinepubs.trb.orgjonlinepubsjacrpjacrp_rpt_037.pdf 23. Kittelson & Associates, Inc.; KFH Group, Inc.; Parsons Brinckerhoff Quade & Douglass, Inc.; and K. Hunter-Zaworski. TCRP Report 100: Transit Capacity and Quality of Service Manual, 2nd Edition. Transportation Research Board of the National Academies, Washington, D.C., 2003. http:/ jwww.trb.org/Main/Blurbs/153590.aspx 24. Wuppertaler Stadtwerke AG website, http:/ jwww.schwebebahn.de/EN/mediajgeschichtejflashgeschichte.htm, accessed July 18, 2012. 25. The Monorail Society website, http:/ jwww.monorails.org/tmspages/Where.html, accessed July 18, 2012. Chapter 2/Mode and Service Concepts Page 2-49 References
Transit Capacity and Quality of Service Manual, 3rd Edition 26. Centre d'etudes sur les reseaux, les transports, l'urbanisme et les constructions publiques (CERTU). Aerial cableways as urban transport systems. Lyon, France, December 2011. http:/ jwww.certu.fr jfr j _Syst%C3%A8mes_de_transports- n26/IMG/pdfjcableways_MEDDL T _december2011-r2.pdfn 27. Hilton, G.W., The Cable Car in America, Revised Edition. Stanford University Press, Stanford, Calif., 1997. 28. Bay Area Council. Water Transit Initiative Action Plan, San Francisco, Calif., 1999. 29. Caltrans. Bay Area Commuter Guide. October 25, 1989. 30. Albano, J. The Effects of9j11 on Ferry Service in New York Harbor. Presented at the 2002 APTA Intermodal Operations Planning Workshop, Brooklyn, N.Y., August 2002. 31. Bruzzone, A. TCRP Report 152: Guidelines for Ferry Transportation Services. Transportation Research Board of the National Academies, Washington, D.C., 2012. http: I I onlinepubs.trb.org/ onlinepubsjtcrp jtcrp_rpt_152. pdf 32. Canadian Urban Transit Association. Canadian Transit Handbook, 3rd Edition. Toronto, Canada, 1985. 33. Boyle, D., J. Pappas, P. Boyle, B. Nelson, D. Sharfarz, and H. Benn. TCRP Report 135: Controlling System Costs: Basic and Advanced Scheduling Manuals and Contemporary Issues in Transit Scheduling. Transportation Research Board of the National Academies, Washington, D.C., 2009. http: I I onlinepu bs.trb.org/ onlinepubsjtcrp jtcrp_rpt_13 5. pdf 34. Walker, J. Human Transit. Island Press, Washington, D.C., 2012. 35. Hoffman, A. Advanced Network Planning for Bus Rapid Transit: The "Quickway" Model as a Modal Alternative to "Light Rail Lite." Report FTA-FL-26-7104.2007.4. Federal Transit Administration, Washington, D.C., February 2008. 36. Diaz, R.B. and D. Hinebaugh. Characteristics of Bus Rapid Transit for Decision-Making. Federal Transit Administration, Washington, D.C., February 2009. http:/ jwww.nbrti.orgjdocsjpdf/High%20Res%20CBRT%202009%20Update.pdf 37. Becker J. and R. Teal. Next Generation General Public Demand Responsive Transportation. Presented at the 90th Annual Transportation Research Board Annual Meeting, Washington, D.C., January 2011. 38. Higgins, L. and L. Cherrington. Experience with Flex Route Transit Service in Texas. Report 167148-1. Southwest Region University Transportation Center, September 2005. http:/ jswutc.tamu.edujpublicationsjtechnicalreports/16 7148-1.pdf 39. Burkhardt, J.E., D. Koffman, and G. Murray. TCRP Report 91: Economic Benefits of Coordinating Human Service Transportation and Transit Services. Transportation Research Board of the National Academies, Washington, D.C., 2008. http:/ jswutc.tamu.edujpublicationsjtechnicalreports/16 7148-l.pdf 40. E-mail correspondence from V. Obeso, Manager, Service Development, King County Metro, January 27, 2012. 41. Teal, R.F. and J.A. Becker. Business strategies and technology for access by transit in lower density environments. In Research in Transportation Business & Management 2, 2011, pp. 57-64. 42. E-mail correspondence from R. Smith, Service Planning, Dallas Area Rapid Transit, January 3, 2012. References Page 2-50 Chapter 2/Mode and Service Concepts
