
6
Data Availability and Quality
DESCRIPTION OF DATA IN THE MCMIS
The Behavior Analysis and Safety Improvement Category (BASIC) measures and percentile ranks are calculated using data on crashes, inspections, and violations collected and reported by the states and federal inspectors to the Federal Motor Carrier Safety Administration (FMCSA). They are combined with other information provided directly to FCMSA through the Unified Registration System (URS) and a form called the MCS-150, which carriers complete to register with the FMCSA. All of this information goes into the Motor Carrier Management Information System (MCMIS).
The MCMIS is made up of four component files, with information to enable linking each of the components. Extracts from MCMIS files can be used to create records containing each motor carrier’s demographic and safety characteristics. These four component files are
- The census file: Based on information collected from the URS and form MCS-150, this file includes, for each carrier: its estimated vehicle miles traveled; the number of trucks and buses owned, leased, and trip leased; power unit type (combination/motorcoach or straight trucks/other vehicle type) and some information on trailers; and the number of drivers employed and leased. The carriers are required to provide this information when a carrier is first registered as part of the URS, and must update the information every 2 years. Each motor carrier has a unique
-
U.S. Department of Transportation (DOT) number assigned to it, which is used to link the carrier file to other MCMIS files. The census file also includes noncarriers, such as brokers, shippers, and freight forwarders.
- The inspection file: The inspection file contains information on vehicle inspections conducted by state and federal inspectors. The information available includes the inspection date and location, and level of each inspection. (See Glossary for the six inspection levels.) Indicator variables also signify whether the inspection was the result of a crash, and whether a vehicle is transporting hazardous material. Each separate inspection is assigned a unique identification number to facilitate linkage.
- The violation file (a component of the inspection file): The violation file contains details of violations identified during inspections. Each violation is assigned a unique identification number. This file provides the following information for each violation: the DOT number for the vehicle, the violation code, and whether the violation was an out-of-service violation.
- The crash file: The crash file derives from police accident reports (PARs) that the states are responsible for collecting and reporting to FMCSA. The crash file contains data on commercial motor vehicles (CMVs) with a gross vehicle rating weight or gross combination weight rating greater than 10,000 pounds designed to transport nine or more people, including the driver. This includes a subset of information from PARS for all trucks and buses involved in a crash where there was either: (i) a fatality, (ii) a bodily injury to a person who immediately received medical treatment away from the scene, or (iii) at least one vehicle was towed away due to disabling damage. This file contains information on the time and date of the crash, the types of vehicles involved in the incident, counts of injuries and fatalities, whether vehicles were towed away, and whether a hazardous material was released during the crash, as well as a limited amount of other descriptive information.
It must be stressed that MCMIS is a database that draws on data supplied by the states, federal investigators, inspectors, and carriers to monitor motor carrier safety in the United States. MCMIS supports analysis of time, geography, and other trends and patterns involving large truck and bus crashes; roadside inspections disaggregated by motor carrier types; and violations. It is important to keep in mind the great deal of churn in the CMV industry, which leads to a substantial percentage of newly registered carriers each year and existing carriers going dormant, com-
TABLE 6-1 Distribution of Active Motor Carriers by Power Units and Equipment Type
| Power Units | Number | Percentage Distribution | Equipment Type | Number | Percentage Distribution |
|---|---|---|---|---|---|
| 1 | 251,456 | 46.3 | Straight trucks | 279,800 | 51.4 |
| 2 to 3 | 147,641 | 27.2 | Tractor-trailers | 316,768 | 58.2 |
| 4 to 5 | 50,382 | 9.3 | Motorcoaches | 5,724 | 1.1 |
| 6 to 10 | 43,705 | 8.0 | Hazmat | 15,747 | 2.9 |
| 11 to 15 | 16,422 | 3.0 | School buses | 3,320 | 0.6 |
| 16 to 20 | 9,037 | 1.7 | Vans | 10,674 | 2.0 |
| Greater than 20 | 24,715 | 4.5 | Limousines | 2,135 | 0.4 |
NOTE: Table based on November 28, 2013, to November 27, 2015, version of Motor Carrier Management Information System.
monly without notice. This means that the population of active carriers varies from one time period to the next, and therefore the current snapshot of data from MCMIS only pertains to the set of active motor carriers for this particular time period. Assessments of change over time almost necessarily involve somewhat different groups of carriers. We are basing our analysis of the MCMIS database on the November 27, 2015, version of MCMIS, which was provided to the panel by FMCSA and the Volpe National Transportation Systems Center.
Table 6-1 provides the distribution of active1 motor carriers by number of power units (vehicles with engines) and equipment type.2 As can be seen, the majority of motor carriers are single-truck enterprises. More than 73 percent of motor carriers operate three power units or fewer, and greater than 90 percent have 10 or fewer power units.
PREPARING MCMIS FOR USE IN SMS
Prior to calculating SMS measures, various filters are used on MCMIS to identify the subset of carriers to which SMS is applied, and to identify the subsets of inspections, violations, and crashes used. Table 6-2
___________________
1 Active motor carriers are those that have had an inspection, or a crash, or made insurance payments, registered as a carrier, or updated their information on form MCS-150, within the past 3 years.
2 Equipment type is not a mutually exclusive categorization as a motor carrier can have more than one type of equipment.
TABLE 6-2 Filters Applied to Motor Carrier Management Information System (MCMIS) Dataset Behavior Analysis and Safety Improvement Categories (BASICs) Percentiles for December 2015
| Number of Observations Removed | Number of Observations Remaining | |
|---|---|---|
| All Carriers in Census (MCMIS) | 2,708,148 | |
Remove carriers that
|
1,067,935 | 1,640,213 |
|
Remove blank rows in the file |
19 | 1,640,194 |
|
Remove carriers without recent activity |
760,859 | 879,335 |
|
Remove intrastate carriers |
332,994 | 546,341 |
|
Carriers Included in SMS |
546,341 | |
|
All Inspections (MCMIS) |
20,708,328 | |
|
Include only inspections that occurred in the past 24 months |
13,969,094 | 6,739,234 |
|
Include only inspections that have a DOT number listed |
541,298 | 6,197,936 |
|
Include only inspections matched to a carrier in the final carrier file |
141,144 | 6,056,792 |
|
Inspections Included in SMS |
6,056,792 | |
|
All Violations (MCMIS) |
38,503,050 | |
|
Violations wiped out by violation review process |
2,277 | 38,500,773 |
|
Violations caused by a crash |
206,753 | 38,294,020 |
|
Violations assigned to an intermodal equipment provider |
54,488 | 38,239,532 |
|
Violations not associated with an inspection that 1. occurred in the past 24 months and 2. was associated with an active carrier |
28,116,904 | 10,122,628 |
|
Violations not associated with any BASIC |
1,546,949 | 8,575,679 |
|
Violations assigned to a shipper |
302 | 8,575,377 |
|
Violations in an inspection not relevant to the BASIC of that violation |
103,431 | 8,471,946 |
|
Violations from a postcrash inspection, and “unsure” if violation was postcrash |
4,173 | 8,467,773 |
|
Duplicate violations |
1,112,558 | 7,355,215 |
|
Violations Included in SMS |
7,355,215 | |
|
All Crashes (MCMIS) |
3,022,849 | |
|
Include only crashes that occurred in the past 24 months |
2,710,259 | 312,590 |
|
Include only crashes with a DOT number listed |
75,399 | 237,191 |
|
Include only crashes matched to an active carrier |
10,432 | 226,759 |
|
Remove duplicate crashes for the same carrier |
896 | 225,863 |
|
Crashes Included in SMS |
225,863 |
| Number of Observations Removed | Number of Observations Remaining | |
|---|---|---|
|
Carriers Assigned at Minimum One BASIC Measure |
487,885 |
NOTES: Table based on November 28, 2013, to November 27, 2015, version of Motor Carrier Management Information System. SMS, Safety Measurement System; DOT, U.S. Department of Transportation.
describes the steps used to filter these four files into the subset on which the BASIC measures are based.
First, as mentioned, the initial MCMIS files have a substantial number of carriers that have had no indication of active operations for a long while. These carriers have not had any inspections or crashes, made insurance filings, or updated their information on the MCS-150 for 3 years. MCMIS is not purged of such information because it is an administrative database, which is intended to contain information on all carriers that have registered with FMCSA. Second, BASIC measures are only calculated for motor carriers that have had enough activity of inspections, violations, or crashes during the past 2 years, which, as seen in Table 6-2, is a more restricted filtering. After intrastate nonhazardous materials carriers are removed, the remaining carriers for that particular data snapshot of MCMIS make up the set of active carriers to which SMS is applied. In addition, different data sufficiency standards have to be met before a carrier has an SMS score for a given BASIC, and the set of carriers that have sufficient data for one BASIC is not necessarily the same set of carriers that has sufficient data for another BASIC. Inspections are filtered as follows: FMCSA includes them if they occurred during the past 2 years, if there is a DOT number for the carrier involved, and if the DOT number matches to an active carrier. This reduces the number of inspections by about two-thirds. Roughly speaking, the data sufficiency standards reduce the number of carriers for which BASICs are computed to about 190,000.
Filters are also applied to violation data. FMCSA excludes violations caused due to involvement in a crash (such as broken headlights from a crash) or assigned to another entity such as a shipper or an intermodal equipment provider (such as moving a freight container to a ship). Further, FMCSA excludes violations that did not occur during the past 2 years, were not associated with a BASIC, were not linked to an active carrier, or were duplicate, which reduces the number of violations used in SMS by about 80 percent (mainly due to time duration).
MCMIS DATA QUALITY
Information on Exposure
The number of crashes motor carriers have is highly correlated with the amount of the carriers’ exposure, where exposure is a measure of all trips taken by a carrier’s vehicles. Exposure is certainly a function of how far a carrier’s vehicles have traveled, since a carrier whose trucks or buses travel twice as far as the trucks and buses for another carrier would be expected to have twice as many crashes, everything else being equal. Exposure, which is essential to calculating crash risk, should also be sensitive to the measurable contributing factors in crashes such as the road type and surface conditions, visibility, day or night, congestion, and others, which if available would also be taken into consideration. However, these factors are not collected in MCMIS, in part because they would be very difficult to collect, and in some cases, are not feasible to collect reliably. Were they collected, especially on a trip-by-trip basis, it would be possible to calculate exposure that was specific to the routes, times, and seasons driven by vehicles under the control of each motor carrier, and crash risk could be more accurately estimated for each carrier. To do so would require much greater detail in the data reported by motor carriers than what is available in MCMIS, and therefore, making use of this expanded view of exposure is currently not feasible.
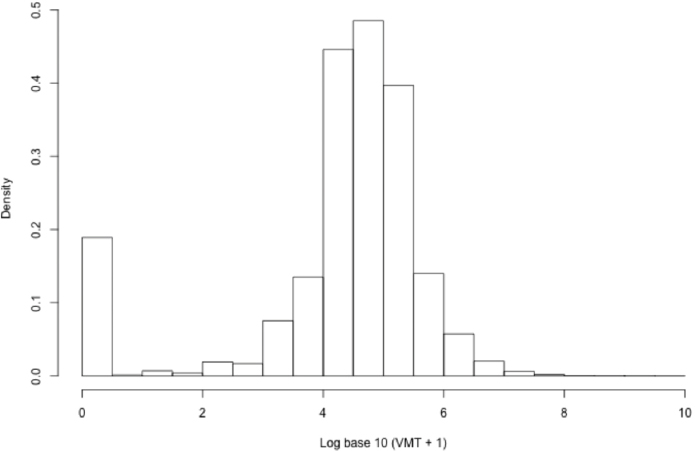
Limiting exposure to an assessment of the length of all trips, in MCMIS, the two most commonly used variables for exposure by FMCSA in SMS are vehicle miles traveled (VMT) and average power units (APU) times a utilization factor. VMT is the total number of miles traveled by all vehicles managed by a motor carrier, while the number of power units is the number of non-trailer vehicles managed by the carrier. APU is an average of the number of power units a carrier has currently, 6 months ago, and 18 months ago (if updated by the carrier during the 2-year window).
The Utilization factor is an adjustment for carriers with high (above average) use of their trucks, measured by VMT per PU, which attempts to prevent such operations being overly identified in the Unsafe Driver and Crash Indicator BASICs. Utilization factor is defined as follows. For combination trucks, for VMT per PU less than 80,000 (e.g., carriers at or below average utilization in segment) or greater than 200,000, no correction is applied and the utilization factor is set to 1. For VMT per PU between 80,000 and 160,000, the utilization factor increases linearly from 1 to 1.6. Between 160,000 and 200,000 VMT, the utilization factor, instead of remaining linear, is truncated at 1.6, the value for 160,000. In a sense, VMTs greater than 200,000 are not considered trustworthy and so the uti-
lization factor is set to 1. VMT per PU values between 160,000 and 200,000 are treated as if they were equal to 160,000, and values between 80,000 and 160,000 are treated as useful indicators of the VMT for a carrier, and so utilization factor is a linear function of VMT when it is between those values. Similarly, for straight trucks, the utilization factor for carriers with VMT less than 20,000 (e.g., carriers at or below average utilization in segment) and greater than 200,000 is 1; between 20,000 and 60,000 the utilization factor is a linear function from 1 to 3; and between 60,000 and 200,000, utilization factor, instead of remaining linear, is truncated at 3. So, again in a sense, values greater than 200,000 are not trusted.
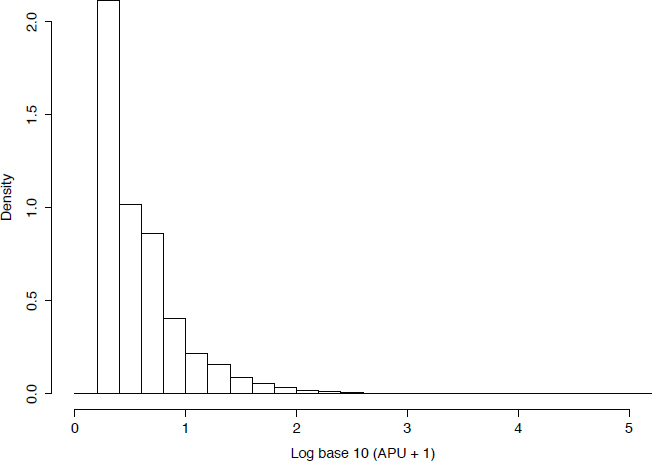
Total VMT and number of power units are reported by motor carriers when they fill out the Form MCS-150 (or the URS), and this information is required to be updated at least biennially. Figure 6-1 shows that the distribution of VMT for recently active carriers is skewed with a long right tail. Also, 7.8 percent of carriers fail to report VMT during the 2-year period and 5.1 percent report zero. While zero can be a valid score if the carrier is a leasing firm and does not operate trucks itself, it would be useful to provide such carriers with a way of indicating this information so they can be separately treated by SMS. The distribution of APU is also highly skewed, but only 0.5 percent of carriers report zero, and only 0.05 percent fail to report (see Figure 6-2).
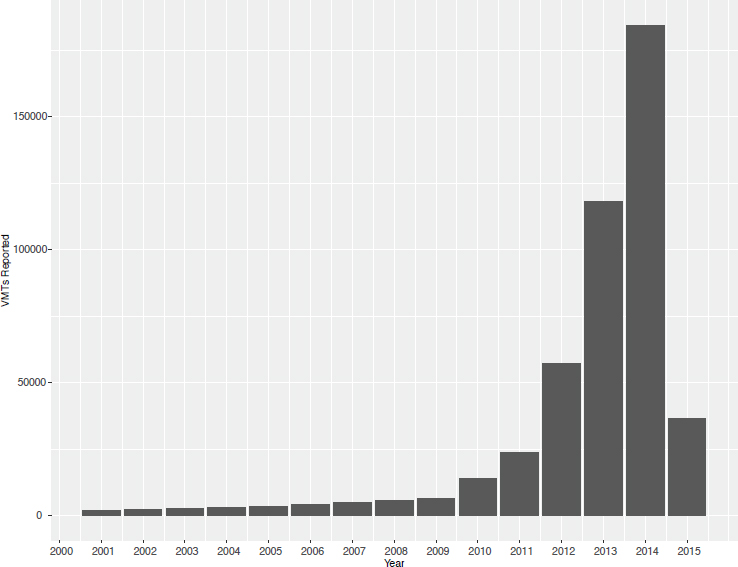
The timeliness of VMT data is a concern, as seen in Figure 6-3, which shows the frequency distribution of VMT by its reported year. While a majority of motor carriers do update their exposure information, a large number of carriers fail to do so.
For two of the BASIC measures, Crash Indicator and Unsafe Driving, the denominator is a measure of exposure of a motor carrier. If the denominator is not of high quality, those two BASIC measures will be a poor measure of a carrier’s safety performance. The lack of updated and high-quality exposure information can clearly bias the results.
We carried out an analysis of the differences between VMT from the MCS-150 and the VMT from investigations (MCS-151), which would likely be of much higher quality. There were substantial differences between the two, but this analysis was deficient since we could not tell the precise time period for each entry. Therefore, we mention it is suggestive, but not definitive, that the MCS-150 information is not of high quality.
Estimates of Prevalence of Safety Inspections
Between November 27, 2013, and November 26, 2015, roadside inspections were conducted on 332,271 motor carriers, out of the total of 546,341 active carriers during this time period. So, only about 61 percent of active carriers were inspected during the 2-year period. Acknowledg-
NOTE: Figure based on November 28, 2013, to November 27, 2015, version of the Motor Carrier Management Information System.
NOTE: Figure based on November 28, 2013, to November 27, 2015, version of the Motor Carrier Management Information System.
NOTE: Figure based on November 28, 2013, to November 27, 2015, version of the Motor Carrier Management Information System.
ing the infrequency of crashes, this means that MCMIS has no information on which to base an assessment of the safety performance for about 40 percent of active carriers.
We point out that 51 percent of inspections conducted were clean, meaning that there were no violations recorded (which given the earlier mention of failure to report clean inspections, is likely an underestimate). Table 6-3 demonstrates considerable variability in the frequency of clean inspections across inspection levels. (See the Glossary for a description of the inspection levels.)
Distribution of Violations
Out of the total of 899 possible violations, 790 of them occurred during the period November 27, 2013, to November 26, 2015. Some violations were recorded more frequently than others. Table 6-4 shows the top 20 most frequently recorded violations.
TABLE 6-3 Distribution of Inspections and Clean Inspections by Inspection Level
| Inspection Level | Volume | Frequency | Percentage of Clean Inspections |
|---|---|---|---|
| Full Inspection (=1) | 1,680,683 | .31 | 38 |
| Walk Around Inspection (=2) | 1,829,943 | .33 | 43 |
| Driver Only Inspection (=3) | 1,845,840 | .34 | 70 |
| Special Inspection (=4) | NA | NA | NA |
| Terminal Inspection (=5) | 102,629 | .02 | 73 |
| Radioactive Inspection (=6) | 754 | .00 | 97 |
NOTE: Figure is based on November 27, 2013, to November 26, 2015, version of Motor Carrier Management Information System. Also, level IV inspections are not used in Safety Measurement System.
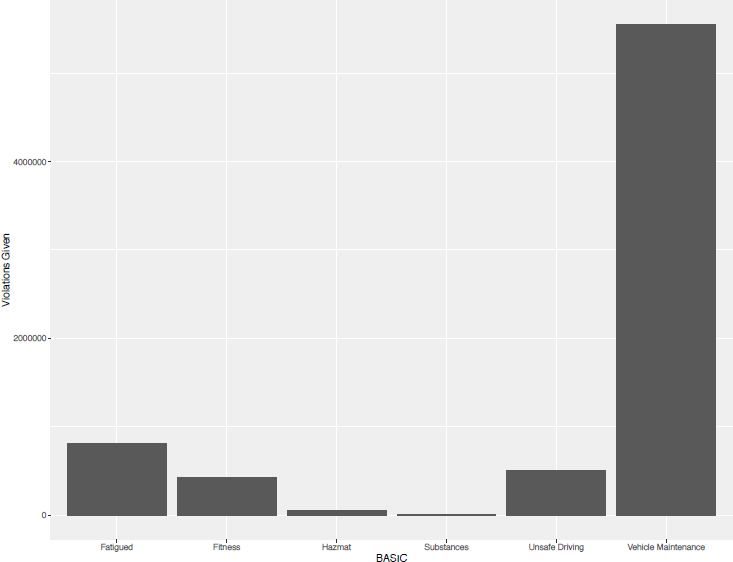
As noted, SMS groups the 899 violations into six BASIC categories. Looking at the distribution of violations by BASIC category shows that Vehicle Maintenance violations are the ones most frequently cited. Figure 6-4 provides the frequency distribution of violations by BASIC categories.
NEEDED IMPROVEMENTS TO MCMIS TO SUPPORT SMS
It is important to reiterate that the collection and hence the quality of MCMIS data is not unilaterally controlled by FMCSA. However, FMCSA does have some influence over this data collection, and in fact, its efforts have resulted in important improvements to the quality and timeliness of the data collected over the past several years. For example, FMCSA has a continuing program to measure certain aspects of data quality and publish the results (e.g., through a ranking of states by reporting timeliness, completeness, and other factors). This includes the State Safety Data Quality (SSDQ) program; the Data Qs program, which allows carriers to request and track requested corrections; and the Safety Data Improvement Program (SaDIP).
The goal of this section of our report is to encourage FMCSA to continue in its efforts, but also to provide additional focus as to which elements are in most need of improved quality, knowing any effort to improve data quality will necessarily involve collaboration with the states and other organizations, such as CVSA. The following are, in the panel’s
TABLE 6-4 Top 20 Violations from Level 1 (full) Inspections
| Violation | BASIC | Count | Percent | |
|---|---|---|---|---|
| 1 | Inoperative required lamps | Vehicle Maintenance |
285,456 | 8.4 |
| 2 | Log violation general/form and manner | Fatigued | 117,301 | 3.5 |
| 3 | Inspection/repair and maintenance parts and accessories | Vehicle Maintenance |
108,173 | 3.2 |
| 4 | Non-English-speaking driver | Fitness | 107,215 | 3.2 |
| 5 | Oil and/or grease leak | Vehicle Maintenance |
106,331 | 3.1 |
| 6 | Tire other tread depth less than 2/32 of inch | Vehicle Maintenance |
102,121 | 3.0 |
| 7 | Clamp/rotochamber type brakes out of adjustment | Vehicle Maintenance |
103,567 | 3.0 |
| 8 | No/discharged/unsecured fire extinguisher | Vehicle Maintenance |
91,579 | 2.7 |
| 9 | Driver’s record of duty status not current | Fatigued | 88,871 | 2.6 |
| 10 | Failing to secure brake hose/tubing against mechanical damag . . . | Vehicle Maintenance | 83,265 | 2.5 |
| 11 | Automatic brake adjuster CMV manufactured on or after 10/20/ . . . | Vehicle Maintenance |
74,089 | 2.2 |
| 12 | Inoperative turn signal | Vehicle Maintenance |
71,072 | 2.1 |
| 13 | Driving beyond 8 hour limit since the end of the last off du . . . | Fatigued | 68,566 | 2.0 |
| 14 | No/defective lighting devices/reflective devices/projected | Vehicle Maintenance |
68,169 | 2.0 |
| 15 | Operating a CMV without periodic inspection | Vehicle Maintenance |
64,477 | 1.9 |
| 16 | State/local laws speeding 6-10 miles per hour over the speed . . . | Unsafe Driving | 62,146 | 1.8 |
| 17 | Windshield wipers inoperative/defective | Vehicle Maintenance |
58,913 | 1.7 |
| Violation | BASIC | Count | Percent | |
|---|---|---|---|---|
| 18 | ABS malfunctioning lamps towed CMV manufactured on or after . . . | Vehicle Maintenance |
50,710 | 1.5 |
| 19 | Inoperative head lamps | Vehicle Maintenance |
44,977 | 1.3 |
| 20 | Brakes general | Vehicle Maintenance |
44,512 | 1.3 |
NOTES: Percent is percentage of all violations from level 1 inspections (a total of 1,680,683 inspections). CMV, commercial motor vehicle.
NOTE: Figure based on November 28, 2013, to November 27, 2015, version of the Motor Carrier Management Information System.
view, the MCMIS variables that need to be collected with higher quality in order for MCMIS to better support SMS.
Better Measures of Exposure
The numerator of SMS’s Crash Indicator BASIC score is the time and severity weighted number of crashes a carrier has experienced in the previous 2-year period. This numerator must be normalized through use of a denominator that is an estimate of the exposure to crashes to provide a statistic that can be compared across carriers. It is typical to use the number of VMT as an exposure estimate, which would result in a statistic of time and severity weighted crashes per mile. As its measure of exposure, FMCSA uses APU multiplied by a utilization factor, which is a function of VMT that tries to reduce the impact of discrepant values (see Appendix B for details). The Unsafe Driving BASIC uses the same denominator, since VMT is a reasonable way to normalize the numerator of the number of severity and time weighted violations for that BASIC.
Unfortunately, because the current estimates of VMT are not considered to be of high quality, the Crash Indicator and the Unsafe Driving BASIC measures could be substantially flawed depending on the specific quality of VMT and of APU reported by individual carriers. A 10 percent error in the denominator would translate to a 10 percent error for the score, which in turn could have a large impact on a carrier’s percentile rank. Thus there may even be incentives for self-reporting incorrect data.
Therefore, it is important that FMCSA has access to an estimate of higher-quality VMT estimates than the existing estimates. This might mean exerting greater pressure on carriers to report APU and VMT more often, maybe annually, and possibly by fining carriers that either fail to respond or are found to intentionally misrespond (possibly as a result of an investigation). With the advent of electronic log books, it is at least worth exploring the possibility of automated reporting of mileage without relying on motor carrier self-reports, although this idea would face considerable pushback from the industry despite its potential for improving the accuracy of safety ratings.
Further, if possible, data on two other important factors that are known to impact crash risk should be collected and incorporated into the exposure variable (which could be done using statistical models). We believe the great majority of carriers can disaggregate their VMT by month and state, and this could be collected through an expansion of the data request on the MCS-150. By acquiring this information, the result could be a better measure of exposure that would reflect the fact that different states in different months are more or less safe to drive in. Again, this data should be obtainable electronically; however, there would be
considerable pushback from the industry against sharing detailed trip-level data with the government.
Better Data on Crashes
Research by Blower and Matteson (2003a, 2003b, 2004) and Matteson and Blower (2005) has shown the MCMIS crash file, in the early 2000s, missed between 15 to 30 percent of crashes, depending on the state. Especially if there is a strong differential aspect to these missing crashes, for instance if the missing crashes are disproportionately those from particular states, the carriers that drive through those states more or less often will have measures that are lower or higher than they should be. The research also showed that missing crashes were related to truck size and type and crash severity. This could result in a bias against carriers with specific types of operations. To combat this, FMCSA should be more aggressive in encouraging all states to find out which crashes are omitted from MCMIS and to determine ways to reduce the degree of missingness. The SaDIP program is aimed specifically at improving the completeness of crash reporting at the state level through grant funding tied to specific data improvement projects proposed by the states.
Further, police officers provide additional data. They record details on the state crash report form, such as dozens of detailed data elements, crash sketches, and crash narratives, which could add to the current information on MCMIS as to what happened and contributory factors. A major complication is that what police officers provide differs by state. The Model Minimum Uniform Crash Criteria (MMUCC: http://www.mmucc.us/) is a voluntary guideline for crash data element definitions suitable for states to use in designing police crash reports (PCRs) and statewide crash databases. The current version is MMUCC’s 4th edition, but a 5th edition is in preparation and will be published in 2017. MMUCC is a joint product of the National Highway Traffic Safety Administration (NHTSA) and the Governors’ Highway Safety Association (GHSA). Relevant standards and data element definitions are found in the American National Standards Institute (ANSI) D16.1 Manual on Classification of Accidents (also due for an updated release in 2017) and the Fatality Analysis Reporting System (FARS). MMUCC, ANSI D16.1, and FARS have been coordinated in recent editions so that they share definitions for common data elements as far as is practical. The MCMIS crash data element definitions and attributes have been incorporated into the MMUCC data element definitions related to CMVs so that the two are closely aligned.
MMUCC is divided into sections corresponding to the data elements that describe the entire crash (date, time, location, environmental contributing circumstances, weather, etc.), the vehicles, and the people (drivers,
other occupants, and nonoccupants) involved in crashes. As of the 5th edition, the data elements are grouped by crash, vehicle, driver, occupants, nonoccupants, fatality-specific, and commercial motor vehicle–specific. MMUCC is intended as a minimum; it is the recommended set of data elements that need to be collected on every crash (as relevant to the circumstances, involved vehicle types, and severity of the crash). States are encouraged to adopt the MMUCC data element definitions and to add more data elements that they need for their own purposes.
There is no national summary of the level of MMUCC compatibility showing the results for each state. NHTSA offers a free-to-states mapping comparison of the state’s PCR and crash database contents to the MMUCC guideline. States are not required to adopt the MMUCC guideline, nor are they required to assess the agreement between their crash data and the MMUCC guideline. However, NHTSA manages traffic records improvement grants (referred to as 405c grants), eligibility for which requires states to address MMUCC compatibility. Traffic Records Assessments, conducted by NHTSA on a 5-year cycle in all states, address MMUCC compatibility based on data quality measurement of uniformity. The assessments also review each state’s strategic plan for traffic records improvement, which is an opportunity for the state to report plans to update its PAR and crash database, potentially adopting additional MMUCC data element definitions in the process.
Over time, more states are adopting more MMUCC data element definitions. In recent years, several states have moved to near-complete implementation of the MMUCC guideline. Part of the benefit of such adoption for states is that they can save time and money when they are revising their PAR and crash system database by adopting the already-defined MMUCC elements. There is a much larger benefit at the national level. When states adopt MMUCC data element definitions, NHTSA and others can combine data across states and use the larger dataset to examine the circumstances contributing to crash frequency and severity. The shared data element definitions make it far easier to develop a merged dataset including multiple states’ data. This facilitates comparisons among states and helps increase the effectiveness of data analyses.
For SMS, if states were to adopt the MMUCC data element definitions, it would be much easier for FMCSA to expand its database to include the information not already in MCMIS. This would help FMCSA and others characterize CMV-involved crashes based on the expanded information about noncommercial vehicles and their drivers, expanded lists of contributing circumstances, detailed information about the location, and more. In particular, if FMCSA is interested in downweighting crashes for nonpreventability, this information could help to make such assessments. Further, a MCMIS crash file that included all variables in
the MMUCC would permit a much richer evaluation of truck and bus safety than the very limited current number of variables in MCMIS, so that MCMIS could become a more useful CMV safety research dataset.
FMCSA has the option to try to add more data elements to MCMIS. In the absence of widespread adoption of MMUCC by states, the job of adding data elements from state PCRs and crash databases is complicated by the fact that each state has a unique set of data definitions. To bring the appropriate data into MCMIS would require translation between the state data definitions and those implemented in MMUCC for those extra data elements. (To capture police sketches, more states are going to electronic PCRs, and in theory, sketches and officers’ narratives could be obtained from those that gather and store them electronically.) With widespread MMUCC adoption, this process becomes much easier, assuming MCMIS adopts the MMUCC data element definitions for the to-be-added elements. Information would not require special data collection from motor carriers, but would require translation from multiple states’ unique crash database definitions into a standard dataset applicable to all.
The panel believes that FMCSA (and its partners in NHTSA and FHWA) should strongly encourage the states to increase their level of compatibility with MMUCC through various means including grants, partnerships, and guidance.
Better Data on Violations and Severity Weights
As mentioned earlier, there remains some degree of ambiguity about how to represent the specific violations identified during an inspection. Two examples are given here, but many more could be provided.3 First, assume during the winter, a CMV slides off the road because the driver was driving too fast for conditions. This action can be cited in multiple ways. In many states, driving too fast for conditions is a subset of the speeding statute. It could be listed as violation 392.2, which is a local law violation with a severity weight of zero; as violation 392.25, which is speeding/speeding related with a severity weight of 1; or as violation 392.14, which is failing to use caution for hazardous conditions with a severity weight of 5.
Second, consider a driver who does not have his or her medical card. This action can be cited as a 383.23(a)(2) for operating a CMV without a commercial driver’s license, which has 8 severity points. It can also be cited three different ways using 383.51 for driving while disqualified or suspended, which has a severity weight of between 1 and 8, or it can be
___________________
3 We thank Collin Mooney for his help in formulating these examples.
cited as a violation number 383.71H for failing to submit medical documentation as required, which has a severity weight of 1.
This ambiguity as to how to score violations is a source of noise in the system, because these different ways of representing the same situation are associated with substantially different severity weights. The variability has nothing to do with the safety performance of a carrier; it results from inspector variance. Therefore, the resulting measures, especially for small carriers, can depend on which inspector was involved and how they decided to code violations.
This situation could be alleviated in two ways. First, inspectors use various software tools to translate their notes into objective codes. These software tools are quite different and as yet there is no standardization. Therefore, some way of requiring these tools to behave alike when faced with various circumstances would be extremely helpful. In addition, FMCSA and CVSA should revisit the entire coding system to look for ways to make clearer how to code various violations.
Finally, in addition to situations where severity weights can differ for the same action, the attribution of severity weights to separate violations might be capable of improvement. Looking at which violations receive higher and lower severity weights, some violations seem more severe but receive what seem to us to be smaller severity weights, and vice versa. Therefore, FMCSA would benefit from subject-matter experts reviewing the severity weights to see whether they are internally consistent in this sense. (By internal consistency, we mean that severity weights, within a BASIC, across violations must be ranked in a way that strongly correlates with the subject-matter expertise as to the degree to which a violation rate would be expected to be related to future crashes.) More importantly, FMCSA should use MCMIS data to see whether severity weights can be quantified on a more empirical basis. (We note that the new approach to SMS described in Chapter 4 will automatically provide a mechanism for revising severity weights over time.)
Better Data on Clean Inspections
While it is not clear the degree to which the problem persists, there was evidence from the American Transportation Research Institute (2014) that clean inspections are often not reported. Obviously, since the BASICs are weighted frequencies of violations, an unreported clean inspection results in the associated carrier having a higher score than is warranted under SMS. Therefore, inspectors need to be strongly encouraged to report all inspections, regardless of whether they discover violations.
Better Data on Type of Business
We have argued that type of business is a possible reason for additional stratification of SMS and that FMCSA should examine the trade-offs associated with increased stratification. For instance, there is an argument that CMVs that operate locally and those that engage in long-distance trips might be worth separate treatment because they operate in different risk environments. However, any assessment of such a possibility depends on the quality of the responses on the URS and the MCS-150 about a carrier’s type of business, and such responses are believed to be inadequate for this purpose. This may be due to the wording used to request the information, the fact information is at times not regularly updated, or because carriers believe that it is to their advantage to include any type of business so that they do preclude themselves from those activities in the future. For this reason, we believe that FMCSA should examine the language on the URS and the MCS-150 to see whether improved information on type of business can be collected, and also to motivate higher quality and frequently updated responses. Again, trip-specific data may be available, but they are not shared with FMCSA, and there would likely be industry pushback against sharing the level of detail that would truly help improve the utility and validity of information on utilization.
In summary, we make the following recommendation:
RECOMMENDATION: The Federal Motor Carrier Safety Administration (FMCSA) should continue to collaborate with states and other agencies to improve the quality of Motor Carrier Management Information System (MCMIS) data in support of the Safety Measurement System (SMS). Two specific data elements require immediate attention: carrier exposure and crash data. The current exposure data are missing with high frequency, and data that are collected are likely of unsatisfactory quality. Further, to improve the exposure data collected involves collecting not only higher-quality vehicle miles traveled data, but also this information by state and by month. This will enable SMS to (partially) accommodate existing heterogeneity in the environments where carriers travel. Crash data are also missing too often. Also, there is information available from police reports currently not represented on MCMIS that could be helpful in understanding the contributing factors in a crash. Such information could help to validate the assumptions linking violations to crash frequency. To address these issues, FMCSA should support the states in collecting more complete crash data, and in universal adoption of the Model Minimum Uniform Crash
Criteria, as well as developing and supplying the code needed to automatically extract the data needed for the MCMIS crash file.
NEW VARIABLES IN NEW DATA SOURCES USEFUL IN A NEW SMS
The data deficiencies discussed above in support of SMS would be remedied through use of the same sources currently used in MCMIS, though modified by asking for additional details or ensuring higher quality. Such modifications represent relatively minor changes in the current system. The question remains whether other auxiliary sources of data could augment the current sources of data for MCMIS to benefit the current SMS or the new approach described in Chapter 4.
To examine this question, the panel considered previous findings by a National Academy of Science, Engineering, and Medicine panel (2016), which argued that it is reasonable to think of the causes of CMV crashes due to the following four categories: (1) characteristics of the driver, including those that change from trip to trip, (2) characteristics of the vehicle, (3) the driving environment, and (4) practices and procedures of the carrier. These categories include the following contributory factors (a list not intended to be complete):
- Driver factors: Demographics, human capital, health conditions, medications used, degree of fatigue, recent sleep history, circadian effects, driving experience, safety record, decision-making ability, work demands;
- Vehicle factors: Type and age of truck/bus, quality of brakes, quality of tires, other mechanical conditions, maintenance frequency and history, crash history, technology on board for distraction avoidance, collision avoidance;
- Driving environment factors: Weather, degree of precipitation, time of day, traffic density, road type, degree of road lighting, hazards, safety features, availability of rest stops, impact of other drivers (if not collected as individual driver factors), light condition;
- Carrier factors: Operation type, type of freight, fleet size, scheduling, logistics, driver turnover, fatigue management, safety culture, compensation level and method.
In any study of the causes of a crash, failure to include some contributory factors (confounding influences) can lead to improper inferences. In our case, omission of such factors can result in SMS misidentifying car-
riers for intervention. It is clear that the current variables in the MCMIS are inadequate to represent many important factors known to contribute to crashes. In particular, since SMS is concerned with carrier behavior, the fact that MCMIS does not have information on scheduling, logistics, driver turnover, fatigue management policies, and compensation type and level suggests that if such information could be collected by FMCSA, it would benefit the functioning of SMS or the alternative proposed here.
Since we believe a substantial fraction of crashes are due at least in part to carrier operations, and it is those that SMS is attempting to modify, it is clearly important to consider how to gain knowledge of those factors when evaluating SMS. It would be extremely useful to know about the carrier’s operations, how it deals with scheduling issues and other logistics, what the driver turnover rate is, how it deals with fatigue management, its form of compensation and what level is typical, and what the approach to safety is. Should FMCSA issue an intervention to a carrier, it would be informative to see what aspects of carrier operations were modified to try to address the intervention. Toward this end, we suggest to FMCSA to look into how the following carrier characteristics might be collected. Some of them could be collected through the current MCMIS process, but some of them might need other types of data collections.
- Information on turnover rate. We believe most carriers could provide their driver turnover rates if requested. More specifically, they could provide how many drivers they hired (as employees or contractors) and how many they terminated during the previous year. This variable could be very predictive of a company’s treatment of its employees, which could be related to safety operations. In addition, a low turnover rate is likely associated with employment of drivers with longer tenures and hence greater experience.
- Information on type of cargo carried. Since current questions on type of business are producing lower-quality information, it might be preferable to ask a carrier about its typical cargos. (It might be better to ask what cargoes were carried “last year,” that is, over a definite period of time.) The response is nearly the same as type of business and might be easier to answer.
- Information on compensation level/method. Similar to turnover rate, it is known that drivers who are better compensated, and those not compensated as a function of miles traveled, have fewer crashes (Belzer and Sedo, in press; Belzer, Rodriguez, and Sedo, 2012; Rodriguez, Targa, and Belzer, 2006). The mode of compensation can incentivize behavior known to be less safe; pay-by-the-mile compensation will reward drivers for possibly excessive miles. Therefore, information on level and method of compensa-
-
tion, including whether carriers pay for loading and unloading, could be collected and could be useful in identifying carriers that are behaving differently with respect to safety operations.
- Better information on exposure: We are not certain that the only source of VMT by state and by month is the URS and the MCS-150. We believe that tax information is a possible source of high-quality VMT data, and therefore, we suggest that FMCSA interact with the state taxing authorities, such as the International Registration Plan and the International Fuel Tax Agreement, to see whether interagency agreements can be reached to share this information in support of SMS.4 In addition, at the end of this year, electronic on-board recorders (EOBRs) will be required for most carriers. Results for all carriers could be reported to FMCSA. Having the number of VMT at the end of a year would be extremely easy to produce and would be definitive. Finally, urban/rural and type of road have been shown to be predictive of crash risk. If EOBRs could be used in conjunction with detailed data on the road infrastructure, it might be possible to provide this information.
In conclusion, we have the following recommendation:
RECOMMENDATION: The Federal Motor Carrier Safety Administration (FMCSA) should investigate ways of collecting data that will likely benefit the recommended methodology for safety assessment. This includes data on carrier characteristics—including information on driver turnover rate, type of cargo, method and level of compensation, and better information on exposure. This additional data collection will likely require additional funds for research and development of the data collection instrument, and greater collaboration between FMCSA and the states as to how to undertake this new data collection effort so that it is standardized across the states. Protection and use of carrier specific data must be addressed as well.
___________________
4 Also, MCS-150 does not specify which mileage is to be reported, and it should request fuel tax miles for the last full calendar year. If FMCSA can gain access to fuel tax miles, this will provide validation of the miles self-reported by the carrier. Further, fuel tax reports contain miles operated by the carrier in each state, which will allow for analysis of differences among states.


