
Appendix B
Details of the Safety Measurement System Algorithm
DATA INPUT
The data used for input to the Safety Measurement System (SMS) comes in four separate segments of the Motor Carrier Management Information System (MCMIS): (1) carrier census data, (2) inspection data, (3) violation data, and (4) crash data. Carrier census data include U.S. Department of Transportation (DOT) number, vehicle miles traveled, address of headquarters, active status, interstate/intrastate, operational status code, equipment type and count, cargo classification, number of power units, and whether the carrier transports hazardous materials. Inspection data include: date/time of the inspection, truck or bus carrier, vehicle configuration, cargo body type, gross vehicle weight range, date, state and county, inspection level, number of violations, and whether the vehicle had enough hazardous material to require a placard. Violation data—which are able to be linked to the relevant inspection—include violation code, whether a citation was issued, whether the violation has been adjudicated and the result, whether the violation is a postcrash violation, whether the violation resulted in an out-of-service order, the associated Behavior Analysis and Safety Improvement Categories (BASICs), the associated severity weight, and the out-of-service weight (see below). Crash data include DOT number, location, time/date, sequence of events, number of vehicles involved, type of vehicle, weather, light condition, injuries, fatalities, whether a vehicle was towed-away, whether hazardous materials were released, and the severity crash weight (see below).
Input Data Filters. There are several filters or checks that have to be passed before data are used in the calculation of the BASIC measures. (These are in addition to the data sufficiency standards, discussed below.) They are: (1) for carrier data: carriers must be active; (2) for inspection data: the inspections must be in the past 24 months, and the type of inspection must match the BASIC they are being applied to; (3) for violation data: in cases of multiple counts of the same violations, SMS only counts a violation once, and if any of the duplicates have an out-of-service attribute, that is made an attribute of the single counted violation; and (4) for crash data: the crash must have occurred in the past 24 months, and it must have been a tow-away crash, or one with injuries or fatalities.
NUMERATORS OF MEASURES: WEIGHTINGS OF VIOLATIONS
The numerators of the seven BASIC scores are sums over violations of the product of weights. The following are the weights that make up these products:
Severity Weights. Severity weights are assigned to violations to reflect the degree of their correlation with crash occurrence and/or crash consequences, ranging from 1 for the least important to 10 for the most important. Severity weights are only comparable within and not across BASICs. In other words, a severity of, for example, 5 for one BASIC is not necessarily comparable to a severity of 5 for a different BASIC. A severity weight is increased by 2 when the violation in question results in an out-of-service order. Also, the sum of all violation severity weights for any single inspection in any one BASIC is limited to 30.
Crash Severity. Crashes are assigned different weights according to the seriousness of the crash. (This is only to compute the Crash BASIC.) The idea is to assign greater weight to crashes involving injuries, fatalities, release of hazardous materials (HM), and a lower weight is assigned otherwise. The crash severity weights are as follows:
| Crash Type | Crash Severity Weight |
|---|---|
| Involves tow-away but no injury | 1 |
| Injury or fatality | 2 |
| Involves an HM release | Crash Severity Weight + 1 |
Time Weights. Inspections, violations, and crashes are weighted according to how recently they occurred. Violations and crashes that took place
within the past 6 months receive a weight of 3, those that took place between 6 months ago and 1 year ago are given a weight of 2, and those that occurred between 1 year and 2 years ago receive a weight of 1.
Therefore, the numerators of the BASICS are either sums of the product of severity weights and time weights for the noncrash BASICs, or sums of the product of crash severity weights and time weights for the Crash BASIC.
CALCULATION OF DENOMINATORS: MEASURES OF EXPOSURE
Since the number of crashes experienced and violations obtained during inspections are a function of time on the road, it is important to normalize the number of violations, or the number of crashes, by a measure of time driving, or exposure, in order to make comparisons meaningful. SMS makes use of three measures of exposure to construct its denominators.
For BASICs related to driver inspections, the denominators used are the total time weight associated with the relevant inspections. This normalization is used for Hours-of-Service Compliance, Controlled Substances/Alcohol, and Driver Fitness. The second type of denominator relates to vehicle inspections; the normalization is similar to the first denominator, except that it pertains only to vehicle-based inspections and the resulting violations, and is used for BASICS for Vehicle Maintenance and HM Compliance (with the latter only for inspections for Hazardous Materials carriers). Third, for the Unsafe Driving BASIC, for behaviors that usually prompt an inspection, such as speeding or swerving, the normalization
TABLE B-1 Definition of Utilization Factors for Combination Segment
| Combination Segment | |
|---|---|
| Vehicle Miles Traveled (VMT) per Average Power Unit (PU) | Utilization Factor |
| < 80,000 | 1 |
| 80,000–160,000 | |
| 160,000–200,000 | 1.6 |
| > 200,000 | 1 |
| No Recent VMT Information | 1 |
SOURCE: Table 3.1 in SMS Methodology, Federal Motor Carrier Safety Administration (2016).
TABLE B-2 Definition of Utilization Factors for Straight Segment
| Straight Segment | |
|---|---|
| VMT per Average PU | Utilization |
| < 20,000 | 1 |
| 20,000–60,000 | |
| 60,000–200,000 | 3 |
| > 200,000 | 1 |
| No Recent VMT Information | 1 |
NOTE: PU, power unit; VMT, vehicle miles traveled.
SOURCE: Table 3.2 in SMS Methodology, FMCSA (2016a).
is the Average Power Units (APU) multiplied by the utilization factor. (See Tables B-1 and B-2 for definitions of utilization factors for combination and straight segments.) Similarly, the Crash Indicator BASIC is also normalized by the same denominator.
DEFINITION OF THE SEVEN DIFFERENT BASICS
SMS groups violations into categories, which are referred to as BASICs. They are as follows:1
- Unsafe Driving BASIC—This BASIC measures “Operation of commercial motor vehicles (CMVs) in a dangerous or careless manner. Example violations include: speeding, reckless driving, improper lane change, texting while operating a CMV, not wearing safety belts.2,3 The measure is defined as follows:

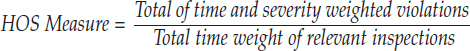
- HOS [Hours of service] Compliance BASIC—This BASIC measures “Operation of CMVs by drivers who are ill, fatigued, or in noncompliance with the HOS regulations. This BASIC includes violations of regulations pertaining to records of duty status (RODS) as they relate to HOS requirements and the management
___________________
1 Taken from FMCSA (2016a).
2 In cases of multiple counts of the same violation, each violation counts only once per inspection.
3 Violations can also result from inspections motivated by traffic enforcement stops for moving violations.
-
of CMV driver fatigue. Example violations include: operating a CMV while ill or fatigued, requiring or permitting a property-carrying CMV driver more than 11 hours, failing to preserve RODS for 6 months/failing to preserve supporting documents.” The measure is defined as follows:
- Vehicle Maintenance BASIC—This BASIC measures “Failure to properly maintain a CMV and prevent shifting loads, spilled or dropped cargo, and overloading of a CMV. Example violations include: inoperative brakes, lights, and other mechanical defects, improper load securement, failure to make required repairs.” The equation used to calculate the BASIC is as follows:

- Controlled Substances/Alcohol BASIC—This BASIC measures “Operation of CMVs by drivers who are impaired due to alcohol, illegal drugs, and misuse of prescription or over-the-counter medications. Example violations include: use or possession of controlled substances or alcohol, failing to implement an alcohol and/or controlled substance testing program.” The measure is defined as follows:

(Since all such violations are considered to be out-of-service violations, it is not the case that two additional severity points are added to any violations for this BASIC.)
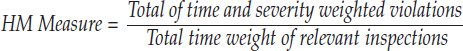
- HM [hazardous materials] Compliance BASIC—This BASIC measures “Unsafe handling of HM on a CMV. Example violations include: failing to mark, label, or placard in accordance with the regulations, not properly securing a package containing HM, leaking containers, failing to conduct a test or inspection on a cargo tank when required by the United States Department of Transportation (U.S. DOT).” The measure is defined as follows:
-
Driver Fitness BASIC—This BASIC measures “Operation of CMVs by drivers who are unfit to operate a CMV due to lack of training, experience, or medical qualifications. Example violations include: failing to have a valid and appropriate commercial driver’s license (CDL), being medically unqualified to operate a CMV, failing to maintain driver qualification files.” The measure is computed as follows:

- Crash Indicator BASIC—This BASIC measures “Historical pattern of crash involvement, including frequency and severity. The BASIC is based on information from state-reported crashes that meet reportable crash standards. All reportable crashes are used regardless of the carrier’s or driver’s role in the crash. This BASIC uses crash history that is not specifically a behavior but instead the consequence of a behavior or a set of behaviors.” This BASIC uses state-reported crash data in MCMIS to form the following measure:

A reportable crash is one that results in at least one fatality, one injury requiring transportation to a medical facility, or one vehicle needing to be towed from the scene.
DATA SUFFICIENCY STANDARDS
BASIC scores are only computed for carriers that have had sufficient activity to justify that the computation will not have an unreasonably large variance. The sufficiency standards that have been instituted by FMCSA are different for the different BASICs, reflect information from the previous 24 months, and are as follows:
- Unsafe Driving: Carriers with at least three inspections with at least one violation
- Hours of Service: Carriers with at least three relevant inspections and at least one inspection with at least one violation
- Vehicle Maintenance: Carriers with at least five relevant inspections and at least one inspection resulting in one violation
- Controlled Substance/Alcohol: Carriers with at least one violation
- HM Compliance: Carriers with at least five relevant inspections and where at least one inspection resulted in a violation
- Driver Fitness: Carriers with at least five relevant inspections and one inspection resulting in a violation
- Crashes: Carriers with at least two applicable crashes
During 2014–2015, 38 percent of active carriers had sufficient data to be scored for at least one BASIC, and these carriers had 92 percent of the crashes during that time period. (There is also a Critical Mass Threshold Test that is similar to the data sufficiency standard, but it sets a higher minimum standard before an intervention can be taken.)
STRATIFICATION BY TYPE AND SIZE OF CARRIER
SMS makes use of two types of stratifications in the sense that its computations and rankings are carried out separately within these strata:
Type of Carrier. Unsafe Driving and Crash Indicator BASICs are stratified (referred to as being segmented) by combination trucks/motorcoaches and straight trucks/other vehicles. For carriers with both types of vehicles, if 70 percent or more of the power unit types are combination trucks/motorcoaches, the carrier is assigned to the combination stratum, and otherwise it is assigned to the straight stratum.
Safety Event Groups. Carriers are meant to be compared to other carriers that are of a comparable size. For that reason, for each BASIC, SMS places carriers in what are referred to as safety event groups based on the number of events over the previous 24 months (e.g., inspections, violations, and crashes depending on the BASIC in question) in which they have been involved during the previous 2-year period. This allows comparison of carriers that have had roughly comparable levels of exposure. The safety event groups are defined as follows for the Combination Segment (see Table B-3) and Straight (see Table B-4) Safety Event Groups.
TRANSFORMING SCORES TO PERCENTILES
FMCSA believes that SMS should, at its core, be a relative measure of carriers’ safety performance, rather than an absolute measure. This is because FMCSA’s resources in support of interventions are fixed, and therefore SMS has to function as a priority ranking system, used to identify a specific number of carriers for intervention. Toward this end, the scores for carriers within a safety event group are ranked and the percentile associated with each score are computed for each carrier.
TABLE B-3 Definitions of Combination Safety Event Groups
| Safety Event Group | Unsafe Driving BASIC | Hours-of-Service Compliance BASIC | Vehicle Maintenance BASIC | Controlled Substance/Alcohol BASIC | Hazardous Materials Compliance BASIC | Driver Fitness BASIC | Crash Indicator BASIC |
|---|---|---|---|---|---|---|---|
| Number of Inspections with Unsafe Driving Violations | Number of Relevant Inspections | Number of Relevant Inspections | Number of Relevant Inspections | Number of Relevant Inspections | Number of Relevant Inspections | Number of Crashes | |
| 1 | 3–8 | 3–10 | 5–10 | 1 | 5–10 | 5–10 | 2–3 |
| 2 | 9–21 | 11–20 | 11–20 | 2 | 11–15 | 11–20 | 4–6 |
| 3 | 22–57 | 21–100 | 21–100 | 3 | 16–40 | 21–100 | 7–16 |
| 4 | 58–149 | 101–500 | 101–500 | 4+ | 41–100 | 101–500 | 17–45 |
| 5 | 150+ | 501+ | 501+ | 101+ | 501+ | 46+ |
TABLE B-4 Definitions of Straight Safety Event Groups
| Safety Event Group | Unsafe Driving BASIC | Hours-of-Service Compliance BASIC | Vehicle Maintenance BASIC | Controlled Substance/Alcohol BASIC | Hazardous Materials Compliance BASIC | Driver Fitness BASIC | Crash Indicator BASIC |
|---|---|---|---|---|---|---|---|
| Number of Inspections with Unsafe Driving Violations | Number of Crashes | ||||||
| 1 | 3–4 | See above for combination segment | See above for combination segment | See above for combination segment | See above for combination segment | See above for combination segment | 2 |
| 2 | 5–8 | 3–4 | |||||
| 3 | 9–18 | 5–8 | |||||
| 4 | 19–49 | 9–26 | |||||
| 5 | 50+ | 27+ |
TABLE B-5 Intervention Thresholds for BASICs
| BASIC | Intervention Thresholds | ||
|---|---|---|---|
| Passenger Carrier | Hazardous Materials (HM) | General | |
| Unsafe Driving, Crash Indicator, HOS Compliance | 50% | 60% | 65% |
| Vehicle Maintenance, Controlled Substances/Alcohol, Driver Fitness | 65% | 75% | 80% |
| HM Compliance | 80% | 80% | 80% |
NOTE: There are specific definitions of passenger carriers and HM carriers on pp. 2–9 of FMCSA (2016a).
FMCSA’s analysis has demonstrated that the Unsafe Driving, Crash Indicator, and HOS Compliance BASICs have the strongest linkage to crash risk, and therefore their thresholds, seen above, are lower. In addition, because the consequences of any resulting crashes are greater, the thresholds are lower for passenger carriers and for HM carriers.
There are a few additional rules regarding computation of percentile ranks. Percentiles are only generated from scores of U.S. interstate and hazardous material (HM) carriers. For the remaining carriers, percentiles are assigned based on interpolations of the percentiles for interstate and HM carriers.
Further, there is a 12-month rule, in which the percentiles for carriers that have had all of their violations (or crashes) occur more than 12 months ago are dropped (sometimes there is the added condition that no violation was recorded in the last inspection whenever it occurred). The percentiles for the remaining carriers remain unchanged after those are eliminated.
Carriers with percentiles above a designated threshold are flagged to receive an Alert, which typically indicates that they will receive an intervention. (Alerts can also be triggered as a result of investigations. Alerts were not discussed in this report.) The thresholds are summarized in Table B-5.


