
3
Applications of Item Response Theory Models in Other Contexts and Public Release and Transparency
The use of data to measure the performance of individual units has a long history in the United States, cutting across a wide range of industries. For example, the U.S. Department of Transportation, along with state and local agencies, collects and reports data on crashes for identifiable subgroups of the population of motor carriers, by specific locations, and associated with various vehicle types, makes, models, and equipment. This approach to assessing safety performance is ubiquitous throughout the transportation agencies that report on safety. In commercial air, rail, and waterway transportation, as with the Federal Motor Carrier Safety Administration (FMCSA), safety reporting is aggregated for segments of the respective industries and specific to individual companies.
To pick one example, the Federal Aviation Administration (FAA) collects data from airlines on accidents and incidents (https://www.faa.gov/data_research/accident_incident/) and on a variety of reported hazards and safety discrepancies, including several voluntary reporting systems. The FAA’s safety management process offers an interesting parallel to the FMCSA’s Safety Measurement System (SMS). The Aviation Safety Information Analysis and Sharing (ASIAS) Program works to monitor known risk, evaluates the effectiveness of deployed mitigations, and detects emerging risk.1 Components of the ASIAS are designed to monitor safety-related events (including self-reported events) to identify
___________________
1 For more information, see ASIAS Fact Sheet, April 2016 (https://www.faa.gov/news/fact_sheets/news_story.cfm?newsId=18195).
and mitigate risks before they result in crashes. The FMCSA’s monitoring of safety violations to characterize a carrier’s safety culture is also designed to identify risky carriers and hopefully mitigate future crashes.
As another example, the Federal Rail Administration (FRA) keeps records of passenger and freight rail accidents and produces ordered lists by frequency of occurrence that can be queried by the public.2 This is similar to the way that FMCSA receives reports of crashes and assigns them to the responsible motor carrier. In 2016, the FRA promulgated a rule requiring passenger rail operators to develop and implement a system safety program (SSP) for risk-based hazard management addressing maintenance, inspection, repair, rules compliance and procedures review, employee and contractor training, and outreach.3 The FRA maintains a cadre of inspectors who review rail carriers’ SSPs for sufficiency and who perform inspections and issue violations as required. These and other programs in the FRA parallel FMCSA’s SMS in fulfilling regulatory requirements and managing safety through monitoring of safety-related behaviors and violations as they relate to risk of accident.
Outside of transportation, the medical and educational sectors have been particularly active in measurement. The World Health Organization proposed several measures of health, based on five dimensions, to compare countries: overall health, inequality in health, fairness of financing, overall health system responsiveness, and inequality in health system responsiveness (Almeida et al., 2001; Coyne and Hilsenrath, 2002). In the United States, the quality of health care provided by specific delivery systems, such as hospitals, health plans, ambulatory centers, and even individual physicians, is quantified using a variety of data sources (Courtney et al., 2002). In education within the United States, school and teacher performance are assessed with the goal of improving the quality of education in school districts (Rothstein, 2000). These two sectors have a history of measurement and public reporting, with many similar measurement, modeling, and public reporting challenges as those involved in assessing motor carrier safety. Countries, hospitals, physicians, schools, and teachers play the role of motor carrier—the accountable units—while outcomes associated with whole populations, patient encounters with the health system, and students are analogous to safety violations.
___________________
2 For more information, see “Train Accidents by Rail Groups” (http://safetydata.fra.dot.gov/OfficeofSafety/publicsite/Query/inctally3.aspx).
3 For more information, see FRA-2011-0060, Notice Number 3, July 29, 2016 (https://www.fra.dot.gov/eLib/Details/L18294).
ASSESSING THE QUALITY OF MEDICAL CARE
The conceptual foundation upon which medical care delivery is assessed traces back to the work of Avedis Donabedian (1980), who identified three general dimensions of health care associated with a medical provider, whether the provider is a health plan or an individual clinician: structure, process of care, and outcomes of care. Structural measures refer to characteristics of the provider that enable the capacity to deliver high quality of care and include physical attributes such as the existence of computer order entry systems. Process measures refer to what providers do to and for patients, often linked to adherence to established best practices and medical guidelines, for example, if a patient admitted for a heart attack who is eligible for beta-blocker therapy receives a prescription for beta-blocker therapy upon discharge. Finally, outcome measures refer to responses that characterize the patient’s health status, such as death within 30 days of admission for a heart attack. Advantages and disadvantages of the specific measures associated with the three dimensions have been discussed at length (see, for example, Birkmeyer, Dimick, and Birkmeyer, 2004). The choice of structural, process, or outcome measures depends on numerous factors including the population size (e.g., the number of patients eligible for a particular therapy), the potential for serious adverse consequences (e.g., the delay in getting a patient having a heart attack thrombolyzed), the frequency of the outcome (e.g., the percentage of patients dying within 30 days of a hospital admission), and the duration of assessment period (e.g., hospitals are assessed using 3 years of data), among others (Birkmeyer, Dimick, and Birkmeyer, 2004).
Accountability in the Health Measurements
The Centers for Medicare & Medicaid Services (CMS) measures the quality of health care at multiple different levels of accountability for its beneficiaries: hospital inpatient, hospital outpatient, nursing homes, health plan, and physician. For example, several process-based patient safety measures are determined at the physician level, such as the percentage of a physician’s older patients screened for a future fall. While screening (a process measure) does not characterize injuries as a consequence of a fall (an outcome measure), it can help identify patients who are at risk of falling. The analogy with highway safety is that safety violations may be viewed as process measures, while crashes are outcome measures. Process measures are more directly actionable to improve outcomes because process measures can suggest specific procedures to improve outcomes. For hospitals, several process and outcome measures are publicly reported (www.medicare.gov/hospitalcompare). Moreover, in addition to publicly
reporting measurements, CMS uses some measures to reward health care providers with incentive payments for the quality of care they deliver to their beneficiaries. In 2012, CMS adopted an approach to calculate excess 30-day all-cause readmission ratios associated with patients hospitalized for a heart attack, heart failure, and pneumonia, and uses this measure in part to calculate a readmission payment adjustment.4
Professional societies, such as the American Board of Internal Medicine, American College of Cardiology, American Heart Association, and the Society of Thoracic Surgeons, have been involved with quality assessment and reporting as well. These societies provide information to specific clinicians and to delivery systems characterizing their performance at an absolute and at a relative level.
The CMS approach to modeling quality measures varies across and within type of measure. Hierarchical generalized linear models are estimated for hospital outcome measures for specific diseases in which patients are clustered within hospitals. Because patients are not randomized to hospitals, admission characteristics of the patients are used to adjust for differences in patients across hospitals. Indirect standardization based on the hierarchical model is used to classify hospitals into three categories: those having higher than expected outcomes, those having lower than expected outcomes, and those having outcomes no different from expected.
Combining Health Quality Measures
Given the numerous provider-specific measures utilized by CMS, conveying information to beneficiaries regarding provider quality or using the information to improve quality became complicated. For example, CMS’s pay-for-performance project required a valid and reliable methodology for combining the individual measures into a single quality score (composite) for specific hospital conditions. A univariate summary could then be used to categorize the distribution of the condition-specific scores into deciles to identify high-quality hospitals. In a demonstration project (the Hospital Quality Improvement Demonstration Project), hospitals in the top 20 percent were given a financial bonus. The specific measures and conditions were chosen on the basis of the seriousness of the conditions, the size of the populations impacted by the conditions, and the costs associated with the conditions. The methodology required aggregating individual measures to create a summary measure.
___________________
4 For more information, see https://www.cms.gov/Medicare/Medicare-Fee-for-Service-Payment/AcuteInpatientPPS/Readmissions-Reduction-Program.html.
ASSESSING STUDENTS, TEACHERS, AND SCHOOLS
Recent years witnessed dramatic changes in the evaluation of the performance of public schools and public school educators. Although student scores on standardized tests have been used by education reformers to promote improvement of what they saw as poor-performing schools since the mid-19th century (United States Congress, Office of Technology Assessment, 1992), test-based accountability for schools, principals, and teachers rose to new dimensions in the 1990s and the early years of the 21st century. States such as Kentucky, North Carolina, and Texas, among others (Grissmer and Flannagan, 1998; Koretz and Barron, 1998), wrote laws and regulations requiring school performance be evaluated annually on the basis of students’ average scores or performance levels on standardized tests. These regulations also specified sanctions, such as possible closure or restructuring for schools where students failed to meet performance targets and financial rewards for schools that performed exceptionally well. With the 2002 reauthorization of the Elementary and Secondary Education Act, commonly known as No Child Left Behind (NCLB), test-based accountability became federal law. The law required public elementary and secondary schools to be evaluated on the proportion of their students who scored proficient or better on standardized tests selected and administered by the states. Schools with performance measures that failed to meet federally established targets faced sanctions including possible restructuring or closure. To support the annual calculation of the performance measures, NCLB mandated annual testing for all public school students in grades 3 to 8 in mathematics and reading and in one grade in secondary school in the United States.
Value-Added Models in Teacher Evaluations
Performance measures for education took another turn in the early 2000s with the introduction of value-added modeling and its use for teacher evaluations. Value-added models are statistical models for students’ current standardized achievement test scores as functions of prior years’ test scores, student background variables, and educational inputs such as schools or teachers. They are closely related to item response theory (IRT) models. These models are meant to isolate the value of a particular input (e.g., a year of schooling or a teacher) on students’ achievement. Unlike the average proficiency measures required by NCLB, which relied only on students’ scores at a point in time, value-added models use multiple years of test score data on individual students in their efforts to identify the contributions of individual teachers or schools to student
learning (National Research Council and National Academy of Education, 2010).
In the late 1990s, multiple researchers used value-added models to argue that teachers were the most important schooling input to student achievement and that large differences existed in the effectiveness of teachers to support student learning as measured by standardized achievement tests (Sanders and Rivers, 1996; Wright, Horn, and Sanders, 1997). By the early 2000s, this research—along with research demonstrating that the traditional methods of teacher evaluation, which relied primarily on supervisor evaluations—found almost all teachers receiving satisfactory or better evaluations (Weisberg et al., 2009), which gained the attention of policy makers. States and school districts began exploring the use of value-added models for teacher and principal evaluations. The federal government again accelerated accountability, this time value-added-based accountability, through the Race to the Top competitive grant program for states. The government included in its criteria for award the requirement that states develop revised teacher and principal evaluation systems that rated educators on performance indicators that combined value-added measures and other measures, such as scores from observation of practices (e.g., classroom teaching for teachers) on standardized protocols. These revised evaluation methods were further promoted through waivers as part of the Principal Flexibility Provisions in the Elementary and Secondary Education Act, which, starting in 2011, included requirements for revised educator evaluation systems.
The rapid implementation of value-added models in teacher evaluations generated large concerns in parts of the research community and stakeholder groups about the accuracy of the models for measuring effectiveness of teachers and the quality of their teaching. Critics of value-added measures pointed out that because students were not randomly assigned to classes, there remained potential for value-added measures to reflect student backgrounds in addition to teacher inputs into learning. Critics also noted value-added measures could contain large statistical errors that could result in year-to-year instability in the measures or misclassification of teachers. A large body of literature on both positive and negative attributes of value-added models quickly developed, and the debate even gained coverage in the popular press after the new teacher evaluation systems went operational.
In 2016, Congress again reauthorized the Elementary and Secondary Education Act. Although the reauthorization retained the annual testing requirement, it removed federally mandated specific penalties based on the scores. In addition, it did not retain any of the requirements for individual teacher and educator evaluations that were part of the waiver program. The law gave states and local school districts greater control
over their educator evaluation and school accountability systems than the previous law.
Value-Added Modeling for Student Achievement
Value-added models describe student achievement as a function of multiple factors including teachers or schools. Estimation of the model parameters then provides estimates of the teacher’s contribution to achievement test scores. However, because achievement is only one desired outcome of schooling and any given achievement test measures only a subset of the content students are expected to master, value added is an incomplete measure of teacher effectiveness. In addition, value-added measures are not tied to any specific teaching practices so they provide limited guidance to teachers on how to improve their performance. Consequently, evaluation systems generally relied on performance indicators that combined value-added measures with other measures of teachers’ performance including classroom observations. Researchers have explored IRT and latent variable models to combine multiple measures of teaching (Lockwood, Savitsky, and McCaffrey, 2015); however, state evaluation system rules for combining the various component measures have tended to be ad hoc and often based on multiway classification tables, in part, because the Race to the Top required that educators be classified in three or more performance categories.
ASSESSING MOTOR CARRIER SAFETY
As highlighted throughout this report, the mission of the FMCSA is to reduce crashes, injuries and fatalities involving large trucks and buses operationalized through safety measurement. Simply stated, safer commercial motor vehicles should have fewer crashes, all else being equal. The panel agrees with a focus on safety; crashes are rare, unlikely to provide information for the majority of commercial vehicles operating in the United States, and thus yield little knowledge to prevent future crashes. FMCSA uses violations, binary-valued variables, as a basis to measure carrier safety culture, assigning violations to carriers as the accountable units. Thus, violations provide indicators of carrier safety under the assumption that safety impacts crashes.
Like measurement in health and education, carrier safety is a complex multidimensional construct requiring multiple measurements. Overall, the rationale for combining the subdomains to create a composite safety score includes providing an overall summary of carrier safety, creating a fairer mechanism to measure carrier safety because multiple violations are
needed to get an unsafe score, and improving the statistical properties of estimates of carrier safety.
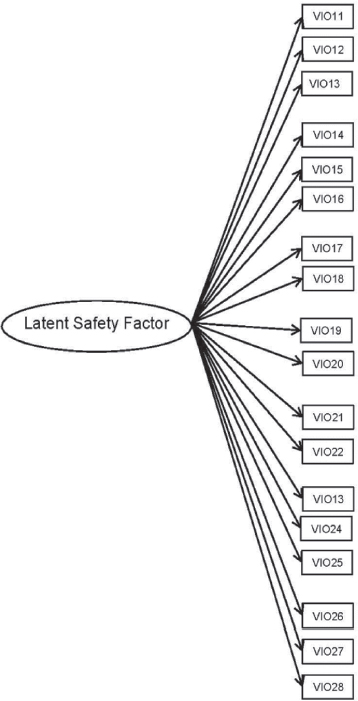
A psychometric approach to carrier safety culture measurement requires the completion of several steps to produce valid and reliable summaries (see Table 3-1). The measures included in the construct should have a plausible relationship with the carrier’s underlying safety culture. The key idea relates to the notion that multiple violations are caused by the safety culture of the carrier, reflected in Figure 3-1(a) by arrows from the unobserved construct to each violation. The strengths of the relationships between each violation and the latent construct (depicted by arrows in the figure) may vary by violation, with some violations having little or no relationship to the carrier’s latent safety construct and others having strong relationships. Changes in the underlying safety culture of the carrier would change the risk of each violation—thus, the safety culture construct is reflective rather than formative. Because the violations are binary-valued variables, the strengths of the relationships can be estimated using an IRT model and their relationship with crash risk directly assessed (see Figure 3-1(a)). IRT models are basically factor analysis models for dichotomous (Y/N) data (i.e., test items), which is the case for the violations that are coded as present or not.
Given the broad and encompassing nature of carrier safety culture, the creation of several subdomains (denoted as specific Behavior Analysis and Safety Improvement Categories [BASICs] by the right-most ovals in Figure 3-1(b)) by FMCSA is sensible. However, the subdimensions and the overall score should be more thoroughly empirically tested to assess the reliability and other operating characteristics, such as construct validity—the degree to which each BASIC measures the types of unsafe operation it is intended to, and discriminant validity—the degree to which the BASICs
TABLE 3-1 Steps Required to Empirically Derive a Composite Safety Measure
| Task | Example |
|---|---|
| Specify Safety Subdomains | Unsafe driving, fatigued driving |
| Derive Content for Each Subdomain | Violations assigned to specific latent subdomains |
| Assess Relationship between Violations and Subdomain Score | Item response theory (IRT) model |
| Derive Subdomain Scores | Estimated from IRT model |
| Combine Subdomain Scores | Composite score via aggregation of estimates |
measure separate things. Finally, determining a meaningful difference would enhance the interpretation of the summary score.
There are additional considerations, however, that complicate the creation of a safety construct using violation data. First, violation information is collected only when carriers are inspected. Second, the risk of inspection depends on systematic factors, some but not all measured, as well as random factors. Third, both the risk of inspection and the risk of a violation once inspected vary by the number of active trucks associated with a carrier, in addition to systematic and random factors. Fourth, the hierarchical structure of the data is deep—the data are reported at the inspection-violation level repeatedly over time and, theoretically the inspections are nested within driver.
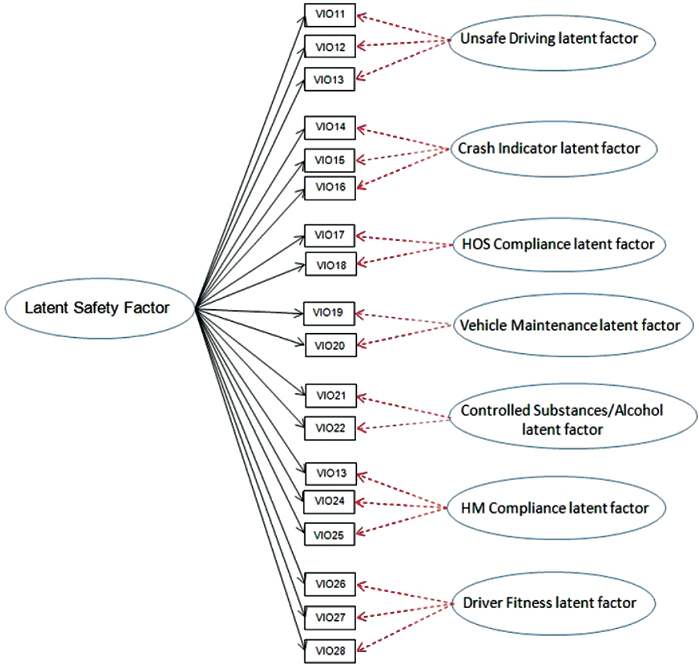
NOTE: Right-most ovals represent subdomains. HM, hazardous materials; HOS, hours of service.
These considerations are summarized in Table 3-1 above. Table 3-2 provides a summary of features characterizing national assessments.
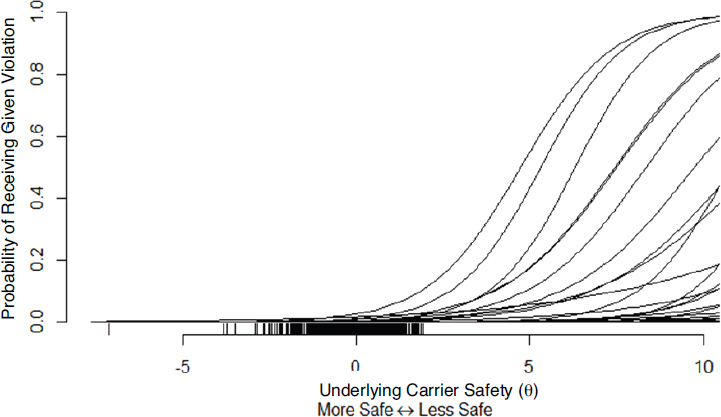
Figure 3-2 (explained more fully in Appendix C) is an illustrative example of the relationship between each of the violations comprising the Unsafe Driving BASIC obtained from estimating a two-parameter logistic item response theory model. The x-axis represents the underlying safety construct for each carrier, while the y-axis represents the probability of a specific violation. More discriminating violations are identified by steep slopes, while more frequent violations have functions that start rising further to the left.
TABLE 3-2 Summary of Features Characterizing National Assessments
| Feature | Setting | ||
|---|---|---|---|
| Health Delivery | Education | FMCSA | |
| Primary Units | Health plans, hospitals | Schools, teachers | Motor carriers |
| Number of Primary Units | 5,000 hospitals | 13,600 school districts, 98,500 schools, 3.1 million teachers | 500,000 active carriers |
| Range of Number of Secondary Units | 1 to 3,000 patients | About 50.5 million students | 1 to several thousand power units |
| Unit of Observation | Patient discharge | Student exam | Violation-inspections |
| Measure Type | Outcomes: process, structural | Student outcomes, teacher practices | Process |
| Period of Assessment | 3 years | 1 year | 2 years |
| Frequency of Assessment | Annually | Annually | Monthly |
| Stratification | Medical condition, | None | Carrier size, straight or |
| measure type | combination | ||
| Public Reporting | Hospitals point | Schools point | Carrier point |
| and interval | estimates | estimates | |
| estimates | |||
| Data Sufficiency | Minimum 25 for | Varies by state | See Appendix B |
| Standards | public reporting, | ||
| minimum 1 for | |||
| calculation | |||
NOTE: FMCSA, Federal Motor Carrier Safety Administration.
PUBLIC DISCLOSURE OF SMS MEASURES AND PERCENTILE RANKS
From 2010 to 2015, FMCSA made the measures and the associated percentile ranks for five of the seven BASICs publicly available on its website, with the exceptions of the Crash Indicator and Hazardous Materials Compliance BASICs. As a provision of the Fixing America’s Surface Transportation (FAST) Act of 2015, FMCSA was precluded from publishing the SMS percentile ranks for any BASIC, though it was still permitted
SOURCE: Panel’s analysis as presented in Appendix C.
to release the BASIC measures for the five BASICs previously available. This policy remained in place while the National Academy of Sciences (through this study panel) examined the quality of SMS. (For those five BASICs, the FMCSA Website also includes information on crashes, roadside inspections, and violations resulting from roadside inspections; the prohibition from publication only pertains to property carriers, and not to passenger carriers; further, all of SMS is available to law enforcement.)
There are advantages and disadvantages to disclosing the SMS percentile ranks to the public. The advantage is primarily that publicity is an important motivator. The goal of SMS is to encourage poor safety performers in the commercial motor vehicle (CMV) industry to devote greater attention to safe operations, and this is accomplished by intervening with those carriers that have frequent violations and crashes. The hope is that the initial interventions, typically notifications, motivate carriers to make changes so that their BASIC percentile ranks become more representative of typical carriers. Making the percentile ranks public creates pressure on motor carriers to make these changes because they then face the prospect of losing business to their rivals or having their insurance rates increased. In this way, FMCSA is employing competition to incentivize safer behavior. (As noted throughout this report, FMCSA also provides incentives through other increasingly serious forms of intervention.)
The disadvantages of public reporting stem from the fact that SMS is not a perfect discriminator between the carriers that need to improve their safety performance and those that do not. It may be impossible to precisely define what could be meant in this situation by a false negative or a false positive intervention, since there is no objective definition of what it means for a carrier to be an unsafe carrier. But hypothetically assuming achievement of a thorough investigation of what happens during maintenance, scheduling, loading cargo, hours driven per day, and other activities for all 550,000 active carriers, every carrier could be judged to be or not be operating safely. In that case, SMS almost certainly identifies some carriers for interventions that would have been judged to be operating safely, and it fails to identify some carriers for interventions that would have been judged to be operating unsafely. Both are problematic, and if they become too frequent, could result in a program whose costs outweigh its benefits. Our impression is that SMS has a lot of true positives and a lot of true negatives: that is, SMS does not issue interventions to many carriers that are operating with a high priority for safety while it does issue interventions to many carriers that need to give safe operations a higher priority. However, there is a particular concern about false negatives and false positives among smaller carriers, which results from not having much data with which to judge them. It should be stated that crashes are rare, so it is possible to operate for many years without a serious crash, even if a carrier is operating in a risky manner. Therefore the Crash Indicator BASIC could never be a perfect discriminator of small carriers. For example, the National Highway Traffic Safety Administration estimated that in 2012, the fatal crash rate for large trucks was 1.42 per 100 million miles. The injury crash rate was 29 per 100 million miles. If a truck averages 150,000 miles per year, on average it would go 470 years between fatal crashes and 23 years between injury crashes. If the truck were operated twice as risky as average, it would still average 235 years between fatal crashes and 11.5 years between injury crashes. Thus, because crashes are rare, it is necessary to use alternative measures of safe behavior, which are the BASICs.
In addition, though the following effects are generally small and therefore their impact infrequent, there are a number of ways in which a borderline carrier could have its percentile ranks go from the nonintervention side to the intervention side, or vice versa, from one month to the next, which may also be a source of some false negatives or positives. These effects include the following:
- A carrier’s measure of size or average power units decreased or increased, and was updated, and the carrier is now in a different safety event group whose general performance is worse or better.
-
Further, even staying within the same safety event group, if, for a carrier, the denominator for the Crash Indicator BASIC score increased or decreased due to a larger or smaller utilization factor, or due to fewer or more power units, its percentile ranks could increase or decrease.
- If a carrier had a month just over 2 years ago in which it had a very low or very high frequency of violations (now outside of the 2-year SMS window), and the data for that month are now replaced with data of the most recent tallied month in which the safety performance was more typical of the 2-year period. It should be noted, ignoring time weights, that a change in a percentile rank from one month to the next is the result of changes to 1/24th or about 4 percent of the data for a carrier over a 2-year period, so it is difficult for a carrier to make large changes in its measures or ranks in a short amount of time.
- As noted in Chapter 2, percentile ranks could go up or down if a carrier’s peers in its safety event group have all improved or worsened more than the carrier in question.
- Random variation occurs because there is a random element in who gets inspected.
The panel heard from various stakeholders and representatives from carriers both encouraging and discouraging the release of the percentile ranks. John Lannen of the Truck Safety Coalition told the panel that due to many of its features, CSA/SMS is used by many in the industry, and it has brought about a positive change in the general safety culture. He worried that not disclosing the measures and percentiles will deprive the public, shippers, and insurance brokers from learning about the comparative safety of motor carriers. According to Shuie Yankelewicz and Jean Gardner of the Central Analysis Bureau, SMS percentile ranks create a common language among CMV industry partners who are focused on monitoring and risk assessment of CMV operations, such as insurance companies, insurance agents and brokers, shippers, safety and risk management companies, and loss control companies. SMS percentile ranks fulfill the need of the CMV industry to have a measure of risk assessment so that they know what type of insurance options to offer, the premium to charge, and what kind of coverage to offer. Data-based risk assessment measures help the industry to comply with regulations. Due to these advantages, there is a strong interest by many in the industry that FMCSA continue to produce and disclose SMS percentile ranks.
An argument raised by William Voss against making the BASIC percentile ranks public is that it might lessen the motivation for carriers to collaborate on techniques that have been found to be effective in
bringing about safe operations. Such collaboration has occurred in other transportation industries as reported by the Independent Review Team (2014). The National Transportation Safety Board has recommended that FMCSA, the industry, and other stakeholders develop a mechanism that allows for cooperative development and coordinated implementation of voluntary safety programs. Also, Mark Burroughs of Transportation Intermediaries Association pointed out to the panel that the disclaimer language regarding SMS measures is confusing to shippers and brokers, motor carriers, and insurers and can lead to increased litigation costs. Due to the confusion stemming from SMS results for motor carriers, shippers and brokers are being brought into lawsuits and named as defendants for negligent selection of a motor carrier when an accident occurs. The situation is complicated further because state courts take different approaches to interpreting the disclaimer language on FMCSA’s Website. Burroughs recommended that as a result, FMCSA should not disclose SMS measures and percentile ranks and use them for internal prioritization only.
Based on these considerations, the panel is unable to recommend to FMCSA whether or not to make SMS percentiles public. What is needed is a greater understanding of the consequences of public consumption of the information, which would necessitate a formal evaluation using randomized or controlled release of specific components of the SMS percentiles. The panel would also need to better understand the statistical operating characteristics of the measures and percentile ranks to judge decisions regarding their usability.
RECOMMENDATION: The Federal Motor Carrier Safety Administration should undertake a study to better understand the statistical operating characteristics of the percentile ranks to support decisions regarding the usability of public scores.
While we have discussed assessing the operating characteristics of SMS with regard to the issue of public release of SMS percentiles, doing this is also an important component of a full validation of SMS. This is because the evaluation summarized in Chapter 2 is carried out on an aggregate basis, which does not directly assess the extent to which carriers that have frequent violations are those that have policies and procedures that contribute to unsafe driving. A full validation of a model in this context should have three components: (1) model fit, (2) the degree to which frequent violators, as identified by the algorithm, are those that operate unsafely, and (3) the degree to which those that operate unsafely have frequent crashes. Assessment of model fit is relatively trivial for SMS, since what is used is essentially weighted averages. However, there remains
the evaluation of the model for its stated goal. This means determining the degree to which carriers that have high violation rates are those that are operating unsafely. FMCSA has not directly validated this because it is expensive to do and because they look at aggregate crash rates for those selected and not selected for interventions as an overall evaluation. Although the panel is not recommending this since we believe resources should be invested in a principled scientific approach such as the proposed item response theory model, if FMCSA chooses to retain SMS, we believe that it is important for the agency to carry out such an evaluation.
Finally, we point out that the improved approach to SMS outlined in Chapter 4 of this report would very likely improve the “false negative” and “false positive” performance of SMS and thereby provide greater justification for release of the percentile ranks.
TRANSPARENCY NEEDED FOR SMS
As with any release of measures and percentile ranks judging performance with consequences, there is a benefit to transparency. Transparency alleviates worries about fairness of application that can persist in its absence. Should a carrier’s rank move it into alert status after a period of time in which it was not in alert status, a carrier would first check to see whether its frequency of violations in one of the six BASICs or frequency of crashes had increased considerably during the previous month. If this were not the case, a carrier would worry about a mistake. Unfortunately, both the existing SMS and the approach recommended in Chapter 4 are complicated, which makes such assessments difficult.
Further, motor carriers have difficulty monitoring their measures or progress on their own, which will continue if FMCSA adopts the new approach. They operate without knowing, day to day, the impact of their inspection results and crash experiences on their BASIC measures because they cannot easily run the relative comparisons on a continuously updated basis. Therefore, the plan to have scores affect behavior is not functioning as well as it might if the motor carriers could make their own computations of their BASIC measures on a demand basis. This ties back to the overall goals and objectives of SMS and, if addressed, would make the system more effective than it is now in improving safety. Motor carriers could actively manage their business in ways that they know would improve their BASIC measures. A complication is that to see the impact of a carrier’s recent performance or to produce indications of alert status for the carrier, it is necessary to view not only the carrier’s data, but also the input data for all carriers in the same safety event group (which is almost certainly different for each BASIC).
The Independent Review Team (2014, p. 25) commented on SMS transparency, noting the following:
There is concern in the industry about the transparency of the BASICs information and its effect on the reputations of their businesses. Throughout society, however, consumer and public protections are being enhanced in many other areas through increased use of public transparency and dissemination of safety ratings and assessments. Availability of such data informs the public and helps them make better choices. Poor performers suffer in the marketplace, and better performers gain market share. The government—if it is the party releasing the data—has the obligation to ensure data quality. Safety ratings should obviously be a fair reflection of a motor carrier’s operation; and the more accurate they become the more useful they will be in informing public choice and enhancing safety. Because many stakeholders (e.g., shippers, insurers, and litigants) assume SMS data reflects safe versus unsafe operations, FMCSA should take steps to clearly identify for the public the information that can be tied reliably to safety; and to distinguish it from other information that may be useful for other reasons but does not relate to crash risk.
A first step in this direction would be if carriers could better understand how the inputs are used to produce the current SMS measures and alerts. For this purpose, FMCSA could provide an accessible description about how SMS functions. In addition, FMCSA could explore development of software, possibly a mobile application (app), that would assist carriers in determining why their percentile ranks changed from one month to the next. Such an app could also be a mechanism for collecting more timely data on such things as vehicle miles traveled, number of power units, and type of operation.
Transparency also applies in a somewhat different way to the research community. Researchers would greatly benefit if FMCSA, once the approach presented in Chapter 4 is implemented, could make well-commented code more widely available and if FMCSA could restructure the MCMIS data in a way that would facilitate research by those not adept at complicated ORACLE database structures. This could be done in a way that protects personally identifiable information.
RECOMMENDATION: The Federal Motor Carrier Safety Administration (FMCSA) should structure a user-friendly version of the Motor Carrier Management Information System data file used as input to the Safety Measurement System (SMS) without any personally identifiable information to facilitate its use by external parties, such as researchers, and by carriers. In addition, FMCSA
should make user-friendly computer code used to compute SMS elements available to individuals in accordance with reproducibility and transparency guidelines.
WIRELESS ROADSIDE INSPECTIONS
FMCSA is currently field testing technologies in three states that can identify CMVs and violations concerning registration, hours of service, licensing compliance, and some safety violations. A wireless inspection report (WRI) would be sent to inspectors to enhance their ability to identify noncompliant CMVs. The field test includes multiple vehicles from multiple motor carriers in multistate corridors. A wireless inspection will require modifying existing telematics systems in CMVs. The goal of using the wireless inspection technology is to carry out inspections as vehicles pass at speed so that compliant trucks would not have to stop for an inspection. Provided such telematics are fitted on to all trucks, WRIs will enable collection of some inspection data on all CMVs instead of the current system where a selected set of CMVs are pulled up for inspection, thereby reducing selection effects. As the U.S. Government Accountability Office (2014) pointed out, this could help a great deal in the assessment of small carriers for which there are currently little inspection data generally available.


