
5
Extensions of and Implementation of the Item Response Theory Model to the Safety Measurement System
This chapter discusses issues related to the proposed model in Chapter 4, including how to “rank” carriers using an approach that incorporates both the safety score and its uncertainty. We also discuss issues brought up earlier in the report regarding absolute versus relative ranking of carriers and the relative merits of stratifying versus model-based adjustment for carrier characteristics (e.g., size and whether the carrier is a passenger carrier).
A NEW APPROACH FOR RELATIVE RANKING OF CARRIERS
A key drawback of the current approach to assign safety scores is that there is no quantification of uncertainty in the scores. That is, the deterministic algorithm used to produce Behavior Analysis and Safety Improvement Categories (BASICs) does not take into account the sources of variation that are inherent to the data collection process (e.g., whether or not a carrier gets inspected on a particular trip), including the fact that some items may be found in violation even among the safest carriers (e.g., brake lights may have gone out by chance just prior to the inspection). Given the sources of variation, the ranking of a carrier’s true safety measure, relative to other carriers, is not known for certain. The modeling strategy acknowledges variability by modeling the number of inspections and whether violations are present as random variables.
In developing a ranking system, it is important to acknowledge where a score lies in the distribution of scores across carriers (e.g., does the score
lie in the upper 20% of bad scores) and how likely it is to truly fall in this tail. The model-based approach introduced in Chapter 4 estimates a score for each carrier and enables the calculation of uncertainty estimates about the numeric value of the score, and where the score lies relative to other carriers. The level of uncertainty depends in part on the number of inspections available for a carrier. Another factor contributing to uncertainty is the frequency with which items are found in violation. The current Safety Measurement System (SMS) partially recognizes uncertainty by establishing “data sufficiency” standards, with the consequence of not being able to calculate scores for a substantial portion of carriers with few inspections or violations present in the Motor Carrier Management Information System (MCMIS) data. Instead, we propose using model output to quantify the uncertainty, and include the uncertainty as part of the ranking approach.
Consider an example with 10 carriers and an assumption that the Federal Motor Carrier Safety Administration (FMCSA) takes action on the worst 20 percent of carriers. In this example, two carriers with the worst safety scores will be identified but a third will not. Now assume the score of the third-ranked carrier is very precise but the score of the second-ranked carrier is very imprecise. Figure 5-1(a) illustrates the estimated scores and uncertainty about the scores for these three hypothetical carriers. Uncertainty is important in ranking carriers; specifically, what the score is and how precisely is it estimated. We suggest computing an adjusted “score” that quantifies, via a probability, how likely a carrier is to truly be among the worst carriers. Such an adjusted score incorporates (implicitly) both the “estimated” score and its uncertainty.
In the context of our modeling approach in Chapter 4, the newly proposed adjusted score would be the following posterior probability:
| Si = Prob(θi ∈ bottom q% of scores|data) | (5-1) |
where as before, θi is a latent variable that measures the “safeness” of a carrier. The probabilities in Equation (5-1) would be ranked so that if a point estimate of θi is in the top q percent of worst scores, but there is a lot of uncertainty, it may not be in the top q percent of posterior probabilities as illustrated in the example above. These probabilities are also illustrated in Table 5-1. For simplicity, we focus on five carriers to determine the two worst (i.e., the 40th percentile). Table 5-1 shows that based on the estimated scores, ![]() , the two worst carriers are Carriers 1 and 2. However, there is a lot of uncertainty about the score of Carrier 2. Its probability of being in the bottom two is 60 percent, but the carrier with the slightly better score (Carrier 3) has a 96 percent probability of being one of the two worst, as shown in Figures 5-1(b) and 5-1(c). This happens
, the two worst carriers are Carriers 1 and 2. However, there is a lot of uncertainty about the score of Carrier 2. Its probability of being in the bottom two is 60 percent, but the carrier with the slightly better score (Carrier 3) has a 96 percent probability of being one of the two worst, as shown in Figures 5-1(b) and 5-1(c). This happens
TABLE 5-1 Relative Scores Based on Point Estimates versus a Combination of Point Estimate and Uncertainty for Five Hypothetical Carriers
| Carrier (i) | P (θi ∈ bottom 40% of scores) (rank) | |
|---|---|---|
| 1 | 1.50 (1) | 0.99 (1) |
| 2 | .65 (2) | 0.60 (3) |
| 3 | .45 (3) | 0.96 (2) |
| 4 | .20 (4) | 0.23 (4) |
| 5 | –.10 (5) | 0.10 (5) |
because there is more uncertainty about the true safety score of Carrier 2 and less uncertainty about Carrier 3.
We recommend the adjusted score be used as it incorporates both the point estimate and its uncertainty into a single value. (Instead of computing the tail area of the posterior distribution of a carrier’s measure, one could also sample from the posterior distribution many times, and for each posterior sample, report, for example, a 95% posterior interval for each carrier’s rank).
ABSOLUTE RANKING
As discussed in Chapter 2, several stakeholders expressed concern to the panel about relative rankings. For example, if the industry has large improvements and the same percentiles are used for “action,” it will result in acting upon safer carriers. If the goal is to continuously improve carrier safety, given fixed resources, then the relative approach can work as intended. On the other hand, if overall carrier safety in the industry improves, there might be interest in allocating resources to other safety initiatives. In this case, an absolute approach that would send fewer letters and initiate fewer investigations might be desired.
An absolute approach would require “connecting” the θi’s (which are by construction a relative score centered around zero) to a future outcome measure. We suggest some possible ways to do this next.
The safety scores, θi, are computed over 2-year windows. We can regress the number of carrier crashes in the subsequent year on θi using a Poisson regression, similar to that used for the number of inspections in Chapter 4, but with θi entered as a regressor. So we assume the rate
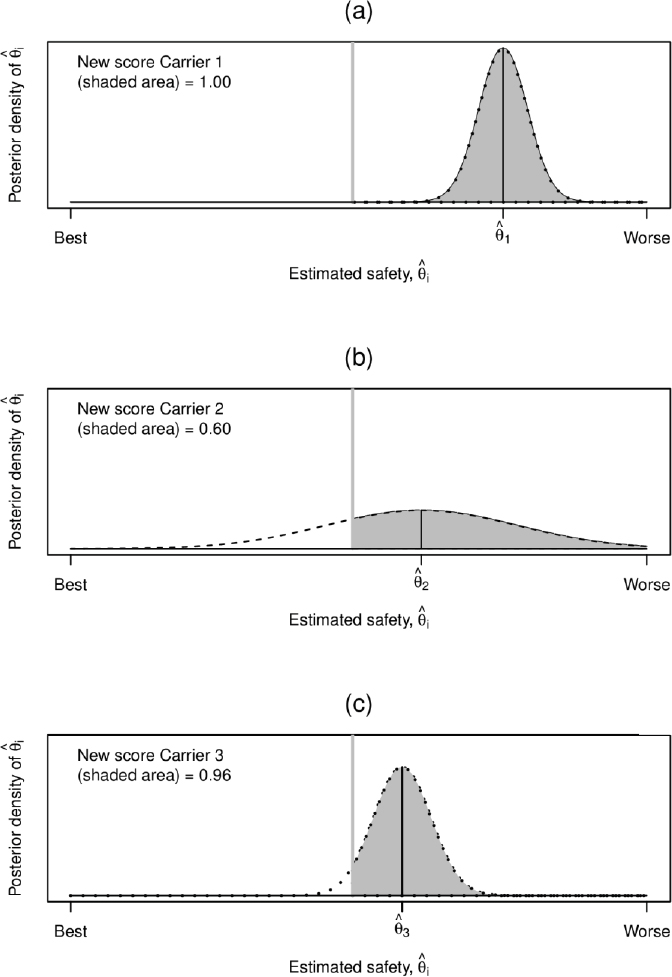
NOTE: Panel (a) corresponds to a hypothetical carrier (Carrier 1) with a bad safety score, θi and not a lot of uncertainty. As such, the probability of being above the cutoff (denoted by the vertical line to the left of
 ) is quite high (almost 1.0). So we are quite sure this is a bad carrier. Panel (b) corresponds to a hypothetical
parameter of the Poisson distribution, λic, varies smoothly with the safety score θi. In particular:
Ci ~ Poisson (Ei λic)
log (λic) = f(θi; ξ)
where Ci is the number of crashes in the subsequent year, Ei is the corresponding vehicle miles traveled (VMT), and λic is the crash rate, with f(·) a smooth (monotone) function of θi parameterized by ξ. An absolute cutoff for θi could be chosen based on the risk of a future crash per 1,000,000 VMTs being above a certain rate determined by FMCSA. Other possible future outcome measures might include subsequent year inspections. Computation of the absolute rate for a carrier, Ri, would be as follows:
| Ri = ∫∫exp(f(θi; ξ))dF(ξ|sdata)dF(θi|data) | (5-2) |
where sdata is the subsequent year data and data is the 2-year window data. This expression takes the smoothed rate, exp(f(θi; ξ)), which is parametrized by ξ, averages over the uncertainty associated with the safety score (via the integration over F(θi|data) and over the parameters of the smoothing function, ξ, via the integration over F(ξ|sdata). Equation (5-2) produces an updated crash rate for a carrier given that carrier’s estimated latent risk of a crash and its VMT, which can then serve as an absolute metric on which decisions for interventions can be based.
While this has the look of a model of future crash risk, we are not proposing this as a model of crash risk, but as a construct that is dependent on θi, the latent safety parameter, that is an absolute measure of
_______________________________
 than Carrier 1, but with considerably more uncertainty, which results in the probability of being above the cutoff of only 60 percent. Panel (c) corresponds to a hypothetical carrier with a safety score slightly below Carrier 2, but with more certainty about this score, resulting in a high probability of exceeding the cutoff (0.96). Rather than rank carriers based on their posterior mean the panel’s proposed ranking takes into account both the mean safety score and the uncertainty around the estimated score. Carriers are ranked based on their probability of exceeding a cutoff, calculated as the area under the curve to the right of the gray vertical line. The top panel plots the distribution of the safety score for hypothetical Carrier 1, which has both a bad safety score and a high probability of exceeding the cutoff. While Carrier 2 (middle panel) has a slightly worse score than Carrier 3 (bottom panel), the precision for Carrier 3’s score is greater such that the newly proposed ranking Si is higher (worse) for Carrier 3 compared to Carrier 2.
interest to use for decisions on interventions. In fact, we can regress any outcome of interest, such as number of crashes in the subsequent year, on θi using Poisson regression. The point here is that the outcome of interest is regressed on θi.
We could also compute posterior probabilities, Pi, similar to those in Equation (5-1), as shown in Equation (5-3). Here the probability is in terms of the rate for carrier i being above a cutoff and the carrier is “flagged” only if its posterior probability itself exceeds some value, for example, 0.80.
| Pi = ∫∫ P(exp(f(θi,ξ))>cutoff)dF(ξ|sdata)dF(θi|data) | (5-3) |
Equation (5-3) averages over uncertainty in the same way as Equation (5-2). By using an absolute approach, the number of carriers requiring action could be reduced, carriers would be “rewarded” for making safety improvements, and resources could potentially be allocated to improve safety in other ways.
It would be worthwhile to also explore a hybrid measure that combines the proposed relative and absolute measures.
STRATIFICATION VERSUS MODEL-BASED ADJUSTMENT
Another important issue is being sure to compare sufficiently similar carriers and not to inappropriately compare different types of carriers.
One way to do this is to stratify (e.g., on the number of power units). However, stratifying on the outcome (e.g., the number of violations) should be avoided. Clearly, stratifying based on the size of the carrier or on the type of carrier (e.g., passenger carrier or not) has merit. However, there are problems with stratification, as outlined below. An alternative would be to adjust for carrier characteristics that influence the inspection rate (such as size or whether it is a passenger carrier) within the model. Referring to Chapter 4, these characteristics could be entered into the log-linear models estimating inspection rate (λij) described in Equations (4-2) and (4-7) and their analogs.
Below we provide a list of potential issues and which approach is preferred. We discuss stratification (S) or model-based adjustment (M) for each issue. In particular, M = S corresponds to the two approaches being equivalent, M > S corresponds to the model-based approach being preferred, and M < S corresponds to stratification being preferred:
- (M = S): only comparing similar carriers
- (M < S): without explicit stratification, it will be very difficult for small carriers to be classified as “unsafe” given their large uncer-
TABLE 5-2 Considerations in Deciding between Stratification and Regression Adjustment
| Issue | Preferred Approach |
|---|---|
| Only Comparing Similar Carriers | Equivalent |
| Identifying Small Carriers for Intervention | Stratification |
| Avoiding Discontinuities in Scores | Model-based |
| Avoiding Arbitrary Cutpoints | Model-based |
| Increasing Precision | Model-based |
-
tainty relative to large carriers (given the approach advocated above to rank carriers)
- (M > S): “discontinuities” on the strata boundaries. For example, adding one power unit can move a carrier into a different strata
- (M > S): the “cutpoints” for the strata are often, to some extent, somewhat arbitrary
- (M > S): given that the model-based approach uses all the carrier data simultaneously, safety scores will be estimated more precisely (i.e., less uncertainty)
The above issues that differentiate stratification from model-based adjustment need to be considered in deciding whether or not to stratify. They are summarized in Table 5-2. We also note that the issues in stratification of arbitrary cutpoints and score discontinuities might be lessened to some extent by using dynamic strata (see Federal Motor Carrier Safety Administration, 2014).
IMPLEMENTATION ISSUES
Clearly, the proposed Bayesian IRT model, which involves use of 20–30 million observations and hundreds of variables to estimate hundreds of model parameters is something that requires very specific expertise, usually found in academic statisticians who carry out research on these specific models. The sparsity of data and other aspects of the problem are likely to raise some computational complexities that would require software development. The model development costs will therefore involve contracting with a small group expert in these models. However, once developed, FMCSA staff would be very capable of maintaining the model, including refitting parameter estimates, conducting model validation exercises, and incorporating improved inputs. Finally, given
that the IRT model, like SMS, is sensitive to outlying values in MCMIS, FMCSA should consider institution of edit routines to identify discrepant submissions, and imputation procedures to fill in for input values that are missing or fail the edits.


