
7
Intake-Response Relationships and Dietary Reference Intakes for Chronic Disease
The existence of a causal relationship between intake of a nutrient or food substance (NOFS) and risk of a chronic disease (see Chapter 6) is necessary, but not sufficient to identify intakes that reduce (or increase) chronic disease risks. Whether Dietary Reference Intakes (DRIs) can be recommended depends upon the availability of identifiable and quantitative intake-response relationships. Risks of chronic diseases will typically be expressed as relative risks (RRs), and intakes may be expressed as daily exposures to a food substance, cumulative exposures over specified periods of time, or as a measured biomarker of intake exposure. RRs may be shown to increase or decrease in relation to intake. In some cases, it is possible that, for the same substance, RRs may decrease over a given range of intakes and then increase over another range. This is only one of the many challenges when characterizing intake-response relationships.
Options for Basing Dietary Reference Intakes (DRIs) on Chronic Disease Endpoints: Report from a Joint US-/Canadian-Sponsored Working Group (i.e., the Options Report) provides a comprehensive review of issues that arise in identifying and applying intake-response relationships (Yetley et al., 2017, Appendix B) and offers a series of options for resolving them so that if certainty in the relationship exists, chronic disease DRIs can be recommended. Complementing Chapter 6—which addresses whether a causal relationship exists—this chapter provides recommendations on scientific and methodological considerations regarding the quantitative characterization of the intake-response relationship and implications for risk assessment. In addition to all guiding principles in Chapter 6 being applicable
to characterizing intake-response relationships, one guiding principle that applies specifically to quantitative relationships is added in this chapter.
Consistent with the approach for evaluating evidence about causal relationships, the GRADE (Grading of Recommendations, Assessment, Development and Evaluation) system provides guidance for evaluating evidence about the intake-response relationships. However, the GRADE working group has not explicitly addressed or published any documents addressing the specific issue of the credibility of intake-response relationships. The committee also offers commentary and guidance on conceptual challenges raised in the Options Report, such as establishing risk-reductions goals for DRIs based on RR, rather than on absolute risk (the measure traditionally used for DRIs based on deficiency diseases and high intake toxicity) and developing DRIs that take into account various interactions among food substances that may influence risk of chronic disease.
Experience with the application of various methods described in this chapter to characterize the NOFS-chronic disease relationships is limited. Therefore, the recommendations in this chapter should be considered preliminary, subject to revision as experience with their application accumulates and as new scientific evidence emerges relevant to intake-response relationships for chronic diseases. For example, several options were suggested for developing multiple DRIs for a single nutrient, based on different degrees of risk reduction (sometimes referred to in the Options Report as “families of DRI values”). The committee does not recommend this approach because of challenges communicating the DRIs’ interpretation and possible confusion as they are applied by users. Such an option could be reconsidered after experience with chronic disease DRIs accumulates or when there is sufficient experience with the use of risk algorithms that integrate results from multiple indicators. The committee also notes that without significant justification, such as compelling evidence that the benefit of chronic disease reduction greatly exceeds any risk of nutrient deficiency or excess, chronic diseases DRIs should not be recommended at intakes less than the Recommended Dietary Allowance (RDA) or greater than the Tolerable Upper Intake Level (UL). For nutrients with only an Adequate Intake (AI), DRI committees may need to grapple with what quantitative parameters to set.
IDENTIFYING AND DESCRIBING INTAKE-RESPONSE RELATIONSHIPS
This section describes methodologic considerations for modeling and quantifying the intake-response relationship that DRI committees should attend to as they review the analyses conducted (see also the later section on “Examples of Approaches in Nutrition”). Modeling the intake-response
relationship for the purpose of recommending DRIs is a complex and novel situation. Choices made when modeling the relationship (e.g., modeling approach, dietary intake transformations) can lead to bias, and, as DRI committees review the evidence, such choices should be assessed as part of the risk of bias assessment of individual studies or when assessing the appropriateness of the analysis itself (i.e., pooled analysis or meta-analysis). DRI committees should not be constrained by one particular modeling approach, as new methods may emerge that could be optimal for a particular nutrient or chronic disease endpoint.
The Options Report (see Appendix B) recognized that the shape of the intake-response relationship can be quite diverse for various NOFS-chronic disease relationships (see also Chapter 4, where intake may be characterized by a biomarker of intake or by self-report that may have been calibrated using biomarker data). The relationship may be linear or non-linear. For example, the Committee to Review Dietary Reference Intakes for Vitamin D and Calcium (IOM, 2011) reported on several studies showing a U-shaped or reverse J-shaped association of serum 25(OH)D, a biomarker of vitamin D status, and total or all-cause mortality. No firm biological rationale was provided to explain these relationships. However, mortality from a toxic or adverse event is not thought to be the underlying cause. DRI committees will need to determine whether any non-linear relationships, such as U-shaped or J-shaped, are due to the intake-response relationship with the actual disease under investigation or due to adverse events or toxicities. In that sense, although mechanistic data are not directly considered in assessing the certainty of the evidence (see Chapter 6), and it is not, of itself, sufficient for DRI development, having an understanding of the kinetics and dynamics of an NOFS in the body can be of great value to several considerations that are central to DRI recommendations. For example, mechanistic data can be helpful in providing biological plausibility of observations, determining the reliability of nutritional exposure surrogate markers, and understanding plausible shapes to intake-response relationships, including both increases and decreases in chronic disease risks (e.g., Tan et al., 2016).
Characterization of the intake-response relationships (e.g., with more than one chronic disease) will be one of the goals of DRI committees. The ability to quantify how much reduction in chronic disease risk would result from a given change in the intake of an NOFS will depend on the nature of the available data from randomized controlled trials (RCTs) or from observational studies. RCTs test investigator-assigned doses of a treatment (for the purposes of the DRI, a nutrient-based RCT would have one or a few test doses of an NOFS) and test the treatment’s effect on the outcome (ideally, a chronic disease endpoint but measuring a qualified surrogate is useful, see Chapter 5). A successful RCT can draw a cause-effect inference
that the quantifiable level of “NOFS x” tested in the trial reduced “chronic disease (or qualified surrogate) y” by the observed effect size. It is important to note that many RCTs are typically powered for a 10 to 20 percent difference in disease outcomes by treatment arm. The true quantifiable relationship may be at lower or higher values of the nutrient than were tested, and the true effect size in the general population also may be lower or higher, but inferences can be drawn only on what was tested in the trial so this may limit usable information for DRI committees. Nonetheless, RCTs can offer quantifiable, cause-effect data on the intake-response relationship.
Observational studies will have less quantifiable data on the intake-response relationship due to the nature of their design and analysis and residual confounding, but they may have a wider range of intakes that is more similar to the population as a whole (see Chapter 3). Most available observational data will come from prospective cohorts or from case-control studies that are nested within cohorts. Data from these studies are typically presented as the RR or hazard ratio (HR), which compares risk of one intake group relative to another (or across a range of intakes). Box 7-1 provides more information on RR and absolute risk estimates and how they might inform the intake-response relationship. In describing the intake-response relationship, it is particularly important to rely on epidemiological studies where the nutrient intake methodology minimizes the potential for systematic biases (see Chapter 4).
Methodological Considerations
Was the Appropriate Model of the NOFS-Chronic Disease Relationship Selected?
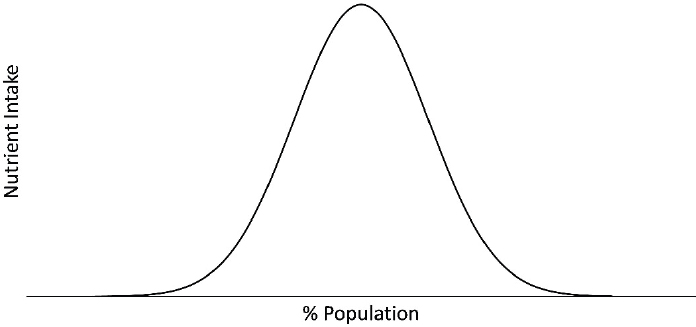
One of the first things to consider in modeling the intake-response relationship is the pattern or nature of the intake distribution. Intake of any one nutrient is almost never zero due to the diverse food supply, which includes an array of micronutrient-enriched and micronutrient-fortified foods. The shape of the nutrient intake distribution infrequently resembles a normal distribution (see Figure 7-1). Rather, the intake distribution is usually skewed and asymmetrical, often with a long tail at the upper end of the intake range. Skewed intake distributions tend to exist for both self-reported dietary exposures and for nutrient biomarker exposures. The manner in which skewed intake data are mathematically transformed may depend on the nature of the analysis. For example, if the intake-response relationship models the intake in quantiles, then transformations may not be necessary because the effect of extreme values or outliers is minimized in such modeling. Multiple methods exist for appropriate data transformation, including natural logarithmic, square root, cubic, and quadratic
transformations (Rosner, 2016). These transformations are often necessary to meet with assumptions of a particular modeling procedure. Intake-response can be estimated by treating the quantiles as ordered, continuous variables and applying an appropriate test for trend across the categories. Alternatively, if the data are suitable for a linear model, and the intake data are modeled as continuous, then interpretation is that for every unit change in X then the expected value of the response Y (outcome) changes by βi, where βi may be either positive or negative. For example, Yu et al. reported that, in the Prevención con Dieta Mediterránea (PREDIMED) trial, every per standard deviation (SD) increase in plasma tryptophan was associated with a 21 percent reduced risk (HR per SD = 0.79; 95% confidence interval [CI]: 0.63-0.98) of incident cardiovascular disease (Yu et al., 2017). This type of linear model may on the surface appear to be a better quantification of the intake-response relationship than are categorical models, but caution should still be applied regarding causal inference (see Chapter 6), as all models have some degree of uncertainty and error.
Were the Measurements of Intake and Chronic Disease Outcome Appropriate?
Important factors that will influence, and potentially bias, the intake-response relationship include the nutrient intake and the chronic disease measures. Reliability and accuracy of those measures is essential when identifying chronic disease DRIs. Many of these measurement issues and approaches to assess the risk of bias of individual studies are covered both in the Options Report as well as in Chapters 4 and 5.
Were Confounding Factors Considered?
DRI committees will need to consider a number of challenges regarding modeling and interpreting intake-response data, regardless of whether the intake exposure data come from self-report, biomarker-calibrated self-report, or biomarkers of intake (see Chapter 4). One such important issue is whether studies have appropriately measured (or measured with reasonable precision) potential confounding variables and whether these variables are included in the modeling. Control for confounding is critical so that spurious associations are not made between an NOFS exposure and a disease outcome. The committee assumes that the systematic review team would have evaluated whether individual studies adjusted for the appropriate confounders during the risk-of-bias assessment. DRI committees could come up with a priori lists of likely confounders of the food substance/outcome relationship.
Then, DRI committees will need to determine whether studies included in systematic reviews, for example, had sufficient control for confounding to be able to evaluate the certainty of a causal relationship DRI (see Chapter 6). As mentioned in Chapter 3, residual confounding due to lack of proper statistical adjustments, untestable assumptions, or measurement errors limits the ability to assess causality in observational studies. Control of confounding is critical because chronic diseases have multiple causes and risk factors and dietary intake is only one of them. Age, sex, family history of a particular chronic disease, physical activity, body weight, body adiposity, socio-economic status, health disparities, intake of other NOFSs (including kilocalories), co-morbid conditions, medication use, and other lifestyle habits (e.g., smoking, use of alcohol) can confound the relationship between the intake and the response, act as effect modifiers, be important mediators of the association under study, or play multiple such roles. The ability to control confounding depends in part on the ability to measure these demographic, health, and lifestyle-related variables with precision, and on the appropriate use of these variables in data analysis, given their multiple possible roles. Sensitivity analysis can rule out uncontrolled confounding. For example, in an analysis of the relationship between a nutrient and a health outcome, such as carbohydrate and risk of type 2 diabetes, a sensitivity analysis could be conducted excluding those with “prediabetes” or evidence of glucose intolerance. If the HRs or RRs do not differ for the models with the entire cohort, then the sensitivity analysis suggests that those excluded populations do not have characteristics that confound the overall analysis. If the disease risk estimates differ substantially, then those populations with confounding characteristics are often excluded from the final models.
Were Other Potential Effects Considered?
Other variables that may influence the intake-response relationship are the gut microbiome and polymorphisms in various metabolizing, transport, or degradation enzymes. However, such factors as genetic characteristics and the microbiome are not commonly measured (or they are measured on a subset of participants only) in most population-based observational studies or RCTs, so they likely contribute to understanding unexplained variation in the intake-response relationship.
Another critical analytic consideration in the intake-response relationship is the time course of the intake exposure and its relationship to the chronic disease. Available data often do not identify the relevant time course or exposure window for most food substances in terms of their relationship to the response. More comprehensive data may be needed to guide DRI committees to better evaluate the likely long latency period between intake and chronic disease endpoints and to help determine whether they should restrict data evaluation to a defined time frame before the response or rely on data with various time exposures of intakes.
Were Interactions with Other Nutrients Considered?
An understanding of nutrient interactions is critical for correct interpretation of the nutrient intake response and risk assessment. The term “nutrient interactions” covers four possible scenarios. First, it is possible that the effect of a nutrient on health differs based on the intake of another nutrient, as in the example of the effects of high dietary sodium intake being mitigated by high potassium intake (Crillo et al., 1994; Sellmeyer et al., 2002; Whelton et al., 1997). Second, two nutrients may compete for absorption or transport, as in the case of zinc and iron, where high iron concentrations can negatively affect zinc absorption or when gamma and alpha tocopherol compete for the same binding protein (Fung et al., 1997; Gutierrez et al., 2009; Meadows et al., 1983; O’Brien et al., 2000; Solomons and Jacob, 1981; Solomons et al., 1983). Third, the composition of the diet may change unavoidably when a macronutrient has been modified. For example, if the amount of total fat in the diet is lowered, the amount of protein or carbohydrate in the diet increases if energy intake is kept constant (Hall et al., 2012). Lastly, the consumption pattern of a nutrient may depend heavily on kilocalorie intake and whether the recommended intake for that nutrient is indexed to kilocalories, as in the case of fiber (i.e., 14 grams per 1,000 calories) (IOM, 2002/2005). Although some interactions are already well-known, such as vitamin D and calcium, the interactions and their effects on health may either involve other nutrients and/or be far more complex.
Rationale for considering interactions between nutrients Nutrient interactions have several implications for the intake response and risk assessment considerations. In the case where the intake requirements for a nutrient may differ depending on another nutrient, the joint effects of those nutrients must be characterized and considered in determining risk for relevant health outcomes. For example, it has been observed that dietary potassium modulates both the pressor and hypercalciuric effects of excessive sodium, and a higher intake of potassium attenuates the adverse effects of sodium on blood pressure, thus suggesting that sodium and potassium guidelines should be considered simultaneously (Crillo et al., 1994; Sellmeyer et al., 2002; Whelton et al., 1997).
In the scenario where nutrient absorption or transport in the circulation depends on the presence of another nutrient, their metabolic relationships must be examined to understand the consequences of any dietary imbalances of the two nutrients and their relationship to chronic disease risk. For example, some prior investigations of vitamin E and chronic disease risk may have overlooked the biological interaction of vitamin E and selenium in the design and interpretation of the data (Lippman et al., 2009).
Similarly, the consequences of interactions must be considered in the context of dietary macronutrient intake. In meal planning and consumption, individuals eat a mix and foods and therefore it is relatively common to encounter interactions between the macronutrients (i.e., fat, protein, and carbohydrates) as well as micronutrients. Consideration of these interactions in intake-response and risk assessment may minimize unintentional consequences of nutritional guidelines for macronutrients. For example, a guideline to lower dietary fat may have an unintentional consequence of leading to an increase in intake of refined carbohydrates if the interactions are not well-described and addressed.
The interactions between nutrients and kilocalories may necessitate the development of guidelines where nutrients are indexed to kilocalories. For example, evidence suggests that dietary fiber from whole foods reduces risk of cardiovascular disease, obesity, and type 2 diabetes (Astrup et al., 1990; Meyer et al., 2000; Rimm et al., 1996; Wolk et al., 1999). Fiber also is important for good digestive health (Aldoori et al., 1994, 1995; Roberts and Veidenheimer, 1990; Watters and Smith, 1990). However, most Americans under-consume dietary fiber and the major sources in the diet are foods that are relatively low in fiber, but are widely consumed, such as white flour and other refined grains (Slavin, 2008). The epidemiological studies that were the basis for the current AI expressed intakes of fiber per 1,000 kilocalories to correct for under-reporting. For this reason, current fiber guidelines explicitly acknowledge the interaction between fiber and calories by indexing fiber to calories (HHS and USDA, 2015). As such,
adherence to the fiber guideline requires consumption of concentrated dietary fiber sources per 1,000 kilocalories of intake.
Considerations when recommending a chronic disease DRI Considerations about nutrient interactions are necessary in every step of the process for recommending chronic disease DRIs. For example, if a nutrient interaction is identified, a key question(s) about nutrient interactions would be included, a systematic review of nutrient interactions would be conducted, the GRADE framework would be applied to the evidence on nutrient interactions, and, if appropriate, a DRI would be established for a chronic disease endpoint that explicitly acknowledges the nutrient interaction and provides appropriate recommendations as needed.
Did Other Factors Contribute to the Chronic Disease?
As noted here and throughout the Options Report, the intake-chronic disease relationship is complicated because intake is rarely the sole risk factor for the outcome of interest. Furthermore, the signal from some nutrients in relation to a particular chronic disease may be strong whereas for others, the signal may be weak but still carry public health importance. Analytic approaches are needed that can reliably parse out the independent, quantitative contribution of nutrient intake and its relationship to the response (e.g., in silico mathematical modeling, systems modeling). DRI committees will need to take into consideration novel analytic procedures that may develop over time.
Examples of Approaches Used in Nutrition
Pooled Studies
Over the past 10 to 15 years, many investigator groups around the globe have worked together on sets of pooled data projects (Key et al., 2010, 2015; Roddam et al., 2008). These are not systematic reviews or meta-analyses. Rather, original data (intake from either self-report or biomarkers and response data) are harmonized and pooled using random effects models. The end result is a larger sample size with a greater number of disease endpoints, thus increasing statistical power. In addition, pooled relative risks can be estimated both for main effects and, importantly for effect modification by age, race/ethnicity, sex, body mass index, and other characteristics where individual studies would not have the statistical power for interaction tests. Other advantages are that less common subtypes of a chronic disease (i.e., triple negative breast cancer) can be examined in a larger number of individuals from harmonized and pooled outcomes
data. This may be particularly important for DRI committees, as intake-response relationships may differ across chronic disease phenotypes. Typically, investigators will present both the individual study estimates as well as the pooled estimates, the former being very useful for examining the overall pattern of the intake-response relationships across multiple populations. Linear models can be used when appropriate. Notably, studies used in pooled analyses can provide heterogeneous data, and appropriate tests for heterogeneity should be performed. Limitations of pooled studies are that measures of both exposures and outcomes often vary across the studies and while data harmonization can be performed, it is often not precise and can add noise to the estimates. These pooled data studies are subject to the same limitations, for example, concerning dietary exposure assessment and confounding, as are the individual studies being pooled.
Systematic Reviews and Meta-Analyses
A second approach to modeling the intake-response relationship for consideration by DRI committees is meta-analyses. A meta-analysis is a systematic review that uses statistical methods to combine quantitatively the results of similar studies in an attempt to allow inferences to be made from the sample of studies and be applied to the population of interest. Meta-analyses began to appear along with systematic reviews more frequently in the 1970s in the medical research field and are now commonly conducted in nutrition research, initially for interventions trials and subsequently for observational studies. Meta-analyses follow very specific data gathering and analysis guidelines, commonly known as PRISMA (Preferred Reporting Items for Systematic Reviews and Meta-Analysis) (Moher at al., 2009). Tools for assessing systematic reviews are covered in Chapter 6.
Strengths of meta-analyses include their ability to increase the power and precision for chronic disease outcomes (or qualified surrogates), reduce problems of over-interpreting individual studies, and provide a summary of strength and consistency in evidence, which is a key component of the Bradford-Hill criteria for causal inference (Hill, 1965). Other strengths of meta-analyses are that they can help answer questions not posed by any one individual study. In the nutrition area, for example, individual studies will typically explore the effect of limited nutrient intake or exposure levels, making it difficult to estimate the intake-response relationship with a single study. However, when a meta-regression of several individual studies is conducted, other analyses become possible, such as examinations of the quantitative intake response-response relationship between the NOFS and a health outcome. Potential limitations of meta-analyses are that the quality of the results greatly depends on the availability of quality studies with low heterogeneity—both clinical heterogeneity, due to variability in
participants, outcomes, or interventions, or intake response, and methodological heterogeneity, due to variability in methods used, such as blinding. Another potential limitation is bias. Bias must be assessed and reported, and PRISMA provides appropriate guidance. Two general types of models have been used in conducting meta-analyses: the fixed-effects model, which assumes that the sole source of variation is within the study, and the more conservative random-effects model, which assumes that study populations and other factors add to the variability. More recently a mixed model, which addresses both types of effects, has been developed (McCullough et al., 2008).
For constructing intake-response curves for nutrients, integrating observational studies may have more utility than integrating RCTs because observational studies typically cover the range of intakes that the general public typically consumes. However, results from these studies are sometimes not as valuable as they could be because of insufficient information comparisons on exposure levels in the different groups and also potential systematic error (see Chapter 4). Observational studies often report odds ratios (ORs) or RR by quantile categories, and the standard meta-analysis cannot accommodate effect estimates from a single study but only high versus low level types of comparisons. As a result, most meta-analyses provide results as “high-low” meta-analyses (comparisons of extreme categories). A key element in conducting the kind of meta-analysis needed to construct intake-response curves has been the availability of models and statistical packages that are suitable for observational nutrition studies. One of the most popular multivariate analysis methodologies to adjust the correlation between effect estimates from a single study was first published by Greenland and Longnecker (1992) and it has been used in nutrition to compare health effects at different levels of nutrients (Kim and Je, 2016) and foods (Aune et al., 2016). Other methods have been used, such as meta-regression analysis, which allows the modeling of various levels of intake and incorporates the fact that reference values are not zero in nutrition studies (Chung et al., 2016; del Gobbo, 2013; Jiang et al., 2016). A summary of the meta-regression analysis by del Gobbo et al. is in Annex 7-1, as an example of modeling the intake response curves for nutrients. New models and statistical packages continue to be created that could further improve the methodologies in the future.
EVALUATING INTAKE-RESPONSE RELATIONSHIPS: APPLYING PRINCIPLES FROM THE GRADE APPROACH
The certainty of evidence for causality, described in Chapter 6, is necessary, but not sufficient to support development of a DRI. For instance, evidence of an intake-response gradient that can support a causal relation-
ship can be based on categorical intakes (e.g., low, medium, high), whereas evidence for intake-response to support DRI is necessarily quantitative (e.g., mg per day). Moreover, the variability around an intake-response line of best fit may be sufficiently low to conclude that an intake-response relationship exists, but not sufficiently low to justify a specific threshold. Therefore, although in practice questions related to causality and intake-response relationships will be included in the same systematic reviews, a separate evaluation of certainty of evidence is needed for intake-response relationships.
Drawing upon the conceptual and methodologic issues described above and considering the set of options relevant to this chapter described in the Options Report, the committee has developed recommendations (and their rationale) for evaluating the certainty of evidence for intake-response relationships and one guiding principle that is specifically relevant to identify intake-response relationships and set chronic disease DRIs. Although the GRADE working groups have not developed guidance specific to evaluating intake-response relationships, the committee concluded that the underlying principles and process embodied in GRADE are applicable.
The section follows the order of steps and approach to assess the evidence within the GRADE system, and boxes with the options and recommendations of the committee are provided as they apply. However, because the GRADE approach was discussed in detail in Chapter 6, it is not entirely reiterated here. Issues are highlighted below because they are distinct from evaluating causality, such as framing the questions, considering factors that determine certainty in the evidence, and rating the overall certainty in the body of evidence.
Framing the Question
The PICO (population, intervention, comparator, outcome) structure for intake-response has some important differences from the PICO structure for causality. These differences are illustrated graphically in the Venn diagram in Figure 7-2. First, in terms of “intervention” and “comparator,” the PICO for characterizing intake-response relationships will likely be more restrictive in terms of requiring quantitative measures of intake. Second, in cases in which a “piecemeal” (two-stage) approach is being considered, the evidence for causality may require only evaluation of a surrogate marker with outcome, whereas for intake-response, a separate PICO statement(s) may be needed to evaluate the relationship between intake and the surrogate marker. Third, in terms of “outcomes,” only those with “high” or “moderate” (and in some exceptional circumstances, “low”) certainty of a causal relationship would likely be included (see Chapter 6). An additional issue with outcomes involves the use of surrogate markers rather than incidence of disease (see Chapter 5). This issue can be thought of as relating
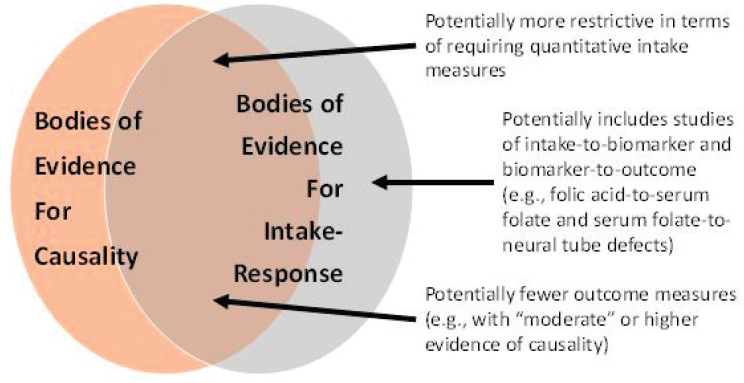
“indirectness” in the GRADE framework, which is discussed separately below.
Considering Factors That Determine Certainty in the Evidence
The following factors within the GRADE approach determine whether the certainty of the evidence can be upgraded. Application to intake-response relationships involves unique questions to consider that are highlighted in these sections.
Risk of Bias of Individual Studies
Risk of bias is defined as the systematic error due to limitations in the study design or execution, or inappropriate analysis. The features discussed under risk of bias for causality in Chapter 6 are applicable to assessing the evidence for the quantitative relationship between an NOFS and a chronic disease. Additionally, the modeling of the intake-response relationship (choice of mathematical form, method for accounting for covariates/confounders) and method for estimating model parameters and their precision or uncertainty also can lead to bias (see the previous section on “Identifying and Describing Intake-Response Relationships”). Furthermore, measurement error in intake estimates can create bias in the magnitude of effect and
also distort the shape of the intake-response relationship (see Chapter 4). This can create differential bias across the range of intakes. Therefore, methodologic considerations described under “Identifying and Describing Intake-Response Relationships” should be considered when evaluating risk of bias for intake-response. Considerations related to uncertainty are discussed further later under “Imprecision.”
Inconsistency of Results
The degree of inconsistency (i.e., the unexplained heterogeneity or variability of study results) in intake-response may differ as a function of intake, among other reasons. For instance, studies may be consistent over one range of intakes but inconsistent over a different range of intake or when assessed in different populations. Because of this added dimension of possible inconsistency, evaluating heterogeneity statistically may be more difficult for intake-response relationships. Circumstances where this might be possible include those when all studies use the same intake-response function (e.g., reporting beta coefficients) or when data from multiple studies can be pooled for re-analysis (e.g., using mixed effects meta-regression) providing that the original measures were assessed with precision and a low degree of bias.
Imprecision
Imprecision is the random error that occurs in studies that results in wide 95 percent CIs around the estimate of the effect. When addressing imprecision in the overall evidence (or other factors for rating down in the context of the GRADE approach), “uncertainty” needs to be addressed. Characterizing uncertainties is ultimately aimed at providing information on the range of possibilities that are consistent with the available data regarding the nature of the intake-response relationship(s). However, as discussed at length in two reports (IOM, 2013; NRC, 2009), while evaluating, assessing, and communicating uncertainties is always necessary, overly complex uncertainty analyses that provide little or no value-added in terms of the ultimate decision should not be pursued.
The precision of the quantitative relationship between nutrient intake and the risk of developing a chronic disease is always limited by the available data. The uncertainties in this relationship are usually disaggregated into two parts: model uncertainty and parameter uncertainty. Model uncertainty refers generally to uncertainty in the mathematical formulation describing the relationship—for instance, a linear model versus an exponential model. Given a specific model’s mathematical formulation, parameter uncertainty refers to uncertainty in the terms that determine the quantita-
tive relationship—for instance, the intercept and slope of a linear model. Most statistical model fitting approaches, including both frequentist and Bayesian methods, address parameter uncertainty through CIs on the model parameters (although covariances are not always fully addressed). Model uncertainty is an area of active research, and approaches include model averaging (where different model forms are given weights that depend on the model fit) (e.g., Fang et al., 2016; Liu et al., 1998), model expansion (where different models are combined or embedded into a larger model with additional parameters), and use of non- or semi-parametric models that are less constrained in terms of their model shape (e.g., Guha et al., 2013).
When sufficient data do not exist about an intake-response relationship directly, a piecemeal (two-stage) approach can be used to recommend chronic diseases DRIs, where information about the level of a surrogate marker that is associated with a chronic disease can be supplemented with data on the dietary intake associated with that level of surrogate marker (see Figure 7-3). In addition to the conventional requirements for an accurate surrogate marker and intake methodology, using this method requires the application of models that can integrate diverse data sets and their associated uncertainties. This approach has been used to infer levels of folic acid intake necessary to avoid the risk of neural tube defects in women of childbearing age (Crider et al., 2014; Marchetta et al., 2015). Briefly, Bayesian statistical methods were used to estimate the relationship between intake of food folate and serum red blood cell (RBC) folate (Marchetta et al., 2015), and separate models were used to estimate the association of serum RBC folate with the risk of neural tube defects using various data sets (Crider et al., 2014). Interpreting the findings together, 450 µg DFEs (dietary folate equivalents) per day for women of childbearing age were estimated to result in optimal RBC folate concentration to prevent neural tube defects in children. Investigators are already attempting to study the relationship between folic acid intake and chronic diseases (e.g., see relationship between folic acid intake and plasma folate in Yang et al., 2010, and plasma folate and
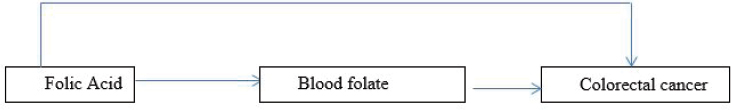
colorectal cancer in Takata et al., 2014, and Neuhouser et al., 2015), and the committee envisions that the piecemeal (two-stage) approach could be pursued in the future for setting chronic disease DRIs. Note, however, that evidence that the relationship between the dietary variable and the disease outcome is completely mediated through the intermediate variable needs to be compelling in using this approach.
However, integration of multiple sources of imprecision can be an additional challenge, particularly if some of them are not quantified. For quantified uncertainties (i.e., with a probability distribution reflecting the likelihood of different values), Monte Carlo simulation is often applied to propagate and combine different types and sources of uncertainties (EPA, 1997). For unquantified uncertainties, sensitivity analyses can be used to understand the impact of different discrete options that reflect a plausible range.
Indirectness of Evidence
Two major sources of indirectness are likely to be at issue for establishing intake-response relationships. The first concerns the use of disease markers of the chronic disease outcome (e.g., surrogate markers); the second concerns the extrapolation of intake-response relationships from studied to unstudied populations. These two issues are discussed in more detail as follows.
Using surrogate markers As explained in Chapter 5, although ideally, DRIs would be determined based on data from chronic disease outcomes, such data on clinical outcomes often are more limited than data on (qualified) surrogate markers. As a result, qualified surrogate markers will necessarily have a significant role in the development of chronic disease DRIs.
The approaches to describing intake-response relationships for qualified surrogate markers and factors such as confounding and inter-individual variability would proceed as outlined earlier in the section titled “Was the Appropriate Model of the Nutrient-Chronic Disease Relationship Selected?” It should be noted, however, that the confounders and covariates for such markers might differ from those for clinical outcomes. These considerations, along with mechanistic studies and analysis (discussed in Chapters 5 and 6), will all contribute to the decision as to whether a down-rating for “indirectness” is warranted. For example, mechanistic data have been used to study the effect of different vitamin A interventions in the kinetics of tissue retinol, a biomarker of vitamin A (Tan et al., 2016). As another example, animal models have been used to study the vascular pathology of Alzheimer’s disease leading to hypothesis about potential surrogate markers (Klohs et al., 2014).
With respect to the options put forth in the Options Report (see Box 7-2), the committee notes that the simplest approach of choosing “a single outcome indicator” is likely to be the most feasible (option 1). Many potential complexities and challenges are involved in considering “multiple indicators of a chronic disease” and “multiple indicators for multiple diseases” (option 2), so the committee is reluctant to recommend these options as a general matter, as they require development of multivariate,
multi-pathway, intake-response models. If there is sufficient experience with the use of risk algorithms or other strong evidence to suggest that multiple indicators point to risk of a chronic disease, then a DRI committee could attempt to integrate the findings into its own work.
The Options Report also raises the possibility that a single food substance may reduce the risk of more than one chronic disease (option 3). The Options Report suggests that this approach might be used only when the level of confidence in the evidence for all of the chronic diseases is similar. When such a situation arises, and the available intake-response data are adequate, there is no special difficulty with recommending reference values for each chronic disease, even when the level of confidence in the evidence for all of the chronic diseases is different; DRI committees should adhere to the approaches spelled out in the following sections for each endpoint. However, an overall DRI across multiple chronic diseases would need to consider the risks and benefits of each chronic disease across the range of intakes, which is discussed later in the section on “Balance Between Desirable and Undesirable Outcomes.”
Extrapolating intake-response data across populations The committee generally holds that a high degree of caution should guide extrapolation in the intake-response data across populations that differ greatly in important underlying risk factors related to the chronic disease (see Box 7-3). The number of factors that influence chronic disease risk can be large and not well characterized quantitatively, and the likelihood of error is substantial. Unless a significant scientific justification can be made, the committee recommends extrapolation of chronic disease DRIs only to populations similar to studied populations in respect to the underlying factors related to the chronic disease of interest. The evidence supporting any departure from this approach should be fully described and should reveal minimal uncertainty, or otherwise be down-rated for “indirectness.”
Publication Bias
As discussed in Chapter 6, publication bias is challenging to assess. Additionally, little or no methodological work has been conducted to evaluate this factor in the context of an intake-response relationship.
Large Magnitude of an Effect
In the GRADE approach, uprating the certainty of the evidence of a causal relationship (e.g., from low to moderate certainty of evidence) when a large effect exists between a nutrient and a chronic disease outcome is typically applied when the body of evidence derives from observational
studies (Guyatt et al., 2011). In the context of an intake-response relationship, the magnitude could also be defined as a “slope” rather than a pairwise comparison between groups. Moreover, for surrogate markers, which tend to be continuous rather than binary outcomes, a “large magnitude” may be expressed in terms of a percentage increase or decrease. These will involve expert judgment on the part of each DRI committee, as “rules of thumb” have not been established for what constitutes a “large magnitude” for either “slopes” or “percentage changes.” Alternatively, such continuous outcomes could be re-expressed as a binary outcome in terms of the risk (OR or RR) of being above versus below a particular cut-point (IOM, 2011). As with rating the evidence for causality, committees will apply their judgements about rating in special cases, for example when a large effect size is seen but the evidence has a serious risk of bias or imprecision.
Intake-Response Gradient
Bodies of evidence that are used to evaluate intake-response relationships would necessarily be adequate to rate up for an intake-response gradient. Without such a gradient, it would be very difficult to establish a chronic disease DRI.
Effect of Plausible Residual Confounding
As was discussed in Chapter 6, when assessing causality, it is possible to change the rating of the certainty of the evidence when it is determined that all plausible confounding of the studies would lead to attenuation of the estimate. In the context of intake-response relationships, this also may be the case, though here the “attenuation” would be related to the intake-response gradient. This factor may differ across the range of intakes, which complicates interpretation.
Rating the Overall Certainty in the Body of Evidence for Intake-Response
In the GRADE approach to assess causality, the certainty in the evidence for a particular outcome is generally designated as the highest level among the bodies of evidence for that outcome (e.g., if both RCTs and observational studies examined blood pressure, then the body of evidence with the highest certainty should be used) (Guyatt et al., 2013). However, this certainty may differ across outcomes (e.g., blood pressure versus stroke), and if several outcomes are deemed “critical,” then the overall evidence would correspond to the outcome with the lowest certainty. In the case of the “piecemeal” (two-stage) approach—when intake-to-biomarker and biomarker-to-clinical outcome relationships are combined—the overall certainty of evidence from intake-to-clinical outcome would correspond to the lowest certainty among the two steps (i.e., weakest link in the chain). Moreover, rating the certainty in intake-response relationships has an additional dimension in that the level of certainty may differ across the range of intakes due to different reasons. For example, the precision of the intake-response estimate might differ across the range of intakes or by differing population characteristics. Differential bias across the range of intakes also can create differences in certainty across intakes. Thus, for each outcome, ranges of intake where the overall certainty differs should be described.
USING GRADE TO MOVE FROM EVIDENCE FOR INTAKE-RESPONSE RELATIONSHIP TO DRI RECOMMENDATIONS
As described in Chapter 6, GRADE provides a framework for moving from evidence to decisions. Existing GRADE guidance is focused on either “binary” (e.g., intervene or not) or a small set of “discrete” recommendations (e.g., use intervention A, B, or C). Specifically, for each recommendation, a number of factors are considered in grading the strength of recommendation (Andrews et al., 2013a,b).
By contrast, recommending a chronic disease DRI involves a continuum of options related to specifying a number or range; the certainty in the evi-
TABLE 7-1 Possible DRIs for Chronic Disease
| Possible DRI for Single Chronic Disease | Description | Region of Intake-Response Relationshipa | Comments |
|---|---|---|---|
| Acceptable Range of Intakes (ARI) | Range of usual intakes of a food substance without increased risk of chronic disease. | Region where slope is flat, outside of which there is increased risk of chronic disease, deficiency, or toxicity. | See green shaded region in Figure 7-4. Analogous to AMDR for macronutrients. Implies the intake should ideally be in this range. |
| Range of Beneficial Increased Intakes (RBII) [Alt: Range where Increased Intake is Beneficial (RIIB)] | Range of usual intakes of a food substance where increasing intake can reduce risk of chronic disease. | Region where slope is negative, outside of which slope is non-negative, or there is increased risk of deficiency or toxicity. | See orange shaded region in Figure 7-4. |
| Range of Beneficial Decreased Intakes (RBDI) [Alt: Range where Decreased Intake is Beneficial (RDIB)] | Range of usual intakes of a food substance where decreasing intake can reduce risk of chronic disease. | Region where slope is positive, outside of which slope is non-negative, or there is increased risk of deficiency or toxicity. | See yellow shaded region in Figure 7-4. |
NOTE: AMDR = Acceptable Macronutrient Distribution Range.
a In each case, defining the region of the intake-response relationship corresponding to the DRI requires judgment required as to what “slope” is small or large enough, and at what confidence level, to consider flat, negative, or positive.
dence might not only vary by nutrient and by disease outcome but by the different nutrient levels. Additionally, it may not become clear what kind of DRI (see possible types of chronic disease DRIs in Table 7-1) would be supported until after the intake-response relationship is evaluated. Therefore, selecting chronic diseases DRIs involves additional decisions related to the type of DRIs, acceptable level of confidence in the intake-response data, and balancing health risks and benefits. The factors considered in rating the certainty of evidence delineated by GRADE are still appropriate, but the committee suggests that they be used more iteratively to determine the most appropriate DRI.
Options for Specifying a DRI for Chronic Disease
The Options Report raises two key issues related to specifying a DRI for chronic disease. The first is a general question as to what types of refer-
ence values (i.e., DRIs) might be established (see Box 7-4). The second is a more focused question as to whether a UL can be established based on increased risks of chronic disease (see Box 7-5). The Options Report contains a lengthy discussion of reference values that would, if implemented, serve to decrease chronic disease risks (i.e., provide health benefits), and offers several options for establishing such DRIs. In general, DRIs might be established at an intake associated with a specified degree of risk reduction, or be described as a range of beneficial intakes.
The Options Report also considers the use of ULs in past DRI development efforts. The use of a UL to deal with situations in which a food substance has been shown to increase chronic disease risks is offered as an option.
Reference Values Associated with Benefit
This section addresses situations in which a substance has been shown to decrease chronic disease risk. The following section addresses substances that have been shown to increase chronic disease risk. The Options Report introduces the difficult problem of interactions among food substances that affect chronic disease risk. Approaches to address these questions are in the previous section on “Was the Appropriate Modeling of the NOFS-Chronic Disease Relationship Selected?” This section will first comment on the reference value for the simplest situation where one substance is associated with one chronic disease (or marker of chronic disease). Although the possible value of using absolute risk measures, described earlier, should not be ignored, the committee’s views on this matter rest for the time being on intake-response relationships in which RR, OR, or HR is the risk measured.
As mentioned in the introduction to this chapter, the committee does not recommend the use of a “family” of reference values due to the lack of experience with developing or implementing DRIs for chronic diseases as well as significant difficulties in describing and communicating uncertainties. Therefore, the committee focuses on the simplest case, one NOFS that is associated with one or various diseases. The committee emphasizes that selecting a DRI for a chronic disease(s), as either a point estimate or as a range of beneficial values, depends upon the availability of intake-response relationships that have been generated from studied populations and then extrapolated to unstudied populations (see in the previous section on “Identifying and Describing Intake-Response Relationships” and Box 7-3). Only when intake-response relationships have been identified with acceptable levels of confidence (as this concept has been described in Box 7-6) can DRIs be recommended.
Once intake-response relationships have been identified with acceptable levels of confidence, the truly difficult tasks involve characterizing
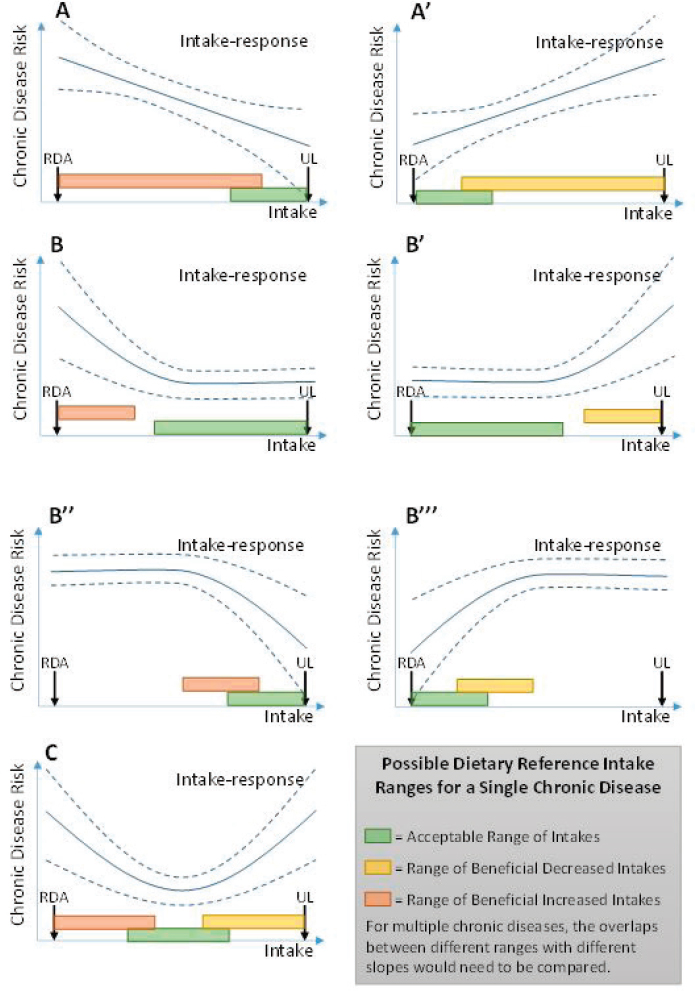
the relevant intake-response relationships—in terms of their shape and the range of intakes over which they apply. In the simplest case, when the relationship appears linear, this characterization could include the slope of the relationship (amount of change in risk for a given change in intake), the range over which this relationship is supported, and the CIs for each of these (see Figure 7-4, panels A and A’). For more complicated intake-response relationships, such as sigmoidal, U-, or J-shaped curves (includ-
ing inverted versions), this characterization could include the range over which the slope is positive, the range over which the slope is negative, the point (if any) at which the slope is zero, any inflection points (maximum or minimum slope), and each respective CI (see Figure 7-4, panels B, B’, B’’, B’’’, and C). These examples encompass the Options Report suggestions of a point estimate at which maximum risk reduction or a range of beneficial intakes is achieved, but additional information could be valuable for derivation and application of DRIs.
Several issues complicate translation of intake-response relationships into a DRI:
- The relationship between intake and a chronic disease is often continuous over a range of intakes, with incremental changes in intake resulting in incremental changes in risk. In such a case, a DRI consisting of a single intake level could only be specified if there is a point of minimum risk with a high degree of certainty.
- The multifactorial nature of chronic disease implies that individuals across the population would have different “baseline” risks, even if their food or nutrient intakes were comparable. Therefore, setting a DRI based on an absolute level of “acceptable” risk would be complicated because the same level of intake may represent a range of different risks across individuals due to factors other than dietary intake, such as family history, adiposity, smoking, genetic characteristics, physical activity, and other characteristics.
- Setting a DRI for chronic disease also may need to consider potential harm from deficiency at the lower end of intake and toxicity at the upper end of intake. Risks and benefits related to multiple chronic diseases introduce further complexity (see the later section on “Balance Between Desirable and Undesirable Consequences of a DRI”).
Based on these issues, the committee envisions that DRIs for chronic disease risk should take the form of a range (option 2, Box 7-4), rather than a single number that estimates mean intakes of individuals and their inter-individual variability (option 1) because of the multifactorial nature of chronic diseases and range of different risks across individuals. Suggestions for how to define such ranges are illustrated in Figure 7-4 and described in Table 7-1. Conceptually, such ranges correspond to regions of the intake-response relationship where risk is at minimum, is decreasing, or is increasing (i.e., slope = 0, negative, or positive). The mathematical approach to such a determination has been discussed under “Identifying and Describing Intake-Response Relationships.” In making decisions about which ranges to establish as DRIs, the magnitude of the risk slope considered necessary to support a DRI recommendation must be considered.
Both reductions and increases in intake may sometimes have unintended consequences (e.g., changes in dietary patterns that alter the intakes of essential nutrients in possibly harmful ways). For this reason, efforts to quantify the risk reductions achieved as a result of specified levels of intake reduction would be valuable. Describing them as absolute risk would be even more valuable. The committee recommends that steps be taken to describe RR (or OR or HR) reductions as a function of intake reduction
(i.e., the slope), to be accompanied by efforts to communicate the public health benefits associated with such reductions. Furthermore, efforts should be made to convert RR to absolute risks, which will give users of these reference values increased understanding of health benefits achieved with a given degree of intake reduction.
ULs and Reduction of Chronic Disease Risk
ULs were introduced in 1997 as a new type of DRI (see Figure 4 in the Options Report, Appendix B) (IOM, 1997). The UL is not a recommended level of intake, but rather a level that, if exceeded, may cause adverse health effects or toxicities. Existing ULs for nutrients are based on various types of studies, including animal toxicity studies, in which adverse health effects have been observed. These effects are generally not chronic diseases, as defined in this report. The methodology used to establish ULs is similar to that used in the safety assessment of chemical toxicity. It is based on the identification of no-observed adverse effect levels (NOAELs) from either observational studies in humans or from animal studies. Various uncertainty factors (largely a matter of expert judgment) are introduced to allow extrapolation from studied populations to the general population, to account for inter-individual variation, and to deal with limitations in the available data. The lack of consistency in defining uncertainty factors might relate to the lack of data available for high-dose nutrient toxicity or to a need to avoid establishing any UL at intakes less than an EAR or an RDA
NOTES: RDA = Recommended Daily Allowance; UL = Tolerable Upper Intake Level; solid line = best estimate of intake-response; dashed lines = confidence intervals of intake-response. See Table 7-1 for descriptions of the possible DRI ranges. In contrast with an EAR, an ARI would not allow calculation of a prevalence of “inadequacy” as is possible with EAR. Users could calculate, however, the prevalence of intakes below (or above) the ARI range.
(see Figure 4 in the Options Report, Appendix B). See the later section on “Balance Between Desirable and Undesirable Consequences of a DRI.”
The traditional approach to developing ULs assumes the existence of a threshold in the observed intake-response curve for toxicity (approximated by the NOAEL), which is said to apply, after the inclusion of uncertainty factors, to the general population. Absolute risk of toxicity is said to increase in some manner, not described quantitatively, as intakes increase above the UL. Although ULs are currently applied as if they represent high-certainty cutpoints between safe and unsafe intakes, the current risk model allows no statement to be made about the magnitude of any risk incurred at intakes greater or less than the UL.
Irrespective of the approach taken to develop DRIs for NOFSs that are demonstrated to increase the risks of chronic diseases, it is important to retain ULs based on traditional toxicity endpoints. Intakes that exceed ULs may well cause harm, and should not be recommended, without significant justification, such as in a hypothetical case where an NOFS has been demonstrated to reduce a chronic disease risk at intakes greater than a UL, and the benefit (perhaps for certain subpopulations) greatly exceeds any risk of toxicity.
The committee supports a variant of options 1 and 2 described in the Options Report (see Box 7-5) and notes that traditional ULs should be retained whether a putative chronic disease DRI is below or above a traditional UL value for that substance. If increased intake of a substance has been shown to increase the risk of a chronic disease, the intake-response relationship should be characterized as to whether the range over which increased risk occurs overlaps with the traditional UL. If the increase in risk occurs only at intakes greater than the traditional UL, then no chronic disease DRI would be required, because avoiding intakes greater than the UL will also avoid increases in chronic disease risk. Therefore, the committee also recommends retaining the traditional UL when DRI values based on chronic disease endpoints are higher than those based on traditional adverse effects (option 1). In cases in which increased intake is associated with increased chronic disease risks at intakes less than the traditional UL (see Figure 7-4 A’, B’, and C and Figure 5b in the Options Report, Appendix B), both the traditional UL and a chronic disease DRI could be retained (a variation of option 2). The rational for retaining both would be that the UL connotes a “bright line” intake limit that should not be exceeded (although the actual definition1 acknowledges the possibility of “residual” risk). On the other hand, the DRI for chronic disease in this case would imply that
___________________
1 “The highest level of daily nutrient intake that is likely to pose no risk of adverse health effects to almost all individuals in the general population [emphasis added] (IOM, 1997, p.4).” See Annex 7-2 for additional discussion of this point.
chronic disease risks will be increased with increasing exposure over the DRI range (see Figure 5b in the Options Report, Appendix B). Imposing a “bright line” (as implied by calling it a UL) in the case of a chronic disease could be misleading and suggest to some that crossing the bright line will lead directly to disease. Such a suggestion is scientifically incorrect, because for chronic diseases, it is the likelihood of developing the disease that is modified by intake. Even if a bright line for a chronic disease could be justified based on a specific “acceptable” level of increased risk, this would not be consistent with how the term “UL” is defined, which implies virtually no risk if the intake is not exceeded.
Possible New Approaches to UL Development
The committee was not asked to offer opinions on the data and methods used to derive ULs, but notes that significant developments have occurred in these areas in the world of chemical risk assessment. Relevant information is included in an Annex 7-2 to this chapter, titled “Possible New Approaches to UL Development.” Recognizing the challenge described in the Options Report—that is, the lack of data and implications for setting chronic disease DRIs higher that the traditional UL—the committee notes the need for better information on the adverse health effects of high intake levels for many NOFSs that may become the subjects of DRIs.
Certainty in Evidence for Intake-Response Relationship
As already mentioned, Chapter 6 describes the use of GRADE in evaluating the existence of a causal relationship between intake of an NOFS and risk of a chronic disease. GRADE also has been applied for assessing intake-response relationships in this chapter. Collecting the body of evidence for evaluating the intake-response relationships would presumably need its own separate PICO (see Figure 7-2). Even when studies are used to evaluate both causality and intake-response relationships, the application of the criteria (e.g., risk of bias) may be different (e.g., a bias may be “not serious” for causality but “serious” for intake-response). Therefore, although the evidence for causality will be presented to the DRI in the form of evidence tables, the evidence for intake-response relationships may be best discussed in a narrative manner. In addition, although the factors considered in rating the certainty of evidence delineated by GRADE are still appropriate, they may be used more iteratively to determine the most appropriate DRI, as mentioned above. Also, as with evaluating causality, DRI committees will apply their judgment as to the number of studies or participants necessary for determining that a quantitative relationship can be established.
The certainty in the evidence is a key factor in moving from evidence
to recommendations in the GRADE framework (Andrews et al., 2013a,b). Box 7-6 shows the three potential approaches in the Options Report for accepting the necessary confidence level in the intake-response relationships for developing DRIs. Any decision regarding the acceptable level of confidence in the underlying scientific data necessary to support DRI development is at least in part a policy decision because it implies selecting a risk reduction goal. With this recognition in mind, the committee offers the following comments. As described previously, moving from the evidence on causation to evidence of quantitative intake-response relationships may introduce additional uncertainties.2 Particularly, reliable and accurate intake data (see Chapter 4) are required to develop useful intake-response relationships. Reliance on RCTs alone (option 1) to establish causal relationships may be problematic for developing intake-response relationships because RCTs often involve only a single intervention dose. Under such circumstances, DRI development may require use of both observational and experimental data, perhaps in combination.
The committee concludes that in describing quantitative intake-response relationships, a thorough description of the scientific uncertainties associated with them is essential, as discussed previously under “Imprecision.” Once uncertainties in the analyses are described, decisions can be made regarding the level of uncertainty that is tolerable in specific cases.
Although in general there should be at least “moderate” certainty in range(s) selected as chronic disease DRIs (option 2), the level of uncertainty considered tolerable in DRI decisions may be different in situations in which intake of an NOFS increases chronic disease risk than in those in which risk is decreased. Opinions on whether it is more appropriate to be cautious (accept greater uncertainty) when disease risk is increased than when it is decreased may differ, and, therefore the committee will not offer a specific opinion on this question. What is essential is that in making DRI recommendations, the scientific uncertainties associated with the recommendation and the reasoning behind their acceptance must be made completely transparent. Recognizing the challenges in integrating of multiple sources of imprecision (see the previous section “Considering Factors That Determine Certainty in the Evidence”), a piecemeal (two-stage) approach is potentially feasible (option 3).
Finally, as already mentioned and depicted in Figure 7-4, relationships between nutrient intake and disease outcomes are not always linear and can be J-shaped, U-shaped, or inverted U-shaped. For example, the fact that very low levels of intake may lead to insufficiency and very high levels of intake may lead to toxicities is typically shown in an inverted U curve.
___________________
2 The uncertainties referred to here do not include those introduced when extrapolating from study populations to other populations.
Regarding evidence related to a specific nutrient and non-linear relationships, DRI committees will need to carefully evaluate the data presented in individual studies and in the systematic reviews. In some cases, non-linear relationships will be biologically plausible, and well-conducted studies that meet GRADE criteria for at least moderate evidence will support the shape of the relationship between the nutrient and the disease or the surrogate endpoint. In other studies, however, the non-linear relationship will seem paradoxical to the biological understanding of both the nutrient and the disease. Still other cases may have limitations in study designs, and the strength of the evidence using GRADE (see especially Chapter 6) could limit the plausibility of potential non-linear relationships. DRI committees will need to use the totality of the evidence available to them to critically evaluate these issues.
Balance Between Desirable and Undesirable Consequences of a DRI
The consequences of a particular choice of DRI need to be evaluated in terms of potential for both desirable and undesirable consequences, consistent with the GRADE evidence to recommendations framework. It is essential that the balance be considered on the basis of absolute risk, as the RR for different endpoints may be very different in terms of actual number of cases. Several issues specific to DRIs for chronic disease need to be considered, including overlaps between benefits and harm.
Overlaps Between Benefits and Harm
Deficiency, toxicity, and multiple chronic diseases need to be considered when balancing benefits and harms. Several scenarios can be anticipated. The simplest would be when chronic disease risk increases with intake, and it would be possible, albeit remote, that recommendations to reduce intake will result in intakes that result in deficiency. A chronic disease DRI, therefore, should never go below the RDA.
In situations where one might reach toxicity levels, the solutions may be more complicated. Even what seems to be a relatively simple choice—avoiding proposing any DRI range that exceeds the UL—becomes unclear when a situation similar to that depicted in Figure 7-4, panels A and B’’, occurs for chronic disease. Note that the risk of disease would continue to decline at intakes well above the UL. Thus, cutting off the range of beneficial intakes at the UL would result in the loss of significant benefits, perhaps for one subpopulation; if the risk of toxicity at and above the UL is poorly documented or not well described (as is sometimes the case), it would seem counterproductive not to extend the DRI (range of beneficial intakes) to levels greater than the UL (assuming the risk reductions achieved in that range
are adequately documented and have minimal bias). Of course, if serious toxicity at levels greater than the UL can be adequately documented, cutting off the range of beneficial intakes at the UL would probably be necessary. As mentioned previously and described in Annex 7-2, this situation can be ameliorated by using more sophisticated methods for deriving the UL that provide an intake-response relationship for toxicity rather than a single “bright line” point estimate.
A similar situation exists when available evidence relates to more than one chronic disease, but the slopes differ for the intake-response relationships. In cases in which a substance has been shown to increase the risk of one chronic disease and to decrease the risk of another, the first step should be the identification of those sections of the two ranges that do not overlap (taking into account the variance and other uncertainties in these sections). These two “sections” could conceivably become DRIs, one for benefit (disease A) and one for risk (disease B). The UL would, as a first step, become another limit on the ranges.
Among the three options in the options report (see Box 7-7), option 1 does not provide a satisfactory response because cases may occur where avoid an overlap between beneficial intakes and intakes associated with adverse events is simply not possible. Option 2 requires committees to determine a minimum level of severity and risk reduction targets, which is generally considered to be a policy decision. Although models for dealing with competing health risks and benefits have been developed (see Box 7-8), which attempt to achieve a type of “balancing” of the two by assigning various factors to account for differing severities and other disease characteristics (including costs of treatment) in order to develop some common measure of impact, conducting such an analysis might be beyond what is expected of a DRI committee. For example, even if sources of information exist (e.g., primary studies examining population values and preferences or numerical population impact, focus groups organized by the guideline producers, or other) ranking relative importance of health outcomes may be challenging. In addition, other factors included in certain models (e.g., resources) are within the purview of policy decisions.
If the above cannot be achieved, then the best approach is simply descriptive (option 3), that is, description of the diseases and their severities, the magnitudes of risk increases and decreases over various ranges of intakes, and other factors that would allow maximum utility and flexibility for users of the information. In making their conclusions, however, DRI committees should explicitly specify the certainty in the evidence used to develop the DRI and the populations and other circumstances to which it applies. In the case of chronic disease DRIs, committees will likely find that certainty of evidence for intake-response relationships and the balance between desirable and undesirable outcomes are the most influential fac-
tors and transparency in the thinking process and rationale is required. For example, in addition to differences in populations, DRI committees should consider the possibility that certainty in the evidence may differ depending on the ranges of intake. Guiding Principle 14 was developed to emphasize the importance of describing all uncertainties when characterizing intake-response relationships (see Box 7-9).
POLICY CONSIDERATIONS AND IMPLEMENTATION OF DRI RECOMMENDATIONS
Under the GRADE framework, all recommendations are accompanied by a strength of recommendation classification of “strong” or “weak” based on consideration of four factors established in earlier GRADE writings (magnitude of effects, uncertainty, values and preferences, cost) (Guyatt et al., 2013). Subsequently, GRADE has presented evidence to decision frameworks that include equity, feasibility, and acceptability. However, DRI committees’ charges relate only to health outcomes, and, as explained in Chapter 1, policy considerations, and values and preferences related to quality of life (e.g., taste, convenience), equity considerations, and considerations of cost and resources that might ensue from chronic disease DRIs are outside of the scope of DRI committees. Instead, such considerations will be taken into account in the subsequent development of nutrition policy.
REFERENCES
Aldoori, W. H., E. L. Giovannucci, E. B. Rimm, A. L. Wing, D. V. Trichopoulos, and W. C. Willett. 1994. A prospective study of diet and the risk of symptomatic diverticular disease in men. Am J Clin Nutr 60(5):757-764.
Aldoori, W. H., E. L. Giovannucci, E. B. Rimm, A. Ascherio, M. J. Stampfer, G. A. Colditz, A. L. Wing, D. V. Trichopoulos, and W. C. Willett. 1995. Prospective study of physical activity and the risk of symptomatic diverticular disease in men. Gut 36(2):276-282.
Andrews, J., G. Guyatt, A. D. Oxman, P. Alderson, P. Dahm, Y. Falck-Ytter, M. Nasser, J. Meerpohl, P. N. Post, R. Kunz, J. Brozek, G. Vist, D. Rind, E. A. Akl, and H. J. Schunemann. 2013a. GRADE guidelines: 14. Going from evidence to recommendations: The significance and presentation of recommendations. J Clin Epidemiol 66(7):719-725.
Andrews, J. C., H. J. Schunemann, A. D. Oxman, K. Pottie, J. J. Meerpohl, P. A. Coello, D. Rind, V. M. Montori, J. P. Brito, S. Norris, M. Elbarbary, P. Post, M. Nasser, V. Shukla, R. Jaeschke, J. Brozek, B. Djulbegovic, and G. Guyatt. 2013b. GRADE guidelines: 15. Going from evidence to recommendation-determinants of a recommendation’s direction and strength. J Clin Epidemiol 66(7):726-735.
Astrup, A., E. Vrist, and F. Quaade. 1990. Dietary fibre added to very low calorie diet reduces hunger and alleviates constipation. Int J Obes 14(2):105-112.
Aune, D., N. Keum, E. Giovannucci, L. T. Fadnes, P. Boffetta, D. C. Greenwood, S. Tonstad, L. J. Vatten, E. Riboli, and T. Norat. 2016. Whole grain consumption and risk of cardiovascular disease, cancer, and all cause and cause specific mortality: Systematic review and dose-response meta-analysis of prospective studies. BMJ 353:i2716.
Bansback, N., A. R. Hole, B. Mulhern, and A. Tsuchiya. 2014. Testing a discrete choice experiment including duration to value health states for large descriptive systems: addressing design and sampling issues. Soc Sci Med 114:38-48.
Chung, M., A. M. Tang, Z. Fu, D. D. Wang, and S. J. Newberry. 2016. Calcium intake and cardiovascular disease risk: An updated systematic review and meta-analysis. Ann Intern Med 165(12):856-866.
Cirillo, M., M. Laurenzi, W. Panarelli, and J. Stamler. 1994. Urinary sodium to potassium ratio and urinary stone disease. The Gubbio Population Study Research Group. Kidney Int 46(4):1133-1139.
Crider, K. S., O. Devine, L. Hao, N. F. Dowling, S. Li, A. M. Molloy, Z. Li, J. Zhu, and R. J. Berry. 2014. Population red blood cell folate concentrations for prevention of neural tube defects: Bayesian model. BMJ 349:g4554.
Del Gobbo, L. C., F. Imamura, J. H. Wu, M. C. de Oliveira Otto, S. E. Chiuve, and D. Mozaffarian. 2013. Circulating and dietary magnesium and risk of cardiovascular disease: A systematic review and meta-analysis of prospective studies. Am J Clin Nutr 98(1):160-173.
Elkin, E. B., A. J. Vickers, and M. W. Kattan. 2006. Primer: Using decision analysis to improve clinical decision making in urology. Nat Clin Pract Urol 3(8):439-448.
EPA (U.S. Environmental Protection Agency). 1997. Guiding principles for Monte Carlo analysis. EPA/630/R-97/001. Washington, DC: Risk Assessment Forum, U.S. Environmental Protection Agency.
Fang, X., R. Li, H. Kan, M. Bottai, F. Fang, and Y. Cao. 2016. Bayesian model averaging method for evaluating associations between air pollution and respiratory mortality: A time-series study. BMJ Open 6(8):e011487.
Fung, E. B., L. D. Ritchie, L. R. Woodhouse, R. Roehl, and J. C. King. 1997. Zinc absorption in women during pregnancy and lactation: A longitudinal study. Am J Clin Nutr 66(1):80-88.
Gail, M. H., L. A. Brinton, D. P. Byar, D. K. Corle, S. B. Green, C. Schairer, and J. J. Mulvihill. 1989. Projecting individualized probabilities of developing breast cancer for white females who are being examined annually. J Natl Cancer Inst 81(24):1879-1886.
Greenland, S., and M. P. Longnecker. 1992. Methods for trend estimation from summarized dose-response data, with applications to meta-analysis. Am J Epidemiol 135(11): 1301-1309.
Guha, N., A. Roy, L. Kopylev, J. Fox, M. Spassova, and P. White. 2013. Nonparametric Bayesian methods for benchmark dose estimation. Risk Anal 33(9):1608-1619.
Gutierrez, A. D., D. G. de Serna, I. Robinson, and D. S. Schade. 2009. The response of gamma vitamin E to varying dosages of alpha vitamin E plus vitamin C. Metabolism 58(4):469-478.
Guyatt, G. H., A. D. Oxman, S. Sultan, P. Glasziou, E. A. Akl, P. Alonso-Coello, D. Atkins, R. Kunz, J. Brozek, V. Montori, R. Jaeschke, D. Rind, P. Dahm, J. Meerpohl, G. Vist, E. Berliner, S. Norris, Y. Falck-Ytter, M. H. Murad, H. J. Schunemann, and Grade Working Group. 2011. GRADE guidelines: 9. Rating up the quality of evidence. J Clin Epidemiol 64(12):1311-1316.
Guyatt, G., A. D. Oxman, S. Sultan, J. Brozek, P. Glasziou, P. Alonso-Coello, D. Atkins, R. Kunz, V. Montori, R. Jaeschke, D. Rind, P. Dahm, E. A. Akl, J. Meerpohl, G. Vist, E. Berliner, S. Norris, Y. Falck-Ytter, and H. J. Schunemann. 2013. GRADE guidelines: 11. Making an overall rating of confidence in effect estimates for a single outcome and for all outcomes. J Clin Epidemiol 66(2):151-157.
Hall, K. D., S. B. Heymsfield, J. W. Kemnitz, S. Klein, D. A. Schoeller, and J. R. Speakman. 2012. Energy balance and its components: Implications for body weight regulation. Am J Clin Nutr 95(4):989-994.
HHS and USDA (U.S. Department of Health and Human Services and U.S. Department of Agriculture). 2015. 2015-2020 Dietary Guidelines for Americans. 8th Edition. http://health.gov/dietaryguidelines/2015/guidelines (accessed October 3, 2017).
Hill, A. B. 1965. The environment and disease: Association or causation? Proc R Soc Med 58:295-300.
IOM (Institute of Medicine). 1997. Dietary Reference Intakes for calcium, phosphorus, magnesium, vitamin D, and fluoride. Washington, DC: National Academy Press.
IOM. 2002/2005. Dietary Reference Intakes for energy, carbohydrate, fiber, fat, fatty acids, cholesterol, protein, and amino acids. Washington, DC: The National Academies Press.
IOM. 2006. Valuing health for regulatory cost-effectiveness analysis. Washington, DC: The National Academies Press.
IOM. 2011. Dietary Reference Intakes for calcium and vitamin D. Washington, DC: The National Academies Press.
IOM. 2013. Environmental decisions in the face of uncertainty. Washington, DC: The National Academies Press.
Jiang, R., A. Botma, A. Rudolph, A. Husing, and J. Chang-Claude. 2016. Phyto-oestrogens and colorectal cancer risk: A systematic review and dose-response meta-analysis of observational studies. Br J Nutr 116(12):2115-2128.
Key, T. J., P. N. Appleby, G. K. Reeves, A. W. Roddam, and Endogenous Hormones Breast Cancer Collaborative Group. 2010. Insulin-like growth factor 1 (IGF1), IGF binding protein 3 (IGFBP3), and breast cancer risk: Pooled individual data analysis of 17 prospective studies. The Lancet Oncol 11(6):530-542.
Key, T. J., P. N. Appleby, R. C. Travis, D. Albanes, A. J. Alberg, A. Barricarte, A. Black, H. Boeing, H. B. Bueno-de-Mesquita, J. M. Chan, C. Chen, M. B. Cook, J. L. Donovan, P. Galan, R. Gilbert, G. G. Giles, E. Giovannucci, G. E. Goodman, P. J. Goodman, M. J. Gunter, F. C. Hamdy, M. Heliovaara, K. J. Helzlsouer, B. E. Henderson, S. Hercberg, J. Hoffman-Bolton, R. N. Hoover, M. Johansson, K. T. Khaw, I. B. King, P. Knekt, L. N. Kolonel, L. Le Marchand, S. Mannisto, R. M. Martin, H. E. Meyer, A. M. Mondul, K. A. Moy, D. E. Neal, M. L. Neuhouser, D. Palli, E. A. Platz, C. Pouchieu, H. Rissanen, J. M. Schenk, G. Severi, M. J. Stampfer, A. Tjonneland, M. Touvier, A. Trichopoulou, S. J. Weinstein, R. G. Ziegler, C. K. Zhou, N. E. Allen, and Endogenous Hormones Nutritional Biomarkers Prostate Cancer Collaborative Group. 2015. Carotenoids, retinol, tocopherols, and prostate cancer risk: Pooled analysis of 15 studies. Am J Clin Nutr 102(5):1142-1157.
Kim, Y., and Y. Je. 2016. Prospective association of sugar-sweetened and artificially sweetened beverage intake with risk of hypertension. Arch Cardiovasc Dis 109(4):242-253.
Klohs, J., M. Rudin, D. R. Shimshek, and N. Beckmann. 2014. Imaging of cerebrovascular pathology in animal models of Alzheimer’s disease. Front Aging Neurosci 6:32.
Lippman, S. M., E. A. Klein, P. J. Goodman, M. S. Lucia, I. M. Thompson, L. G. Ford, H. L. Parnes, L. M. Minasian, J. M. Gaziano, J. A. Hartline, J. K. Parsons, J. D. Bearden, 3rd, E. D. Crawford, G. E. Goodman, J. Claudio, E. Winquist, E. D. Cook, D. D. Karp, P. Walther, M. M. Lieber, A. R. Kristal, A. K. Darke, K. B. Arnold, P. A. Ganz, R. M. Santella, D. Albanes, P. R. Taylor, J. L. Probstfield, T. J. Jagpal, J. J. Crowley, F. L. Meyskens, Jr., L. H. Baker, and C. A. Coltman, Jr. 2009. Effect of selenium and vitamin E on risk of prostate cancer and other cancers: The Selenium and Vitamin E Cancer Prevention Trial (SELECT). JAMA 301(1):39-51.
Liu, C. H., D. B. Rubin, and Y. N. Wu. 1998. Parameter expansion to accelerate EM: The PX-EM algorithm. Biometrika 85(4):755-770.
Marchetta, C. M., O. J. Devine, K. S. Crider, B. L. Tsang, A. M. Cordero, Y. P. Qi, J. Guo, R. J. Berry, J. Rosenthal, J. Mulinare, P. Mersereau, and H. C. Hamner. 2015. Assessing the association between natural food folate intake and blood folate concentrations: A systematic review and Bayesian meta-analysis of trials and observational studies. Nutrients 7(4):2663-2686.
McCullough, C. E., S. R. Searle, and J. M. Neuhaus. 2008. Generalized, linear, and mixed models, 2nd Edition. New York: John Wiley & Sons.
Meadows, N. J., S. L. Grainger, W. Ruse, P. W. Keeling, and R. P. Thompson. 1983. Oral iron and the bioavailability of zinc. Br Med J (Clin Res Ed) 287(6398):1013-1014.
Meyer, K. A., L. H. Kushi, D. R. Jacobs, Jr., J. Slavin, T. A. Sellers, and A. R. Folsom. 2000. Carbohydrates, dietary fiber, and incident type 2 diabetes in older women. Am J Clin Nutr 71(4):921-930.
Moher, D., A. Liberati, J. Tetzlaff, D. G. Altman, and P. Group. 2009. Preferred reporting items for systematic reviews and meta-analyses: The PRISMA statement. Ann Intern Med 151(4):264-269, W264.
Mulhern, B., K. Shah, M. F. Janssen, L. Longworth, and R. Ibbotson. 2016. Valuing health using time trade-off and discrete choice experiment methods: Does dimension order impact on health state values? Value Health 19(2):210-217.
Neuhouser, M. L., T. Y. Cheng, S. A. Beresford, E. Brown, X. Song, J. W. Miller, Y. Zheng, C. A. Thomson, J. M. Shikany, M. Z. Vitolins, T. Rohan, R. Green, and C. M. Ulrich. 2015. Red blood cell folate and plasma folate are not associated with risk of incident colorectal cancer in the Women’s Health Initiative observational study. Int J Cancer 137(4):930-939.
NRC (National Research Council). 2009. Science and decisions: Advancing risk assessment. Washington, DC: The National Academies Press.
O’Brien, K. O., N. Zavaleta, L. E. Caulfield, J. Wen, and S. A. Abrams. 2000. Prenatal iron supplements impair zinc absorption in pregnant Peruvian women. J Nutr 130(9):2251-2255.
Rimm, E. B., A. Ascherio, E. Giovannucci, D. Spiegelman, M. J. Stampfer, and W. C. Willett. 1996. Vegetable, fruit, and cereal fiber intake and risk of coronary heart disease among men. JAMA 275(6):447-451.
Roberts P. L., Veidenheimer, M. C. 1990. Diverticular disease of the colon. In: Bayless, T. M., ed. Current therapy in gastroenterology and liver disease—3. Toronto: Decker Mosby. Pp. 416-419.
Roddam, A. W., N. E. Allen, P. Appleby, T. J. Key, L. Ferrucci, H. B. Carter, E. J. Metter, C. Chen, N. S. Weiss, A. Fitzpatrick, A. W. Hsing, J. V. Lacey, Jr., K. Helzlsouer, S. Rinaldi, E. Riboli, R. Kaaks, J. A. Janssen, M. F. Wildhagen, F. H. Schroder, E. A. Platz, M. Pollak, E. Giovannucci, C. Schaefer, C. P. Quesenberry, Jr., J. H. Vogelman, G. Severi, D. R. English, G. G. Giles, P. Stattin, G. Hallmans, M. Johansson, J. M. Chan, P. Gann, S. E. Oliver, J. M. Holly, J. Donovan, F. Meyer, I. Bairati, and P. Galan. 2008. Insulin-like growth factors, their binding proteins, and prostate cancer risk: Analysis of individual patient data from 12 prospective studies. Ann Intern Med 149(7):461-471, W83-W88.
Rosner, B. 2016. Fundamentals of biostatistics, 8th edition. Boston, MA: Cenage Learning.
Russell, L. B. 2015. The science of making better decisions about health. In Population health: Behavioral and social science insights. AHRQ Publication No. 15-0002, edited by R. Kaplan, M. Spittel, and D. David. Rockville, MD: Agency for Healthcare Research and Quality and Office of Behavioral and Social Sciences Research, National Institutes of Health. Pp. 251-270.
Sawaya, G. F., J. Guirguis-Blake, M. LeFevre, R. Harris, D. Petitti, and U.S. Preventive Services Task Force. 2007. Update on the methods of the U.S. Preventive Services Task Force: Estimating certainty and magnitude of net benefit. Ann Intern Med 147(12):871-875.
Sellmeyer, D. E., M. Schloetter, and A. Sebastian. 2002. Potassium citrate prevents increased urine calcium excretion and bone resorption induced by a high sodium chloride diet. J Clin Endocrinol Metab 87(5):2008-2012.
Slavin, J. L. 2008. Position of the American Dietetic Association: Health implications of dietary fiber. J Am Diet Assoc 108(10):1716-1731.
Solomons, N. W., and R. A. Jacob. 1981. Studies on the bioavailability of zinc in humans: Effects of heme and nonheme iron on the absorption of zinc. Am J Clin Nutr 34(4):475-482.
Solomons, N. W., O. Pineda, F. Viteri, and H. H. Sandstead. 1983. Studies on the bioavailability of zinc in humans: Mechanism of the intestinal interaction of nonheme iron and zinc. J Nutr 113(2):337-349.
Takata, Y., M. J. Shrubsole, H. Li, Q. Cai, J. Gao, C. Wagner, J. Wu, W. Zheng, Y. B. Xiang, and X. O. Shu. 2014. Plasma folate concentrations and colorectal cancer risk: A case-control study nested within the Shanghai Men’s Health Study. Int J Cancer 135(9):2191-2198.
Tan, L., A. E. Babbs, M. H. Green, and A. C. Ross. 2016. Direct and indirect vitamin A supplementation strategies result in different plasma and tissue retinol kinetics in neonatal rats. J Lipid Res 57(8):1423-1434.
Vickers, A. J., and E. B. Elkin. 2006. Decision curve analysis: A novel method for evaluating prediction models. Med Decis Making 26(6):565-574.
Watters, D. A., and A. N. Smith. 1990. Strength of the colon wall in diverticular disease. Br J Surg 77(3):257-259.
Whelton, P. K., J. He, J. A. Cutler, F. L. Brancati, L. J. Appel, D. Follmann, and M. J. Klag. 1997. Effects of oral potassium on blood pressure. Meta-analysis of randomized controlled clinical trials. JAMA 277(20):1624-1632.
WHI (Women’s Health Initiative) Study Group. 1998. Design of the Women’s Health Initiative clinical trial and observational study. The Women’s Health Initiative Study Group. Control Clin Trials 19(1):61-109.
Wolk, A., J. E. Manson, M. J. Stampfer, G. A. Colditz, F. B. Hu, F. E. Speizer, C. H. Hennekens, and W. C. Willett. 1999. Long-term intake of dietary fiber and decreased risk of coronary heart disease among women. JAMA 281(21):1998-2004.
Yang, Q., M. E. Cogswell, H. C. Hamner, A. Carriquiry, L. B. Bailey, C. M. Pfeiffer, and R. J. Berry. 2010. Folic acid source, usual intake, and folate and vitamin B-12 status in US adults: National Health and Nutrition Examination Survey (NHANES) 2003-2006. Am J Clin Nutr 91(1):64-72.
Yetley, E. A., A. J. MacFarlane, L. S. Greene-Finestone, C. Garza, J. D. Ard, S. A. Atkinson, D. M. Bier, A. L. Carriquiry, W. R. Harlan, D. Hattis, J. C. King, D. Krewski, D. L. O’Connor, R. L. Prentice, J. V. Rodricks, and G. A. Wells. 2017. Options for basing Dietary Reference Intakes (DRIs) on chronic disease endpoints: Report from a joint US-/ Canadian-sponsored working group. Am J Clin Nutr 105(1):249S-285S.
Yu, E., M. Ruiz-Canela, M. Guasch-Ferre, Y. Zheng, E. Toledo, C. B. Clish, J. Salas-Salvado, L. Liang, D. D. Wang, D. Corella, M. Fito, E. Gomez-Gracia, J. Lapetra, R. Estruch, E. Ros, M. Cofan, F. Aros, D. Romaguera, L. Serra-Majem, J. V. Sorli, F. B. Hu, and M. A. Martinez-Gonzalez. 2017. Increases in plasma tryptophan are inversely associated with incident cardiovascular disease in the Prevencion con Dieta Mediterranea (PREDIMED) Study. J Nutr 147(3):314-322.
ANNEX 7-1
EXAMPLE OF INTAKE-RESPONSE ANALYSIS
Example of Meta-Analysis
TABLE 7-1-1 Summary of Meta-Analysis of Circulating and Dietary Magnesium and Risk of Cardiovascular Disease (Del Gobbo et al., 2013)
| Author, Year | del Gobbo et al., 2013 |
|---|---|
| Aims/Key Questions | To investigate prospective associations of circulating and dietary magnesium with incidence of cardiovascular disease (CVD) ischemic heart disease (IHD), and fatal IHD |
| Study Eligibility Criteria |
Inclusion criteria:
|
Exclusion criteria:
|
|
| Literature Search Dates or Year Range | Earliest available online indexing year to May 2012 |
| Number of Studies Included | 16 prospective studies, mostly cohort (11 with estimates of dietary magnesium; 9 with estimates of circulating magnesium) |
| Author, Year | del Gobbo et al., 2013 |
|---|---|
| Synthesis Methods (Summary Tables, Narrative Text, and/or Meta-Analysis) | Summary tables, narrative text, and meta-analysis |
| Key Findings | Circulating Mg and CVD (N=9 studies) RR: 0.70 (95% CI: 0.56-0.88) I2=49.5% (moderate heterogeneity) Meta-regression: study location, percentage baseline CVD, and event type (incidence compared with death) significantly modified the association between circulating magnesium and CVD (P-heterogeneity=0.04, 0.02, and 0.02, respectively) |
| Circulating Mg and IHD (N=5 studies) RR: 0.83 (95% CI: 0.65-1.05) I2=49.5% (moderate heterogeneity) Fixed effects model: RR: 0.88 (95% CI: 0.76-1.02) No significant sources of between-study heterogeneity were identified |
|
| Circulating Mg and fatal IHD (N=4 studies) RR: 0.61 (95% CI: 0.37-1.00) I2=80.2% Fixed effects model: RR: 0.77 (95% CI: 0.64-0.93) Meta-regression did not identify any statistically significant sources of heterogeneity |
|
| Dietary magnesium and total CVD (N=11 studies) RR: 0.89 (95% CI: 0.75-1.05) I2=67.7% Fixed effects model: RR: 0.87 (95% CI: 0.72-0.89) No statistically significant sources of between-study heterogeneity were identified, but trends were seen toward stronger associations with lower risk among studies with lower median BMI (P-heterogeneity=0.09) or evaluating IHD rather than CVD (P-heterogeneity=0.07) |
|
| Dietary magnesium and CHD (N=9 studies) RR: 0.78 (95% CI: 0.67-0.92) I2=44.1 Fixed-effects model: RR: 0.80 (95% CI: 0.72-0.89) Trends toward stronger associations in cohorts with more men (P-heterogeneity=0.06) and studies evaluating fatal IHD death rather than total IHD (P-heterogeneity=0.07) were observed |
| Author, Year | del Gobbo et al., 2013 |
|---|---|
| Key Findings | Dietary magnesium intake and fatal IHD (N=4 studies) RR: 0.73 (95% CI: 0.52-1.03) I2=43.2% Fixed-effects model: RR: 0.77 (95% CI: 0.60-0.98) Meta-regression did not identify any statistically significant prespecified sources of heterogeneity, although the power to identify heterogeneity was limited given the number of studies |
| No evidence of nonlinear associations between circulating magnesium and CVD (P=0.64), IHD (P=0.42), or fatal IHD (P=0.67) or between dietary magnesium and CVD (P=0.56) or IHD (P=0.26) | |
| Significant nonlinear association between dietary magnesium and fatal IHD (P-nonlinearity, 0.001). Compared with lower intakes, a 27 percent lower risk of fatal IHD was seen up to a threshold of ~250 mg/d (RR: 0.73 [95% CI: 0.62-0.86]) | |
| Limitations | Findings were constrained by the availability of published or unpublished data on magnesium-CVD associations |
| Most of the included studies did not report on potential contribution of multivitamins or supplements to magnesium intake | |
| Possibility of residual confounding by dietary potassium in the dietary magnesium analyses |
ANNEX 7-2
POSSIBLE NEW APPROACHES TO UL DEVELOPMENT
The UL is a DRI intended to address the potential risk associated with nutritional excess. As described in Chapter 2, it is defined as the “highest level of daily nutrient intake that is likely to pose no risk of adverse health effects to almost all individuals in the general population” (IOM, 1997, p. 4). As noted in Chapter 7, the committee recommends against using chronic disease endpoints as the basis of a UL, in part because in practice the UL is treated as a “bright line” between safe and unsafe intakes. Due to the multifactorial nature of chronic disease, no such bright line exists, as chronic diseases do not exhibit such “threshold”-like behavior and typically exhibit a continuous change in risk with changing intakes. However, this “threshold” interpretation of the UL is not entirely satisfactory either. In fact, although the conceptual model for a UL, illustrated in Figure 7-2-1, Panel A, depicts this level of intake as a point of “zero” risk, in practice such a level cannot be estimated because a small residual risk can never be ruled out.
However, the way in which ULs have traditionally been derived does not characterize the degree of residual risk that may be present. This is because, as summarized in Chapter 7, the UL is usually obtained by identifying a NOAEL of intake from an experimental study (predominantly animal studies), and then dividing this intake level by a number of “uncertainty factors” to account for limitations in the data (see Figure 7-2-1, Panel B). The most commonly applied uncertainty factors are a factor of 10 to address differences between experimental animals (UFA) and a second factor of 10 to address variability among humans (UFH). This “NOAEL divided by 100” concept dates back to the 1950s in the context of FDA regulation of food additives (Lehman and Fitzhugh, 1954). Each of these components—the NOAEL, UFA, and UFH—is assumed to be “conservative” in the sense of erring on the side of protecting public health, but without much specificity as to “how conservative” they actually are (WHO/IPCS, 2014). For instance, with respect to the NOAEL, it is assumed that the severity of effects at this exposure level is negligible, but the extent to which this is true depends on the endpoint examined and the statistical power of the study (Crump, 1984; EPA, 2012). For UFA, it is assumed that humans are generally no more than 10-fold more sensitive than the experimental animal species, but it is unclear at what confidence level this 10-fold factor is supposed to be (i.e. whether it should be 90 percent, 95 percent, 99 percent or other). Similarly, for UFH, it is assumed that individuals who are more susceptible to toxicity are no more than 10-fold more sensitive than more typical individuals. Two ambiguities are relevant here: first, like UFA, the confidence level of this 10-fold factor is unclear; and second, it is
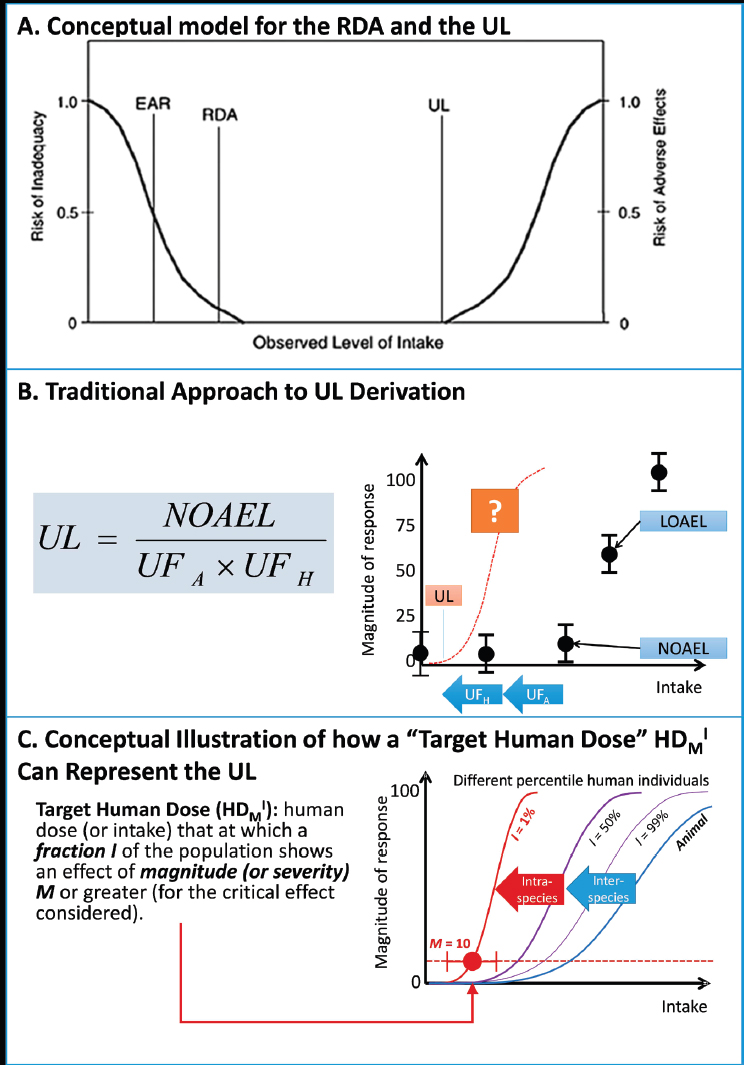
unclear what “susceptible” means in terms of the more sensitive tail of the population distribution (i.e., 5 percent, 1 percent, 1 in a million or other).
This same approach of “NOAEL divided by 100” has been applied in chemical risk assessment, where exposure limits are set for contaminants in food or the environment. However, in the chemical risk assessment field, a number of refinements to the approach have been developed that may be equally applicable to the UL. Most recently, the World Health Organization/International Program on Chemical Safety (WHO/IPCS, 2014) developed a guidance document describing a “probabilistic” framework that results in substantially better characterization of the intake-response for adverse effects. The key concept underlying the WHO/IPCS approach, illustrated in Figure 7-2-1, Panel C, is that the goal of deriving quantities like the UL is a “target human dose” HDMI, defined as to estimated human dose (or intake) at which effects with magnitude M occur in the population with an incidence I, along with an associated CI.
By providing intake-response functions rather than “bright lines,” changes in risk of adverse effects from changes in intake can be quantified. This may be particularly important in the scenario described in Chapter 7 in which increasing intake decreases chronic disease risk up to and perhaps beyond the UL. This type of “risk-benefit” comparison would be infeasible under the traditional “NOAEL divided by 100” approach, because there is no characterization of the gradient of the intake response over a wide enough range of doses. However, the approach to derive an HDMI would enable such comparison to be made much more easily. For additional details, see WHO/IPCS (2014) and Chiu and Slob (2015).
ANNEX 7-2 REFERENCES
Chiu, W. A., and W. Slob. 2015. A unified probabilistic framework for dose-response assessment of human health effects. Environ Health Perspect 123(12):1241-1254.
Crump, K. S. 1984. A new method for determining allowable daily intakes. Fundam Appl Toxicol 4(5):854-871.
EPA (U.S. Environmental Protection Agency). 2012. Benchmark dose technical guidance. Washington, DC: U.S. Environmental Protection Agency.
IOM (Institute of Medicine). 1997. Dietary Reference Intakes for calcium, phosphorus, magnesium, vitamin D, and fluoride. Washington, DC: National Academy Press.
Lehman, A. J., and O. G. Fitzhugh. 1954. 100-fold margin of safety. Assoc Food Drug Off U.S.Q. Bull 18:33-35.
WHO/IPCS (World Health Organization/International Program on Chemical Safety). 2014. Guidance document on evaluating and expressing uncertainty in hazard characterization. Geneva, Switzerland: World Health Organization International Program on Chemical Safety.


