
![]()
Options for basing Dietary Reference Intakes (DRIs) on chronic disease endpoints: report from a joint US-/Canadian-sponsored working group1–3
Elizabeth A Yetley,4 Amanda J MacFarlane,5* Linda S Greene-Finestone,5 Cutberto Garza,6–8 Jamy D Ard,9 Stephanie A Atkinson,10 Dennis M Bier,11 Alicia L Carriquiry,12 William R Harlan,13 Dale Hattis,14 Janet C King,15–17 Daniel Krewski,18 Deborah L O’Connor,19,20 Ross L Prentice,21,22 Joseph V Rodricks,23 and George A Wells24
4Office of Dietary Supplements, NIH, Bethesda, MD; 5Bureau of Nutritional Sciences, Health Canada, Ottawa, Ontario, Canada; 6Boston College, Chestnut Hill, MA; 7Department of Global Health, George Washington University Milken Institute School of Public Health, Washington, DC; 8Department of International Health, Johns Hopkins University Bloomberg School of Public Health, Baltimore, MD; 9Wake Forest School of Medicine, Wake Forest University, Winston-Salem, NC; 10Department of Pediatrics, McMaster University, Hamilton, Ontario, Canada; 11Children’s Nutrition Research Center, Baylor College of Medicine, Houston, TX; 12Department of Statistics, Iowa State University, Ames, IA; 13Retired, Office of the Director, NIH, Bethesda, MD; 14The George Perkins Marsh Institute, Clark University, Worcester, MA; 15Children’s Hospital Oakland Research Institute, Oakland, CA; 16Department of Nutritional Sciences, University of California, Berkeley, Berkeley, CA; 17Department of Nutrition, University of California, Davis, Davis, CA; 18McLaughlin Centre for Population Health Risk Assessment, University of Ottawa, Ottawa, Ontario, Canada; 19Department of Nutritional Sciences, University of Toronto; 20The Hospital for Sick Children, Toronto, Ontario, Canada; 21Fred Hutchinson Cancer Research Center; 22School of Public Health, University of Washington, Seattle, WA; 23Ramboll-Environ International Corporation, Arlington, VA; and 24Department of Epidemiology and Community Medicine, University of Ottawa Heart Institute, Ottawa, Ontario, Canada
ABSTRACT
Dietary Reference Intakes (DRIs) are used in Canada and the United States in planning and assessing diets of apparently healthy individuals and population groups. The approaches used to establish DRIs on the basis of classical nutrient deficiencies and/or toxicities have worked well. However, it has proved to be more challenging to base DRI values on chronic disease endpoints; deviations from the traditional framework were often required, and in some cases, DRI values were not established for intakes that affected chronic disease outcomes despite evidence that supported a relation. The increasing proportions of elderly citizens, the growing prevalence of chronic diseases, and the persistently high prevalence of overweight and obesity, which predispose to chronic disease, highlight the importance of understanding the impact of nutrition on chronic disease prevention and control. A multidisciplinary working group sponsored by the Canadian and US government DRI steering committees met from November 2014 to April 2016 to identify options for addressing key scientific challenges encountered in the use of chronic disease endpoints to establish reference values. The working group focused on 3 key questions: 1) What are the important evidentiary challenges for selecting and using chronic disease endpoints in future DRI reviews, 2) what intake-response models can future DRI committees consider when using chronic disease endpoints, and 3) what are the arguments for and against continuing to include chronic disease endpoints in future DRI reviews? This report outlines the range of options identified by the working group for answering these key questions, as well as the strengths and weaknesses of each option. Am J Clin Nutr 2017;105(Suppl):249S–85S.
Keywords: Dietary Reference Intakes, chronic disease, intake response, evidentiary challenges, evidence assessments
I. EXECUTIVE SUMMARY
Background
Dietary Reference Intakes (DRIs)21 represent a common set of reference intake values used in Canada and the United States in planning and assessing diets of apparently healthy individuals and population groups. Past expert committees that developed these reference values took into consideration the deficiencies, inadequacies, and toxicities of nutrients and related food substances as well as relevant chronic disease outcomes. The increasing
___________________
Am J Clin Nutr 2017;105(Suppl):249S–85S. Printed in USA. © 2017 American Society for Nutrition
1 This is a report based on working group meetings held between November 2014 and April 2016 and a public workshop titled “Options for Consideration of Chronic Disease Endpoints for Dietary Reference Intakes (DRIs)” held at the NIH in Bethesda, MD, 10–11 March 2015.
3 The findings and conclusions in this article are those of the authors and do not necessarily represent the official views or positions of Health Canada, the US NIH, the USDA, the US Food and Drug Administration, or the US CDC.
* To whom correspondence should be addressed. E-mail: amanda.macfarlane@hc-sc.gc.ca.
21 Abbreviations used: AHRQ, Agency for Healthcare Research and Quality; AI, Adequate Intake; AMDR, Acceptable Macronutrient Distribution Range; AMSTAR, A Measurement Tool to Assess Systematic Reviews; CD, chronic disease; CDcancer, chronic disease risk reduction intake value for cancer; CDCVD, chronic disease risk reduction intake value for cardiovascular disease; CVD, cardiovascular disease; DRI, Dietary Reference Intake; EAR, Estimated Average Requirement; FNB, Food and Nutrition Board; GRADE, Grading of Recommendations Assessment, Development, and Evaluation; RCT, randomized controlled trial; RDA, Recommended Dietary Allowance; ROBINS, Risk of Bias in Nonrandomized Studies; SIGN 50, Scottish Intercollegiate Guidelines Network 50; UL, Tolerable Upper Intake Level; ULCD, chronic disease Tolerable Upper Intake Level.
First published online December 7, 2016; doi: 10.3945/ajcn.116.139097.
proportions of elderly citizens, the growing prevalence of chronic diseases, and the persistently high prevalence of overweight and obesity, which predispose to chronic disease, in Canada and the United States highlight the importance of understanding the impact of nutrition on chronic disease prevention and control, and on health promotion.
The approaches that expert committees have used to establish the DRIs usually worked well when these groups considered classical nutrient deficiencies and/or toxicities. However, when committees concluded that there was sufficient evidence to base a reference value on a chronic disease endpoint, deviations from the frameworks that were initially developed for DRI use were often required. In some cases, committees were unable to establish reference values for intakes that affected chronic disease outcomes despite evidence that supported relations between intakes and chronic disease outcomes.
Current project
A multidisciplinary working group sponsored by Canadian and US government DRI steering committees met from November 2014 to April 2016 to identify key scientific challenges that past DRI committees encountered in the use of chronic disease endpoints to establish reference values. The working group focused its discussions on 3 key questions:
- What are the important evidentiary challenges for selecting and using chronic disease endpoints in future DRI reviews?
- What intake-response models can future DRI committees consider when using chronic disease endpoints?
- What are the arguments for and against continuing to include chronic disease endpoints in future DRI reviews?
Currently, DRIs apply to apparently healthy populations, but changing demographics (e.g., an aging population) and health status (e.g., increasing rates of obesity) suggest a possible need for broader population coverage. Past DRIs generally focused on intakes achievable by dietary strategies, but the growing ability to modify intakes through fortification and supplementation is increasingly relevant to future DRI development. In addition to these evolving concerns, future DRI committees need to continue to take into account the broad and diverse uses of DRIs when considering options for DRIs, including those based on chronic disease endpoints.
The sponsors asked the working group to identify a (not necessarily exhaustive) range of options for answering each of the key questions and the strengths and weaknesses of each option, while keeping in mind current and future DRI contexts and uses. The sponsors did not ask the group to reach a consensus on which options have the highest priority. Final decisions about the feasibility and options for specific approaches for deriving DRIs on the basis of chronic disease outcomes will be made by a future DRI committee.
Judging the evidence
The DRI process includes 2 key scientific decisions: 1) whether the available evidence supports a causal relation between the food substance of interest and a selected outcome and, 2) if so, which DRIs are appropriate based on the available data. DRI committees make these decisions for both beneficial and adverse effects. In the current project, the outcome of interest is a chronic disease.
Challenges in evaluating the evidence
When a DRI committee assesses whether the intake of a given food substance is causally related to a chronic disease or attempts to determine the nature of an intake-response relation between a food substance and a chronic disease, it considers the characteristics of individual study designs and overarching issues that apply across different types of study designs. One of these overarching issues is the risk of bias, which depends on the design, conduct, and analysis of a study and is useful for assessing whether evidence is likely to support a conclusion about a causal relation. Randomized controlled trials (RCTs) when they are well conducted and have adequate statistical power can minimize or eliminate many sources of bias, whereas observational studies are more vulnerable to confounding and sample-selection bias. Causality can be directly assessed with RCTs but must be inferred or its likelihood assessed from observational studies.
In RCTs, the food-substance intervention is known. Randomization increases the likelihood that measurement error or bias associated with dietary intake assessment will be evenly distributed among the groups. In contrast, assessing relations between food substances and chronic diseases in observational studies is particularly challenging because the assessment of intake is most often based on self-reported dietary intakes, which are subject to systematic bias, particularly intakes of energy. Unlike RCTs, in which valid comparisons among randomly assigned groups are possible without the use of dietary-assessment data, the validity and usefulness of observational studies depend on the accuracy and precision of the dietary assessments these studies use. Systematic reviews and meta-analyses, when they are well designed, can provide useful and well-documented summaries of the evidence on a relation between food substances and chronic diseases. However, the use of data from such analyses also requires caution because these analyses have the same biases and confounding problems as the original studies.
Which outcome measures a DRI committee selects for assessing the causality of a relation between food substances and chronic diseases is also important. It is possible to measure the occurrence of a chronic disease of interest directly or indirectly. Confidence that an observed relation between a food substance and a chronic disease outcome is causal is greatest when a study directly measures the chronic disease event or incidence. An indirect measurement involves a substitute measure (e.g., a qualified surrogate disease marker such as LDL cholesterol or a nonqualified disease marker such as carotid intima-media thickness for coronary heart disease). Some uncertainty is associated with the use of qualified surrogate disease markers, and considerable uncertainty is associated with the use of nonqualified disease markers as outcome measures.
Tools for assessing the evidence
Tools are available to assess 1) individual study quality and 2) the overall strength of the totality of the evidence. Tools to assess individual study quality include the Bradford Hill criteria,
quality-assessment instruments, and risk-of-bias tools. Quality-assessment instruments, such as the Scottish Intercollegiate Guidelines Network 50 (SIGN 50) methodology, assess the quality of a study from conception to interpretation. Risk-of bias tools assess the accuracy of estimates of benefit and risk in RCTs and nonrandomized studies. Other tools evaluate the quality of systematic reviews and meta-analyses [e.g., A Measurement Tool to Assess Systematic Reviews (AMSTAR)] or provide criteria for grading the evidence [e.g., Grading of Recommendations Assessment, Development, and Evaluation (GRADE)]. For DRI applications, reviewers might need to add nutrition-specific measures to generic assessment tools when they evaluate relations between food substances and chronic diseases (e.g., information on baseline or background nutritional status, assay methods used to measure biomarkers).
Options for addressing evidence-related challenges
An early challenge in the DRI decision-making process is the identification of potentially useful measures (indicators) that reflect a health outcome associated with the food substance of interest. One option is to select an endpoint that is assessed as the chronic disease event (i.e., chronic disease defined by accepted diagnostic criteria) or by a qualified surrogate disease marker (e.g., LDL cholesterol for coronary heart disease). An alternative option would expand the types of outcome measures of chronic disease to include nonqualified disease markers. This would increase the number of relations between food substances and chronic disease outcomes for which committees could establish DRIs but is associated with considerable uncertainty as to whether the relation of the food substance and the chronic disease is causal.
Another challenge is to specify the acceptable level of confidence in the data that a DRI committee uses to establish causality. The level of confidence is based on the type of endpoint measured and the overall strength of the evidence. One option is to specify an acceptable level of confidence in (e.g., high or moderate) about the validity of the results that must be met before a reference value can be established. Another option is to use the actual level of certainty (e.g., high, moderate, or low) to describe the evidence associated with a given reference value. A final option is to let committees make this decision on a case-by-case basis.
Intake-response relations
Intake-response relations for classical nutrient requirements and adverse events associated with excessive intakes differ from those associated with chronic diseases. Traditional deficiency relations are based on absolute risk, in which an inadequate intake of the nutrient is both necessary and sufficient to cause a deficiency and an adequate intake is both necessary and sufficient to treat a deficiency. The intake-response relation between a nutrient and a deficiency disease is linear or monotonic within the range of inadequacy. In contrast, food substance–chronic disease relations are often expressed as relative risks, in which the baseline risk of a chronic disease is never zero and changes in intake may alter risk by relatively small amounts. In addition, reductions in relative risk are achievable through >1 intervention, which means that the food substance of interest may not be necessary or sufficient to increase or decrease the relative risk of the disease. The relation between a food substance and a chronic disease indicator can be diverse (e.g., linear, monotonic, or nonmonotonic). A single food substance can have a causal relation with >1 chronic disease, and intake-response curves for these different relations can differ.
Options for determining an acceptable level of confidence
Several options are available for determining the acceptable level of confidence in the data that a DRI committee uses to determine intake-response relations once it has data that establish a causal relation. One option is to require a high level of confidence by, for example, using RCTs with a chronic disease or qualified surrogate disease marker as the outcome measure. Another option is to accept a moderate level of confidence in the data, which would allow for inclusion of data on chronic disease outcomes or qualified surrogate markers of disease from observational studies. A third option is to “piece together” different relations in which the outcome marker of interest is a common factor when direct evidence of the outcome marker’s presence on the causal pathway between the food substance and a chronic disease is lacking. Therefore, if data show a quantitative relation between a food-substance intake and the outcome marker of interest and other data show a quantitative relation between the outcome marker of interest and the chronic disease, this evidence could be combined to establish a quantitative reference intake value for the chronic disease risk, if the confidence in the data is at an acceptable level.
Options for types of reference values
If data for an acceptable level of confidence are available, a reference value based on chronic disease risk reduction can be determined. The challenges presented by the use of chronic disease endpoints to set reference values by using the traditional framework suggest the need for different types of reference values than are used for classical nutrient deficiencies and toxicities. For cases in which increasing intakes will reduce the risk of a chronic disease, one option is to estimate a chronic disease risk-reduction intake value [e.g., a chronic disease risk-reduction intake value, such as a chronic disease (CD) value for reduced cardiovascular disease (CVD) reduction, could be denoted as CDCVD] that is specific to a chronic disease outcome and is based on data reported as relative rather than absolute risk. Within this type of approach, 3 possible adaptations are identified: 1) set a single chronic disease value at a level above which higher intakes are unlikely to achieve additional risk reduction for a specified disease (i.e., point estimate), 2) set multiple reference values in relation to the expected degree of disease risk reduction across a spectrum of intakes to give a “family of targeted reductions,” or 3) set multiple chronic disease–related values (e.g., CDCVD, CDcancer) if the food substance is related to multiple diseases at different intakes. Another option is to express reference intakes as ranges of beneficial intakes.
Options for the derivation of Tolerable Upper Intake Levels (ULs) include the use of either one or both traditional adverse events (i.e., toxicities) and chronic disease endpoints, depending on the nature and strength of available evidence. One option is to derive ULs on the basis of a threshold approach by using traditional adverse events, if the UL based on chronic disease risk would be higher than a UL associated with a traditional adverse
effect. A second option is to use chronic disease endpoints to set a UL in cases in which intakes associated with increased chronic disease risk are at a level below those associated with traditional adverse events. These values could be denoted as a chronic disease UL (ULCD) to distinguish them from a traditional UL. For this second option, approaches analogous to the derivation of CD values (e.g., the development of 1 or multiple values for specified levels of relative risk) or a threshold approach (e.g., identifying the inflection point at which absolute or relative risk increases) could be used. When increased chronic disease risks are observed over a range of intakes and the intake-response curve shows an inflection point that supports a threshold effect, the inflection point could be set as a ULCD. If there is no clear inflection point, then a single ULCD value or a set of ULCD values could be based on intakes that reduce risk at specified levels with the acknowledgment that it may not be possible to eliminate the targeted risk. Basing ULCD values on risk reduction or minimization rather than risk elimination would further differentiate ULCD values from traditional UL values. Such an option would entail the provision of adequate guidance to users with regard to their uses and application. A third option is to develop multiple values on the basis of both traditional adverse events and chronic disease endpoints with guidance provided to users with regard to the strengths and weaknesses of derived values, and examples of their appropriate uses. For all options, the feasibility of avoiding or minimizing the food substance in the diet must be considered when there is no threshold for risk.
Options for resolving overlaps between benefit and harm
Intake distributions for some food substances associated with disease risk reduction might overlap with intake distributions associated with adverse events, including higher chronic disease risk. Several descriptive options are proposed for dealing with this issue. One option is to ensure that no point estimate or range of beneficial intakes for chronic disease risk reduction extends beyond the intake at which the risk of adverse events, including chronic diseases, increases. A second option is to predetermine criteria related to the severity and prevalence of targeted chronic diseases and the degree of change in the risk of specified intakes required to set a reference value. A third option is to simply describe the nature of the evidence and the public health implications of benefits and risks across the full range of intakes in which inferences are reasonably possible together with remaining uncertainties. Users would choose an appropriate balance between benefit and harm for the population of concern.
Options for selecting an indicator or indicators and specifying intake-response relations
Several possible options are identified to address examples of challenges likely to be encountered when intake-response curves are based on chronic disease endpoints. One possible approach is to identify alternatives for addressing different types of outcome markers [e.g., chronic diseases defined by accepted diagnostic criteria (clinical diseases per se) compared with qualified surrogate disease markers and nonqualified disease markers] to derive intake-response relations. In this approach, several possible options are identified. One option is to select a single outcome indicator on the causal pathway, provided that it is sufficiently sensitive to quantify the relation between the food substance and the chronic disease. Another option is to integrate information from multiple indicators for a given chronic disease if they add substantially to the accuracy of the intake-response relation and reference value variation. A third option may be required when a single food substance is related to multiple chronic disease outcomes, each with a distinct intake-response relation. In this case, criteria for selecting appropriate endpoints or surrogate endpoints to establish intake-response relations, methods to integrate multiple endpoints, and methods to account for interindividual variability in the relations of interest need to be developed. Another option is to use a biological mode-of-action framework instead of a statistical approach in establishing quantitative reference intakes.
In applying these possible approaches, several factors that influence or confound quantitative intake-response relations need to be considered. The accuracy of intake-response relations is dependent on the accuracy of the measurements of intakes and outcomes. Systematic bias due to substantial underreporting (e.g., intakes, particularly energy intakes) is of particular concern. When available, the use of qualified and accurately measured biomarkers of nutrient and food-substance intakes may overcome biases in self-reported intakes. Another factor relates to the common problem of data being available on some, but not all, life-stage groups for which DRIs are established. Two options for dealing with this issue are identified, including limiting the establishment of DRI values based on chronic disease endpoints to populations that are identical or similar to the studied groups. Alternatively, extrapolation could be considered when sufficient evidence is available that specific intakes of a food substance can increase or decrease the risk of a chronic disease.
DRI process
Arguments for or against including chronic disease endpoints in future DRIs
Evidence-based reference intake values and/or recommendations with regard to food substances causally related to the chronic diseases are desirable from public health and clinical perspectives. Yet, despite the growing chronic disease burden and continued use of DRIs, substantial challenges persist related to both the paucity of sufficiently relevant and robust evidence for evaluating putative causal relations between intakes and a chronic disease and the often-poor fit of the current Estimated Average Requirement (EAR)/Recommended Dietary Allowance (RDA) and UL frameworks for deriving DRIs on the basis of chronic disease endpoints. There is a clear desire to include chronic disease endpoints in the DRIs; however, the challenges reviewed in this report underscore the fact that the broader incorporation of chronic disease endpoints requires more sophisticated approaches than those previously used. These must also include approaches to issues concerning processes and starting points.
Options for process components
The current DRI values were set by a process that reviews a group of essential nutrients and related food substances and clearly focuses on intakes required for health maintenance and chronic disease risk reduction. Two possible options for organizing future reviews and derivations of DRIs based on chronic
disease endpoints are identified. The first option is to continue incorporating chronic disease endpoint considerations in future DRI reviews but to expand the types of reference values that could be set, while clearly differentiating between values based on classical nutrient adequacy and chronic disease endpoints. A second option is to create 2 separate but complementary, and possibly iterative and/or integrated, processes for the development of reference values on the basis of chronic disease endpoints and/or deficiency diseases. For example, a review is initiated specifically to set DRIs on the basis of chronic disease endpoints or when an existing independent process could be used.
Options for starting point
The starting point of current DRI processes is individual food substances, and all pertinent outcomes related to varying intakes of given food substances are considered. If chronic disease endpoints are to be considered, one option is to focus on individual food substances or small groups of interrelated nutrients, an approach that is similar to the current DRI process. Conversely, another option is to focus on a specific chronic disease and its relation with multiple food substances.
Forthcoming tools
Examples are discussed of forthcoming tools and novel study designs with potential utility in overcoming anticipated hurdles, such as complexities related to multiple, interactive etiologies and longitudinal characteristics of chronic diseases. These include the identification and use of new dietary intake biomarkers, the potential for the use of Mendelian randomization studies to inform causality, the use of U-shaped dose-risk relation modeling based on severity scoring and categorical regression analysis, consideration of enhanced function endpoints, the use of systems science, and the application of principles subsumed under the umbrella of precision medicine.
Conclusions
The development of the DRIs has proven to be critical for the successful elimination of diseases of deficiency in Canada and the United States. If the DRI framework could be improved to more effectively incorporate chronic disease outcomes, the potential impact on public health would be even greater. The next steps are to assess the feasibility of including chronic disease endpoints in future DRI reviews, to evaluate the relevance and appropriateness of expanding DRIs to populations beyond those currently targeted, and to determine which of the options and/or their adaptations identified in this report may warrant inclusion in a future chronic disease DRI framework.
II. BACKGROUND
DRIs are a common set of reference intake values that the Canadian and US governments, individuals, and organizations use for planning and assessing the diets of apparently healthy individuals and populations (1–3). The Food and Nutrition Board (FNB) periodically convenes ad hoc expert committees to develop DRIs for specified food substances. DRIs are guides for achieving safe and adequate intakes of nutrients and other food substances from foods and dietary supplements. The DRI committees establish DRIs within a public health context for the prevention of nutrient deficiencies, for reduction in risk of other diseases, and for the avoidance of potential adverse effects of excessive intakes. DRIs are available for 22 groups based on age, sex, pregnancy, and lactation in apparently healthy populations. Future DRI committees might need to review whether the population coverage should be expanded to include morbidities of high prevalence.
The definition of “food substances” for this report is provided in Text Box 1. Future DRI committees might find it useful to review and revise this definition.
Previous DRI committees have used the term “apparently healthy populations” as defined in Text Box 2.
There is no single uniform definition of “chronic disease” (4) and defining this concept for DRI evaluations, although highly relevant, is outside this project’s scope. Future DRI committees will probably need to define this term. Existing definitions of this term differ with respect to whether a chronic disease requires medical attention, affects function, has multiple risk factors, or can be cured. There are many definitions of chronic disease, several examples of which are shown in Text Box 3.
History of nutrient intake reference values
The establishment of quantitative nutrient intake reference values in the United States and Canada began around 1940 with a single type of reference value in each country: 1) the Recommended Nutrient Intakes, or RNIs, for Canadians and 2) the RDAs for the United States (1). These values were the intakes of essential nutrients that the experts who developed them expected would meet the known nutrient needs of practically all healthy persons.
In 1994, an FNB committee recommended that future intake reference values reflect more explicit statistical constructs of distributions of requirements across individuals (7). As a result, DRI committees began deriving reference values from population-specific estimates of average requirements (EARs) and associated population variability (RDAs) (1, 3). This approach allowed DRI users to calculate the prevalence of inadequacy in populations and the probability of inadequacy in individuals (1, 8–10).
The FNB committee also recommended adding a reference value that reflects an upper safe level of intake (UL) (7, 11). All DRI reports published after 1996 implemented these recommendations (Table 1). However, with the progressive implementation of the revised DRI process, the committees that produced these reports recognized that the EAR and RDA model and the UL model were inappropriate for some outcomes of interest. Therefore, DRI committees added new reference values, as follows: 1) Adequate Intake (AI), 2) Acceptable Macronutrient Distribution Range (AMDR), and 3) Estimated Energy Requirement, or EER (Table 1).
In response to evolving science that suggests beneficial effects of diets and dietary components in reducing the risk of chronic disease (12), the 1994 FNB committee also recommended that DRI committees include reduction in the risk of chronic disease in the formulation of future reference values when sufficient data on efficacy and safety are available (7). All 7 subsequently published DRI reports placed a high priority on an evaluation of potential chronic disease endpoints for all of the nutrients they reviewed (13, 14). However, these panels based only a limited number of DRIs on chronic disease endpoints: dietary fiber and coronary heart disease, fluoride and dental caries, potassium and both hypertension and kidney stones, and sodium and CVD (15).
Uses of DRIs
The uses of reference intake values have expanded considerably beyond the original intent of helping governments plan and evaluate nutrition programs and policies. Uses now include general nutrition education and guidance for the public, dietary management of clinical patients, identification of research gaps and priorities, research design and interpretation, food product development, regulatory applications, and guidance for international and other organizational reference values.
The evolving range of diverse uses and users of reference intake values underscores the need for the transparent documentation of scientific decisions made by DRI committees and for reference intake values that lend themselves to a wide range of applications. DRI reports focus on the scientific and public health aspects of the intakes of nutrients and food substances, but they do not make policy recommendations, with one notable exception. The 1997 amendments to the US Food, Drug, and Cosmetic Act mandated that food manufacturers could use “authoritative statements” from certain scientific bodies, including the National Academies of Sciences, Engineering, and Medicine, as health claims on food labels in the US marketplace without undergoing usual US Food and Drug Administration review and authorization procedures (16). This latter policy is not operative in Canada.
TABLE 1
DRIs and their definitions1
| DRIs | Definition |
|---|---|
Based on 1994 Food and Nutrition Committee recommendations |
|
EAR |
The average daily nutrient intake level that is estimated to meet the requirements of half of the healthy individuals in a particular life stage and sex group. |
RDA |
The average daily dietary nutrient intake level that is sufficient to meet the nutrient requirements of nearly all (97–98%) healthy individuals in a particular life stage and sex group. |
UL |
The highest average daily nutrient intake level that is likely to pose no risk of adverse health effects for almost all individuals in the general population. As intake increases above the UL, the potential risk of adverse effects may increase. |
Added by DRI committees in 1994–2011 |
|
AI |
The recommended average daily intake level based on observed or experimentally determined approximations or estimates of nutrient intake by a group (or groups) of apparently healthy people that are assumed to be adequate; used when an RDA cannot be determined. |
AMDR |
The range of intakes of an energy source that is associated with a reduced risk of chronic disease, yet can provide adequate amounts of essential nutrients; expressed as a percentage of total energy intake. |
|
EER |
The average dietary energy intake that is predicted to maintain energy balance in a healthy adult of a defined age, sex, weight, height, and level of physical activity consistent with good health. In children and pregnant and lactating women, the EER includes the needs associated with the deposition of tissues or the secretion of milk at rates consistent with good health. |
1 From reference 1. AI, Adequate Intake; AMDR, Acceptable Macronutrient Distribution Range; DRI, Dietary Reference Intake; EAR, Estimated Average Requirement; EER, Estimated Energy Requirement; RDA, Recommended Dietary Allowance; UL, Tolerable Upper Intake Level.
Report overview
This report, in section III, provides an overview of the current project, whose purpose is to critically evaluate key scientific challenges in the use of chronic disease endpoints to establish reference intake values. Section IV describes the framework that the working group used as background information for this project. Sections V-A, V-B, and V-C describe options that the working group identified to assess evidentiary challenges related to determining whether relations between food substances and targeted chronic diseases are causal. Options for establishing intake-response relations between food substances and chronic disease endpoints are the focus of section VI. Section VII addresses considerations for future DRI committee processes, and section VIII discusses some forthcoming tools that could be applied to the establishment or application of DRI values based on chronic disease endpoints. Section IX offers a few conclusions and next steps.
III. CURRENT PROJECT
This section describes the rationale for this project as well as its objectives and key questions. Motivations for the project were well-established links between diet and health throughout the life course and the expectation that evidence-based changes in the intakes of food substances would enhance well-being and reduce disease risk. The broad application of reference intake values, increasing rates of chronic diseases among US and Canadian populations, growing financial and quality-of-life burdens represented by that dynamic, and shortcomings of the EAR/RDA and UL models provided additional reasons to undertake this effort.
Several US and Canadian government agencies are continuing DRI-related harmonization efforts initiated in the mid-1990s by jointly sponsoring the current project. These agencies convened a working group with a broad and diverse range of scientific and DRI experience (Table 2). The group had numerous discussions via conference calls and at a public workshop (17). The sponsors also solicited public comment on the working group deliberations.
The focus of the current project was on the relation between food-substance intakes and chronic disease endpoints. The working group applied elements of the traditional DRI-related context to its work: a prevention (public health) orientation, intakes that are achievable within a dietary context (and, in a few highly selected cases, through dietary supplements, such as folate supplements during pregnancy), and primary applicability to the apparently healthy population.
Objectives
One objective of this project was to critically evaluate key scientific issues involved in the use of chronic disease endpoints to establish reference intake values. A second objective was to provide options for future decisions about whether and/or how to incorporate chronic disease endpoints into the process for establishing DRI values. The sponsors asked the working group not to try to reach consensus on which options were best, but rather, to identify a range of options and their strengths and weaknesses. None of the options in this report excludes other possibilities, and the order of presentation or amount of space devoted to each option is not intended to convey relative priorities. Subsequent expert groups will make final decisions about future DRI approaches to chronic disease endpoints. The key scientific decisions that are the backbone of DRI development (Table 3) provided context for the working group’s discussions.
The working group identified a (not necessarily exhaustive) range of options for answering each of 3 key questions and identifying strengths and weaknesses of each option, while keeping in mind current and future DRI uses. The key questions are listed in the following sections.
TABLE 2
Working group members and their institutions
| Working group member | Institution |
|---|---|
|
Jamy D Ard, MD |
Associate Professor, Wake Forest School of Medicine, Wake Forest University |
|
Stephanie Atkinson, PhD, FCAHS |
Professor, Department of Pediatrics, McMaster University |
|
Dennis M Bier, MD |
Professor of Pediatrics, and Director, Children’s Nutrition Research Center, Baylor College of Medicine |
|
Alicia L Carriquiry, PhD |
Distinguished Professor, Department of Statistics, Iowa State University |
|
Cutberto Garza, MD, PhD (Chair) |
Professor, Boston College, and Visiting Professor, George Washington University Milken Institute School of Public Health and Johns Hopkins University |
|
William R Harlan, MD, FACP, FACPM, FAAFP, FAHA |
Research Consultant (retired), NIH |
|
Dale B Hattis, PhD |
Research Professor, The George Perkins Marsh Institute, Clark University |
|
Janet C King, PhD |
Executive Director, Children’s Hospital Oakland Research Institute, and Professor Emeritus, University of California, Berkeley and Davis |
|
Daniel Krewski, PhD |
Professor and Director, McLaughlin Centre for Population Health Risk Assessment, University of Ottawa |
|
Deborah L O’Connor, PhD, RD |
Professor, Department of Nutritional Sciences, University of Toronto, and Senior Associate Scientist, The Hospital for Sick Children |
|
Ross L Prentice, PhD |
Member, Public Health Sciences Division, Fred Hutchinson Cancer Research Center, and Professor of Biostatistics, University of Washington |
|
Joseph V Rodricks, PhD, DABT |
Principal, Ramboll-Environ International Corporation |
|
George A Wells, PhD, MSc |
Professor, Department of Epidemiology and Community Medicine, University of Ottawa Heart Institute |
TABLE 3
DRI decisions and considerations1
-
Causality: Is the relation between the food substance and the chronic disease or diseases causal?
- Objective assessment of the relevance and robustness of available studies
- Clear identification of the putative benefit or increased risk ascribed to targeted food substance or substances (e.g., amelioration or exacerbation of absolute or relative risks, level of severity)
- Selection of candidate chronic disease outcomes (e.g., chronic disease event, surrogate disease marker, nonqualified outcome) that reflects targeted causal relations
- Delineation of uncertainties related to determination of causality
- Evaluation of challenges likely to be encountered because of the extrapolation of causality from studied to unstudied groups
-
Intake-response relation: What is an appropriate DRI value (provided that causality has already been determined)?
- Objective assessment of the relevance and robustness of available evidence
- Determination of the type of reference value that is most appropriate given the available data (e.g., mean 6 variances, ranges) and user needs (e.g., planning or assessment for individuals or groups)
- Selection of candidate indicators for establishing an intake-response relation (i.e., endpoints for quantification)
- What are the complexities of the intake-response relation (e.g., linear, curvilinear, overlapping of benefit, or increased risk curves)?
- What are the characteristics of possible indicators (e.g., chronic disease event or biomarker relative to the causal pathway between intake and the chronic disease)?
- Identification of statistical models or other approaches (e.g., statistical, population-derived) to quantify the relation
- Delineation of uncertainties in the available data
- Identification of adjustments that may be necessary (e.g., about bioavailability, bias in exposure, outcome measures)
- Evaluation of challenges likely to be encountered in the extrapolation of a reference intake value from studied to unstudied groups
1 Evaluations of the effect of increasing intakes on both benefit (i.e., decreased risk of chronic disease) and safety (i.e., increased risk of chronic disease) as intakes increase are a core part of the DRI review process. Although DRI committees often review benefit and safety separately, the generic nature of the issues they must address in their review are likely to be the same for both types of review. This report focuses on the key questions related to causality and the intake-response relation. DRI, Dietary Reference Intake.
Key question 1: What are the important evidentiary challenges for selecting and using chronic disease endpoints in future DRI reviews?
The types of scientific evidence in the DRI-development process that are necessary to establish the essentiality of nutrients differ from the type of evidence needed to evaluate relations between food substances and chronic diseases (7). A key challenge is the limited availability of RCTs that are designed to establish that a food substance of interest is causally related to a given chronic disease outcome. A much larger body of evidence based on prospective cohort and other observational studies is available that shows associations between food substances and chronic diseases, but common study design limitations in such instances make it challenging to determine causality (18). The availability of studies that measured functional and other intermediate biomarkers (including qualified surrogate disease markers and nonqualified disease markers) of chronic disease risk has strengthened the ability to determine the utility of different study designs and endpoints for accurately predicting the impact of reference intakes on chronic disease outcomes (6).
The availability of recently developed evaluation tools and techniques (e.g., SIGN 50 methodology) (19) and grading tools (e.g., GRADE) (20) have enhanced the ability to assess the quality of individual studies and the overall strength of the totality of the available evidence. Although developers did not design and validate these types of tools for DRI applications (21), DRI committees can adapt them for DRI applications to help address the evidentiary challenges that are discussed more fully in sections V-A, V-B, and V-C.
A re-evaluation of the appropriateness of chronic disease endpoints and development of criteria for their use is timely because of the substantive knowledge base that has emerged in recent decades on relations between food substances and chronic diseases. The working group focused on options for addressing evidentiary challenges that future DRI committees must consider when they evaluate and select chronic disease endpoints.
Key question 2: What intake-response models can future DRI committees consider when using chronic disease endpoints?
The DRI intake-response relation models best equipped to deal with deficiency endpoints often are not appropriate for chronic disease endpoints (13, 22). For the purpose of this report, “intake” refers to intake exposure to a food substance. “Intake-response relation” refers to the impact on physiologic processes of a range of dietary intakes. Related challenges include difficulties in the use of nutrient-status indicators (e.g., serum nutrient concentrations) to estimate optimal intakes on the basis of chronic disease endpoints. In addition, it is often difficult to use the relative risk data commonly available on relations between food substances and chronic diseases to calculate a population average and variance, as is necessary for deriving EARs and RDAs. DRI committees have generally found AIs to be useful for deriving chronic disease endpoints, but DRI users have found AIs difficult to apply when assessing and planning diets for groups (13).
DRI committees have also encountered challenges in basing ULs on chronic disease endpoints. These committees did find convincing evidence that higher intakes of several food substances were associated with increased risks of certain chronic diseases. However, the absence of an apparent threshold effect for the associated intake-response relations resulted in either failure to establish a UL or the establishment of an arbitrary UL on the basis of considerations other than the traditional model for establishing DRIs (23, 24). It is therefore important to identify other approaches and models for deriving quantitative reference values that are related to both benefits and risks of food-substance intakes for chronic disease outcomes.
Key question 3: What are the arguments for and against continuing to include chronic disease endpoints in future DRI reviews?
The 1994 FNB committee was concerned about the need to consider differences among relations between nutrients and diseases of deficiency compared with those between food substances and chronic diseases in decisions about whether to combine these 2 types of relations or to address them separately (7). Subsequent evaluations of the DRI process have continued to
question whether a single process or separate processes are most appropriate for this purpose (13, 22).
IV. CURRENT PROJECT FRAMEWORK
This section describes the framework that the working group used in its reviews and deliberations. Chronic diseases are the leading cause of death and disability in the United States and Canada, and they account for a major proportion of health care costs (25, 26). Globally, 38 million people die annually from chronic diseases, and almost three-quarters of these deaths occur in low- and middle-income countries (5). With changing demographics (e.g., aging populations) and increasing rates of overweight and obesity, public health concerns and costs related to chronic diseases are expected to increase further in the coming decades.
Published evidence shows that “healthy” dietary choices and lifestyles can help prevent or control several chronic diseases (27). The technological capabilities of assessing individual and population risks of chronic diseases and options for modifying foods and behaviors that affect diets are likely to expand. At the same time, the understanding of the development of chronic diseases through the life course is increasing.
The evaluation of relations between food substances and chronic diseases is complex, and a single conceptual model is unlikely to fit all cases. Chronic diseases are generally considered to be pathologic processes that are noncommunicable, of long duration, of slow progression, and of multifactorial etiologies, which, in turn, may be influenced by genetic backgrounds, age and sex, comorbidities, environments, lifestyles, and an increasing prevalence of obesity (5, 25). They represent a wide range of conditions, including heart disease, cancer, arthritis, diabetes, and macular degeneration. Chronic diseases have varying public health importance, severity, prevalence, and availability of effective treatments and prevention strategies. These diseases begin years before signs and symptoms become evident with the use of current diagnostic technologies. Complex factors interact to influence chronic disease progression, including interactions between food substances. In some cases, one factor (e.g., a particular food substance) may only exert an effect if other factors are also present or absent. Food-substance effects are often small in individuals but can have significant beneficial or detrimental effects on populations. Defining populations at risk of a chronic disease is also challenging because many diseases are associated with, or modified by, other morbidities (e.g., obesity is associated with several comorbidities in the elderly) and demographic characteristics (e.g., proportions of individuals aged $65 y and changing pharmaceutical uses).
Because the human diet is a complex mixture of interacting components that cumulatively affect health (28), isolating the effects on chronic disease risk of a single food substance or a small number of them can be challenging. In addition, the risks of chronic disease can be associated with either decreasing or increasing intakes of food substances (e.g., of fiber or saturated fat, respectively). The observed intake-response characteristics generally do not fit the threshold-based EAR/RDA and UL approaches that are based on absolute risk and that DRI committees use to set reference values for nutrient deficiencies and related toxicities (22).
Intake-response curves have varied shapes. Both high and low intakes of some substances may increase the risk of a chronic disease, and high and low intakes of the same food substance sometimes have overlapping effects [e.g., the intake-response curve for the decreasing effect of increasing fluoride intakes on dental caries overlaps with the intake-response curve for the effect of increasing fluoride intakes on fluorosis (29)]. Observational data suggest that a given food substance can be related to multiple chronic disease outcomes, and each relation can have its own distinctive intake-response curve (22, 30). These complexities indicate the need for a multidisciplinary approach to developing nutrient-specific and context-specific frameworks that involves scientists with a wide range of expertise.
It is useful to compare the reference value concepts traditionally used for nutrient requirements and toxicities with the concepts that pertain to chronic disease risk reduction (Table 4).
TABLE 4
Traditional and chronic disease endpoints for DRIs1
| Issue |
Eligibility for consideration |
Focus | Characteristics | Expression of risk |
|---|---|---|---|---|
|
Traditional endpoints |
Food substances that are essential or conditionally essential or that are components of energy nutrients (e.g., fats, proteins, and carbohydrates). |
Nutrient requirements |
Adequate intakes are essential for preventing and treating deficiency diseases. |
Average inflection point between adequate and inadequate intakes (EAR) of a group and its associated population variance (RDA). |
|
Nutrient toxicities |
Intakes at some level above adequate intakes may pose the risk of adverse health effects. |
Highest intake of a group that is unlikely to pose a risk of adverse effects and above which the risk of adverse effects increases (UL). |
||
|
Chronic-disease endpoints |
Naturally occurring food substances, including nutrients, for which changes in intake have been demonstrated to have a causal relationship to the risk of one or more chronic diseases. |
↑Intakes of “beneficial” substances |
With ↑ intakes, the relative risk ↓ compared with baseline intakes. |
Relative risk (ratio of the probability of an event occurring in a group with higher intakes to the probability of an event in a comparison group with lower intakes). |
|
↓Intakes of “harmful” substances |
With ↓ intakes, the relative risk ↓ compared with baseline intakes. |
Relative risk (ratio of the probability of an event occurring in a group with lower intakes to the probability of an event in a comparison group with higher intakes). |
1 DRI, Dietary Reference Intake; EAR, Estimated Average Requirement; RDA, Recommended Dietary Allowance; UL, Tolerable Upper Intake Level; [, increased or increases; Y, decreased or decreases.
Historically, the food substances for which expert panels established reference values tended to be essential or conditionally essential nutrients or those that supplied energy (31). With its inception, the DRI-development process broadened this concept to include food substances with documented effects on chronic disease risk (e.g., fiber, saturated fats, and trans fats). Today, there is considerable interest in expanding future DRIs to include other bioactive components with documented health effects (32–34). Although essential nutrients have a direct and specific effect on nutrient deficiencies, other food substances alone might be neither necessary nor sufficient to reduce disease risk. Even if research has established a causal relation between a food substance and a chronic disease outcome, the mechanisms of action are often unknown or poorly understood. Research results on chronic disease risks are often expressed as relative risks as opposed to the reporting of absolute risks that experts typically use to define nutrient requirements for essential nutrients. Although the evidence may be reported as relative risks, DRI decisions may also need to consider the relation of a food substance and chronic disease within an absolute risk context (35).
V-A. JUDGING THE EVIDENCE: EVIDENTIARY CHALLENGES
This section and the next 2 sections discuss ways to assess the strength of the evidence on causal relations between food substances of interest and targeted chronic diseases. This section focuses on study designs and related issues that affect the use of evidence to assess the causality of these relations in DRI evaluations.
The DRI process involves 2 key decisions: 1) whether available evidence supports a causal relation between the food substance of interest and the chronic disease and, 2) if so, what DRIs may be appropriately derived from the available data. DRI committees make these 2 key decisions for both beneficial and adverse effects as guided by 2 key questions and their component characteristics (Table 3). When DRI committees find causal relations between food substances and chronic diseases, they can then derive DRI values that are appropriate given the evidentiary base that supports the intake-response relations. Tolerance of uncertainty is likely to vary for decisions about beneficial compared with adverse effects and for decisions involving causal compared with intake-response relations.
Judging evidence to develop DRIs on the basis of chronic disease endpoints has been an evolutionary process that continues to present major challenges. The 1994 FNB committee noted that consideration of chronic disease endpoints often requires a different type of evidence than the evidence that committees have used for determinations of nutrient requirements on the basis of classical deficiency diseases (7). In the 6 DRI reports published between 1997 and 2005, the totality of the evidence from both observational and intervention studies, appropriately weighted, formed the basis for conclusions with regard to causal relations between food-substance intakes and chronic disease outcomes (23, 24, 29, 36–38). The 2011 DRI Committee on Calcium and Vitamin D stated that RCTs provided stronger evidential support over observational and ecologic studies and were therefore necessary for the committee to further consider a health-outcome indicator (14). This committee also considered whether evidence from published RCTs and high-quality observational studies was concordant and whether strong biological plausibility existed. The paucity of studies specifically designed to support the development of DRIs continues to be a challenge.
Overarching challenges
When a DRI committee considers the strength of the evidence for its decisions, it considers overarching challenges that apply across different types of study designs and specific study design characteristics. This section discusses 3 overarching challenges: sources of bias, selection of chronic disease outcome measures, and statistical issues.
Sources of bias
A bias consists of systematic (not random) errors in estimates of benefits or risks due to a study’s design or in the collection, analysis, interpretation, reporting, publication, and/or review of data (39). Bias results in erroneous (as opposed to less precise) estimates of the effects of exposures (e.g., food substances) on outcomes (e.g., risk of chronic disease).
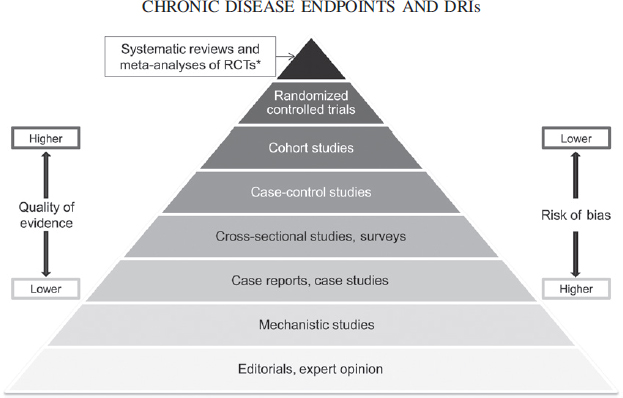
Evaluations of whether evidence likely supports a conclusion about causation often use risk-of-bias concepts. Risk of bias varies by study design (Figure 1) (40–43). At each ascending level in the pyramid in Figure 1, the quality of evidence is likely to improve (i.e., the risk of bias decreases) and the quantity of available studies usually declines. Within each level, however, quality varies by study design and implementation, which can blur the quality differences among hierarchies in the pyramid. Confidence in whether relations of interest are causally related generally increases toward the top of the pyramid.
Table 5 lists sources and types of bias that can affect nutrition studies. Table 6 describes examples of criteria for assessing the risk of bias associated with different study types. It is possible to avoid or minimize some types of biases in the study design, conduct, and analysis stages by using, for example, double-blinding, management of confounding by matching and/or multivariable analyses, or assessment of objective exposure. A major source of bias in studies of relations between food substances and chronic diseases is the use of self-reported intake assessments (e.g., food-frequency questionnaires, 24-h recalls, or food diaries) (44). Zheng et al. (45) provided an example of the dominant influence that uncorrected nonrandom measurement error in energy intake estimates from self-reported diets may have on associations with risks of CVD, cancer, and diabetes in a cohort-study context.
Selection of chronic disease outcome measures
A second overarching challenge in evaluating the strengths and weaknesses of evidence relates to the selection of an outcome measure for assessing whether a relation between food substances and chronic diseases is causal and identifying an indicator for intake-response analysis. It is possible to measure a chronic disease outcome directly (e.g., as an incident event) or indirectly by using a substitute measure (e.g., a qualified surrogate disease marker or a nonqualified disease marker). The type of outcome measured affects the level of confidence in whether the relation between a food substance and chronic disease is causal. The selection of an indicator for deriving intake-response relations also depends on whether the indicator is on the causal pathway between the intake and the disease outcome.
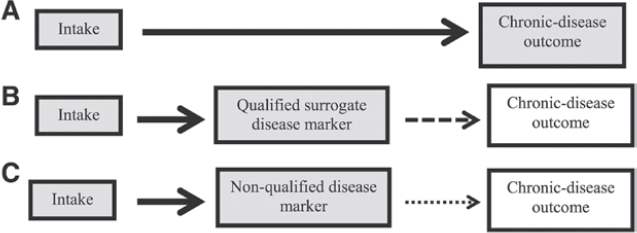
For this report, the outcome of interest is a chronic disease. Ideally, the measured outcome in available studies consists of the incidence (event) of the chronic disease as determined by appropriate diagnostic criteria. Data on this type of outcome from an RCT provide the most direct assessment of a relation between a food substance and a chronic disease outcome and a high degree of confidence that the relation is causal (Figure 2).
The limiting factor is that studies that use a chronic disease outcome may not be available or even feasible, and DRI committees might then consider the use of a qualified surrogate disease marker or a nonqualified disease marker as the outcome measure. Most of these outcomes are biomarkers or are based on biomarkers, as defined in Text Box 4.
The types of outcomes that can substitute for direct measures of a chronic disease outcome can range from biomarkers close to the disease (e.g., blood pressure for CVD or LDL cholesterol for coronary heart disease) to those that are more distant from the disease (e.g., indicators of inflammation or immune function for CVD and cancer). One type of substitute disease outcome is the qualified surrogate disease marker, defined in Text Box 5, a short-term outcome measure that has the same association with the intake of a food substance as a long-term primary endpoint.
The use of a surrogate marker enables a more rapid determination of the effectiveness of changes in intake on the risk of the chronic disease. Achieving “surrogate” status requires strong evidence and a compelling context (6, 46). That is, the outcome measure must be qualified for its intended purpose (e.g., to show that changing the intake of a food substance can prevent or alter the risk of the chronic disease). A qualified surrogate marker has prognostic value (i.e., correlates with the chronic disease outcome), is on the causal pathway between the intake and the chronic disease, and substantially captures the effect of the food substance on the chronic disease. DRI committees have used LDL-cholesterol concentrations as a surrogate disease marker for coronary heart disease and blood pressure as a surrogate marker for CVD (15, 23, 24). The use of a surrogate marker instead of the incidence of a chronic disease can provide a reasonable basis, but not absolute certainty, for evaluating whether a relation between a food substance and a chronic disease is causal (Figure 2). The second type of substitute disease outcome is an outcome that has not been qualified as a surrogate disease marker, referred to in this report as a nonqualified disease marker as defined in Text Box 6.
An example of a nonqualified outcome for CVD is carotid intima-media thickness (47). A nonqualified outcome marker is associated with considerable uncertainty about whether the relation between a food substance and a chronic disease is causal (Figure 2).
Statistical issues
For any study design, careful interpretation of findings by experts is necessary to reach appropriate conclusions about the strength of the evidence. The use of inappropriate statistical methods (e.g., multiple statistical comparisons involving several outcomes and/or subpopulations without adjustment) can undermine the validity of conclusions. The primary outcome of an RCT and other study types is the endpoint for which the study is designed and powered and that investigators use to define inclusion and exclusion criteria. Secondary endpoints and post hoc endpoints might not have adequate statistical power, participants may not be appropriately randomized (in the case of RCTs), and participant inclusion and exclusion criteria might not be adequate for the analysis of secondary and post hoc outcomes. Importantly, reports on secondary and post hoc outcomes of RCTs and analyses of subsets of the trial cohort need to account for multiple tests of different trial hypotheses. Caution is therefore necessary in the use of secondary outcomes and post hoc analyses of RCTs or other study types when those outcomes were not part of the original study protocols.
Study designs
Past DRI committees have described how the known strengths and weaknesses of different study designs influenced their DRI
TABLE 5
Types of bias that can affect nutrition studies1
Bias due to confounding
- Confounding: error in the estimated effect of an exposure on an outcome due to the presence of a common cause of the outcome or to baseline differences between exposure groups in the risk factors for the outcome or because factors predicting the outcome (prognostic factors) are related to the exposure that the person experiences
Related terms
- Allocation bias: error in the estimate of an effect caused by the lack of valid random allocation of participants to the intervention and control groups in a clinical trial
- Others: selection bias, case-mix bias
Bias in selection of participants for the study
- Selection bias: systematic error resulting from participant-selection procedures and factors that influence participation, systematic differences between baseline characteristics of the groups compared, or exclusion of some participants from the analysis (i.e., some participants are excluded initially or during follow-up), thereby changing the association between the exposure and the outcome
Related terms:
- Sampling bias: systematic error due to the methods or procedures for selecting the sample (e.g., participants, scientific papers), includes errors due to sampling of a nonrandom population
- Others: inception bias, lead-time bias, immortal time bias
Bias in measurement of exposures: misclassification of exposure status or introduction of systematic bias by use of self-reported intake methodologies
Related terms:
- Dietary exposure assessment bias: error associated with the use of self-reporting tools for assessing dietary intakes
- Misclassification bias: systematic error due to inaccurate measurements or classifications of participants’ exposure status; may be differential (related to the risk of the outcome) or nondifferential (unrelated to the risk of the outcome with an estimated effect that is usually biased toward the null)
- Recall bias: systematic error due to differences in accuracy of recall, particularly relevant to case-control studies because cases are more likely to recall potentially important events
- Others: observer bias, detection bias
Bias in measurement of outcomes: erroneous measurement or classification of outcomes
Related terms:
- Misclassification bias: systematic error due to inaccurate measurements or classifications of participants’ outcome status
- Nondifferential measurement error: can be systematic (e.g., measurements that are all too high), which does not cause bias or affect precision, or can be random, which affects precision but does not cause bias
- Detection bias (also known as differential measurement error): systematic differences between groups in how outcomes are determined. This bias can occur when outcome assessors are aware of participants’ exposure status and the outcome is subjective; the researchers use different methods to assess outcomes in different groups (e.g., questionnaires for the study group and medical records for the control group); or measurement errors are related to exposure status or a confounder of the exposure-outcome relation. Blinding of outcome assessors can help address this bias but is often not possible. Studies with self-reported outcomes have a higher risk of bias than those with clinically observed outcomes.
- Recall bias: see above
Bias in selection of reported findings
- Reporting bias: systematic differences between reported and unreported results
Related terms:
- Outcome-reporting bias: reporting on some, but not all, of the available outcome measures (e.g., reporting the most favorable results of multiple measurements or the results of the most favorable subscale of the many that are available)
- Analysis-reporting bias: investigators select results from exposure effects that they measured in multiple ways (e.g., multiple analyses with and without adjustment for different sets of potential confounders or use of a continuously scaled measure analyzed at different cutoffs)
Bias due to departures from intended exposures
- Performance bias: systematic differences between groups in care provided or in exposure to factors beyond the intended exposures
- Time-varying bias: change in the exposure over the follow-up period and postexposure prognostic factors that affect the exposure after baseline
Bias due to data missing not at random: can be due to attrition (loss to follow-up), missed appointments, incomplete data collection, or exclusion of participants from the analysis
Related terms:
- Attrition bias: systematic differences between groups in withdrawals from a study
- Selection bias: see above
Publication bias: result of the tendency for journals to publish articles with positive results, particularly if the articles report new findings, or of the tendency of authors to cite studies that conform to their or their sponsor’s preconceived ideas or preferred outcomes
Conflict of interest from sponsor bias: may be incurred when there is financial conflict; sponsor participation in data collection, analysis, and interpretation of findings can compromise the validity of the findings. This may result from the choice of design and hypothesis, selective outcome reporting, inadequacy of reporting, bias in presentation of results, or publication biases.
1 Data are from references 39 and 41–43. “Exposure” refers to the variable with the causal effect to be estimated (e.g., a food substance). In the case of a randomized controlled trial, the exposure is an intervention; “outcome” is a true state or endpoint of interest (e.g., a health condition). Lists of related terms are not intended to be exhaustive but to offer pertinent examples.
evaluations and decisions (14, 23, 24, 29, 36–38). Concurrently, evolving science provided new insights into how study designs can affect evaluations of relations between food substances and chronic diseases. Below, we integrate the perspectives of past DRI committees and newer science as to the potential usefulness of types of study designs for DRI contexts.
TABLE 6
Examples of criteria to assess the risk of bias by study type1
| Type of bias | Criterion | Study type | |||
|---|---|---|---|---|---|
RCT |
Cohort study |
Case-control study |
Cross-sectional study |
||
Bias due to confounding |
Were relevant confounding factors prespecified and considered? |
NA | ✔ | ✔ | ✔ |
Were study groups balanced with respect to the distribution of confounding factors? |
NA | ✔ | ✔ | ✔ | |
Were confounding factors taken into account in the design and/or analyses? |
NA | ✔ | ✔ | ✔ | |
Was the assignment of participants to study groups randomized? |
✔ | NA | NA | NA | |
Was an adequate method of concealment of allocation to study groups used? |
✔ | NA | NA | NA | |
Bias in selection of participants for the study |
Were the same inclusion and exclusion criteria used for all study groups? |
✔ | ✔ | ✔ | ✔ |
Was the likelihood that some participants might have the outcome before the exposure or intervention assessed and taken into account in the design and/or analysis? |
✔ | ✔ | ✔ | ✔ | |
Was the percentage of eligible nonparticipants in each study group below an acceptable value? |
✔ | ✔ | ✔ | ✔ | |
Bias in measurement of exposures and interventions |
Was the exposure or intervention status measured in an accurate and sufficiently precise way? | ✔ | ✔ | ✔ | ✔ |
Bias due to departures from intended exposures and interventions |
Were there systematic differences between study groups in the care provided and/or in exposures to factors beyond those intended by study design? |
✔ | ✔ | ✔ | ✔ |
Was the exposure or intervention status assessed more than once or in >1 way to help ensure fidelity to the study design? |
✔ | ✔ | ✔ | ✔ | |
Bias due to missing data |
Was the percentage of participants dropping out in each study group below an acceptable value? |
✔ | ✔ | ✔ | ✔ |
Were missing data appropriately handled (e.g., intention-to-treat analysis, imputation)? |
✔ | ✔ | ✔ | ✔ | |
Bias in measurement of outcomes |
Were all relevant outcomes measured in an appropriately accurate and sufficiently precise way (e.g., valid and reliable) and done consistently across all study participants? |
✔ | ✔ | ✔ | ✔ |
Was the length of follow-up among study groups in prospective studies the same, or in case-control studies were the times between exposures or interventions and targeted outcomes the same in cases and controls? |
✔ | ✔ | ✔ | ✔ | |
Was the assessment of outcome made “blind” to exposure or intervention status or, when blinding was not possible, was there recognition that knowledge of exposure or intervention status could have influenced the assessment of the outcome or outcomes? |
✔ | ✔ | ✔ | ✔ | |
Bias in selection of the reported result |
Were the prespecified outcomes partially reported or not reported because of the statistical significance or magnitude of the effect of the exposure or intervention? |
✔ | ✔ | ✔ | ✔ |
Is there evidence that the results from all participants, not only a subset, were analyzed or that all multiple-adjusted analyses, not only selected ones, were fully reported? |
✔ | ✔ | ✔ | ✔ | |
1 NA, not applicable; RCT, randomized controlled trial; U, applicable to the study type.
RCTs
RCTs with a chronic disease event or qualified surrogate disease marker as the primary outcome. RCTs can minimize or eliminate the likelihood of some key types of bias when they use randomization, concealment, and double-blinding protocols and have adequate statistical power (14, 23, 24, 29, 36–38). It is possible to compare disease incidence among randomly assigned groups receiving different interventions (e.g., supplement compared with placebo) by using the so-called intention-to-treat analyses, without using any dietary-assessment data, thus avoiding the systematic biases associated with reliance on self-reported intakes to determine exposures in observational studies. Dietary assessments need only provide assurance that a trial has adequate precision (i.e., statistical power), and they can also provide useful background information for evaluating that adherence to interventions has been followed or to account for background intake when supplements are added. RCTs often allow testing of small effects that observational studies cannot reliably detect. RCTs usually are the only type of study that allows direct assessment of causation, although other approaches, such as Mendelian randomization, may offer an alternative in special situations (48–52).
RCTs have the following limitations:
- The costs are typically high for outcomes based on chronic disease events.
- Persons agreeing to undergo randomization might be a select subset of the population of interest, which limits the generalizability of trial results.
- For practical reasons, RCTs usually measure only a single or limited intake range of one food substance or a few food substances.
- The study follow-up period is typically short relative to the period of food-substance exposure preceding the initiation of the study.
- Maintaining and reporting on intervention adherence can be challenging, particularly for diet-modification studies.
- Informed-consent procedures that indicate the study purpose (e.g., to evaluate the effect of vitamin D on bone health) may lead participants to choose to consume different foods and/or supplements independently of the study intervention.
- Blinding of study participants is difficult when interventions are based on dietary changes but is more achievable when the intervention consists of dietary supplements (e.g., to deliver micronutrients).
Over the past several decades, investigators designed several large RCTs in which the primary aim was to evaluate relations between food-substance intakes and chronic disease outcomes. Examples of completed studies include trials on the relations between the following:
- β-carotene and lung cancer (53–55);
- B vitamins and CVD (56);
- vitamin E and both CVD and prostate cancer (57, 58);
- salt and blood pressure (59);
- energy and fat (combined with physical activity) and diabetes (60); and
- a low-fat diet and breast and colorectal cancer (61, 62).
The DASH (Dietary Approaches to Stop Hypertension)Sodium trial (59) confirmed the hypothesis that sodium-intake reductions result in lower blood pressure, and the Diabetes Prevention Trial showed that diet and physical activity changes could reduce diabetes incidence (60). However, other trials either found that the food substances of interest [B vitamins and risk of CVD (56) and vitamin E and risk of CVD (58)] had no significant effect or an unexpected adverse effect on the chronic disease outcomes studied [risk of lung cancer for β-carotene (53, 54), risk of prostate cancer for vitamin E (63)].
RCTs with nonqualified disease markers as primary outcomes. Similar to RCTs that use chronic disease events or qualified surrogate markers as primary outcomes, well-designed and conducted trials that rely on nonqualified outcomes can also reduce the possibility of outcome bias. Moreover, because nonqualified disease markers often change within relatively short times after an intervention is introduced and can be readily measured, such studies require less time to produce effects and often have adequate statistical power with smaller samples than studies that target clinical disease events (e.g., cardiovascular events). As a result, well-designed RCTs that use nonqualified disease markers can be less costly than those that measure clinical disease events. The use of nonqualified disease markers to measure relations between food substances and chronic diseases is relatively common, and many more studies use such outcomes than RCTs with a clinical event or a qualified surrogate disease marker as the primary outcome. However, substantial uncertainty about whether a relation between food substances and chronic diseases is causal frequently limits the usefulness of nonqualified disease markers because of the lack of evidence that shows that these outcome measures are accurate and reliable indicators for the risk of the chronic disease of interest (Figure 2) (6, 18, 46, 64, 65). Several publications noted the need for caution in the use of these types of trials to establish causal relations between food substances and chronic disease events (14, 18).
Observational studies
Cohort studies. An extensive body of evidence from observational studies suggests that changes in intakes of some food substances can beneficially or adversely alter the risk of certain
chronic diseases. The increasing availability of large cohort studies with long follow-up periods has increased the use of cohort studies in recent evaluations of relations between food substances and chronic disease events.
Ideally, investigators collect data from cohort studies prospectively to more optimally control the type and quality of data collected. The prospective acquisition of dietary data is particularly important because recall of past dietary intakes is subject to considerable uncertainty.
Cohort studies have several advantages for supporting the development of DRIs on the basis of chronic disease outcomes (14, 23, 24, 29, 36–38):
- Study results are frequently directly relevant to noninstitutionalized humans.
- Study populations can be large and diverse.
- Follow-up can occur over many years or even many decades.
- A range of intakes can be associated with a range of relative risks.
- Temporal relations between intakes and outcomes are less uncertain than with cross-sectional or case-control studies.
The challenges in the use of cohort studies for DRI purposes include the following:
- Prospective cohort studies are more vulnerable to confounding and selective reporting bias than are RCTs (13, 22, 40).
- Statistical adjustments may decrease but cannot totally eliminate the likelihood of confounding.
- Evidence on the causal nature of relations between exposures and outcomes cannot be directly assessed and therefore must be inferred, thus increasing uncertainty as to the validity of the results.
- Variations in food-substance intakes may be limited in homogenous cohorts, making it difficult to identify intake differences between subgroups.
- Relative risk trends often have small effects, although small effects on diseases of sufficient prevalence or severity can be substantial at the population level.
- The reliability and interpretation of observed associations depend directly on the quality of the dietary exposure assessment; systematic bias in self-reported intakes is particularly problematic.
- Factors other than variations in intakes of the food substance of interest can affect comparisons of results across time (e.g., long-term follow-up in a given cohort or comparison of studies conducted at different time periods). For example, the increasing use of statins and aspirin can affect assessments of coronary heart disease over time. Increasing intakes of fortified foods and supplements can overwhelm the effect of the food substance of interest. Investigators must account for the confounding effects of these temporal changes when evaluating relations between food substances and chronic diseases that span long time periods.
- The use of a single diet assessment in some prospective cohort studies assumes that no variation in dietary intake occurred over time.
Other types of observational studies. Other types of observational studies include case reports, ecologic and cross-sectional studies (including surveys), and case-control studies. These types of studies played an important role in generating early hypotheses about relations between nutrients and chronic diseases (12).
Case reports and case studies are descriptive studies of outcomes in individuals or small groups who are exposed to a food substance but are not compared with a control group or groups. Cross-sectional studies and ecologic studies examine a food substance and a health condition in a population at 1 point in time. In a cross-sectional study, investigators examine the food substance and health condition in each individual in the sample. In an ecologic study, investigators examine the variables of interest at an aggregated or group level, sometimes resulting in errors in association (known as “ecological fallacy”). Case-control studies are retrospective in that they enroll patients with and without a given condition and attempt to assess whether the 2 groups of participants had different exposures to a food substance or substances.
A major limitation of these types of studies is their inability to establish the temporal relation between the intake of a food substance and the appearance of a chronic disease. These types of studies remain useful for hypothesis generation, but their utility for setting DRI values is limited. Like prospective cohort studies, they are vulnerable to confounding.
Special challenges for observational studies
Measurement error in intake assessments. Unlike RCTs, observational studies, including cohort studies, require accurate dietary assessments for their validity and usefulness. A major challenge for observational studies in evaluating relations between food substances and chronic diseases is the difficulty in obtaining accurate estimates of food-substance intakes when using self-reported data (13, 66). Self-reported intake estimates result in substantial underestimation bias for energy and protein intakes, especially among overweight and obese individuals (66, 67). These systematic biases can severely distort intake-response curves. Random errors in assessing intake may also attenuate the relation between intakes of a food substance and chronic disease risk, making it difficult to detect such a relation if it exists.
Cohort studies can minimize both systematic and random aspects of intake measurement error bias by estimating food-substance intakes with the use of a biomarker of intake or dietary recovery (see Text Box 7) in addition to, or in place of,
self-reported intakes. However, other important sources of bias (e.g., confounding) may remain. Currently, only a small number of established biomarkers of food-substance intake (e.g., doubly labeled water for energy expenditure assessments and 24-h urinary nitrogen for assessing protein intake) satisfy the classical measurement error criteria for recovery biomarkers (67). However, these only assess intake over short periods. Biomarker-calibrated intake assessments hold promise for minimizing systematic and random errors in intake measurements, but the field needs qualified biomarkers for additional dietary components before their use can substantially affect nutritional epidemiology research (45).
Attribution to a food substance. A second challenge is the difficulty of attributing an observed effect to the food substance of interest (13, 22). In observational studies, investigators usually calculate the amounts of food substances that participants consume from self-reports of food and supplement intakes. Interactions between food substances make it difficult to determine whether an observed association between the calculated intake of a specific food substance is a causal factor or simply a marker of another food component or components within the dietary pattern.
Statistical approaches
The Rubin potential-outcomes framework is an example of a statistical approach that potentially may enhance the usefulness of observational studies by producing approximate inferences about causal links in the absence of random allocation of subjects to treatments when candidate data sets include a large number of covariates (including key covariates) and the key covariates have adequate overlap of their distributions between experimental and control groups (68). The rationale is that the covariates incorporated in the analyses might include potential confounders. However, there is no way to guarantee that all confounders were measured in an observational study, and it is possible that $1 important confounders are missing. Researchers need to validate these approaches for future applicability to diet and health studies.
Systematic reviews and meta-analyses
Systematic reviews. A systematic review is the application of scientific strategies to produce comprehensive and reproducible summaries of the relevant scientific literature through the systematic assembly, critical appraisal, and synthesis of all relevant studies on a specific topic. Ideally, scientists with expertise in systematic reviews (e.g., epidemiologists) collaborate with subject matter experts (e.g., nutritionists) in the planning of the review. The subject matter experts can refine the key scientific questions and the study inclusion and exclusion criteria that will guide the review, ideally with the involvement of an experienced research librarian. The systematic review experts then abstract the data and summarize their findings, generally with duplication of key screening or data-abstraction steps. Once the review is in draft form, the review team solicits peer reviews from qualified experts in the subject matter and in systematic review methodology. This approach maintains scientific rigor and independence of the systematic review while maximizing the likelihood that the review will be relevant to subject matter experts and users. This was the process that the 2011 DRI committee used for its systematic review on calcium and vitamin D (69).
The advantages of systematic reviews include the following:
- The process is characterized by an organized and transparent methodology that locates, assembles, and evaluates a body of literature on a particular topic by using a set of specific criteria.
- The inclusion of all relevant research and the use of a priori criteria for judging study quality minimize study-related biases and enhance transparency.
- Non–content experts who search, assemble, and analyze the appropriate literature minimize the potential for study selection bias with assistance from content experts in refining the key scientific questions and in developing the inclusion and exclusion criteria.
- It is possible to apply the methodology, which was developed for RCTs, to other study types as long as those conducting the review appropriately account for biases in the analysis and interpretation of the data.
Systematic reviews also have several disadvantages, including the following:
- Researchers have not agreed on or validated selection, evaluation, and analytic criteria that are uniquely applicable to studies of relations between food substances and chronic diseases.
- The quality of published reviews can vary by 1) the degree of adherence to consensus methods and reporting standards and 2) the rigor applied to measures of variables related to food substances (e.g., baseline intakes and status, the effect of biases in intake estimates and biomarker assays) in the reviewed studies. Deficits can lead to the possible omission of critical information, inappropriate conclusions, and/or unbalanced dependence on expert opinion; and each of these can increase the likelihood of bias or misinterpretation (21).
- Systematic reviews will carry forward the biases (e.g., energy-based intake underestimates) of the included studies.
- Reporting and publication biases can be problematic, particularly if those conducting the reviews do not adequately account for these issues. The use of a range of effect estimates, such as ORs or relative risks, or tallies of positive and negative studies to summarize data can also lead to misleading results due to publication bias (70). Public solicitation is one approach to identify unpublished research (i.e., gray literature) for comparison to published data to help assess the potential impact of publication bias (21).
Meta-analysis. Meta-analysis uses statistical methods to combine the results of several studies to increase statistical power, improve effect estimates, and resolve disagreements and uncertainties among studies. These analyses compare and contrast
study results to identify consistent patterns and sources of disagreement.
Meta-analysis has several advantages, including the following:
- It can appropriately weight quantitative relations between food substances and chronic diseases by the precision of individual studies, yielding an overall estimate of the benefits or risks with greater precision than can be achieved with individual studies.
- It can identify differences in relations between food substances and chronic diseases across studies.
Meta-analysis has several disadvantages, including the following:
- Meta-analysis techniques might not be appropriate when considerable heterogeneity exists across the set of studies to be combined (70). Heterogeneity across studies is commonly related to factors such as differences in intake assessment, intervention protocols, population characteristics, outcome measures, and analytic procedures (70).
- Meta-analyses carry forward biases that are present in the included studies (e.g., systematic bias in energy intake estimates).
- Pooled-effect estimates can be misleading without consideration of study quality, a strong methodologic grasp of the meta-analysis techniques, extensive content knowledge of the research question, and commitment to impartial application of the approach (70).
- Reporting bias may be a problem, because less beneficial treatment effects are more often observed in unpublished than in published trials. Studies not published in English or not indexed in publication databases (e.g., Medline or Cochrane Central) might have different treatment effects than more readily available studies (70, 71).
Meta-analyses and systematic reviews can provide succinct, useful summaries of the available literature that are relevant to the research question of interest. However, the results will still require careful interpretation by experts to reach appropriate conclusions, including conclusions about causation and possible biases.
Systematic reviews and meta-analysis for nutrition-related topics
The use of systematic reviews and meta-analyses for nutrition-related topics is relatively recent (21, 72). The 2011 DRI review on vitamin D and calcium was the first to use these types of studies within a DRI context (14, 69). WHO and European Micronutrient Recommendations Aligned nutrition-related applications also use these studies (73, 74).
A relatively recent approach is for reviews to include both observational and trial data on the same relation between food substances and chronic diseases (75–77). This approach facilitates direct comparisons of results between these study designs. It is then possible to evaluate the strengths and weaknesses of each study type for a given relation between food substances and chronic diseases.
Animal and mechanistic studies
In the past, animal and mechanistic studies played an important role in establishing the essentiality of nutrients, although similar results in humans were generally necessary to confirm the findings (7, 12, 31). These studies have also been important in traditional toxicologic evaluations of environmental contaminants and food ingredients when ethical considerations precluded human testing (11). DRI committees have found that animal and mechanistic studies provided important supporting information on biological mechanisms and pathogenesis, but these committees generally did not consider such studies adequate to infer causality or to derive intake-response curves for DRIs (14, 23, 24, 29, 36–38). Moreover, until recently, few animal models were available that could adequately simulate relations between food substances and human chronic diseases.
Other evidence-related challenges
Evaluations of relations between food substances and chronic diseases pose a number of challenges in addition to those mentioned above, including those discussed below (13).
Extrapolations from studied to unstudied groups
DRI committees set reference values for 22 life-stage groups on the basis of age, sex, pregnancy, and lactation. These values are intended for apparently healthy populations. Yet, most available research does not readily fit this framework. Committees therefore need to consider whether to generalize results from studied to unstudied groups. For example, this challenge can arise when attempting to extrapolate results from the following groups:
- persons with diagnosed chronic diseases to persons without such diagnoses;
- persons with metabolic disorders that affect a substantial proportion of the general population (e.g., obesity) to healthier populations;
- one life-stage or sex group to a different life-stage or sex group (e.g., from older adults to children or from young women to pregnant females) (13); and
- a population with a single ethnic origin to a population with ethnic diversity.
Interactions between study variables
The following interactions of the food substance of interest with other study variables may make it difficult to isolate the effect of the food substance on the targeted chronic disease:
- food substance and food-substance interactions (e.g., between sodium and potassium and vitamin D and calcium);
- food substances and physiologic characteristics (e.g., responsiveness to a food substance in smokers and nonsmokers or in lean and obese individuals); and
- food substances and environmental characteristics (e.g., socioeconomic status).
Effects on responsiveness to dietary intervention and effect sizes
Various inherited and acquired subject characteristics and contextual factors may influence responsiveness to exposures of interest.
- Differences in baseline characteristics, including baseline nutritional status
- Variations in gene polymorphisms
- Duration of the observation and/or intervention
- The amount, timing, context, and nature of the food-substance exposure
These challenges can affect studies in different ways. For example, they can highlight biologically important interactions that DRI committees need to take into account when setting reference values. However, they can also lead to residual confounding not accounted for by covariate adjustment. These issues can also lead to erroneous, misleading findings that form part of the knowledge base and can misinform interpretations or comparisons of study results. Past reviews of the use of chronic disease endpoints in DRI contexts have not identified effective strategies for addressing these challenges (13, 22).
V-B. JUDGING THE EVIDENCE: TOOLS FOR ASSESSING THE EVIDENCE
This section describes tools to assess the quality of individual studies and the overall nature and strength of the evidence.
Tools for assessing the quality of individual studies
Bradford Hill criteria
The Bradford Hill criteria are a guide to making causal inferences (78) (Table 7). The National Research Council’s 1989 report on diet and health (12) and the first 6 DRI reports (23, 24, 29, 36–38) used these criteria. As with most assessment tools, these criteria do not address dietary intake measurement issues [e.g., poor correlation of subjective measures of intake with objective measures (67)], which are fundamental to considerations of causality and intake-response relations.
Study quality-assessment tools
The main types of tools for evaluating evidence from RCTs and observational studies are as follows: 1) quality-assessment instruments that assess the quality of a study from conception to interpretation as a whole and 2) risk-of-bias schema that assess the accuracy of estimates of benefit and risk (Table 8) (40). There is also a move toward conducting quality assessments at the outcome level. Within a particular study, for example, quality may be higher for subsets of outcomes, or blinding may be more important to one outcome than another.
After evaluating published quality-assessment instruments, Bai et al. (79) recommended the use of SIGN 50 methodology; versions are available for cohort studies, case-control studies, and RCTs (19). SIGN 50 uses the following 5 domains to assess the quality of data from cohort and case-control studies: comparability of subjects, assessment of exposure or intervention, assessment of outcome measures, statistical analysis, and funding. For RCTs, important domains are random allocation, adequate concealment of participant assignment to groups and blinding to treatment allocation, comparability of groups, no differences between groups except for the treatment, and assessment of outcome measurement. On the basis of these criteria, a study’s overall assessment may be judged to be of high quality overall (has little or no risk of bias and conclusions are unlikely to change after further studies are done), acceptable (some study flaws with an associated risk of bias and potential for conclusions to change with further studies), or low quality (substantial flaws in key design aspects and likely changes in conclusions with further studies). The advantages of SIGN 50 are that it is simple and includes key criteria for quality, good guidance is available for its application and interpretation, and there is extensive experience with its use. Disadvantages are that it is not outcome specific, not sufficiently inclusive of study characteristics that are relevant to food substance and dietary studies, and its assessment of bias domains is considered superficial according to some experts (19).
Risk-of-bias tools that are specific to study type are available to assess degree of bias (40). They provide a systematic way to organize and present available evidence relating to the risk of bias in studies and focus on internal validity. The Cochrane Collaboration’s risk-of-bias tool can be used to assess risk of bias for randomized studies (41). Domains of this tool include random-sequence generation; allocation concealment; blinding of participants, personnel, and outcome assessors; incomplete outcome data; selective outcome reporting; and other sources of bias (41). A risk-of-bias tool for nonrandomized studies, Risk of Bias in Nonrandomized Studies (ROBINS), is similar to the Cochrane risk-of-bias tool for randomized studies (42). Advantages of ROBINS are that it can be outcome specific, it provides a detailed assessment of bias domains, and good guidance is available for its application and interpretation (42). Disadvantages are that it is complex, not sufficiently inclusive of study characteristics that are relevant to food substances and dietary patterns, and there is little experience with its use.
Development of a quality-assessment instrument that is specific to food substances
It is possible to develop a quality-assessment instrument that is specific to food substances by adding food-substance–specific aspects of quality to currently available algorithms for quality assessment for use in conjunction with a general study-quality tool (e.g., SIGN 50 or AMSTAR) (21, 40). Food-substance quality-assessment instruments could take into account covariates, confounders, and sources of error that are especially relevant to food substances. For intervention studies, these additional items could be the nature of food-substance interventions, doses of the food-substance interventions, and baseline food-substance exposures in the study population (21). For observational studies, food-substance–specific quality factors might be methods or instruments used to assess intakes of food-substance exposures, ranges or distributions of the food-substance exposures, errors in assessing food-substance exposures, and potential impacts of errors from assessing food-substance exposures on the food-substance–outcome association (21). Other food-substance–specific items are assessment of dietary intakes, including longitudinal patterns, and mapping of dietary intakes to food-substance intakes (40). The need for quality assessments related to food-substance exposure in observational studies speaks to the dominant effect of random and nonrandom intake errors on assessments of magnitude, and even direction, of intake-response associations.
Food substances and dietary applications
The Agency for Healthcare Research and Quality (AHRQ) has produced systematic evidence reviews of associations between food substances and health outcomes (e.g., for vitamin D and calcium) (69, 76, 77, 80) that experts have used to develop DRIs
TABLE 7
Bradford-Hill criteria and application by the Institute of Medicine1
| Bradford-Hill criteria (78) | Diet and health (12) and DRI reports (14, 23, 24, 29, 36–38) |
|---|---|
|
Strength: effect sizes (not statistical significance) |
Yes |
|
Consistency: consistency across study types, locations, populations, study times, and other factors |
Yes |
|
Specificity: Is there likely one cause for the effect? Is the association specific to a particular population, context, or outcome and not observed in other populations, contexts, or outcomes? |
Yes |
|
Temporality: cause before effect with appropriate delay |
Yes |
|
Biological gradient: dose-response relation (could be curvilinear with a dose-response relation in part of the curve) |
Yes |
|
Biological plausibility: Is the nutrient of interest a biologically plausible cause of the beneficial effect? |
Yes |
|
Coherence: Does cause-and-effect interpretation of data seriously conflict with generally known facts and laboratory evidence? |
No |
|
Analogy: Is it possible to judge by analogy? |
No |
|
Experiment: Is there experimental evidence from human and/or animal and in vitro studies that is consistent with the associational findings? |
No, with the exception of the 2011 DRI report (14) |
1 DRI, Dietary Reference Intake.
and for other applications. In a recent food-substance review to assess the quality or risk of bias of individual studies, the AHRQ (77) used the Cochrane risk-of-bias tool for RCTs that identifies biases related to selection, performance, detection, attrition, reporting, and other factors (41). For observational studies, the AHRQ used questions from the Newcastle Ottawa Scale (81). In addition, the review included food-substance–specific questions to address the uncertainty of dietary-assessment measures (21, 72).
Tools for assessing the overall quality of the evidence
Tools for systematic reviews and meta-analyses
The AMSTAR 2007 tool is useful for the development of high-quality systematic reviews and meta-analyses of RCTs (79, 82, 83). Its methodologic checklist addresses 7 domains: the study question, search strategy, inclusion and exclusion criteria, data extraction method, study quality and validity, data synthesis, and funding. The overall assessment can be high quality, acceptable quality, or low quality. AMSTAR2, for nonrandomized studies, is under development (http://amstar.ca/Developments.php). It will also include confounding and reporting-bias domains. Methodologic checklists for nonrandomized studies are available (84). The newly released ROBIS (Risk of Bias in Systematic Reviews) tool, which is similar to ROBINS, can assess risk of bias in both nonrandomized and randomized studies (85).
The process for evaluating the quality of studies for inclusion in systematic reviews and meta-analyses involves assessing the quality or risk of bias of each candidate study, assembling all of the assessments into a summary table or figure, and assessing the overall study quality or risk of bias (41). No formal tool to determine overall quality is currently available.
GRADE criteria for evidence grading
Methods of judging evidence of causation can vary from binary yes-or-no decisions to ranked approaches. Many systematic reviews use the GRADE (20) criteria, which are in the latter group. GRADE uses evidence summaries to systematically grade the evidence on the basis of risk of bias or study limitations, directness, consistency of results, precision, publication bias, effect magnitude, intake-response gradient, and influence of
TABLE 8
Study types and tools for quality assessment and risk of bias1
| Quality-assessment tools | Risk-of-bias tools | |
|---|---|---|
|
Systematic review of RCTs |
AMSTAR (http://amstar.ca/) |
ROBIS (http://www.robis-tool.info) |
|
Systematic review of nonrandomized studies |
AMSTAR2 (in development; http://amstar.ca/Developments.php) |
ROBIS (http://www.robis-tool.info) |
|
RCT |
SIGN 50 RCT (http://www.sign.ac.uk/methodology/checklists.html) |
Cochrane Collaboration risk-of-bias tool (http://handbook.cochrane.org/chapter_8/8_5_the_cochrane_collaborations_tool_for_assessing_risk_of_bias.htm) |
|
Cohort study |
SIGN 50 cohort (http://www.sign.ac.uk/methodology/checklists.html) |
ROBINS (http://ofmpub.epa.gov/eims/eimscomm.getfile?p_download_id=526737) |
|
Case-control study |
SIGN 50 case-control (http://www.sign.ac.uk/methodology/checklists.html) |
ROBINS (http://ofmpub.epa.gov/eims/eimscomm.getfile?p_download_id=526737) |
|
Cross-sectional study |
SIGN 50 cohort or case-control (http://www.sign.ac.uk/methodology/checklists.html) |
ROBINS for cross-sectional studies is in development |
1 AMSTAR, A Measurement Tool to Assess Systematic Reviews; RCT, randomized controlled trial; ROBINS, Risk of Bias in Nonrandomized Studies; ROBIS, Risk of Bias in Systematic Reviews; SIGN 50, Scottish Intercollegiate Guidelines 50.
residual plausible confounding and “antagonistic bias.” The latter refers to bias that can result in underestimates of an observed effect. As noted previously, evidence based on observational studies will generally be appreciably weaker than evidence from RCTs and other intervention trials due to the likelihood of confounding and various biases, in particular dietary measurement bias. GRADE also considers study quality in its algorithms. There may be cases for which evidence from observational studies is rated as moderate or even high quality, because extremely large and consistent estimates of an effect’s magnitude increase confidence in the results. GRADE users assess and grade the overall quality of evidence for each important outcome as high, moderate, low, or very low. Users describe recommendations as weak or conditional (indicating a lack of confidence in the option) or strong (indicating confidence in the option) (20).
Food-substance applications
The AHRQ uses the AHRQ Methods Guide to grade the strength of the evidence for each outcome in a systematic review (86). The AHRQ explores differences in findings between observational and intervention studies as well as their risks of bias to offer possible explanations for interstudy disparities. The AHRQ summarizes ratings of the strength of the evidence in evidence profile tables that describe the reasoning for the overall rating. This approach builds on the GRADE method by requiring information on reporting biases (publication bias, outcome-reporting bias, and analysis-reporting bias). It incorporates the domains included in GRADE—the study limitations (risk of bias), consistency, directness, precision, intake-response association, strength of association, and plausible uncontrolled confounding—that would diminish an observed effect. AHRQ evidence reviews use additional guidance for scoring consistency and precision, grading bodies of evidence by study type, addressing high-risk-of-bias studies, and other topics. AHRQ evidence reviews grade the strength of the evidence as high, moderate, low, or insufficient, indicating the level of confidence in the findings.
Weighing the evidence
Establishing causality requires a careful evaluation of the weight of the evidence on causal associations between exposures and outcomes. This step can be complex, particularly in the presence of multiple sources of information, not all of which are consistent or of equal relevance or reliability. Systematic reviews can summarize the available evidence in a comprehensive and reproducible manner (87). However, they do not evaluate the weight of the evidence, which various DRI decisions require. Although the Bradford Hill criteria for evaluating causal associations provide useful general guidance on weighing the evidence on causality, more detailed guidance can also be helpful in some circumstances. The International Agency for Research on Cancer, for example, has a detailed scheme for identifying agents that can cause cancer in humans based on a careful evaluation of the available human, animal, and mechanistic data (88). An option for purposes of the committee’s charge is to develop an analogous scheme for assessing relations between food substances and chronic disease endpoints.
A review of 50 “weight-of-evidence” frameworks identified 4 key phases for assessments: 1) defining the causal question and developing criteria for study selection, 2) developing and applying criteria for the review of individual studies, 3) evaluating and integrating evidence, and 4) drawing conclusions on the basis of inferences (89). This review identified important attributes of a broadly applicable weight-of-evidence framework, although the authors did not develop such a framework.
Applicability to food-substance studies
The US National Research Council (90) identified systematic review, quality assessment, and weight of evidence as key components of a qualitative and quantitative risk-assessment paradigm (Figure 3). Each of these activities is also directly relevant to the establishment of DRIs, especially for those that are based on chronic disease endpoints. As with any synthesis of information on a population health risk issue, there is a need to carefully evaluate the available information and weigh the available evidence for causality in reaching conclusions about the association between food substances and chronic disease endpoints.
V-C. JUDGING THE EVIDENCE: OPTIONS FOR ADDRESSING EVIDENCE-RELATED CHALLENGES
This section identifies the challenges related to 2 DRI-based evidentiary decisions involved in assessing whether a food substance is causally related to a chronic disease. The first challenge deals with the type of endpoint (outcome or indicator) that is best suited to these DRI decisions. The second challenge addresses the desired level of confidence in the available evidence that the food substance and chronic disease relation is valid. The decisions about which options to implement to address these evidence-related challenges need to be made in an integrative manner because decisions about how to address one challenge have implications for the nature of and responses to the other challenge.
Options for selecting chronic disease endpoints
An early step in the decision-making process associated with the development of a DRI value is the identification of potentially useful measures (indicators) that reflect a health outcome—in this case a chronic disease outcome—associated with the intake of the food substance of interest (15). If a DRI reference value is to be based on a chronic disease outcome, what types of indicators are appropriate to use in making these decisions? Studies vary in the type of outcome measured, ranging from direct measures of the chronic disease based on generally accepted diagnostic criteria to indirect assessment by using either a qualified surrogate marker of the chronic disease outcome or a nonqualified disease marker (Figure 2) (15). Guidance on selection of an indicator based on a chronic disease outcome would inform decisions as to whether newer types of DRI values specifically focused on chronic disease outcomes are more appropriate than are more traditional reference values (Table 4) (see section VI on intake-response relations). In addition, it would clarify applications for some major users of DRIs (e.g., regulatory, policy) for whom clear differentiation between chronic disease and functional endpoints is important for legal and programmatic purposes.
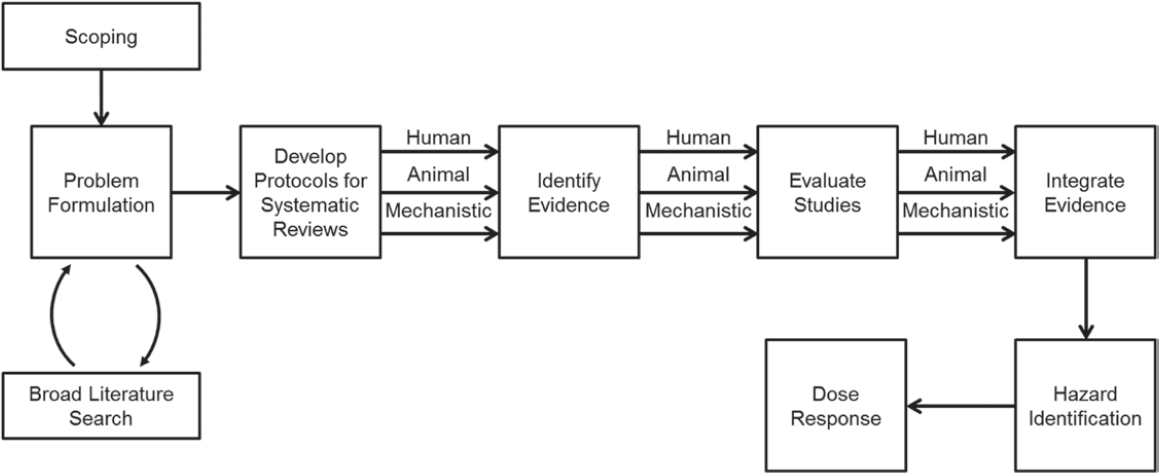
Option 1: Endpoint (outcome) is the incidence of a chronic disease or a qualified surrogate disease marker
The first option is to only accept study endpoints that are assessed by a chronic disease event as defined by accepted diagnostic criteria, including composite endpoints, when applicable, or by a qualified surrogate disease marker. These types of endpoints are associated with higher levels of confidence that the food-substance and chronic disease relation is causal than are nonqualified disease markers (Figure 2). However, few RCTs designed to evaluate the relation of food substances to chronic diseases have used a chronic disease event as the outcome measure. In addition, only a few qualified surrogate markers of chronic disease are available for evaluations of the relation between food substances and chronic disease outcomes. The process of qualifying a surrogate disease marker for evaluating food-substance and chronic disease relations requires sound science and expert judgment (6). Much of the evidence in which outcomes are assessed as a chronic disease event comes from observational studies, and uncertainty is greater about whether relations are causal with data from observational studies than from RCTs (Figure 1). In addition, some of the evidence would likely come from RCTs with chronic disease outcomes assessed by qualified surrogate disease markers. These outcome measures would provide a reasonable basis, but not absolute certainty, that the relation between the food substance and chronic disease is causal (Figure 2). Depending on the level of confidence deemed acceptable for chronic disease–based DRI decisions about causation and intake-response relations (see options on level of confidence below), the use of this option could result in either a small body of evidence if high levels of confidence in the validity of the relation are deemed necessary (e.g., causality is based on the availability of RCTs with chronic disease or qualified surrogate disease outcomes) or a larger body of evidence if lower levels of confidence are acceptable (e.g., causality is inferred from observational studies with outcomes based on chronic disease events or qualified surrogate disease markers).
Option 2: Endpoint (outcome) may include nonqualified disease markers
To implement this option, a DRI committee would also accept studies with outcomes that are possible predictors of the chronic disease of interest but have not been qualified as surrogate disease markers because they lack sufficient evidence for this purpose. Examples of potential biomarkers of chronic disease risk include brain atrophy as the combination of low Aβ42 and high T-tau and P-tau levels for Alzheimer disease risk, endothelial dysfunction for atherosclerosis risk, and certain polymorphisms for neural tube defects. A large evidence base is available on relations between food substances and nonqualified chronic disease markers. However, DRI committees have rarely chosen these types of outcomes to establish a DRI value on the basis of a chronic disease endpoint (15).
Compared with option 1, this option increases the number of relations between food substances and chronic disease outcomes for which committees could establish DRIs. However, considerable uncertainty exists about whether decisions about causal relations on the basis of nonqualified disease markers are valid (6). The use of such outcome measures could therefore lead to a loss of confidence in the DRI process.
Options for acceptable levels of confidence that the relation is causal
The overall level of confidence deemed appropriate for DRI decisions on the relation between a food substance and a chronic disease is dependent on an integrated consideration of the type of endpoint that a DRI committee accepts (i.e., a chronic disease event, qualified surrogate disease marker, or a nonqualified disease marker) and the overall evidence rating of the totality of the evidence (Table 9). Establishing whether the evidence is sufficient to proceed with making a chronic disease–related DRI decision involves an evaluation of the level of confidence deemed appropriate to determine that the relation of the food substance of interest and the chronic disease is valid.
Option 1: Require a high level of confidence
The first option is to require a high level of confidence (e.g., level A; Table 9) that a proposed relation is causal. This level of confidence likely requires at least some evidence from high-quality RCTs in which the measured outcome is a chronic disease event or qualified surrogate disease marker.
A major advantage of this option is that it provides a robust basis for DRI decisions and therefore conclusions about the relation are unlikely to change substantially when new findings become available, although conclusions would probably need minor modifications to integrate the new evidence. This option would enhance both user and consumer confidence by reducing the likelihood of major changes in DRI decisions over time. Initially, DRI committees could only use this approach to establish DRIs on the basis of a few relations between food substances and chronic diseases because of the limited number of high-quality studies with primary chronic disease outcomes that are currently available or likely to become available in the near future.
Past experience shows the value of this option. For example, consistent results from several observational studies and evidence of biological plausibility suggested that β-carotene reduces the risk of lung cancer, vitamin E lowers the risk of both CVD and prostate cancer, and B vitamins reduce the risk of CVD. However, subsequent large clinical trials failed to support these initial conclusions (53–58). Therefore, conclusions of benefit based almost exclusively on strong and consistent evidence from observational studies would have been overturned by the subsequent availability of evidence from large RCTs.
Option 2: Use level B evidence
A second option is to also include level B evidence (defined in Table 9) as a basis for DRI decisions about causation. This level of evidence suggests a moderate degree of confidence that the relation of interest is causal, but new findings could change the DRI decision. This approach allows committees to establish DRI reference values for more topics than in option 1 that are related to chronic diseases. However, early conclusions based on strong observational evidence and trials that used nonqualified outcomes often need to change because of the conflicting results of subsequent RCTs, as the examples for option 1 show. This option therefore has a risk of a loss of confidence in DRI decisions.
Option 3: Use actual level of certainty
The third option is to identify the actual level of certainty [e.g., levels A, B, C, or D, as defined in Table 9, or GRADE levels of high, moderate, low, or very low (insufficient)] for each DRI reference value based on a chronic disease endpoint. The advantage of this approach is that it provides more information than do options 1 and 2 about the scientific evidence that supports a given relation between a food substance and a chronic disease endpoint. A disadvantage is that DRI values may become separated from grading scores as they are used and applied, thus inadvertently suggesting that all DRI values are based on evidence of similar strength. Decisions about this option would benefit from evidence that shows that users take the evidence grades into account when they use such DRI reference values.
Option 4: Make decisions on a case-by-case basis
The fourth option is to make decisions about the strength of evidence appropriate to support a conclusion about the relation between a given food substance and a chronic disease endpoint on a case-by-case basis. This option maximizes flexibility for DRI committees and can enable them to consider other factors (e.g., the public health importance of the relation). However, a major disadvantage is that this option could lead to inconsistency among DRI reviews, which could reduce the confidence of users in DRI reference values. This approach is also inconsistent with the grading-of-evidence approach that many health professional organizations and government agencies are now using.
VI. INTAKE-RESPONSE RELATIONS
Once a DRI committee establishes a causal relation between the intake of a food substance and the risk of $1 chronic disease, it must determine the intake-response relation so that it can establish a DRI. Ultimately, the reference value and how users can apply it depend on the decisions that the committee made when it established the intake-response relation between a chronic disease indicator and the observed intakes of a food substance. A number of conceptual challenges have made it difficult to apply the traditional DRI framework to chronic disease endpoints, including how risk is expressed for chronic diseases, the multifactorial nature of chronic diseases, and the diversity of intake-response relations between food substances and chronic diseases. This section describes options for defining an acceptable level of confidence in the data that a DRI committee uses to determine intake-response relations after establishing causality, the types of reference values that could be set, and the types of indicators that could be used to set reference values and for avoiding overlap between beneficial intakes and intakes associated with harm.
Conceptual challenges
Previous committees have based DRIs on the intakes necessary to avoid classical nutritional deficiencies (i.e., EARs and RDAs) and unsafe intakes associated with toxicities or adverse events (i.e., ULs) (Figure 4, Table 1). Intake-response relations between traditional endpoints for nutrient requirements (i.e., deficiency diseases) and adverse events are often different from those between food substances and chronic disease endpoints (Table 4).
Absolute compared with relative risk
Previous DRI committees based their reference values on direct evidence from human studies that measured both intakes and outcomes, which allowed committees to develop quantitative intake-response relations on the basis of absolute risk, which is the risk of developing a given disease over time. At “low intakes,” these essential nutrients have intake-response-relation characteristics in which the known health risks, which are diseases of deficiency for essential nutrients, occur at very low intakes and can affect up to 100% of a population at a specified life stage, and the risk declines with increasing intakes. Inadequate intakes of essential nutrients are necessary to develop diseases of deficiency. The risk of a disease of deficiency is 0% when intakes are adequate, and an adequate level of intake is necessary to treat a deficiency disease. For example, chronically inadequate intakes of vitamin C are necessary and sufficient to develop scurvy, and the entire population is at risk of scurvy when intakes are inadequate. An adequate level of intake of vitamin C is necessary and sufficient to reverse the deficiency. At “high intakes,” it is assumed that these essential nutrients cause adverse health effects, including toxicity (Figure 4). As
TABLE 9 Level of confidence in DRI decisions1
| Chronic disease endpoint | Overall evidence rating based on evidence review | ||
|---|---|---|---|
| High | Medium | Low | |
| Chronic disease event | Level A | Level B | Levels C or D |
| Qualified surrogate disease marker | Levels A or B | Levels B or C | Levels C or D |
| Nonqualified outcome | Level C | Levels C or D | Level D |
1 Level A: highest degree of confidence that results are valid (e.g., “high”); level B: some uncertainty about validity of results (e.g., “moderate”); level C: considerable uncertainty about validity of results (e.g., “low”); level D: substantial uncertainty about validity of results (e.g., “insufficient”). DRI, Dietary Reference Intake.
with inadequate intakes, the absolute risk of an adverse effect from excessive intakes is represented as increasing from 0% to 100% with increasing intakes of the nutrient. All members of a population are assumed to be at risk of the adverse effect at sufficiently high intakes.
In contrast, DRI values based on chronic disease endpoints have been based on relative risk, which is risk in relation to another group. Past DRI committees used data from observational studies, which contain the biases described earlier in this report, primarily to calculate the relations between food substances (essential or otherwise) and chronic diseases because only a limited number of relevant RCTs are available in the published literature. The risk of the chronic disease based on observational and intervention studies is usually reported as relative to a baseline risk and is therefore not absolute. The baseline risk is never 0% or 100% within a population, and it can vary by subgroup [e.g., those with high blood pressure and/or high LDL cholesterol have a higher risk of CVD death than do those with lower blood pressure and LDL-cholesterol concentrations (91, 92)]. The intake of a given food substance might alter the risk of a disease by a small amount (e.g., <10%) compared with the baseline risk, but these changes could be very important from a public health perspective depending on the prevalence of the chronic disease (e.g., a 5% reduction in a highly prevalent disease could have a meaningful public health impact), severity, impact on quality of life, cost, and other factors. Conversely, the intake of a given food substance might alter the relative risk by a large amount compared with baseline risk, but changes in absolute risk could be small and have a less meaningful impact on public health (35).
Interactions of multiple factors
The pathogenesis of chronic disease is complex and often involves the interaction of multiple factors, in contrast to traditional endpoints that commonly are associated with interactions of fewer factors. Intakes of a group of food substances might contribute to the risk of a chronic disease, for example. The magnitude of risk might vary by intake, and several factors (e.g., behaviors or physiologic characteristics) might influence the risk. Furthermore, $1 food substances might be associated with >1 chronic disease. Finally, although a given food substance might contribute independently to the development of a chronic disease, changes in intake might not be necessary or sufficient to increase or decrease the risk of the chronic disease due to the complex interacting factors in the disease’s pathogenesis.
Shape of the intake-response curve
The shape of the intake-response relation curve can vary depending on whether the relation is between an essential nutrient and a deficiency disease or between a food substance and a chronic disease endpoint. The intake-response relation between a nutrient and a deficiency disease is often depicted as linear or monotonic within the range of inadequacy, whereas the relation between a food substance and a chronic disease indicator can be more diverse (e.g., linear, monotonic, or nonmonotonic). Nonmonotonic intake-response relation curves can be U-shaped, J-shaped, or asymptotic. Furthermore, a single food substance can have a causal relation with >1 chronic disease, and the intake-response curves for each relation can differ (30, 93). The effect of a nutrient intake on chronic disease risk might be saturable in some cases. Figure 5 shows examples of diverse intake-response relations between a food substance and a chronic disease or diseases.
DRI committees must take into account the statistical fit of the intake-response curve to the available data and its adherence or relevance to underlying biological mechanisms when determining the shape of the intake-response curve for a food substance and a chronic disease outcome. Deriving intake-response curves when single food substances affect multiple chronic diseases can be particularly challenging. Future DRI committees will need to determine whether to apply available statistical methods or to develop new ones to address these challenges (13). Ideally, future expressions of reference values will include estimates of uncertainties and interindividual variability.
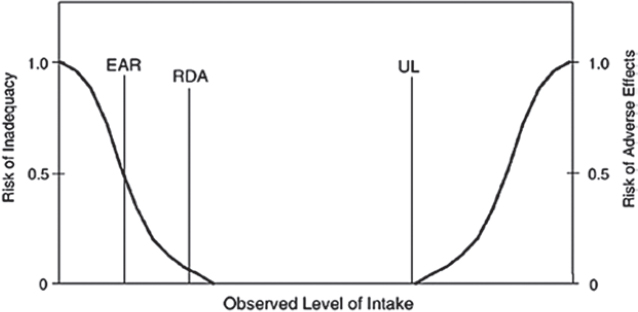
Examples of diverse intake-response relations between food substances and chronic disease endpoints that show the complexity of ensuring the statistical fit of the intake-response curve to the data include the following:
- The relative risk of coronary heart disease has a linear intake-response relation to fiber intakes and no apparent threshold for the beneficial effect. The DRI committee based the AI for fiber on the mean intake associated with the highest relative effect (24).
- The relation between the risk of dental caries and fluoride intake appears to have an inflection point and a critical value for statistically detectable risk reduction (dental caries prevention), but the range of intakes associated with benefit overlaps with the range of intakes associated with harm (fluorosis) (29).
- Omega-3 fatty acids and multiple chronic diseases, as suggested by results from observational studies, have several intake-response relations, depending on the chronic disease (30).
DRIs based on intake-response relations involving chronic diseases
DRI users include a wide range of organizations (e.g., health professional groups and societies and government agencies), many of which rely on DRI values to make decisions and to develop policies for their organization. These varied user groups have requested information to help them interpret findings in DRI reports (13). These groups have also asked DRI committees to present the information in a way that supports flexible applications while informing users of the nature of the available evidence and public health implications.
The approach to setting DRI values would be enhanced by transparency. Clear descriptions of the scientific and public health characteristics of the benefits and risks of the intake of a food substance are also valuable. For example, for each benefit and risk, descriptions could include the strength of the evidence, the sizes and characteristics of groups at risk, and the likelihood and severity of the risks. Users could then evaluate these descriptions to decide how to apply the DRIs in ways that address their organizational mission and decision-making framework.
Acceptable level of confidence in the intake-response data
Several options are available for determining the acceptable level of confidence in the data that a DRI committee uses to determine intake-response relations once it has data that establish a causal relation.
Option 1: Require a high confidence level
One option is to require a high level of confidence by, for example, using RCTs with a chronic disease event or a qualified surrogate disease marker as the outcome measure (Table 9). This approach typically requires usable intake-response data from RCTs, which is probably impractical because most RCTs have only 1 intervention dose or a limited number of doses. This option could result in failure to establish a DRI even though the data have established a causal relation. The use of this option is therefore unlikely to be optimal for public health because no reference value, or even a reasonable estimate of one, would be available for a documented relation between a food substance and a chronic disease.
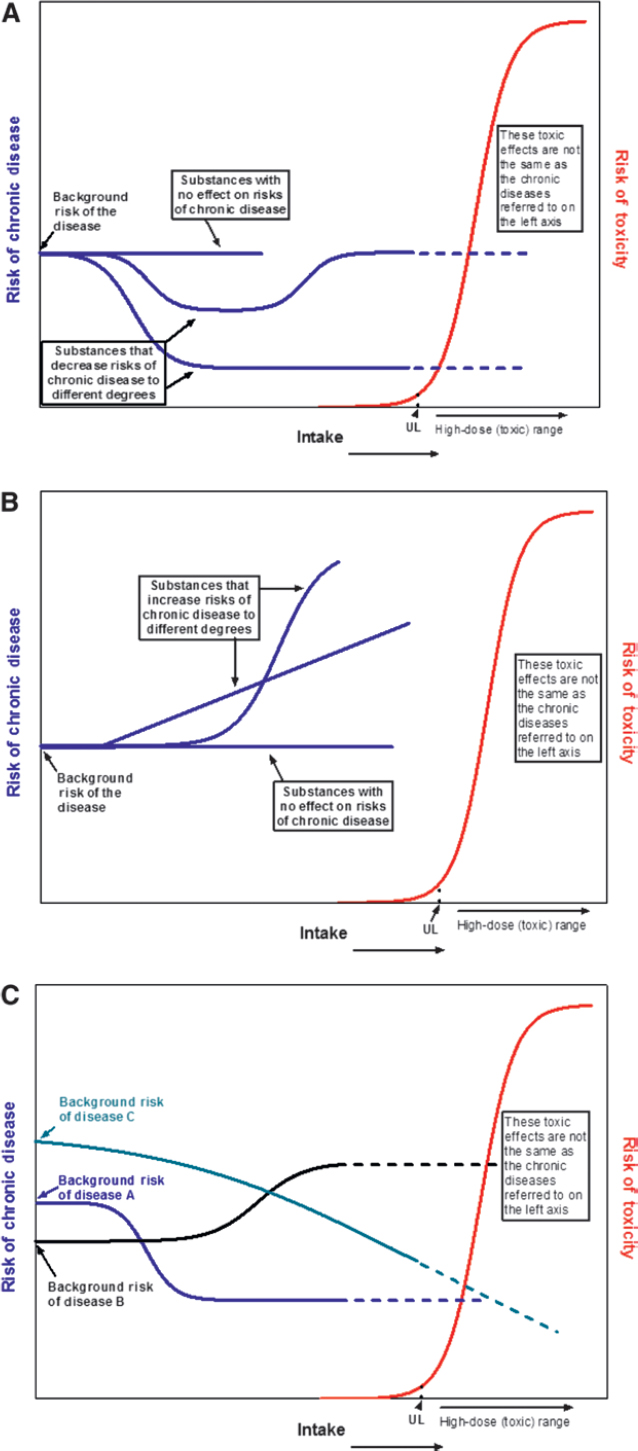
Option 2: Accept a moderate confidence level
Another option is to accept a moderate level of confidence in the data for decisions about intake-response relations (Table 9). DRI committees could then expand the types of data being considered to include high-quality observational studies with outcomes based on chronic disease events or qualified surrogate disease markers.
These data would likely be associated with some uncertainty (Table 9). For example, systematic biases in intake estimates are likely to affect intake-response data from observational studies. Intake-response data from intervention trials would likely lack some details on baseline intakes, making total intake estimates difficult. DRI committees would need to determine how much and what type of uncertainty are acceptable.
Option 3: Piecemeal approach
A third option is to “piece together” different relations in which the biomarker of interest is a common factor when direct evidence of the biomarker’s presence on the causal pathway between the food substance and a chronic disease is lacking. For example, if data show a quantitative relation between a food-substance intake and the biomarker of interest and other data show a quantitative relation between the biomarker of interest and the chronic disease, this evidence could be combined to establish a quantitative reference intake value for the chronic disease risk. This option has the advantage of relying on a wider breadth of the available evidence than the first 2 options and likely would enable DRI committees to consider more nutrient–chronic disease relations, but the approach would be fraught with uncertainties. Among its major disadvantages is its heavy reliance on expert judgments, which limit objectivity in its application.
Different types of reference values
Because of the conceptual issues discussed earlier in this section, reference values based on chronic disease endpoints likely need to be different from the traditional reference values for essential nutrients. Because many food substances share metabolic pathways, DRI committees could consider joint DRI values for groups of related food substances. Similarly, because a single dietary source might supply >1 food substance, DRI committees could base reference values on groups of food substances to prevent harm (e.g., to minimize the risk that limiting the intake of 1 food substance will produce undesirable changes in intakes of other food substances). If a DRI committee uses a variety of chronic disease endpoints or a family of targeted food-substance-intake reductions to establish reference intake values, this process is likely to be strengthened by enhanced transparency and the estimation of associated uncertainties. Providing information on how benefits and risks are weighted would also likely assist users in their applications of derived values.
The impact of DRI values would likely be strengthened if their potential uses are considered in their derivation. Previous DRI committees have identified differences in the applicability and use of different types of reference values for planning and assessment in groups and individuals (8, 10). For example, the AI has limited applicability to dietary assessments of groups (13). As DRI committees consider possible approaches to establish reference values for chronic disease endpoints, how the different types of reference values could meet user needs and how users could apply these values will remain critical considerations.
Types of reference values associated with benefit
Option 1: Establish chronic disease risk-reduction intake values (e.g., CDCVD). DRI committees could modify the traditional EAR/RDA approach to estimate the mean intakes of individuals and the interindividual variability associated with specified disease risk reductions. This option is conceptually very similar to the traditional EAR/RDA approach, but the definitions and interpretations of reference values based on chronic disease endpoints are different from those based on classical deficiency endpoints. This option uses relative risks and requires knowledge of baseline disease prevalence, whereas the traditional approach is based on absolute risks and is independent of baseline prevalence. The mean intake values and associated variances for given magnitudes of risk reduction give valuable information on the “typical” person and population variability. These values could, therefore, be useful for assessing population and group prevalence. Several adaptations of this option are possible, depending on the nature of the available data.
Adaptation 1 is to set a single chronic disease risk-reduction (CD) value at the level above which higher intakes are unlikely to further reduce the risk of a specific disease. Such values would be similar to traditional EAR/RDA values in that they would be a point estimate with some known variation (Figure 4). An advantage of this kind of reference value is its similarity to the traditional EAR/RDA, which could help users understand the value as well as its use and application. Furthermore, this approach requires a high level of evidence and an understanding of the uncertainty around the value, which could maximize confidence in the value and its uses. The data required to establish a single CD value of this type are probably very limited. However, the possibility of developing this type of value may guide research.
Adaptation 2 is to establish multiple reference values on the basis of the expected degree of disease-risk reduction across a spectrum of intakes to yield a family of targeted reductions for a given chronic disease outcome and potentially for a variety of disease indicators with distinct intake-response relations to the disease. If a DRI committee uses this adaptation, it may find it useful to consider such factors as the severity and prevalence of outcomes. For a given distribution of intake within the population that has a given mean and some variability, a DRI committee could establish the expected risk reduction and identify an expression of uncertainty. Multiple values could be established on the basis of >1 level of risk reduction.
Future DRI committees could establish reference values for different degrees of disease risk reduction and for different groups with different risk levels within a population. An advantage of this adaptation is that it gives users flexibility to choose reference values that meet their needs and are suitable for the risk profiles of individuals or groups to whom they apply the reference values. However, users could be confused about when and how to apply the different values. For this reason, the use of this adaptation requires careful attention to implementation guidance.
Adaptation 3 is for food substances that have causal relations at different intake levels to multiple chronic diseases. This adaptation
involves establishing different reference values for different diseases (e.g., CDCVD, CDcancer). In addition, for each relation with a different chronic disease, a DRI committee could identify a family of targeted risk reductions to establish multiple CD values, each of which would be associated with a specific degree of risk reduction.
An advantage of this option is that DRI committees could establish CD point estimates for specified risk reductions for $1 chronic disease, which would provide flexibility to both committees and users. This adaptation may make it easier than the other 2 adaptations for users to understand when (e.g., for a life stage with a higher risk of the disease) and to which population or populations (e.g., those at higher risk of a given disease) to apply the values. Establishing reference values for multiple chronic diseases requires the same level of evidence, or an equivalent kind of evidence, for each disease to ensure that committees can develop all values and users can apply them with the same level of confidence. A disadvantage is that establishing several values could confuse users about their appropriate application. DRI committees could minimize this confusion by developing appropriate guidance on how to implement the values.
Option 2: Identify ranges of beneficial intakes. In some cases, available data might be adequate only for deriving an intake range that can reduce the relative risk of a chronic disease to a specified extent. One end of this intake range is close to the point at which risk begins to decline or increase, depending on the relation, and the other end extends as far as the available evidence permits. The DRI committee could establish the range so that it does not increase the risk of adverse health effects (Figure 5A, B; see also section entitled “Options for resolving overlaps between benefit and harm” below and Figure 5C).
These reference values have a purpose similar to the estimated risk-reduction intake value for a chronic disease (option 1), except that data for making point estimates or for estimating interindividual variation are not available, making a point estimate impossible to develop. Advantages of this option are that the level of evidence it requires is less stringent than that required for option 1 and it provides flexibility to users. A disadvantage is that the value is associated with lower confidence but users might apply it with confidence if they are unaware of its limitations. The use of a range to assess the prevalence of beneficial intakes in a population might also be challenging. Users would need clear guidance on how to apply these kinds of values. This approach could incorporate the AMDRs because the AMDRs represent a range of intakes associated with macronutrient adequacy. Future committees could be charged to review how users could apply such an approach to intakes of macronutrients or their constituents (e.g., a protein compared with a specific amino acid).
ULs and reduction in chronic disease risk
The UL (Figure 4) is the highest average daily intake level likely to pose no risk of adverse health effects for nearly all people in a particular group (7). The UL is not a recommended level of intake but rather the highest intake that people can tolerate without the possibility of ill effects (7).
DRI committees have based most ULs on (often limited) evidence of toxicity or adverse events at a high nutrient intake level. Past DRI committees used a threshold model to calculate ULs, in which the intake-response relation has an inflection (threshold) point (11). Because of the paucity of evidence, most ULs were not based on chronic disease endpoints, although DRI committees tried to do so for a few nutrients (e.g., saturated and trans fats as well as sodium) with limited success (13). A key reason why basing ULs on chronic disease endpoints is so challenging is that the traditional UL definition is based on an intake level associated with no increase in absolute risk, whereas most data related to chronic disease risk are expressed as relative risk. When the interval between intakes associated with benefit and harm is wide and intakes associated with benefit do not overlap with those associated with harm (see below), options for setting the UL include the use of 1 or both traditional adverse events and chronic disease endpoints, depending on the nature and strength of the available evidence.
Option 1: Base ULs on the traditional threshold model. One option is to continue to base ULs on the traditional threshold model when UL values based on chronic disease endpoints are higher than those based on traditional adverse effects. The advantages of this approach are that it allows the DRI committee to evaluate and consider the evidence available for setting a UL on the basis of chronic disease risk, while also allowing the committee to set a traditional UL, which has an established process and its limitations and applications are well understood. However, many traditional ULs are based on (very) limited data. Therefore, a disadvantage is that this option could prevent a DRI committee from establishing a UL on the basis of chronic disease risk (ULCD) that is higher than the intake levels associated with a traditional adverse effect regardless of the evidence available to support the UL or public health implications of the chronic disease. To date, DRI committees have not set any EAR or RDA at intakes higher than the traditional UL to ensure safe intakes across the population. This has been the case even if the intake of a food substance has a beneficial effect on chronic disease risk that is continuous above the UL. A more detailed discussion of the issue of overlapping beneficial and risk curves is given below under the section entitled “Overlaps between benefits and harms.”
Option 2: Base ULCD on intakes associated with chronic disease risk. When the risk of a chronic disease increases at an intake below the traditional or current UL, a DRI committee could base a UL on chronic disease endpoints by using approaches analogous to the derivation of CD values (e.g., the development of 1 or multiple values for specified levels of relative risk reduction) or a threshold approach (e.g., identifying the inflection point at which absolute or relative risk increases). These values could be denoted as a chronic disease UL (ULCD) to distinguish them from a traditional UL. The ULCD would be set at a level below which lower intakes are unlikely to achieve additional risk reduction for a specified disease. The traditional UL definition would have to be expanded to include intakes associated with changes in relative risk (in contrast to absolute risk) of an adverse effect. Because the ULCD is based on changes in the relative risk of the chronic disease, intakes below the ULCD might reduce but not necessarily eliminate disease risk, reflecting the multifactorial nature of chronic diseases.
An advantage of basing ULs on chronic disease endpoints is that it maximizes public health benefit. In addition, this approach is straightforward, and users could apply such a UL in a similar manner to a traditional UL. Elimination or limits on intake (e.g.,
of sodium) might be challenging to achieve. Nonetheless, the availability of the type of intake-response information in Figure 5B might be useful for analyzing dietary patterns that minimize risk. This information could also be useful for identifying the magnitude of chronic disease risk reduction achievable with various intake levels. Intakes associated with acute toxicity could still be documented in DRI reports, and intakes below a traditional UL would eliminate the risk of toxicity.
Adaptation 1 is to base a family of UL values on multiple levels of risk reduction, multiple endpoints (adverse effects and/or chronic diseases), or both. A strength of this adaptation is that it acknowledges that the relation between food substances and chronic diseases might be continuous and not have a threshold. Another strength of this approach is its flexibility in the application of the various UL values. A disadvantage is that the determination of a desirable target risk reduction could be challenging. A DRI committee could define the intakes necessary to achieve specific risk reductions. However, users might need to identify the level of risk, or a range of risk levels, that is appropriate for their application. Clear guidance on the application of the ULCD values would be critical.
Overlaps between benefits and harms
Traditionally, the intakes of food substances associated with benefits and risks are separated by an interval that is large enough to prevent overlaps between the ranges associated with benefits and those associated with harms. Therefore, DRI committees have not typically needed to balance the risks and benefits of various intakes. However, intakes of some food substances associated with disease-risk reduction may overlap with intakes associated with adverse events, including increased chronic disease risk (Figure 5C). In some cases, the benefits and risks are associated with overlapping intakes of the same food substance (e.g., the same range of fluoride intakes is associated both with reductions in dental caries and fluorosis). In other cases, the intake level of 1 food substance that is associated with a reduced risk of a chronic disease could result in changes in intake levels of other food substances and thus of their associated benefits or risks (e.g., reducing intakes of a naturally occurring food substance to recommended levels might require drastic changes in dietary patterns that could reduce intakes of co-occurring essential nutrients found in the foods that contain the food substance being reduced, thereby potentially decreasing intakes of these other nutrients to levels below requirements). This could lead to inadvertent imbalances in the dietary pattern. It is also useful to consider whether risks and benefits occur within the same population or in disparate groups, such as in men or women, children or adults, high-risk populations or not, and so on. Several options for addressing overlap issues are described below.
Option 1: Avoid overlap between beneficial intakes and intakes associated with adverse events
One option is to ensure that no point estimate or range of beneficial intakes for chronic disease risk reduction extends beyond the intake at which the risk of adverse events, including chronic diseases, increases. An advantage of this option is that the UL is easily interpretable and applicable because it does not require users to balance benefits and risks. A disadvantage is that it does not acknowledge possible benefits above the intake level associated with adverse events or reflect the limitations in the evidence and uncertainty factors that DRI committees have used to establish many ULs. These committees did not balance benefits and risks when they weighed the evidence on various potential endpoints (e.g., risk of a chronic disease or an acute adverse event).
Option 2: Establish criteria related to severity and risk of chronic disease
Another option is to establish criteria for ULs on the basis of the minimum level of severity and prevalence of targeted chronic diseases and the degree of risk reduction associated with specified intakes. The DRI committee would apply analogous information on the nature of candidate adverse outcomes when establishing ULs. The advantage of this approach is that it allows DRI committees to evaluate the weight of the evidence for all endpoints. This approach limits considerations of risks and benefits to those that are biological, avoiding the need to take into consideration nonbiological factors (e.g., health care costs or quality of life). A challenge is integrating and interpreting the evidence for all endpoints.
Option 3: Describe the nature of the evidence
Another option is to simply describe the nature of the evidence (e.g., type of evidence, quality, strength) and the public health implications of benefits and risks for the full range of intakes for which inferences are reasonably possible, along with remaining uncertainties. Ultimately, users would choose an appropriate balance between benefits and harms for their population of interest. An advantage is that this option allows the DRI committee to make science-based evaluations of the evidence and allows maximum flexibility for users in choosing the appropriate mix of risks and benefits for particular groups or scenarios when they apply the reference values. A challenge is the need to develop clear guidance on interpreting different types of reference values and on appropriate and inappropriate applications (8, 10). A disadvantage is that users might apply such reference values inappropriately.
Selecting indicators and specifying intake-response relations
This section focuses on options for addressing challenges associated with intake-response curves that are based on chronic disease endpoints, including the selection of indicators, confounding, and extrapolation to other age and sex groups.
Qualified surrogate disease markers and nonqualified disease markers
Chronic diseases often have a range of indicators of variable prognostic value (e.g., metabolic perturbations, proteomic changes, or changes in a physiologic function). These indicators are sometimes also on the causal pathway between a food substance and the risk of the disease (Figure 2). Although identifying the intake-response relations between food substances and targeted chronic disease events is highly desirable, this goal is not always achievable. Therefore, DRI committees would use indicators on the causal pathway between a food substance and a chronic disease to establish reference intake values. Qualified surrogate
disease markers provide the strongest evidence of a relation between the intake of a food substance and risk of a chronic disease. However, the list of qualified surrogate disease markers is short (6). The use of a nonqualified disease marker of intake-response is associated with higher uncertainty. Supporting mechanistic data for all indicators are desirable. Once a DRI committee has determined that the relation between the intake of a food substance and a chronic disease risk is causal, it has several options for selecting an indicator to quantify putative intake-response relations.
Option 1: Choose a single outcome indicator on the causal pathway. One option is to select a single outcome indicator that is on the causal pathway, provided that it is sufficiently sensitive to quantify the relation between a food substance and a chronic disease. An advantage is that because this option is similar to the current approach for setting DRI values, it is straightforward and clearly understood. A disadvantage is that it could lead DRI committees to discard other valid indicators that describe other relevant intake-response relations. In addition, the indicator that the committee chooses might not accurately portray the relation between a food substance and an endpoint that is relevant to groups with diverse genetic backgrounds or diverse health habits.
Option 2: Use multiple indicators of a chronic disease. A second option is to integrate information from multiple indicators of a given chronic disease that add substantially to the accuracy of the intake-response relation and the development of a reference value. The advantage of this approach is that it allows multiple, and possibly different, intake-response relations between the intake of a food substance and a chronic disease endpoint to be integrated. The use of this option helps the DRI committee understand variations in uncertainties about a given intake estimate associated with a chronic disease that is measured by multiple indicators. A challenge is that integrating information from multiple indicators could be complex, and the use of this option might require the development and validation of new statistical models.
Option 3: Use of multiple indicators for multiple diseases. DRI committees might need to use a third option when a single food substance has different intake-response relations with multiple chronic diseases (30). In this situation, the committee might need to develop criteria for selecting appropriate disease indicators to establish multiple intake-response relations, methods to integrate multiple endpoints, and approaches to account for the inevitable interindividual variability in the relations of interest. A committee might develop different reference values for each disease endpoint. The advantage of this approach is that it takes into consideration the full landscape of evidence on a given food substance. This option also gives users flexibility in applying the reference values that are most relevant to individuals or populations of interest. A disadvantage is that if a DRI committee establishes a single, integrated reference value by using this approach, this value might not be consistent with increasingly attractive approaches that fall under the category of precision or personalized medicine. A challenge is the need to develop a methodology to integrate this kind of evidence.
If a DRI committee uses a substitute outcome (qualified surrogate or nonqualified disease marker) to establish a DRI value, committees typically need to evaluate the evidence that supports the putative relations between surrogate outcomes and the intake-chronic disease relation. In most cases, data that show the relation between a qualified surrogate disease marker and a chronic disease would be available from existing sources.
Biomarkers of intake
To implement each of these options, DRI committees can use available intake biomarkers in place of or complementary to dietary intake data to determine intake-response relations. The advantage of doing so is that it minimizes nonrandom errors and biases linked to self-reported dietary intakes. A challenge is that qualified biomarkers of intake are not available for many food substances. In qualifying these as surrogate intake markers, any inherent errors or biases, as described in the section entitled “Factors that influence or confound intake-response relations” below, may need to be taken into account.
Mode-of-action frameworks
The use of a statistical approach is 1 way to establish the intake-response relation between a food substance and a chronic disease (13). However, disease pathogenic processes are often gradual and cumulative. DRI committees can use a number of indicators on causal pathways between food-substance intakes and risks of chronic diseases to determine intake-response relations. For this reason, biological approaches that use a mode-of-action framework can provide information on relations between food substances and chronic diseases. Such a framework takes into account the role of biological mechanisms in establishing quantitative reference intakes. The application of a biological framework requires knowledge of the key molecular events, biological systems, and biological pathways that a food-substance intake modifies (94). This approach has been proposed for the development of ULs, although it could also be useful for establishing relations between food substances and chronic disease endpoints (94).
Issues to consider when applying biological frameworks
Issues for DRI committees to consider include whether chronic disease risks respond to food-substance intakes and the potential severity of ultimate biological effects if prevention does not occur at an early, more modifiable phase of the disease process. The intake-response relation between a food substance and key events in the pathogenesis of a chronic disease might not be linear at all intakes or at all periods of exposure. Cumulative processes might proceed continuously, but incrementally over time and might surpass a threshold of reversibility. Examples of reversible events include enzyme inhibition and modest losses of readily replaceable cell types. Examples of events that are irreversible or difficult to reverse include the loss of cells that do not typically proliferate, such as many types of neurons whose loss causes chronic neurological diseases. Individuals in a population have a continuous distribution of these processes or events. The reversible or irreversible nature of key intermediate events in the causal chain affects whether targeted effects might respond to nutritional interventions and the dynamics of these potential benefits. Knowledge of these key events and their impact on intake-response relations could inform the establishment of DRI values based on chronic disease endpoints.
Factors that influence or confound intake-response relations
The accurate description of intake-response relations between food substances and chronic diseases depends heavily on the accuracy of the measurements of intakes and disease outcomes. Many methods produce inaccurate and inconsistent estimates of intakes of diverse food substances. For example, food-frequency questionnaires tend to be more biased than 24-h recalls or records when measuring energy intakes (44). Even the “gold standard” weighed food records result in underreporting of energy intakes (95). In addition, the use of outdated or flawed food-composition databases can introduce errors, and food-substance bioavailability can vary by food matrix or source (e.g., the bioavailability of naturally occurring folates differs from that of folic acid). To add to this complexity, some food substances (e.g., short-chain fatty acids, vitamin D, vitamin K, and folate) have nondietary sources, including the microbiome and metabolic processes that contribute to exposure but that dietary intake estimates cannot quantify. Random measurement errors often attenuate observed associations between intakes and chronic disease risks. Systematic assessment biases can also distort these associations, particularly if they are based on dietary self-reports. Nonrandom errors in estimates of dietary intake bias the regression relation in that the intercept is overestimated and the slope is underestimated. Such errors can result in highly variable and often biased intake measures that serve as the basis for substantial underestimates of intake and/or distortions of intake-response relations. For these reasons, biases related to measurement error require attention in the calculation of intake-response relations.
It is possible to overcome these shortcomings by using qualified biomarkers of food-substance intakes and exposures. Biomarkers of intake (not status) can mitigate or correct the biases associated with self-reported dietary intake data, but they are only available for a few food substances (e.g., urinary nitrogen is a biomarker for protein) (44, 67). Metabolomics is a promising approach for identifying new biomarkers that reflect nutritional intake or exposure in biological samples, such as blood or urine. Researchers can use these biomarkers, such as metabolite production by diet-dependent gut microbiota, to track dietary intakes and other exposures (96, 97). Finding biomarkers of long-term intakes is likely to be particularly challenging, however.
In determining intake-response relations, clinical events (e.g., CVD outcome such as stroke or heart attack) or qualified surrogate disease markers are nearly always preferable as the outcome measure because they can provide a moderate to high level of confidence in the reference values depending on the quality of the evidence (Table 9). However, intake-response data from RCTs based on clinical endpoints are seldom available and are often impractical to obtain. In additon, there are a limited number of qualified surrogate disease markers. Chronic disease outcome measures are more readily available from observational studies, but these study designs are subject to the systematic biases associated with self-reported intakes. Thus, calculations of intake-response relations might need to use less-than-ideal outcome data and/or be derived from observational studies. In these cases, DRI committees could consider and describe the associated uncertainties. The use of these types of outcome measures and study designs requires accurate and consistent measurement of chronic disease indicators and knowledge of assay biases. Random errors in the measurement of the dependent variable, which could be a disease or its biomarker, distort or obscure intake-response relations but do not necessarily bias them.
Extrapolation of intake-response data
DRI committees have often extrapolated intake reference values from a single life-stage or age and sex group to other life-stage and age and sex groups in the absence of group-specific data, with the primary aim of preventing deficiency diseases (13). Relations between food substances and chronic diseases may differ substantially by life stage, physiologic state, and time since exposure. Therefore, the extrapolation of DRI values based on chronic disease endpoints might be more challenging than of those based on deficiency disease criteria.
A framework to develop DRI values on the basis of chronic disease endpoints would benefit from the a priori development of criteria for appropriate use of imputation (and/or extrapolation). In developing such criteria, differences in background risk in subpopulations will be useful to consider. Figure 5A, B depicts a single risk background as the starting point from which food-substance intakes can modify chronic disease risk. However, background risk levels differ by population. Such differences probably alter intake-response relations between food substances and chronic diseases.
Option 1: Establish reference intake values only for similar populations
One option is to establish DRI values on the basis of chronic disease endpoints only for populations that are similar to studied groups. This differs from setting traditional DRI values for essential nutrients for which a value was set for all groups. The advantage is that the basis for the recommendation is very strong because of the limited chance of added error or uncertainty due to extrapolation. The disadvantage is that the reference values for health benefit or risk would apply only to selected subgroups even if they benefit others.
Option 2: Allow extrapolation when sufficient evidence is available
A second option is to allow extrapolation when sufficient evidence shows that specific intakes of a food substance can increase or decrease the risk of a chronic disease. An advantage is the option’s potential to extend reference values to unstudied populations. A disadvantage is that the science supporting extrapolation is weak, and this option could lead to the perception that a given intake is associated with a health effect when direct evidence of such an association does not exist. DRI committees need reliable methods to extrapolate the effects of a food substance on a chronic disease. One possible approach is to incorporate baseline variances by assuming the central tendency of the population while taking changes in demographic characteristics (e.g., in age or body weight) into consideration. A potentially useful approach is to define the population distribution of susceptibilities to different chronic diseases in relation to food-substance intakes over time periods that are specific to individual causal processes. DRI committees can use such
distributions to conduct analyses that juxtapose changes in population benefits and risks that are likely to result from defined changes in dietary intakes.
VII. DRI PROCESS
Inclusion of chronic disease endpoints in future DRIs
Substantial challenges persist in basing reference intake values on chronic disease endpoints (22). One challenge is the paucity of sufficiently relevant and robust evidence for evaluating causality in suspected relations between food substances and chronic diseases. A second challenge is the frequent inappropriateness of the present EAR/RDA and UL frameworks for deriving DRIs on the basis of chronic disease endpoints. This situation is counterbalanced by improved tools to assess the quality of available evidence, increasingly transparent and rigorous approaches for synthesizing evidence, and new evidence likely to become available in the future. The promise of major technological advances and emerging scientific knowledge support the need for continuing attention to this area (see sections V-A and V-B) and the continued explicit consideration of chronic disease endpoints in DRI deliberations.
The approach (see section IV) a DRI committee chooses for establishing DRIs depends on the nature of the available evidence and/or the targeted endpoint or endpoints. Although a nutrient deficiency has a single direct cause (i.e., an inadequate intake), chronic diseases have multiple causes. Furthermore, a food substance can have multiple biological effects that are or are not on a disease’s causal pathway, a food substance might modify the risk of >1 chronic disease, and intakes might have different effects at different life stages. In addition, absolute and often more immediate risks characterize classical relations between food substances and deficiencies, whereas relations between food substances and chronic diseases are most often reported as relative risks. The resultant pathology often becomes evident only after prolonged relevant exposures.
Such differences between nutrient deficiency diseases and chronic disease risk reduction require distinct definitions for reference values. These differences also have implications for the interpretation of reference values. Reference values for chronic disease relations usually reflect “optimal” intakes, whereas those for nutrient deficiencies are based on intake requirements to prevent deficiencies (98). DRI committees must often express reference values for chronic diseases as reductions in specific relative risks that vary by intake.
Ideally, future DRI values will be more applicable to specific population groups and more relevant to diverse settings, and they will better target chronic disease risks. The challenges that we have reviewed in the earlier sections underscore the fact that the broader incorporation of chronic disease endpoints into DRIs requires more sophisticated approaches than those that DRI committees have previously used. This section describes procedural issues pertaining to how to accommodate chronic disease endpoints into future DRI review processes.
Process components and options
The process to establish the current DRI values consisted of reviewing a group of related food substances that clearly focus on essential nutrients. When DRI committees selected indicators for setting reference values for adequacy or benefit and for potential increases in risk of harm, they considered both classical nutrient deficiency and chronic disease endpoints. The endpoint they selected depended primarily on the strength of the available evidence. DRI committees estimated reference values for adequacy (i.e., an EAR/RDA or AI) and increased risk (i.e., UL) across life-stage groups often by using extrapolations. Summary tables of reference values for adequacy did not identify whether selected endpoints were based on classical nutrient deficiency or chronic disease endpoints. ULs were based on measures of toxicity. Users had to consult the supporting text to determine the nature of the indicators or endpoints used. The continued need for reference intake values based on either classical nutrient endpoints or chronic disease risk and the attendant challenges suggest $2 options.
Option 1: Continue to use a single DRI development process
One option is to continue considering chronic disease endpoints in future DRI reviews but to expand the types of reference values to clearly distinguish those based on classical nutrient adequacy from those based on chronic disease endpoints (Table 4). This option makes the addition of CDXX (where XX denotes the specific chronic disease) and ULCD values or ranges a natural extension of the current process. A major advantage is that DRI committees would continue to use a single process to develop all reference values for individual food substances (or small groups of food substances). To enhance the usability of this option, future reference value summary tables could clearly describe the nature of the health indicator that the DRI committee used to establish each of the dietary reference values (e.g., EAR based on a disease of deficiency, CDXX based on a chronic disease, UL based on traditional toxicities, ULCD based on a chronic disease). The simultaneous review and establishment of all values related to $1 food substances would ensure consistency, when appropriate, among the multiple endpoints that a committee used. This approach also allows committees to suggest how to apply the various values (e.g., the populations to which these values apply under given conditions).
The challenges to continuing to include reference values based on chronic disease risk reduction within the DRI process result from experiences of DRI committees in applying the present framework to chronic disease endpoints and the expanding understanding of the pathophysiology of diseases of interest. Therefore, this option requires an expanded set of approaches for setting reference values (as described in section VI) because the current EAR/RDA and UL models often do not work well for chronic disease endpoints. This option also likely requires the development of criteria and approaches for addressing the types of evidence available for evaluating relations between food substances and chronic diseases, as described in section V-A.
An advantage is that this option would integrate multiple disciplines because future DRI committees would need a broader range of expertise than previous DRI committees, bringing an interdisciplinary approach to the setting of DRI values. However, reaching consensus among experts with different experiences, subject matter knowledge, and public health perspectives could be more challenging than narrower approaches.
Option 2: Create 2 separate processes for developing DRIs
A second option is to create 2 separate but complementary, and possibly iterative or integrated, committees to develop reference values on the basis of chronic disease endpoints or deficiency diseases. The FNB or a government agency could appoint a new committee to establish reference values on the basis of chronic disease endpoints, or an existing group that is independent of the National Academies of Sciences, Engineering, and Medicine (e.g., expert panels from chronic disease societies or standing government advisory committees) could establish these reference values. This new reference-setting group would coordinate its activities closely with the current DRI process based on adequacy.
As the volume of data grows over time, a challenge of incorporating chronic disease endpoints into current DRI processes will be appointing expert groups that can adequately address the challenges of analyzing all of the relevant evidence and calculating intake-response relations on the basis of either classical nutrient deficiencies or relations with chronic diseases for specific nutrients or groups of nutrients. Therefore, an advantage is that this option could allow committees to focus on the literature and challenges associated only with classical nutrient risks or with chronic diseases. Close coordination of these 2 committees would enhance the likelihood of consistent approaches to reference value development for the same food substances while engaging individuals with the most relevant expertise and, subsequently, more relevant audiences in the implementation of these reference values.
However, coordinating 2 separate committees is more complex than the current approach. The content experts who can best evaluate chronic disease risk might not be familiar with DRI processes and applications. A major disadvantage is that if coordination is not successful, the risk is high of developing contradictory reference values because committees could use different methods and frameworks. In addition, coordinating >1 panel will be more time-consuming and costly than the current structure. Another major disadvantage is that a single, internationally recognized authoritative body (i.e., the FNB) manages the current DRI process. As a result, the deliberations and decision-making processes of DRI committees are independent of vested interests, which enhance the integrity and status of their decisions. Assigning 2 separate, but coordinated, committees to develop reference values for the same food substances might not achieve the desired level of independence and integrity.
Starting-point issues and options
The starting point of current DRI processes is individual food substances, and DRI committees consider all pertinent outcomes related to varying intakes of given food substances. A possible alternative is to start with a chronic disease or diseases and then identify all food substances with established effects on that disease.
Option 1: Establish DRIs for individual or small groups of interrelated food substances
Advantages of this option are that it is consistent with current DRI approaches and that some key uses (e.g., for regulatory purposes) involve individual food substances. A disadvantage is the difficulty of separating the effects of individual food substances from those of diets and dietary patterns when addressing chronic disease relations. Most of the available evidence comes from observational studies with the strong potential to confound relations between multiple food substances and targeted chronic diseases.
Option 2: Establish DRIs for multiple food substances on the basis of a chronic disease endpoint
This approach requires a different paradigm than the one that DRI committees currently use. For each selected chronic disease, DRI committees would develop a reference value for all food substances that have a causal relation with the risk of that disease. This approach could probably accommodate interactions between food substances more easily than option 1. Because this approach is different from the current DRI approach, it would require a separate process or a major revamping and expansion of the current process. Developing DRIs in this way would be more complex and probably more expensive. Such a process would probably also require some a priori criteria to limit the number of chronic diseases that DRI committees consider to a manageable number. As a result, DRI committees might be unable to address some chronic diseases for which evidence of benefit of certain food-substance intakes exists (e.g., lutein and reduced risk of macular degeneration) but that do not receive a high-enough priority rating for the committee to consider them. This process could also compete with existing approaches to chronic disease prevention, such as the processes that chronic disease societies use to develop guidelines for disease prevention, which could lead to inconsistent recommendations.
VIII. FORTHCOMING TOOLS
The challenges identified by the working group led them to briefly consider examples of forthcoming tools and novel study designs of potential future utility in overcoming anticipated hurdles (e.g., addressing complexities related to multiple, interactive etiologies and longitudinal characteristics of chronic diseases). Neither the tools nor the study designs that we considered are under development specifically for establishing food-substance reference values. We viewed these examples as potentially adaptable to future DRI processes that focus on relations between food substances and chronic diseases and that represent research opportunities (Table 10).
Biomarker-based dietary assessment
As noted above, most of the literature on dietary factors in relation to chronic disease is based on observational studies that use self-report tools for individual dietary assessment. These intake-assessment tools are known to be associated with substantial underestimation biases, particularly for energy intakes (66, 67). However, for a few nutritional variables, there is an established biomarker of short-term intake; the most notable examples are a doubly labeled water biomarker for energy (99) and a urinary nitrogen biomarker for protein (100). The self-report data do not align well with these biomarkers, especially for energy, where correlations are mainly in the range of 0.0–0.2 [e.g. (67)]. Furthermore, when studies used these biomarkers to correct (calibrate) associations between energy consumption and chronic disease, they found strong positive associations for
TABLE 10 Opportunities for research related to basing DRIs on chronic disease endpoints
| Report section or subsection | Topic |
|---|---|
|
Biomarkers of intake |
Evaluation and qualification of biomarkers of long-term food substance intake |
|
Selection of chronic disease outcome measures |
Evaluation and qualification of biomarkers of chronic diseases |
|
Tools for assessing the evidence |
Development of tools for integrating food substance–specific quality of evidence criteria with generic criteria for evaluating study quality |
|
Options for acceptable levels of confidence that the relation is causal |
Development of level of evidence criteria for setting different types of DRI values on the basis of chronic disease endpoints |
|
Shape of the intake-response curve |
Development of statistical approaches and theoretical paradigms for integrating diverse relations between food substances and chronic diseases, such as U-shaped intake-risk modeling |
| Forthcoming tools |
Further evaluation and consideration of criteria for assessing the utility of Mendelian randomization for setting DRI values Further evaluation and consideration of systems science in setting DRI values Further evaluation and consideration of the usefulness of evolving concepts and understanding of precision medicine in setting DRI values developed specifically for individuals |
1 DRI, Dietary Reference Intake.
prominent vascular diseases, cancers, and diabetes (with some caveat about the need to use BMI for intake assessment in the calibration procedure) that are not evident without biomarker calibration (45). This experience suggests that a concerted research effort to develop qualified surrogate intake biomarkers for additional dietary substances (e.g., the use of metabolomics profiles in urine and blood) could create important opportunities to strengthen information on associations between diet and chronic disease outcomes for use in future DRIs and for other purposes. This approach could also allow observational study researchers to reduce their dependence on dietary self-report intake data and instead measure qualified biomarkers—for example, in stored biospecimens—to analyze prospective cohort data in a case-control mode.
Mendelian randomization and causality
The impact of factors, such as confounding and reverse causation, cannot be underestimated when data derived from observational studies are considered. However, in the absence of RCT data, Mendelian randomization may provide useful information for making causal inferences about observed associations between a food substance and a chronic disease in an observational study. This method uses genetic variants within a population that modify the relation between an “exposure” and a phenotype. DRI committees could use genetic variants that modify the status or metabolism of a food substance to assess its relation to chronic disease risk with consideration of the limitations of this approach. For example, studies have examined the relations between gene variants that modify circulating 25-hydroxyvitamin D concentrations and the risk of several chronic diseases, including multiple sclerosis (51) and CVD (50), all-cause mortality (48), and surrogate endpoints, such as hypertension (49). Other studies have examined the association between gene variants that modify circulating triglycerides and coronary artery disease (101) or HDL cholesterol and type 2 diabetes (102). These studies might offer an alternative or complementary approach for inferring causality in specific situations.
U-shaped dose-risk relations
Researchers have modeled the U-shaped exposure-risk relation for copper by using severity scoring and categorical regression analysis to develop a single intake value that balances the risk of deficiency with that of adverse events, including toxicity (103). This approach could simultaneously fit multiple endpoints (e.g., deficiency, chronic disease, and excess) to a U-shaped or J-shaped intake-response curve that maximizes benefit and minimizes the probability of an adverse outcome due to either excess or inadequate intake of a food substance. The bottom of the U-shaped curve for copper minimizes the total risk of an adverse outcome due to excess or deficiency (or both), and this curve provides a possible benchmark for establishing dietary reference intake values for food substances with U-shaped intake-response relations. Confidence limits around the value might also be useful in establishing an allowable range of intakes (103).
An advantage is that this approach integrates the risk of multiple endpoints, including those that are beneficial or adverse, related to the intake of a nutrient while enabling a single best estimate of the exposure that minimizes overall risk. A challenge is the likely lack of accurate data on intakes that result in deficiency, chronic disease, and/or toxicity in different population groups or of the ability to integrate all endpoints. In addition, the categorization of endpoints and the use of scoring criteria to categorize outcome severity are subjective, which may result in bias. Some information or data are “hidden” in the model, which reduces transparency. This approach could limit flexibility in the application of (multiple) reference values associated with a single endpoint (or variety of endpoints) and the use of these values in personalized medicine because it results in the development of a single optimized value or range. However, the approach might be valuable for setting optimized intake values for food substances that have a narrow range or no range between maximal benefit and minimal harm.
Enhanced function-based DRIs
The options in this document focus on the risk of chronic disease. However, it might be possible to apply these or similar
options to the relation between food substances and enhanced function, possibly within the normal range. Examples of endpoints include enhanced cognition and endothelial elasticity. However, because DRI-based conclusions serve as authoritative statements for health claims on food labels, it would need to be clear that reference values based on enhanced function do not necessarily reduce chronic disease risk and are outside the context of chronic disease risk reduction. The interpretation and use of these values could be challenging. Concerns similar to those about biomarkers of chronic disease endpoints apply to biomarkers of enhanced function. In addition, the concept of enhanced function might be more similar to the concept of nutrient adequacy than to that of chronic disease risk.
Systems science
Systems science is an interdisciplinary field that focuses on the nature of simple to complex systems that aims to develop interdisciplinary foundations that are applicable in a variety of areas, such as biology, medicine, and nutrition. The relations between nutrition and disease are complex and bidirectional (104). For example, many infectious diseases cause malnourishment even when the food and nutrient supply is consistent with current reference intakes. Another example is that malnourished and overnourished obese people are more susceptible to many diseases, including infectious diseases. Systems science could potentially integrate the multitude of factors that influence mechanistic relations between a food substance and a chronic disease, including such variables as compromised immune function, reduced epithelial integrity, an altered microbiome, oxidative stress, and other functions. Equally important is that systems science might enable the more effective inclusion of longitudinal aspects of relations between diet and chronic disease across life stages. Comprehensive system frameworks would be necessary that link dietary patterns and intakes of specific food substances to food-substance absorption, metabolism, bioactivity, excretion, tissue uptake, and function along with a variety of metabolic and functional health endpoints and food-substance to food-substance interactions. This tool also could accommodate the added complexity of environmental and behavioral factors that influence diet-disease risk relations. If successful, this approach would improve the ability to recommend what, when, and how to eat and what to prioritize to influence an individual’s health status.
Application of chronic disease–based DRIs in precision medicine
Precision medicine focused on prevention involves interventions targeted to the needs of an individual on the basis of his or her genetic, biomarker, phenotypic, or psychosocial characteristics (105). Although clinicians do not apply precision medicine widely, genetic testing for polymorphisms associated with the risk of a disease (e.g., cancer) is increasingly available, and some specific therapies for treating these diseases exist. Examples of the application of precision medicine to the risk of a chronic disease associated with a food substance already exist. For example, genetic polymorphisms associated with varied responsiveness to statins for the treatment of CVD are available and now influence the choice of diet therapy to combine with drug therapy (106). Such approaches are not new to nutrition (e.g., dietary recommendations are available for highly penetrant and severe monogenic traits, phenylketonuria, and thalassemia, as well as more complex conditions, such as type 2 diabetes). New technologies that enable increasingly precise targeting of diet-based recommendations are likely to influence future DRI values and frameworks and help solve current challenges related to the use of chronic disease endpoints.
IX. CONCLUSIONS
The development of the DRIs has been critical for the successful (near) elimination of diseases of deficiency in Canada and the United States. If the DRI framework could be expanded to more effectively include chronic disease outcomes, the potential impact on public health would be even greater. This report identified the evidence-related and intake-response-relation challenges that have hampered the inclusion of chronic disease endpoints in the derivation of DRIs with the use of a traditional framework and approach. The report presents several potential options to address those challenges. The next step will be to make decisions about the feasibility of including chronic disease endpoints in future DRI reviews and to determine which options and/or their adaptations warrant inclusion in guiding principles for basing DRI values on chronic disease endpoints.
Traditional DRIs have always been based on adequacy for the apparently healthy population. However, when DRI values are based on chronic disease endpoints, the target population or populations might be narrower (e.g., individuals with high blood pressure or obesity). Although beyond the scope of this report, further consideration of how to define target populations when DRIs are based on reduction in chronic disease risk may be needed.
The report also highlights several research opportunities that are key to the derivation of future DRIs based on chronic disease endpoints (Table 10). Among the most salient examples of those opportunities are the need for qualified biomarkers of long-term intakes for a large array of nutritional variables (i.e., nutrients and other food substances), tools specifically designed to assess the quality of evidence required for setting DRIs, and novel statistical and other analytic methods for integrating diverse relations linking specific food components to multiple outcomes of interest.
We thank Joyce Merkel for help with the bibliography and editing and Debbie Berlyne for her expertise and patience in technical editing. We acknowledge the support and encouragement of the Joint Canada/US DRI Working Group.
The authors’ responsibilities were as follows—EAY, AJM, and LSG-F: designed and provided oversight of the project and drafting of the report; CG: served as chair of the working group and helped with planning the project, drafting the manuscript, and editing the report; JDA, SAA, DMB, ALC, WRH, DH, JCK, DK, DLO, RLP, JVR, and GAW: served as members of the working group; and all authors: contributed to and were responsible for the final content of the manuscript. Working group duties included participation in conference calls and the public workshop, provision of expert input throughout the process, and conceptualizing, planning, and writing of the report. None of the authors declared a conflict of interest.
REFERENCES
- Food and Nutrition Board, Institute of Medicine. Dietary Reference Intakes: the essential guide to nutrient requirements. Washington (DC): National Academies Press; 2006 [cited 2016 May 4]. Available from: https://fnic.nal.usda.gov/sites/fnic.nal.usda.gov/files/uploads/DRIEssentialGuideNutReq.pdf.
- Taylor CL. Framework for DRI development components “known” and components “to be explored” background paper. Food and Nutrition Board, Institute of Medicine; 2008 [cited 2016 May 4]. Available from: https://fnic.nal.usda.gov/sites/fnic.nal.usda.gov/files/uploads/Framework_DRI_Development.pdf.
- Murphy SP, Yates AA, Atkinson SA, Barr SI, Dwyer J. History of nutrition: the long road leading to the Dietary Reference Intakes for the United States and Canada. Adv Nutr 2016;7:157–68.
- Goodman RA, Posner SF, Huang ES, Parekh AK, Koh HK. Defining and measuring chronic conditions: imperatives for research, policy, program, and practice. Prev Chronic Dis 2013;10:E66.
- WHO. Noncommunicable diseases. Media centre fact sheet. 2015 [cited 2016 Nov 1]. Available from: http://www.who.int/mediacentre/factsheets/fs355/en/.
- Institute of Medicine Committee on Qualification of Biomarkers and Surrogate Endpoints in Chronic Disease; Board on Health Care Services; Board on Health Sciences Policy; Food and Nutrition Board. In: Micheel CM, Ball JR, editors. Evaluation of biomarkers and surrogate endpoints in chronic disease. Washington (DC): National Academies Press; 2010 [cited 2016 May 4]. Available from: https://iom.nationalacademies.org/Reports/2010/Evaluation-of-Biomarkers-and-Surrogate-Endpoints-in-Chronic-Disease.aspx.
- Institute of Medicine, Food Nutrition Board. How should the Recommended Dietary Allowances be revised? Washington (DC): National Academies Press; 1994 [cited 2016 May 4]. Available from: https://fnic.nal.usda.gov/sites/fnic.nal.usda.gov/files/uploads/How_Should_RDAs_Be_Revised.pdf.
- Institute of Medicine Subcommittee on Interpretation and Uses of Dietary Reference Intakes; Standing Committee on the Scientific Evaluation of Dietary Reference Intakes. Dietary Reference Intakes: applications in dietary planning. Washington (DC): National Academies Press; 2003 [cited 2016 May 4]. Available from: https://fnic.nal.usda.gov/dietary-guidance/dri-nutrient-reports/applications-dietary-planning#overlay-context=dietary-guidance/dietary-reference-intakes/dri-reports.
- Carriquiry AL. Assessing the prevalence of nutrient inadequacy. Public Health Nutr 1999;2:23–33.
- Institute of Medicine. Dietary Reference Intakes: applications in dietary assessment. Washington (DC): National Academies Press; 2000 [cited 2016 May 4]. Available from: http://fnic.nal.usda.gov/dietary-guidance/dri-reports/applications-dietary-assessment.
- Institute of Medicine, Food Nutrition Board. Dietary Reference Intakes: a risk assessment model for establishing upper intake levels for nutrients. Washington (DC): National Academies Press; 1998 [cited 2016 May 4]. Available from: https://fnic.nal.usda.gov/sites/fnic.nal.usda.gov/files/uploads/DRI_Risk_Assessment_Model.pdf.
- National Research Council Committee on Diet Health. Diet and health: implications for reducing chronic disease risk. Washington (DC): National Academies Press; 1989.
- Sheffer M, Taylor CL; Rapporteurs; Planning Committee for Dietary Reference Intakes Review Workshop, Food and Nutrition Board Institute of Medicine. The development of DRIs 1994-2004: lessons learned and new challenges: workshop summary. Washington (DC): National Academies Press; 2008 [cited 2016 May 4]. Available from: https://fnic.nal.usda.gov/sites/fnic.nal.usda.gov/files/uploads/Development_DRIs_1994-2004_Lessons_Learned.pdf.
- Institute of Medicine Committee to Review Dietary Reference Intakes for Vitamin D and Calcium. In: Ross AC, Taylor CL, Yaktine AL, Del Valle HB, editors. Dietary Reference Intakes for calcium and vitamin D. Washington (DC): National Academies Press; 2011 [cited 2016 May 4]. Available from: https://fnic.nal.usda.gov/dietary-guidance/dri-nutrient-reports/vitamin-d-and-calcium.
- Cheney M. Selection of endpoints for determining EARs/AIs and ULs. IOM/FNB Workshop on Dietary Reference Intakes: the development of DRIs 1994-2004; lessons learned and new challenges. Washington (DC): National Academies Press; 2007 [cited 2016 May 4]. Available from: https://fnic.nal.usda.gov/sites/fnic.nal.usda.gov/files/uploads/Development_DRIs_1994-2004_Lessons_Learned.pdf.
- US Food and Drug Administration. Label claims for conventional foods and dietary supplements. 2013 [cited 2016 Mar 1]. Available from: http://www.fda.gov/Food/IngredientsPackagingLabeling/LabelingNutrition/ucm111447.htm.
- US Dietary Reference Intakes Subcommittee; Canadian Federal Dietary Reference Intakes Steering Committee. Options for consideration of chronic disease endpoints for Dietary Reference Intakes (DRIs). 2016 [cited 2016 Apr 29]. Available from: https://ods.od.nih.gov/News/DRI_Workshop_March_10-11_2015.aspx.
- Mayne ST, Ferrucci LM, Cartmel B. Lessons learned from randomized clinical trials of micronutrient supplementation for cancer prevention. Annu Rev Nutr 2012;32:369–90.
- Scottish Intercollegiate Guidelines Network (SIGN) 50 methodology. Critical appraisal: notes and checklists. Checklist 2: randomised controlled trials, methodology. Checklist 3: cohort studies, methodology. Checklist 4: case-control studies. 2014 [cited 2015 Jul 21]. Available from: http://www.sign.ac.uk/methodology/checklists.html.
- GRADE) Working Group. Grading of recommendations assessment, development and evaluation (GRADE) [cited 2015 Jul 22]. Available from: http://www.gradeworkinggroup.org/.
- Chung M, Balk EM, Ip S, Raman G, Yu WW, Trikalinos TA, Lichtenstein AH, Yetley EA, Lau J. Reporting of systematic reviews of micronutrients and health: a critical appraisal. Am J Clin Nutr 2009;89:1099–113.
- Institute of Medicine Food and Nutrition Board. IOM/FNB planning meeting. Framework Dietary Reference Intake development—chronic disease indicators. Washington (DC): Institute of Medicine Food and Nutrition Board; 2009 [cited 2016 May 4]. Available from: https://fnic.nal.usda.gov/sites/fnic.nal.usda.gov/files/uploads/Framework_DRI_Development_Chronic_Disease_Indicators.pdf.
- Institute of Medicine Panel on Dietary Reference Intakes for Electrolytes and Water; Standing Committee on the Scientific Evaluation of Dietary Reference Intakes; Food and Nutrition Board. Dietary Reference Intakes for water, potassium, sodium, chloride and sulfate. Washington (DC): National Academies Press; 2004 [cited 2016 May 4]. Available from: https://fnic.nal.usda.gov/dietary-guidance/dri-nutrient-reports/water-potassium-sodium-chloride-and-sulfate#overlay-context=dietary-guidance/dri-reports/vitamin-c-vitamin-e-selenium-and-carotenoids.
- Institute of Medicine Standing Committee on the Scientific Evaluation of Dietary Reference Intakes. Dietary Reference Intakes for energy, carbohydrate, fiber, fat, fatty acids, cholesterol, protein, and amino acids. Washington (DC): National Academies Press; 2005 [cited 2016 May 4]. Available from: https://fnic.nal.usda.gov/dietary-guidance/dri-nutrient-reports/energy-carbohydrate-fiber-fat-fatty-acids-cholesterol-protein#overlay-context=dietary-guidance/dietary-reference-intakes/dri-reports.
- Centers for Disease Prevention and Control. Chronic disease overview. 2015 [cited 2016 Nov 1]. Available from: http://www.cdc.gov/chronicdisease/overview.
- Statistics Canada. The 10 leading causes of death, 2011. 2015 [cited 2016 Mar 1]. Available from: http://www.statcan.gc.ca/pub/82-625-x/2014001/article/11896-eng.htm.
- UN General Assembly. Sixty-sixth session agenda item 117, resolution adopted by the general assembly [without reference to a main committee (a/66/l.1)] 66/2. Political declaration of the high-level meeting of the general assembly on the prevention and control of noncommunicable diseases. 2012. [cited 2016 Nov 1]. Available from: http://www.who.int/nmh/events/un_ncd_summit2011/political_declaration_en.pdf.
- Maki KC, Slavin JL, Rains TM, Kris-Etherton PM. Limitations of observational evidence: implications for evidence-based dietary recommendations. Adv Nutr 2014;5:7–15.
- Institute of Medicine Standing Committee on the Scientific Evaluation of Dietary Reference Intakes. Dietary Reference Intakes for calcium, phosphorus, magnesium, vitamin D, and fluoride. Washington (DC): National Academies Press; 1997, [cited 2016 May 4]. Available from: https://fnic.nal.usda.gov/dietary-guidance/dri-nutrient-reports/calciumphosphorus-magnesium-vitamin-d-and-fluoride#overlay-context=dietaryguidance/dietary-reference-intakes/dri-reports.
- Mozaffarian D, Rimm EB. Fish intake, contaminants, and human health: Evaluating the risks and the benefits. JAMA 2006;296: 1885–99.
- National Research Council Subcommittee on the Tenth Edition of the Recommended Dietary Allowances. Recommended Dietary Allowances. 10th ed. Washington (DC): National Academies Press; 1989.
- Flock MR, Harris WS, Kris-Etherton PM. Long-chain omega-3 fatty acids: time to establish a Dietary Reference Intake. Nutr Rev 2013;71: 692–707.
- Lupton JR, Atkinson SA, Chang N, Fraga CG, Levy J, Messina M, Richardson DP, van Ommen B, Yang Y, Griffiths JC, et al. Exploring the benefits and challenges of establishing a DRI-like process for bioactives. Eur J Nutr 2014;53(Suppl 1):1–9.
- Ellwood K, Balentine DA, Dwyer JT, Erdman JW Jr., Gaine PC, KwikUribe CL. Considerations on an approach for establishing a framework for bioactive food components. Adv Nutr 2014;5:693–701.
- Manson JE, Kaunitz AM. Menopause management—getting clinical care back on track. N Engl J Med 2016;374:803–6.
- Institute of Medicine (US) Standing Committee on the Scientific Evaluation of Dietary Reference Intakes and its Panel on Folate, Other B Vitamins, and Choline. Dietary Reference Intakes for thiamin, riboflavin, niacin, vitamin B6, folate, vitamin B12, pantothenic acid, biotin, and choline [Internet]. Washington (DC): National Academies Press (US); 1998 [cited 2016 Nov 3]. Available from: https://www.ncbi.nlm.nih.gov/books/NBK114310/.
- Institute of Medicine Panel on Dietary Antioxidants Related Compounds. Dietary Reference Intakes for vitamin C, vitamin E, selenium, and carotenoids. Washington (DC): National Academies Press; 2000 [cited 2016 May 4]. Available from: https://fnic.nal.usda.gov/dietary-guidance/dri-nutrient-reports/vitamin-c-vitamin-e-selenium-and-carotenoids#overlay-context=dietary-guidance/dri-reports/vitaminvitamin-k-arsenic-boron-chromium-copper-iodine-iron-manganese.
- Institute of Medicine Panel on Micronutrients. Dietary Reference Intakes for vitamin A, vitamin K, arsenic, boron, chromium, copper, iodine, iron, manganese, molybdenum, nickel, silicon, vanadium, and zinc. Washington (DC): National Academies Press; 2001 [cited 2016 May 4]. Available from: https://fnic.nal.usda.gov/dietary-guidance/dri-nutrient-reports/vitamin-vitamin-k-arsenic-boron-chromium-copper-iodine-iron#overlay-context=dietary-guidance/dri-reports/thiaminriboflavin-niacin-vitamin-b6-folate-vitamin-b12-pantothenic.
- Porta M, Greenland S, Hernán M, dos Santos Silva I, Last M. A dictionary of epidemiology. 6th ed. New York: Oxford University Press; 2014.
- Wells GA. Approaches for evaluating evidence–that is not derived from randomized controlled trials (videocast). Workshop on Options for Consideration of Chronic Disease Endpoints for Dietary Reference Intakes (DRIs), March 10–11, 2015 [cited 2016 Nov 1]. Available from: http://videocast.nih.gov/summary.asp?Live=15713&bhcp=1.
- Higgins JP, Altman DG, Gotzsche PC, Juni P, Moher D, Oxman AD, Savovic J, Schulz KF, Weeks L, Sterne JA. The Cochrane Collaboration’s tool for assessing risk of bias in randomised trials. BMJ 2011; 343:d5928.
- Sterne JAC, Hernán MA, Reeves BC, Savović J, Berkman ND, Viswanathan M, Henry D, Altman DG, Ansari MT, Boutron I, et al. ROBINS-I: a tool for assessing risk of bias in non-randomized studies of interventions. BMJ 2016;355:i4919.
- Viswanathan M, Ansari MT, Berkman ND, Chang S, Hartling L, McPheeters LM, Santaguida PL, Shamliyan T, Singh K, Tsertsvadze A, et al. Assessing the risk of bias of individual studies in systematic reviews of health care interventions [Internet]. Agency for Healthcare Research and Quality Methods Guide for Comparative Effectiveness Reviews. Mar 2012. AHRQ Publication No. 12-EHC047-EF. [cited 2016 Nov 3]. Available from: http://effectivehealthcare.ahrq.gov/index.cfm/search-for-guides-reviews-and-reports/?productid=998&pageaction=displayproduct.
- Freedman LS, Commins JM, Moler JE, Willett W, Tinker LF, Subar AF, Spiegelman D, Rhodes D, Potischman N, Neuhouser ML, et al. Pooled results from 5 validation studies of dietary self-report instruments using recovery biomarkers for potassium and sodium intake. Am J Epidemiol 2015;181:473–87.
- Zheng C, Beresford SA, Van Horn L, Tinker LF, Thomson CA, Neuhouser ML, Di C, Manson JE, Mossavar-Rahmani Y, Seguin R, et al. Simultaneous association of total energy consumption and activity-related energy expenditure with risks of cardiovascular disease, cancer, and diabetes among postmenopausal women. Am J Epidemiol 2014;180:526–35.
- Prentice RL. Surrogate endpoints in clinical trials: definition and operational criteria. Stat Med 1989;8:431–40.
- Peters SA, den Ruijter HM, Bots ML, Moons KG. Improvements in risk stratification for the occurrence of cardiovascular disease by imaging subclinical atherosclerosis: a systematic review. Heart 2012;98:177–84.
- Afzal S, Brondum-Jacobsen P, Bojesen SE, Nordestgaard BG. Genetically low vitamin D concentrations and increased mortality: Mendelian randomisation analysis in three large cohorts. BMJ 2014;349:g6330.
- Vimaleswaran KS, Cavadino A, Berry DJ, Jorde R, Dieffenbach AK, Lu C, Alves AC, Heerspink HJ, Tikkanen E, Eriksson J, et al. Association of vitamin D status with arterial blood pressure and hypertension risk: a Mendelian randomisation study. Lancet Diabetes Endocrinol 2014;2:719–29.
- Brøndum-Jacobsen P, Benn M, Afzal S, Nordestgaard BG. No evidence that genetically reduced 25-hydroxyvitamin D is associated with increased risk of ischaemic heart disease or myocardial infarction: a Mendelian randomization study. Int J Epidemiol 2015; 44:651–61.
- Mokry LE, Ross S, Ahmad OS, Forgetta V, Smith GD, Leong A, Greenwood CM, Thanassoulis G, Richards JB. Vitamin D and risk of multiple sclerosis: a Mendelian randomization study. PLoS Med 2015;12: e1001866. Erratum in: PLoS Med 2016;13(3):e1001981.
- Haycock PC, Burgess S, Wade KH, Bowden J, Relton C, Davey Smith G. Best (but oft-forgotten) practices: the design, analysis, and interpretation of Mendelian randomization studies. Am J Clin Nutr 2016;103:965–78.
- Omenn GS, Goodman G, Thornquist M, Grizzle J, Rosenstock L, Barnhart S, Balmes J, Cherniack MG, Cullen MR, Glass A, et al. The beta-Carotene And Retinol Efficacy Trial (CARET) for chemo-prevention of lung cancer in high risk populations: smokers and asbestos-exposed workers. Cancer Res 1994;54:2038s–43s.
- Alpha Tocopherol Beta Carotene Cancer Prevention Study Group. The effect of vitamin E and beta carotene on the incidence of lung cancer and other cancers in male smokers. N Engl J Med 1994;330: 1029–35.
- Hennekens CH, Buring JE, Manson JE, Stampfer M, Rosner B, Cook NR, Belanger C, LaMotte F, Gaziano JM, Ridker PM, et al. Lack of effect of long-term supplementation with beta carotene on the incidence of malignant neoplasms and cardiovascular disease. N Engl J Med 1996;334:1145–9.
- Clarke R, Halsey J, Bennett D, Lewington S. Homocysteine and vascular disease: review of published results of the homocysteine-lowering trials. J Inherit Metab Dis 2011;34:83–91.
- Lippman SM, Klein EA, Goodman PJ, Lucia MS, Thompson IM, Ford LG, Parnes HL, Minasian LM, Gaziano JM, Hartline JA, et al. Effect of selenium and vitamin E on risk of prostate cancer and other cancers: the Selenium and Vitamin E Cancer Prevention Trial (SELECT). JAMA 2009;301:39–51.
- Bleys J, Miller ER III, Pastor-Barriuso R, Appel LJ, Guallar E. Vitamin-mineral supplementation and the progression of atherosclerosis: a meta-analysis of randomized controlled trials. Am J Clin Nutr 2006;84:880–7; quiz: 954–5.
- Sacks FM, Svetkey LP, Vollmer WM, Appel LJ, Bray GA, Harsha D, Obarzanek E, Conlin PR, Miller ER III, Simons-Morton DG, et al; DASH-Sodium Collaborative Research Group. Effects on blood pressure of reduced dietary sodium and the Dietary Approaches to Stop Hypertension (DASH) diet. N Engl J Med 2001;344:3–10.
- Orchard TJ, Temprosa M, Goldberg R, Haffner S, Ratner R, Marcovina S, Fowler S. The effect of metformin and intensive lifestyle intervention on the metabolic syndrome: the Diabetes Prevention Program randomized trial. Ann Intern Med 2005;142:611–9.
- Beresford SA, Johnson KC, Ritenbaugh C, Lasser NL, Snetselaar LG, Black HR, Anderson GL, Assaf AR, Bassford T, Bowen D, et al. Low-fat dietary pattern and risk of colorectal cancer: the Women’s Health Initiative randomized controlled dietary modification trial. JAMA 2006;295:643–54.
- Prentice RL, Caan B, Chlebowski RT, Patterson R, Kuller LH, Ockene JK, Margolis KL, Limacher MC, Manson JE, Parker LM, et al. Low-fat dietary pattern and risk of invasive breast cancer: the Women’s Health Initiative randomized controlled dietary modification trial. JAMA 2006; 295:629–42.
- Klein EA, Thompson IM Jr., Tangen CM, Crowley JJ, Lucia MS, Goodman PJ, Minasian LM, Ford LG, Parnes HL, Gaziano JM, et al. Vitamin E and the risk of prostate cancer: the Selenium and Vitamin E Cancer Prevention Trial (SELECT). JAMA 2011;306:1549–56.
- Schatzkin A, Gail M. The promise and peril of surrogate end points in cancer research. Nat Rev Cancer 2002;2:19–27.
- Prentice RL. Surrogate and mediating endpoints: current status and future directions. J Natl Cancer Inst 2009;101:216–7.
- Prentice RL, Mossavar-Rahmani Y, Huang Y, Van Horn L, Beresford SA, Caan B, Tinker L, Schoeller D, Bingham S, Eaton CB, et al. Evaluation and comparison of food records, recalls, and frequencies for energy and protein assessment by using recovery biomarkers. Am J Epidemiol 2011;174:591–603.
- Freedman LS, Commins JM, Moler JE, Arab L, Baer DJ, Kipnis V, Midthune D, Moshfegh AJ, Neuhouser ML, Prentice RL, et al. Pooled results from 5 validation studies of dietary self-report instruments using recovery biomarkers for energy and protein intake. Am J Epidemiol 2014;180:172–88.
- Rubin DB. For objective causal inference design trumps analysis. Ann Appl Stat 2008;2:808–40.
- Chung M, Balk EM, Brendel M, Ip S, Lau J, Lee J, Lichtenstein A, Patel K, Raman G, Tatsioni A, et al. Vitamin D and calcium: a systematic review of health outcomes. Evid Rep Technol Assess (Full Rep) 2009;183:1–420.
- Satija A, Hu FB. Big data and systematic reviews in nutritional epidemiology. Nutr Rev 2014;72:737–40.
- Egger M, Ebrahim S, Smith GD. Where now for meta-analysis? Int J Epidemiol 2002;31:1–5.
- Lichtenstein AH, Yetley EA, Lau J. Application of systematic review methodology to the field of nutrition. J Nutr 2008;138:2297–306.
- Tovey D. The role of the Cochrane Collaboration in support of the WHO nutrition guidelines. Adv Nutr 2014;5:35–9.
- Van’t Veer P, Grammatikaki E, Matthys C, Raats MM, Contor L. EURRECA—framework for aligning micronutrient recommendations. Crit Rev Food Sci Nutr 2013;53:988–98.
- Theodoratou E, Tzoulaki I, Zgaga L, Ioannidis JP. Vitamin D and multiple health outcomes: umbrella review of systematic reviews and meta-analyses of observational studies and randomised trials. BMJ 2014;348:g2035.
- Newberry SJ, Chung M, Booth M, Maglione MA, Tang AM, O’Hanlon CE, Wang DD, Okunogbe A, Huang C, Motala A, et al. Omega-3 fatty acids and maternal and child health: an updated systematic review [Internet]. Evidence Report/Technology Assessment No. 224. (Prepared by the RAND Southern California Evidence-based Practice Center under Contract No. 290-2012-00006-I.) AHRQ Publication No. 16(17)-E003-EF. Rockville (MD): Agency for Healthcare Research and Quality; October 2016 [cited 2016 Nov 3]. Available from: https://www.effectivehealthcare.ahrq.gov/search-for-guides-reviews-and-reports/?pageaction=displayproduct-&productid=2320.
- Balk EM, Adam GP, Langberg V, Halladay C, Chung M, Lin L, Robertson S, Yip A, Steele D, Smith BT, et al. Omega-3 fatty acids and cardiovascular disease: an updated systematic review [Internet]. Evidence Report/Technology Assessment No. 223. (Prepared by the Brown Evidence-based Practice Center under Contract No. 290-2015-00002-I.) AHRQ Publication No. 16-E002-EF. Rockville (MD): Agency for Healthcare Research and Quality; August 2016 [cited 2016 Nov 3]. Available from: https://www.effectivehealthcare.ahrq.gov/search-for-guides-reviews-and-reports/?pageaction=displayproduct&productid=2261.
- Hill AB. The environment and disease: association or causation? Proc R Soc Med 1965;58:295–300.
- Bai A, Shukla VK, Bak G, Wells G. Quality assessment tools project report. Ottawa (Canada): Canadian Agency for Drugs and Technologies in Health; 2012.
- Newberry SJ, Chung M, Shekelle PG, Booth MS, Liu JL, Maher AR, Motala A, Cui M, Perry T, Shanman R, et al. Vitamin D and calcium: a systematic review of health outcomes (update). Rockville (MD): Agency for Healthcare Research and Quality; 2014. Evidence Reports/Technology Assessments No.: 217 [cited 2016 Nov 1]. Available from: http://www.ncbi.nlm.nih.gov/books/NBK253540/.
- Wells GA, Shea B, O’Connell D, Peterson J, Welch V, Losos M, Tugwell P. The Newcastle-Ottawa Scale (NOS) for assessing the quality of nonrandomised studies in meta-analyses. 2015 [cited 2015 Aug 10]. Available from: http://www.ohri.ca/programs/clinical_epidemiology/oxford.asp.
- Shea BJ, Grimshaw JM, Wells GA, Boers M, Andersson N, Hamel C, Porter AC, Tugwell P, Moher D, Bouter LM. Development of AMSTAR: a measurement tool to assess the methodological quality of systematic reviews. BMC Med Res Methodol 2007;7:10.
- Shea BJ, Hamel C, Wells GA, Bouter LM, Kristjansson E, Grimshaw J, Henry DA, Boers M. AMSTAR is a reliable and valid measurement tool to assess the methodological quality of systematic reviews. J Clin Epidemiol 2009;62:1013–20.
- Wells GA, Shea B, Higgins JP, Sterne J, Tugwell P, Reeves BC. Checklists of methodological issues for review authors to consider when including non-randomized studies in systematic reviews. Res Synth Methods 2013;4:63–77.
- Whiting P, Savovic J, Higgins JP, Caldwell DM, Reeves BC, Shea B, Davies P, Kleijnen J, Churchill R. ROBIS: a new tool to assess risk of bias in systematic reviews was developed. J Clin Epidemiol 2016;69: 225–34.
- Berkman ND, Lohr KN, Ansari MT, Balk EM, Kane R, McDonagh M, Morton SC, Viswanathan M, Bass EB, Butler M, et al. Grading the strength of a body of evidence when assessing health care interventions: an EPC update. J Clin Epidemiol 2015;68:1312–24.
- Wang MD, Gomes J, Cashman NR, Little J, Krewski D. A meta-analysis of observational studies of the association between chronic occupational exposure to lead and amyotrophic lateral sclerosis. J Occup Environ Med 2014;56:1235–42.
- International Agency for Research on Cancer. Preamble to the IARC monographs on the evacuation of carcinogenic risks to humans. Lyon (France): World Health Organization; 2006 [cited 2016 Nov 1]. Available from: http://monographs.iarc.fr/ENG/Monographs/vol87/mono87-4.pdf.
- Rhomberg LR, Goodman JE, Bailey LA, Prueitt RL, Beck NB, Bevan C, Honeycutt M, Kaminski NE, Paoli G, Pottenger LH, et al. A survey of frameworks for best practices in weight-of-evidence analyses. Crit Rev Toxicol 2013;43:753–84.
- National Research Council. Review of EPA’s integrated risk information system (IRIS) process. Washington (DC): National Academies Press; 2014.
- Sundström J, Arima H, Jackson R, Turnbull F, Rahimi K, Chalmers J, Woodward M, Neal B. Effects of blood pressure reduction in mild hypertension: a systematic review and meta-analysis. Ann Intern Med 2015;162:184–91.
- Satoh M, Ohkubo T, Asayama K, Murakami Y, Sakurai M, Nakagawa H, Iso H, Okayama A, Miura K, Imai Y, et al. Combined effect of blood pressure and total cholesterol levels on long-term risks of subtypes of cardiovascular death: evidence for cardiovascular prevention from observational cohorts in Japan. Hypertension 2015;65: 517–24.
- Schöttker B, Haug U, Schomburg L, Kohrle J, Perna L, Muller H, Holleczek B, Brenner H. Strong associations of 25-hydroxyvitamin D concentrations with all-cause, cardiovascular, cancer, and respiratory disease mortality in a large cohort study. Am J Clin Nutr 2013;97: 782–93.
- Ross AC, Russell RM, Miller SA, Munro IC, Rodricks JV, Yetley EA, Julien E. Application of a key events dose-response analysis to nutrients: a case study with vitamin A (retinol). Crit Rev Food Sci Nutr 2009;49:708–17.
- Green TJ, Allen OB, O’Connor DL. A three-day weighed food record and a semiquantitative food-frequency questionnaire are valid measures for assessing the folate and vitamin B-12 intakes of women aged 16 to 19 years. J Nutr 1998;128:1665–71.
- Jenab M, Slimani N, Bictash M, Ferrari P, Bingham SA. Biomarkers in nutritional epidemiology: applications, needs and new horizons. Hum Genet 2009;125:507–25.
- Wu GD, Compher C, Chen EZ, Smith SA, Shah RD, Bittinger K, Chehoud C, Albenberg LG, Nessel L, Gilroy E, et al. Comparative metabolomics in vegans and omnivores reveal constraints on diet-dependent gut microbiota metabolite production. Gut 2016; 65:63–72.
- Beaton G. Letter to Scott Grundy, member of the Institute of Medicine’s Standing Committee on the Scientific Evaluation of Dietary Reference Intakes. 1997 [cited 2016 May 3]. Available from: http://jn.nutrition.org/content/suppl/2015/05/13/jn.115.211185.DCSupplemental/nutrition211185SupplementaryData1.pdf.
- Schoeller DA. Recent advances from application of doubly labeled water to measurement of human energy expenditure. J Nutr 1999;129: 1765–8.
- Bingham SA. Urine nitrogen as a biomarker for the validation of dietary protein intake. J Nutr 2003;133(Suppl 3):921S–4S.
- Sarwar N, Sandhu MS, Ricketts SL, Butterworth AS, Di Angelantonio E, Boekholdt SM, Ouwehand W, Watkins H, Samani NJ, Saleheen D, et al. Triglyceride-mediated pathways and coronary disease: collaborative analysis of 101 studies. Lancet 2010;375:1634–9. Erratum in: Lancet 2010;376(9735):90.
- Haase CL, Tybjaerg-Hansen A, Nordestgaard BG, Frikke-Schmidt R. HDL cholesterol and risk of type 2 diabetes: a Mendelian randomization study. Diabetes 2015;64:3328–33.
- Milton B, Farrell P, Birkett NB, Krewski D. Modeling U-shaped exposure-response relationships for agents that demonstrate toxicity due to both excess and deficiency. Risk Anal 2016 Apr 4 (Epub ahead of print; DOI: 10.1111/risa.12603).
- Hammond RA, Dube L. A systems science perspective and trans-disciplinary models for food and nutrition security. Proc Natl Acad Sci USA 2012;109:12356–63.
- Jameson JL, Longo DL. Precision medicine–personalized, problematic, and promising. N Engl J Med 2015;372:2229–34.
- Yu CY, Theusch E, Lo K, Mangravite LM, Naidoo D, Kutilova M, Medina MW. Hnrnpa1 regulates Hmgcr alternative splicing and modulates cellular cholesterol metabolism. Hum Mol Genet 2014;23: 319–32.


