
3
The Many Causes of Grid Failure
INTRODUCTION
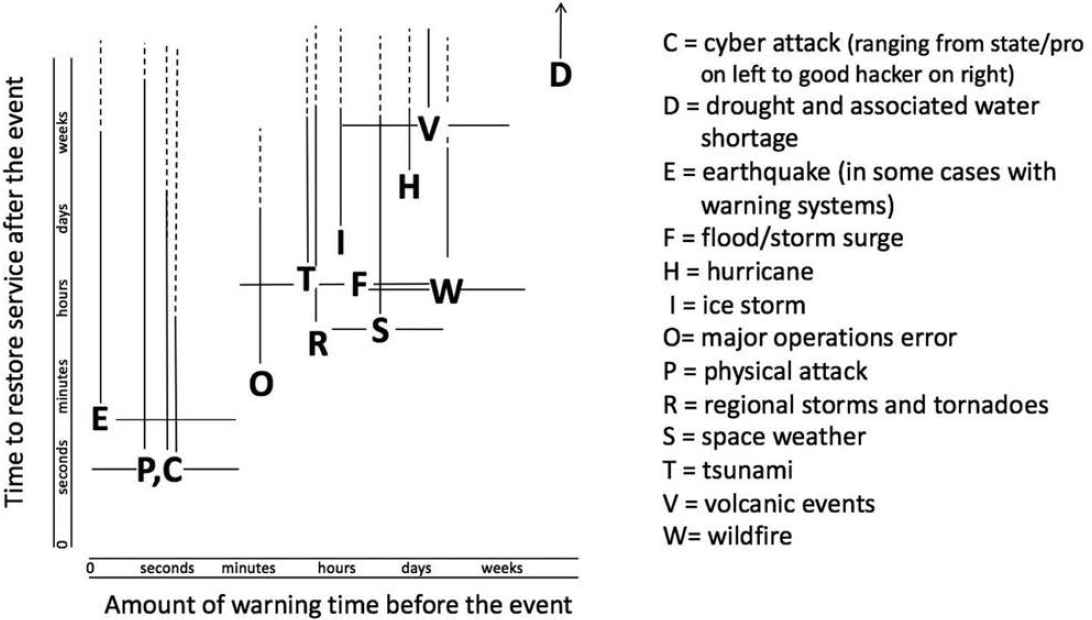
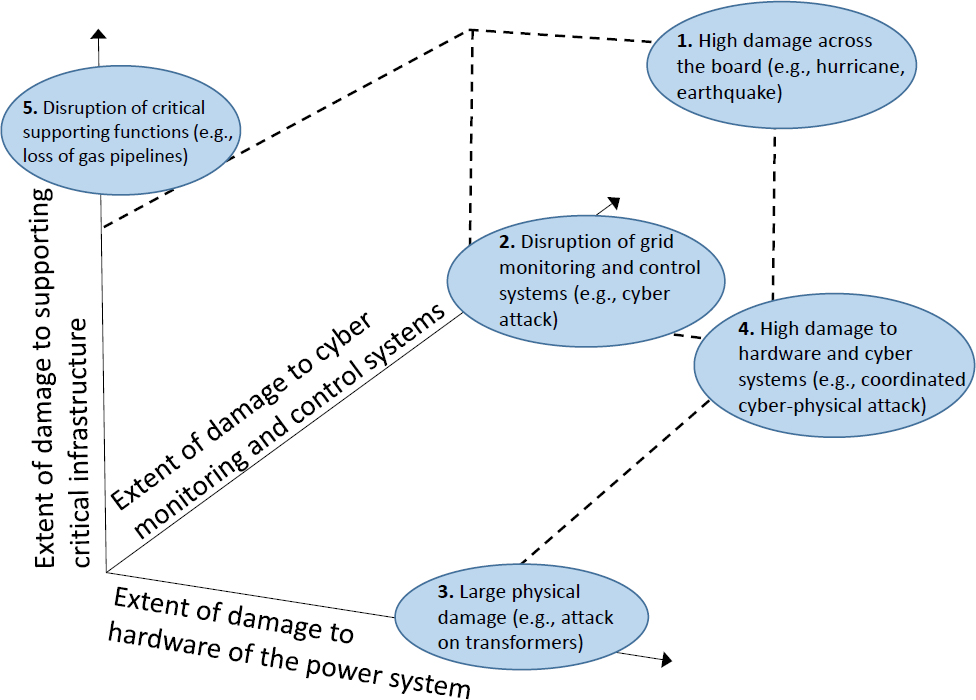
A wide variety of events can cause disruption of the power system. As noted in Chapter 1, given the numerous and diverse potential sources of disruption, it is impressive that relatively few large-area, long-duration outages have occurred. The causes of outages differ in a number of important ways. Two of the most important differences are as follows: (1) how much warning system operators have that a disruption is coming so they can take protective action, and (2) how much of the physical and cyber control systems that make up the power system remain operative once the disruption has passed. Figure 3.1 categorizes disruptions by the amount of advance warning that operators and others are likely to receive and the amount of time it takes to recover. Figure 3.2 categorizes the range of damages that may result after a disruption occurs.
DIFFERENT CAUSES REQUIRE DIFFERENT PREPARATION AND HAVE DIFFERENT CONSEQUENCES
Building a strategy to increase system resilience requires an understanding of a wide range of preparatory, preventative, and remedial actions and an awareness of how these actions impact planning, operation, and restoration over the entire life cycle of different kinds of grid failures. Strategies must be crafted with awareness and understanding of the temporal arc of a major outage, as well as how this differs from one type of event to another.
It is also important to differentiate between actions designed to make the grid more robust and resilient to failure (e.g., wind resistant steel or concrete poles rather than wood poles; opaque fences around substations to protect against damage from firearms) and those that improve the effectiveness of recovery (e.g., preemptive powering down of select pieces of the system to minimize damage). Some actions serve both strategies, some serve one but not the other, and some serve one while inhibiting the other. For example, good substation design with clear separation of functions makes the substation more resistant to damage and helps repair crews. Building a coffer dam around a transformer may make it more resistant to flooding, but by limiting access for heavy equipment it can also make it harder to complete repairs when it actually fails. Of course a coffer dam does nothing to guard against the effects of earthquake or cyber attack. Similarly, concrete poles may be more resistant to wind but offer no clear advantage or disadvantage in restoration.
The timing of repairs is different depending on the cause. For example, repairs can begin immediately after a tornado has passed, but flooding following a hurricane can delay the start of repairs for weeks and impede restoration efforts. Good planning and preparation are essential to mitigating, ameliorating, and recovering from major outages effectively. Systems—both human and technical—must be built prior to grid failure to allow the responders to assess the extent of failure and damage, dispatch resources effectively, and draw on established component inventories, supply chains, crews, and communications. The next section reviews the major causes of outages depicted in Figure 3.1, beginning with those for which operators have the least warning and ending with those for which they have the most. The chapter then makes a number of general findings and recommendations related to both human and natural threats to the power system.
REVIEWING THE CAUSES OF OUTAGES
Earthquake
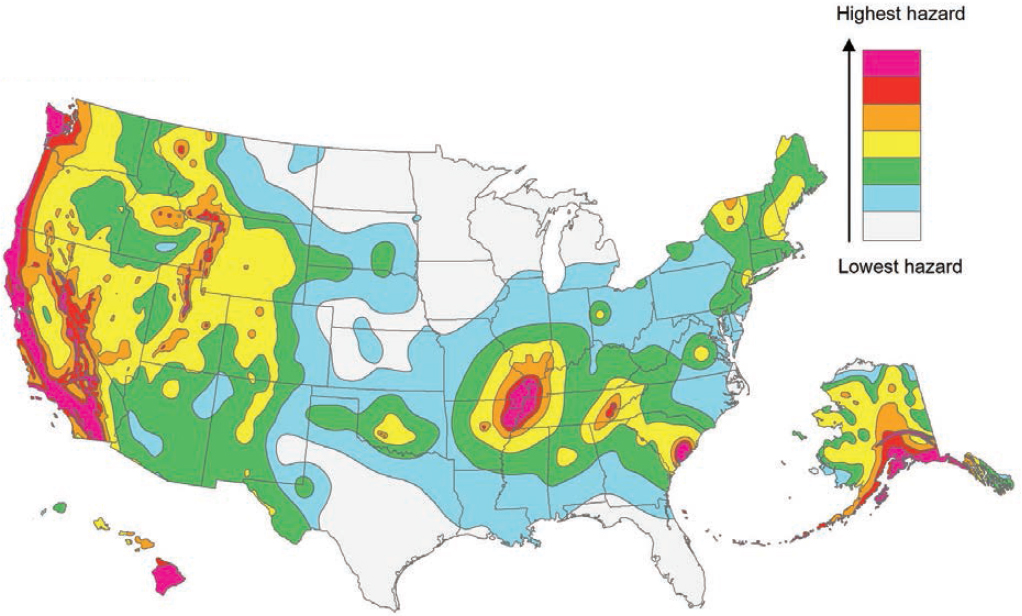
Moving through Figure 3.1 from left to right, the first point is labeled E for earthquake. Especially in the West, the central Mississippi valley, the coastal area of South Carolina, and southern Alaska and Hawaii (Figure 3.3), the potential for disruption of major power system equipment by earthquake is significant. Severe damage to distribution poles, transmission towers, and substations can result. Generators may be damaged or subjected to enough stress that they have to be taken off-line. For example, the North Anna Nuclear Power Station was taken off-line following a magnitude 5.8
earthquake in Virginia in 2011 and remained off-line for more than 10 weeks as the owner and operator conducted thorough damage assessments and the Nuclear Regulatory Commission granted approval for restart (Vastag, 2011; Peltier, 2012). In addition, there is substantial risk of the loss of fuel, particularly from natural gas systems, given the long supply chain and vulnerability of pipelines to earthquakes.
While earthquakes typically come without warning, the propagation velocity of earthquake waves is much slower than the speed of light, so that in some cases it is possible with appropriate instrumentation to obtain several seconds of advance warning (hence the horizontal line that runs to the right of point E in Figure 3.1). When possible, such warning could give time to de-energize critical components so as to minimize damage. Research is continuing on a wide range of grid-specific technologies. Organizations like the Pacific Earthquake Engineering Center are working on technologies such as more durable ceramic and non-ceramic insulators, flexible electrical connectors, and advanced materials for towers and attachments. Restoration following a major earthquake is a massive problem requiring a wide range of difficult engineering and construction projects in a compromised environment, with competition from other restoration priorities. For example, key bridges or roads required to access damaged facilities may be impassable. If an earthquake destroys key generating, substation, or transmission equipment, it may take weeks or months to restore service.
Physical Attack
A physical attack, denoted by point P, could occur without warning or with only limited warning. Physical attacks on major system components could cause serious physical damage, especially to large transformers and other hard to replace substation and transmission equipment such as high-voltage circuit breakers. The possibility of such attacks has been a concern for many years (OTA, 1990; NRC, 2012; DOE, 2015; Parfomak, 2014). Globally, transmission and distribution systems have been a focus of physical attacks, bombings, and terrorist activity—for example, in Afghanistan, Colombia, Iraq, Peru, and Thailand (NRC, 2012). In the United States, there have been relatively few well-planned attacks on the electricity system, though the 2013 sniper attack of the Metcalf transmission substation (Box 3.1) provides a reminder of the physical vulnerability of the system. Recovery could easily require many days or weeks. Generation facilities tend to have greater physical security and thus are less vulnerable to physical attack than substation and transmission facilities.
Cyber Attack
Like a physical attack, a cyber attack, denoted with a C, could also occur with limited or no warning. The best defense against cyber attacks is preventing intrusions to
critical systems and detecting and expunging malware before it becomes activated. However, if that is not possible, the consequences of a successful cyber attack may be almost instantaneous, they could take a few seconds to some minutes to be fully realized, or an attacker may lay dormant for months collecting information as happened in the 2015 cyber attack on the Ukrainian power system (Box 3.2). It is difficult to determine how many cyber attacks have been attempted against U.S. utilities, by what means, and with what consequences.
In the time between detection of an intrusion and manifestation of any consequences, it may be possible to take some steps to limit the potential disruptive impacts. In many cases a cyber attack may not give rise to major physical damage to the system, although in some circumstances physical damage can result, especially if the attackers are sophisticated. Depending on the nature of the attack, just how long it would take to restore is unclear. The unique issues associated with cyber risks and restoration are discussed in Chapters 4 and 6. There are also diverse types of cyber attacks and vulnerabilities within the electricity system. According to recent analysis done for the Quadrennial Energy Review (Argonne National Laboratory et al., 2016), the electricity system vulnerabilities include the following:
- Supervisory control and data acquisition systems that rely on modern communication infrastructure to collect data and send control signals in both the bulk power system (generation and transmission) and at the substation level;
- Large power plant distributed control systems that use local communications channels to perform local control on large power plants;
- Smart grid technologies, including software-based components with communication capabilities, used to increase the reliability, security, and efficiency of
SOURCE: Petersen et al. (2014).
- Distributed energy resources that are connected to open networks for communication and can include smart inverters with remote access;
- Supply chain that might have vulnerabilities of legacy software systems from commercial vendors; and
- Corporate communication networks that might have an entry point to electricity systems’ control networks.
the grid as well as communicate data between utilities and customers;
The modern power system also makes extensive use of the global positioning system (GPS), especially for time synchronization. Hence, disruption of GPS by space weather, or through cyber attack, could cause disruption in the bulk power system.
Operations Error
A number of historical blackouts have been caused by one or more faults, typically when the system is heavily loaded, that could have been managed if not for a sequence of subsequent operator errors. The network structure of the grid allows large-scale disruptions to result from distant, localized electrical faults, and system irregularities can propagate near instantaneously, generally through the work of protection relays acting unexpectedly to unusual system conditions. For example, the infamous 2003 Northeast blackout was triggered by a simple fault—a tree caused a transmission line short circuit—but within hours it became the largest blackout in U.S. history, owing to two computer/software errors that caused a lack of situational awareness from grid operators. A smaller but similar cascading failure
occurred in 2011 in the southwestern United States, when a problem at a single substation in Arizona grew into a major outage across Southern California in a few minutes.
There are a vast number of potential types of operations error—in both control rooms and in the field—that can lead to cascading blackouts, which makes planning difficult. Fortunately, because virtually all key components of the power system have protective devices that disconnect before damage can occur, cascading blackouts typically do not cause serious physical damage to system components beyond the initiating failure. Depending on system conditions and the nature of faults, operator error can unfold over periods of minutes to hours, and there may be opportunities to detect errors and take corrective action. With improved training and drilling, better instrumentation, improved situational awareness, and improved control methods, the risks of operator error leading to cascading failure have been, and can continue to be, reduced. At the same time, other external threats such as terrorist attacks and pandemics can place operators under stress and potentially increase the probability of errors. In Figure 3.1, operations errors are denoted by point O.
Tsunamis
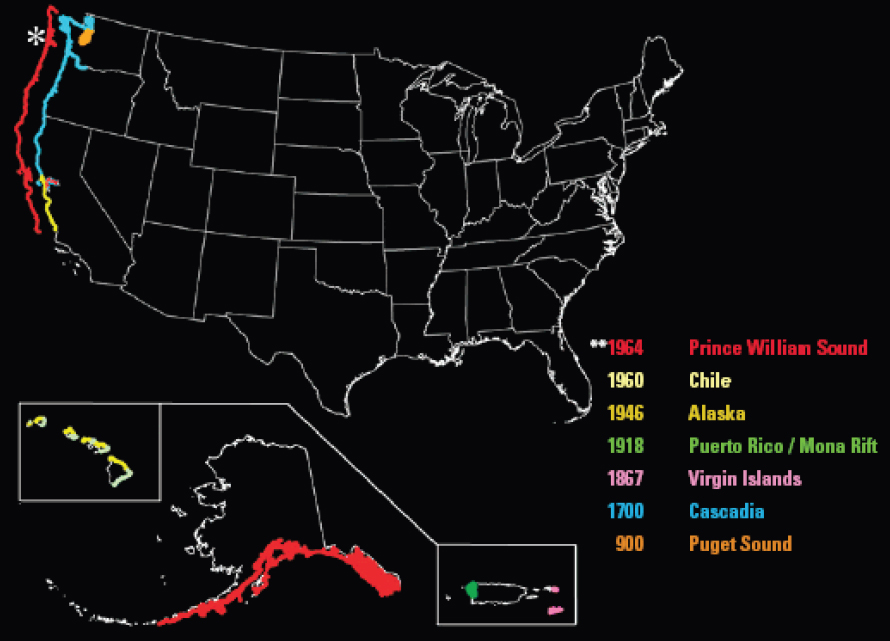
The domain of damage for tsunamis, denoted T in Figure 3.1, is limited to coastal regions. Figure 3.4 shows locations in the United States that have experienced major tsunami events over the past millennium, which are almost entirely on the Pacific coast. A large international warning system, involving 26 nations, monitors and provides warning across the Pacific basin. As part of that system, the United States hosts the Pacific Tsunami Warning Center near Honolulu, Hawaii, and also operates the Alaska Tsunami Warning Center in Palmer, Alaska. With advance warning, critical facilities can be shut down to reduce damage. Although the best way to reduce the risks to the power system is to place major facilities in locations that are not vulnerable to tsunamis, abandoning and moving existing installations is expensive, and there may be other protective steps that can be taken such as elevating backup generators. This is increasingly a factor in utility planning in Hawaii and along the West Coast.
Regional Weather
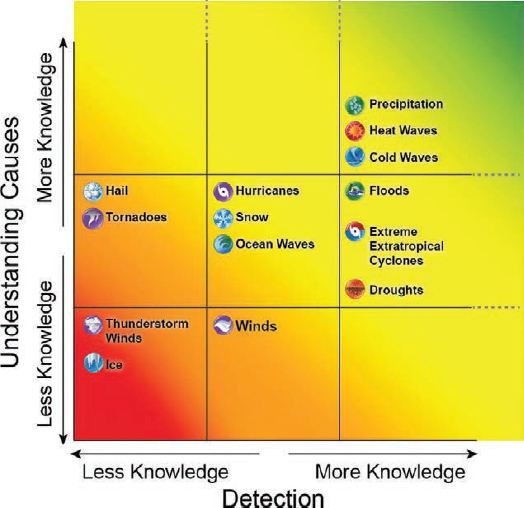
Weather events can be a major cause of disruption for the power system. Scientific knowledge about both the causes of severe weather events and the ability to detect changes in the risks varies considerably. Some changing risks, such as the likelihood of more frequent and extreme precipitation events and more frequent heat waves, are reasonably well understood in both regards. Others, like the frequency and
SOURCE: USGS (2016a).
intensity of ice storms (which can devastate power systems), are not understood in either regard. Figure 3.5 displays this considerable variation in the level of scientific understanding of weather and how the frequency and intensity of different weather events may evolve as a consequence of natural variability, climate system oscillations (El Niño–Southern Oscillation, North Atlantic Oscillation, etc.), and secular climate changes (IPCC, 2013; NASEM, 2016).
In Figure 3.1, point R denotes regional weather events such as intense convective storms and tornadoes that are capable of widespread damage, especially to distribution systems. Generally, individual tornadoes impact only a small area, and the specific locations at which damages occur are often difficult to anticipate. However, increasing resolution in weather forecasts does provide system operators with some ability to prepare and be ready to respond quickly once damage has occurred—for example, by pre-positioning repair crews.
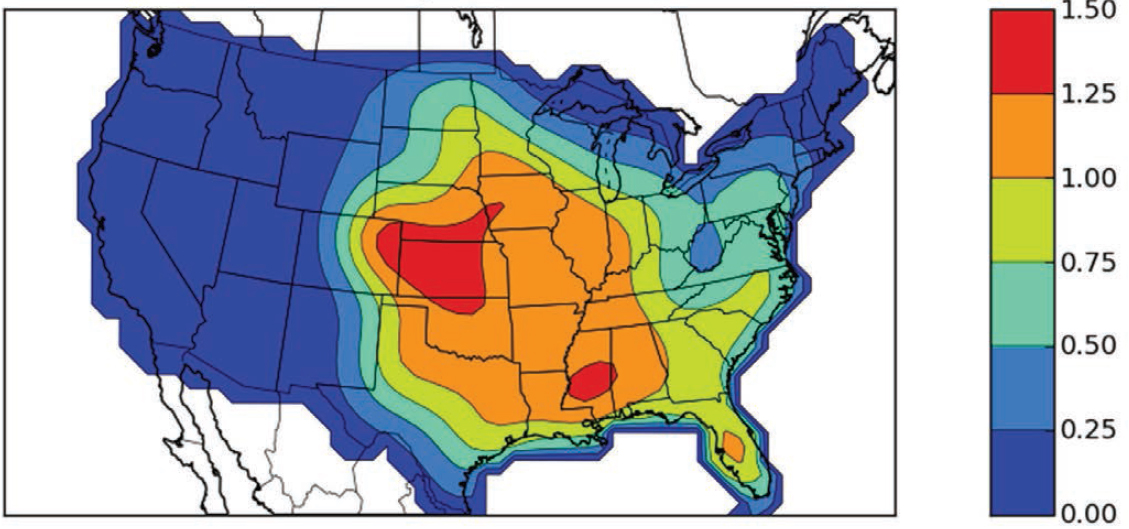
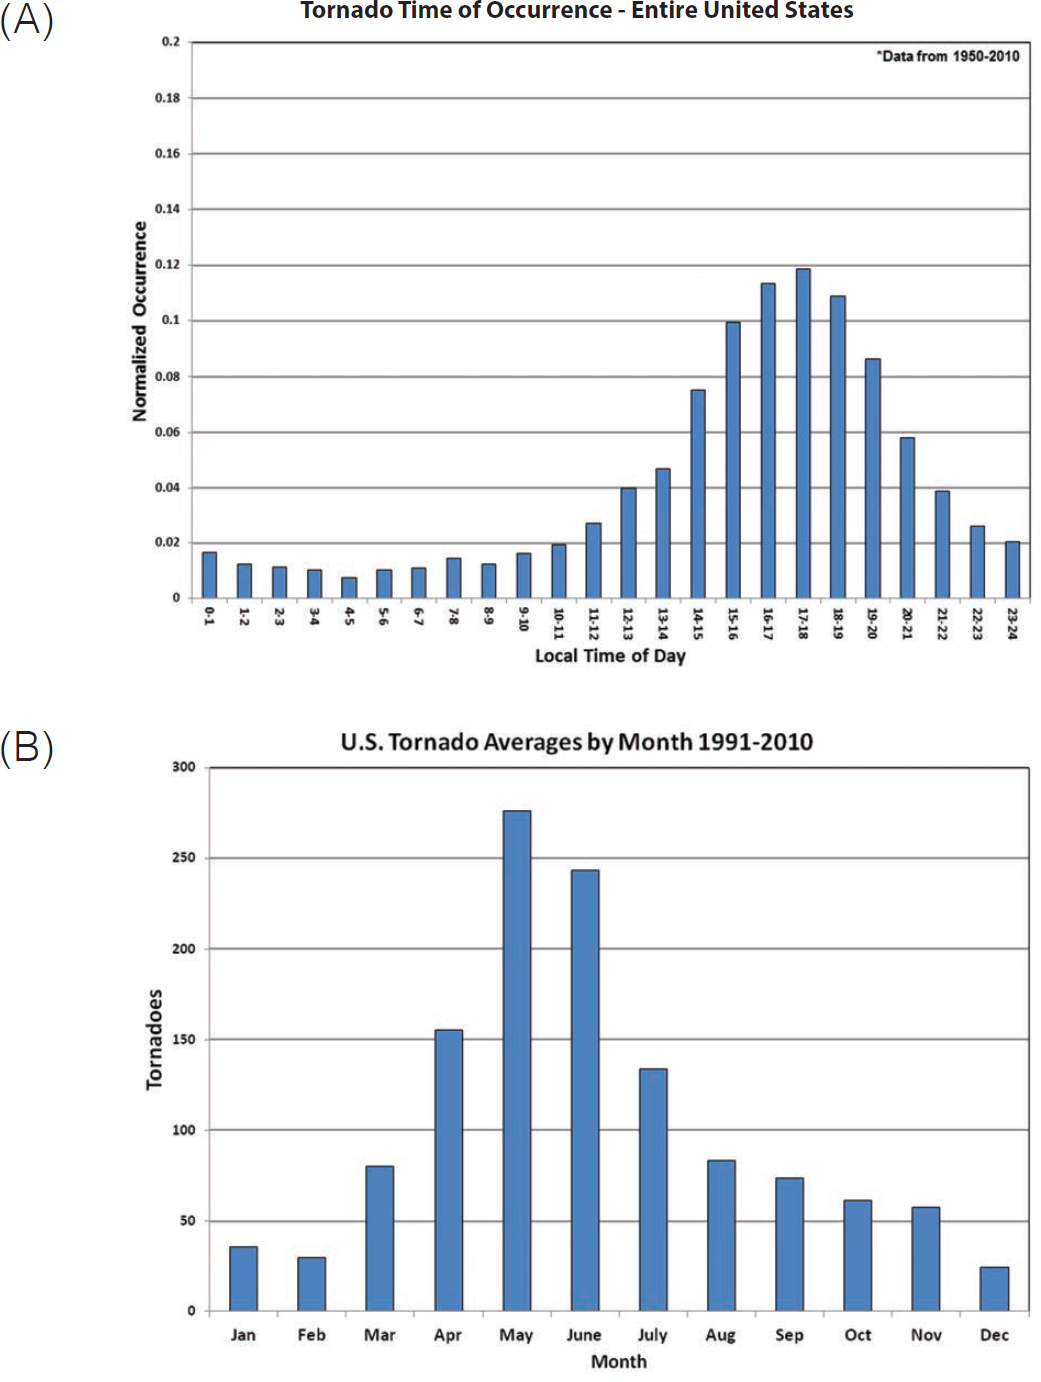
Tornadoes have occurred in all parts of the country, but they are rare west of the Rocky Mountains. Similarly, tornadoes do not occur at a uniform rate across the year and are most frequent in April, May, and June (Figure 3.6). Utilities and communities in high-frequency areas are aware of the risk and routinely prepare, building shelters for people and hardening the utility infrastructure.
SOURCE: Wuebbles et al. (2014). ©American Meteorological Society. Used with permission.
SOURCE: NOAA and NSSL (2009).
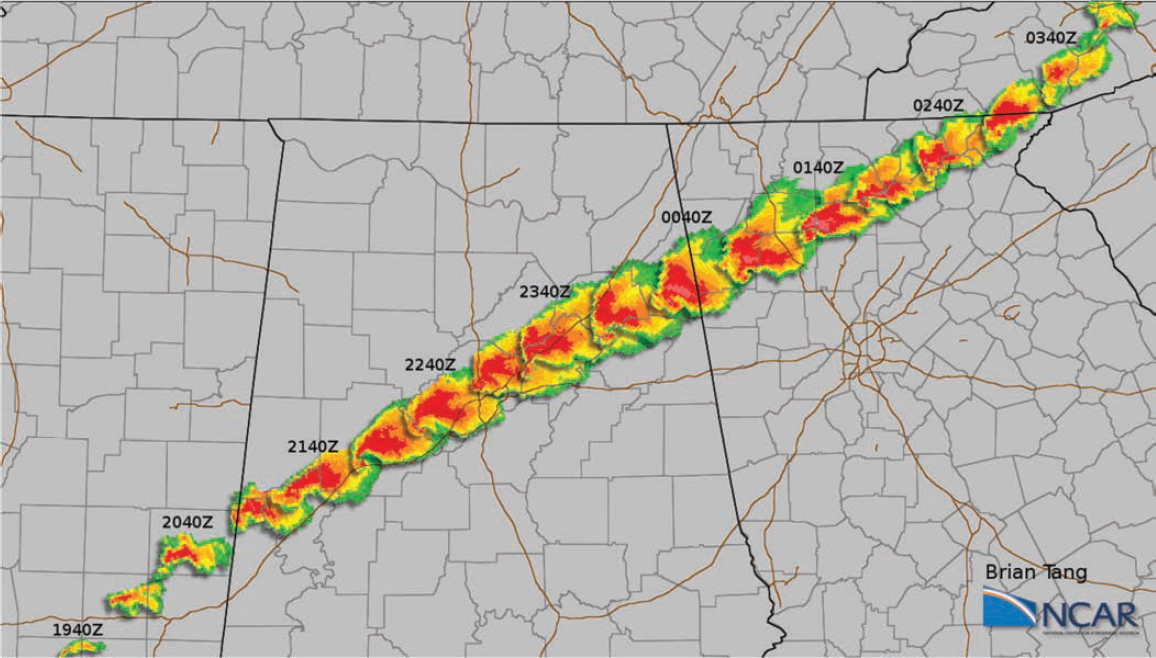
The frequency of tornadoes shows a strong temporal and seasonal variation (Figure 3.7). The annual frequency of tornadoes strong enough to cause damage to power lines shows no apparent time trend. On the other hand, Tippett et al. (2016) report that “the largest U.S. effects of tornadoes results from tornado outbreaks . . . we find that the frequency of U.S. outbreaks with the many tornadoes is increasing and that it is increasing faster for more extreme outbreaks.” Tippett et al. (2016) report that, to date, they have been unable to link this increase to climate change. While not ruling out climate change, they speculate that low-frequency climate variability may be a contributing factor, among others. Figure 3.8 shows a track of storms on April 21 and 22, 2006, impacting four states from Mississippi to North Carolina. Often these different events are not connected by local authorities, each of which is responsible for recovery from a fraction of the total impact.
Ice Storms
Point I in Figure 3.1 denotes ice storms (freezing rain). As is evident from the experience in 1998 in Québec, Ontario, and in upstate New York, ice storms (freezing rain) can result in very widespread damage after which full recovery may take many weeks. Figure 3.9A shows the historical distribution of freezing rain events in the United States over the past 50 years. Figure 3.9B shows the slight upward trend in event frequency over the period 1975 to 2014. Figure 3.9C shows the likely trend in the frequency of future ice storms across the different regions at risk. Ice storms interrupt power through the accumulation of ice on distribution and transmission lines, as the added weight brings lines down and causes damage to poles and towers. In addition to increased weight, wind blowing against ice-laden transmission lines can cause low-frequency (1 Hz) high-amplitude (1 m) oscillations (called conductor gallop) that further stress towers and insulators. Ice accumulation on nearby trees can cause branches to fall on lines or bring vegetation close enough to allow arcing current to cause a short. Impacts to distribution systems are common, whereas damage to transmission towers is less common but requires more resources and time to recover from. Many evocative pictures of damaged transmission and distribution infrastructure are available, dating back nearly 100 years. Figure 3.10A illustrates the extent to which ice can accumulate on distribution systems, and Figure 3.10B shows towers that collapsed due to ice accumulation during a massive storm in Québec in 1998. After the first tower failed, others were pulled down.
Winter storms are a leading cause of power outages nationally but do not receive as much national attention as concentrated events like hurricanes. However, they often do not meet Department of Energy (DOE) reporting requirements and might be exempt from the system average interruption duration index and the system average interruption frequency index reliability metric reporting. Because winter storm outages may be underreported, accurate statistics are not available. The majority of outages are relatively localized and handled by utility crews experienced with recovering from them. There are established and emerging techniques to reduce the risk of damage from ice storms and accelerate restoration. Building towers to higher standards is a known strategy, but there is insufficient data on the likelihood of
SOURCE: Tang (2008).
extreme ice events and the associated costs of outages to support greater investment. Techniques being explored for distribution systems include helically staked guying for poles, hydrophilic coating to help electrical infrastructure shed ice, and disconnecting wires that fall to the ground without damaging poles.
Floods
Floods (Point F in Figure 3.1) can take many forms, from very abrupt flash floods that follow a sudden rainstorm or the breach of a dam, to events whose buildup occurs over extended periods. Floods can damage distribution or transmission towers and their footings or damage equipment installed on the ground. Most utilities have used historical flood data to choose locations for major facilities, such as substations, that are unlikely to be inundated. However, as the climate changes, the frequency of inundation is also changing (e.g., in some places a “100-year event” may have a much more frequent return period).
Hurricanes and tropical storms are a principal cause of flooding. Detailed maps of the “100-year flood plan” are available for much of the United States from the Federal Emergency Management Agency (FEMA). As of 2005, about one million miles of stream have been mapped. Figure 3.11 shows an example map for an area impacted by the flood following Hurricane Agnes. The map reproduced here is compressed (and hence the legends are not readable), but it is included here to convey the type of information that is available.
The Intergovernmental Panel on Climate Change (IPCC) fifth assessment report anticipates that, in light of climate change, North America will experience “an increase in the number of heavy precipitation events” and “increased damages from river and coastal urban floods” (IPCC, 2014). These changes suggest that it is time to explore the development of more informative strategies to communicate the likely extent and frequency of future flooding since the traditional 30-year or 100-year flood metric is problematic when the underlying physical processes are not stationary.
The National Research Council Committee on Floodplain Mapping Technologies examined map accuracy in 2007 in a report titled Elevation Data for Floodplain Mapping and recommended much greater use of lidar altimetry (NRC, 2007). There are several challenges to accurate flood mapping, including these two: (1) the changes in the rate of river flows (and height of crest) as land is developed in a watershed, and (2) popular pressure to understate risk to lower flood insurance costs and avert an adverse impact on real estate value. Despite these limitations, the FEMA flood maps, if interpreted conservatively, provide a superb basis for assessing flood risks to electrical assets and planning flood remediation.
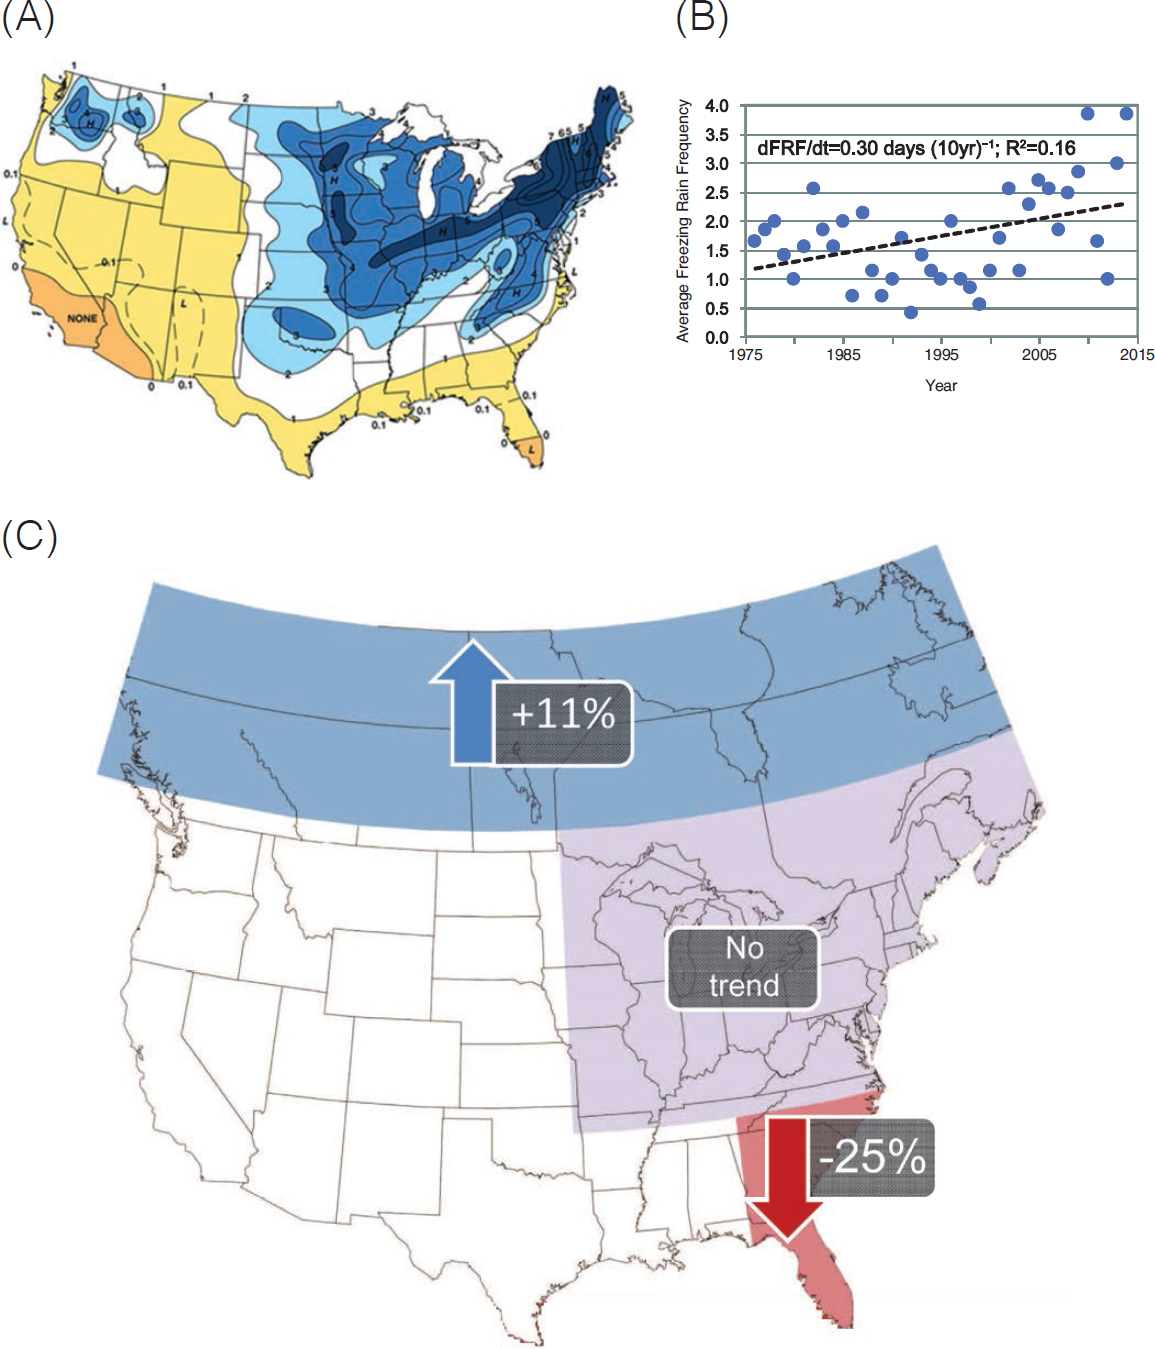
NOTE: FRF, freezing rain frequency.
SOURCES: (A) Changnon and Karl (2003) ©American Meteorological Society. Used with permission. (B) Groisman et al./CC BY (2016). (C) Kunkel (2016).
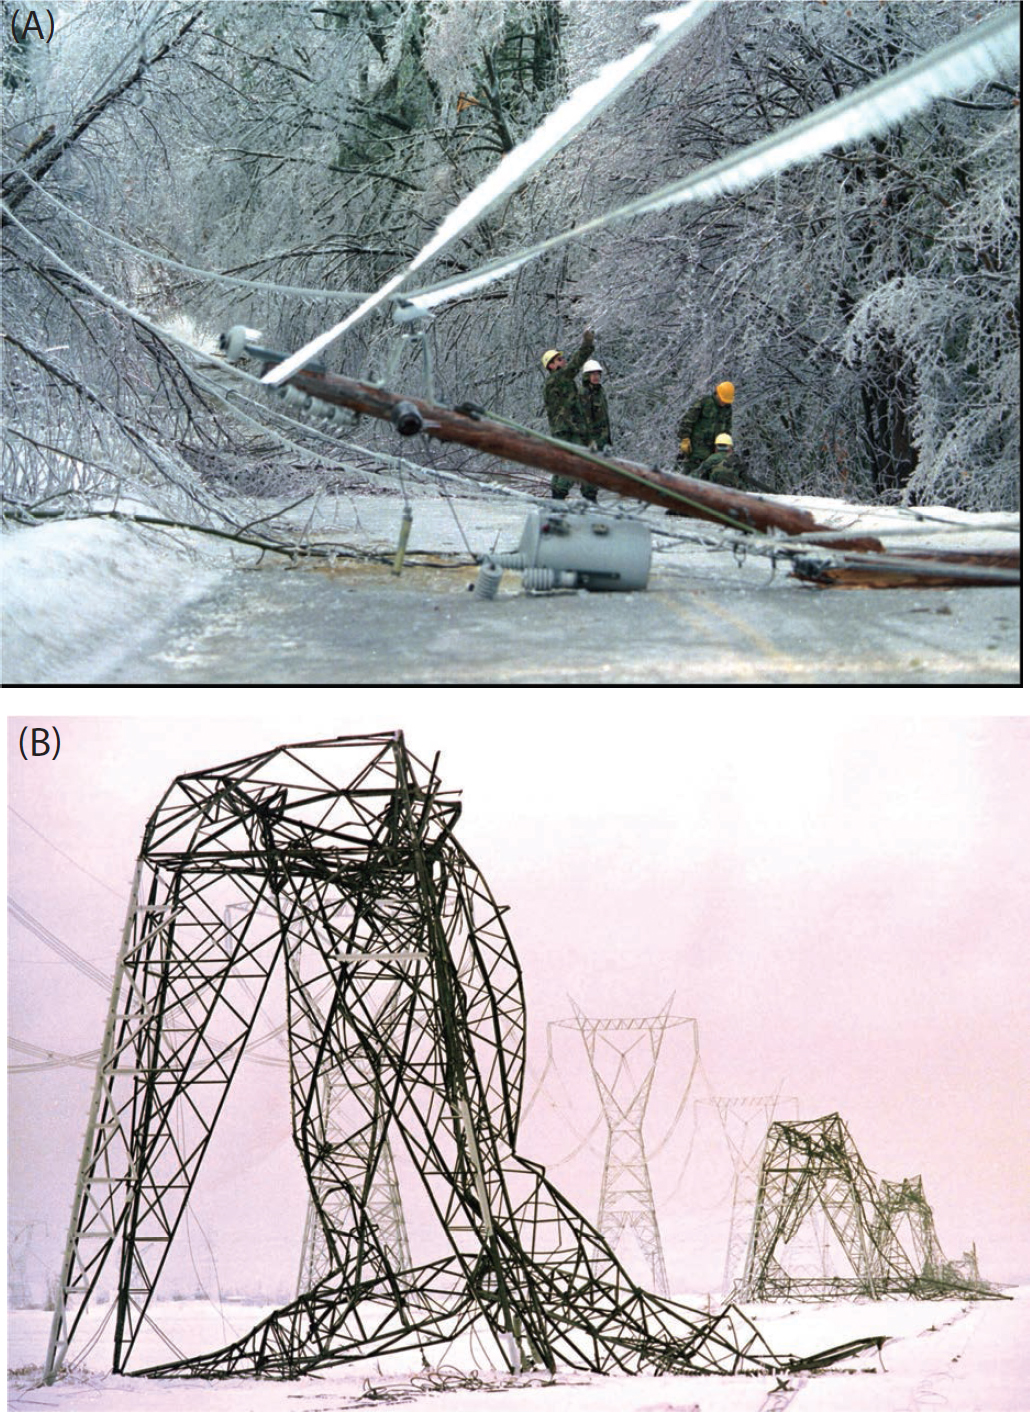
SOURCE: (A) ©1998 The Associated Press (B) Robert Laberge/AFP/Getty Images.
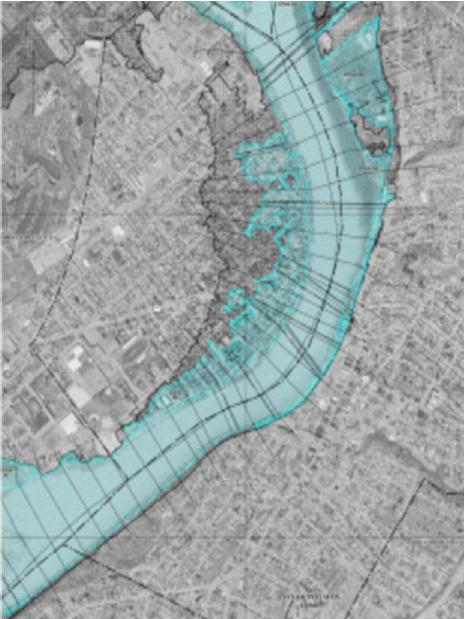
SOURCE: FEMA (2016).
In addition to disrupting the bulk power system, flooding can make access difficult for distribution system repair crews, cause damage by flooding manholes, and cause other problems in underground distribution systems and components. This suggests that care should be taken in design and building of underground systems in flood-prone areas.
Space Weather and Other Electromagnetic Threats
A variety of solar activities (referred to as space weather, point S in Figure 3.1) can impact the earth’s environment (NRC, 2008). Large bursts of charged particles ejected by storms on the sun, called coronal mass ejections, can intersect the earth, causing fluctuations in earth’s magnetic field that create very low frequency voltage gradients across land, generally at northerly latitudes, and induce quasi-steady-state current that can flow in long transmission lines. These low-frequency currents can cause saturation of transformer magnetic cores and result in damage from overheating. Transformer saturation can also result in reactive power and harmonic generation, which can impact the entire power system. The largest storm of this type in the historical record is the 1859 Carrington Event, which caused telegraph systems in the United States and Europe to fail. More recently, smaller solar storms have caused blackouts and very limited damage in power systems. In March 1989, approximately 6 million people lost power for up to 9 hours across Québec from a solar storm that damaged a few transformers and other equipment. A smaller hour-long outage occurred in Sweden in October 2003.
A risk summary prepared by Lloyds (2013) argues that “historical auroral records suggest a return period of 50 years for Québec-level storms and 150 years for very extreme storms, such as the Carrington Event.” In a 2011 study, the Department of Defense’s (DOD’s) JASON advisory panel concluded that the federal response to the risk “is poorly organized; no one is in charge, resulting in duplications and omissions between agencies” (MITRE, 2011). In 2015, the North American Electric Reliability Corporation (NERC) published a Notice of Proposed Rulemaking that requires transmission operators to conduct a vulnerability assessment and update it periodically (FERC, 2015). In October 2016, President Obama issued a comprehensive executive order addressing space weather, which gave the Department of Homeland Security overall leadership in geomagnetic disturbance preparedness and the DOE leadership in addressing grid impacts.
In 1989, there was no warning for the impending geomagnetic disturbance, whereas now satellites can provide 30 minutes of advance warning and sun observation up to 2–3 days ahead of impact. This warning could provide utilities an opportunity to protect the grid—for example, implementing operating procedures that are designed to protect critical transformers. The time constants determining impacts on transformers from solar storms (or from the E3 portion of electromagnetic pulse [EMP] events) are slow enough that there is time to protect transformers even as the event is occurring. Developing standard approaches for real time monitoring of transformers that could be susceptible to damage during solar storms (which can be identified through vulnerability assessments required by NERC) would help operators minimize damage. Such real-time monitoring could be combined with automated protection schemes that prevent transformer damage from geomagnetic disturbances. Other engineering solutions exist to make electrical systems more resistant to geomagnetic disturbances, including building better protection into transformers and designing systems to provide more reactive power on demand.
The National Oceanic and Atmospheric Administration (NOAA) and the U.S. Air Force jointly operate the Space Weather Prediction Center that uses solar and satellite observations (including NOAA’s DSCOVR satellite at the L1 point in deep space) to provide forecasts of space weather events. By observing the limb of the rotating sun, the addition of a satellite at L5 could provide valuable additional advance warning (Gibney, 2017). While coronal mass ejections are relatively slow moving, requiring a day or more to reach the earth, there are a number of events that can produce
highly energetic particles that can arrive at the earth in hours, sometimes with little or no warning. These high-energy particles can cause damage to GPS and other satellites, which are used by the power system.
Recent standards for transmission system performance in the event of geomagnetic disturbance (GMD)—for example, NERC standard TPL-007-1—are currently under revision but require that responsible entities maintain detailed system and geomagnetically induced current system models, use these to perform GMD vulnerability assessments every 5 years, and document and communicate this information to other affected entities.
Finally, the committee notes that several of the protective strategies that power companies adopt to reduce vulnerability to solar storms may also provide protection against the lower energy frequencies of an EMP,1 which is a surge of electromagnetic radiation (Box 3.3) with different components that impact the power system. The early time component of an EMP (E1) is an intense, rapid pulse on the order of tens of kV per meter that decays to nearly zero in less than 1 microsecond; the intermediate time component (E2) has an amplitude of several hundred volts per meter and a duration of one to several hundred microseconds; and the late time component (E3) is a very low amplitude pulse on the order of millivolts per meter with a duration between 1 and 100 seconds. The electric fields associated with EMP can impact power systems directly (E1 and E2) or induce currents in transmission lines similar to the low frequency currents associated with GMD events (E3). Small, suitcase-size EMP devices2 can also cause electromagnetic disturbances that can impact the power systems’ (especially substation) equipment, but the impacts will likely be very localized. A nuclear weapon or a dedicated non-nuclear EMP device detonated at a high altitude could cause widespread damage to the electricity grid; nonetheless, understanding of this risk is largely theoretical. The Electric Power Research Institute (EPRI) collaborated with DOE recently to develop a Joint Electromagnetic Pulse Strategy that outlines broad objectives and research needs but stops short of presenting a plan for EMP hardening (DOE and EPRI, 2016).
While most critical satellites have been “hardened,” a large enough space weather event could cause damage to earth-orbiting satellites including those used for communication and the GPS. Modern utilities use the GPS to provide time synchronization across their spatially distributed systems. Disruption of these precise timing signals can result in operational problems. While the GPS is well protected, it is also possible that sophisticated earth-bound hackers could disrupt GPS software and control systems. There are technologies that can minimize this risk, but to date their adoption has been limited (Achanta et al., 2015).
Hurricanes or Tropical Cyclones
As we have learned repeatedly, tropical cyclones can create enormous havoc in power systems. Modern forecasting methods typically provide several days of advance warning, with increasingly more precise and accurate predictions about intensity and the location of landfall as a storm comes closer. Over their lifetime, tropical storms have three basic impacts on power systems: (1) initial impact of wind and rain, (2) storm surge in coastal areas and near major inland waters (e.g., Lake Pontchartrain during Katrina), and (3) flooding due to precipitation. Hurricane risk is concentrated on the Atlantic and Gulf coasts of the United States and in the state of Hawaii (Figure 3.12A).
A 2016 report of the National Academies of Sciences, Engineering, and Medicine concludes that a “broad consensus
___________________
1 A continental-scale electromagnetic pulse caused by the detonation at high altitude of a specially designed nuclear weapon consists of several electromagnetic waveforms, the first of which has an extremely rapid rise time.
2 “Suitcase-size EMP devices” are more accurately referred to as radio frequency weapons, essentially a class of non-nuclear weapons that have a local impact similar to that of an EMP E1 pulse. While the DOD is very experienced in this area, less attention has been directed to protecting civilian infrastructure. The concern is that one of these devices might target a control center, disrupting some or all of its computers and communications.
has emerged as to the expected future trends in their levels of certainty . . . tropical cyclones are projected to become more intense as the climate warms. There is considerable confidence in this conclusion . . . the global frequency of tropical cyclone formation is projected to decrease . . . but there is less confidence in this conclusion than in the expectation of increasing intensity,” as indicated with historical data in Figure 3.12B (NASEM, 2016).
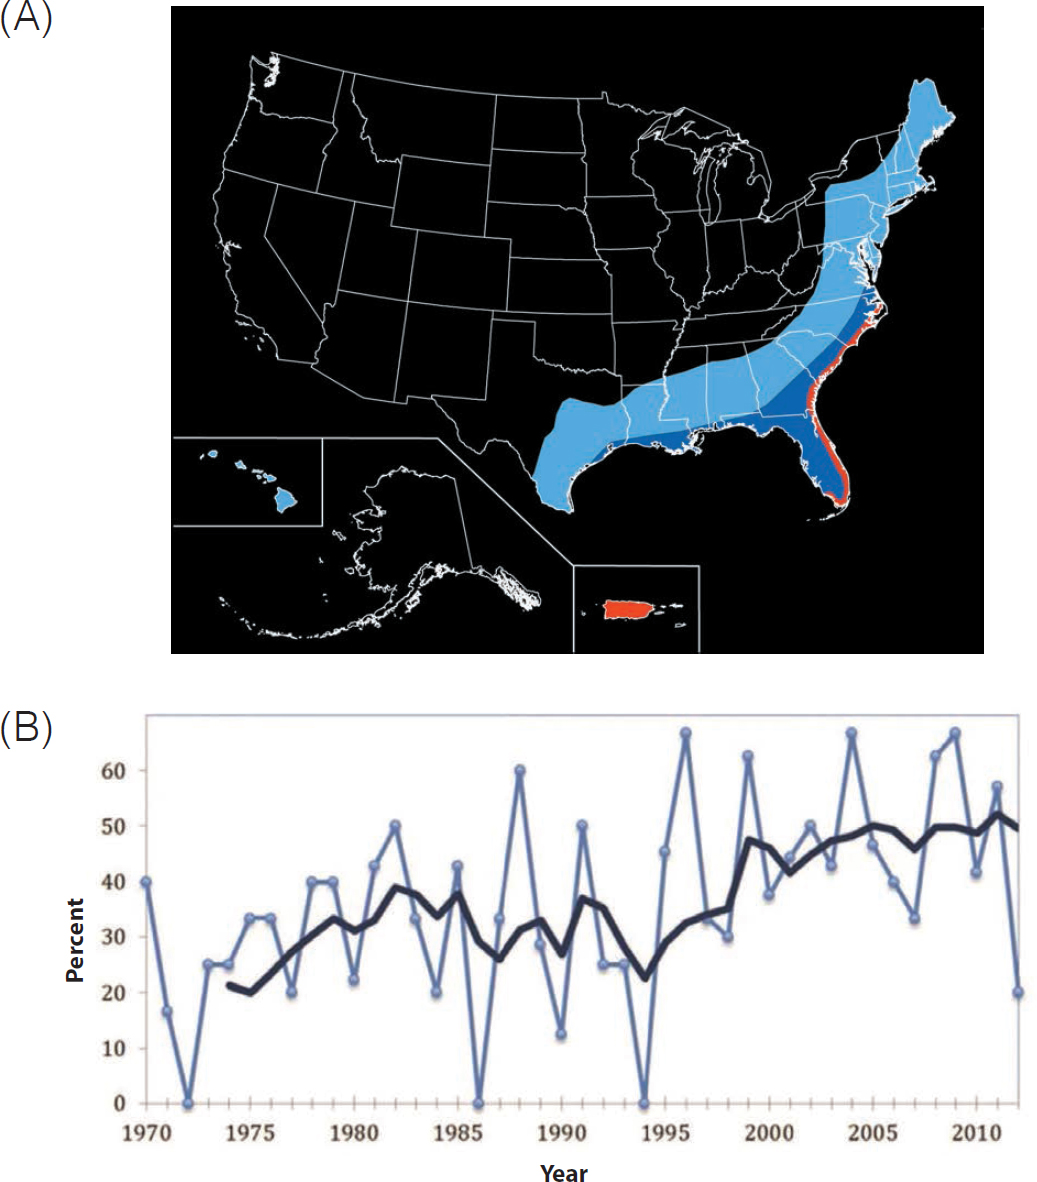
SOURCE: (A) The National Atlas and USGS (2005) and (B) UCS (2016) at www.ucsusa.org.
Along with winter storms, hurricanes and tropical storms3 (Point H in Figure 3.1) are some of the largest sources of disruption of power systems. As illustrated by Superstorm Sandy and Hurricane Katrina, the resulting destruction can be widespread. Sandy was an immense and meteorologically complex storm that caused outages in 17 states and the District of Columbia, with the impacts beginning over a relatively short period of time. In contrast, Hurricane Katrina was a very different storm. While its impact on New Orleans (due largely to dike failures) and coastal Mississippi was the focus of press coverage, the total impact on electricity infrastructure was much broader because the storm had more rainfall, had higher sustained wind speed over larger areas, and traveled up the Mississippi River valley causing outages as far inland as Tennessee. Both Katrina and Sandy were devastating, but while Sandy was essentially a concentrated event, Katrina caused damage to power systems across a much larger region. While advanced models allow scientists to project the course and development of hurricanes with greater precision than ever before, weather events still have the capacity to surprise. In planning and preparation, it is important to remember that the evolution of a hurricane can involve substantial uncertainty.
Volcanic Activity
In much of the country volcanic activity (V in Figure 3.1) is not a concern, but in the Pacific Northwest, and parts of Alaska and Hawaii, it presents a low probability but high consequence risk from eruption, ash fall, lava flow, and lahars. The U.S. Geological Survey maintains an active warning program (USGS, 2016b). Clearly the best strategy to avoid problems is to locate critical facilities away from vulnerable locations. However, as Figure 3.13 illustrates, in the case of Mount Rainier, the impacted region can be quite large. Additional damage can be caused by fine particulate dust and falling ash, which can cause insulator flashovers and potentially disable transformers. The geographic extent of falling ash may greatly exceed the immediate hazard area.
Wildfire
Climate scientists have long predicted more frequent and more intense wildfires as a result of ongoing climate change (NCAR, 1988). While fire typically does not cause widespread damage to power systems, it can have major impacts on specific substations and transmission systems, and operators may have to re-route power flows to avoid affected areas. Vulnerability can often be limited with vegetation control, although very large fires can often jump even the most aggressive protective margins. Restoration of fire-damaged facilities can require days or weeks. Fire is denoted as point W in Figure 3.1.
Drought
Finally, in the extreme upper right corner of Figure 3.1 is point D, for drought. Droughts have multiple implications for power systems, ranging from reduced hydroelectricity generation, limited availability of cooling water for power stations, or increased demand for power needed for pumping and treatment. The IPCC report on extreme events concluded that “there is medium confidence that droughts will intensify in the 21st century in some seasons and areas, due to reduced precipitation and/or increased evapotranspiration. This applies to regions including . . . central North America” (Seneviratne et al., 2012).
While the power system can become very stressed during extreme heat (heat waves), ordinarily it manages to deal with such events. Of course, when the power system is highly stressed, the probability of hardware failures or operator error resulting in significant outages increases. The IPCC Fifth Assessment Report (2014, p. 10) concluded, “It is virtually certain that there will be more frequent hot and fewer cold temperature extremes over most land areas on daily and seasonal time scales, as global mean surface temperature increases. It is very likely that heat waves will occur with a higher frequency and longer duration.” The 2014 U.S. National Climate Assessment drew similar conclusions (USGCRP, 2014).
Findings and Recommendations
The hazards reviewed in this section fall broadly into two categories: (1) those in which human action is the primary contributing factor, and (2) those that involve natural causes. The committee divides its findings and recommendations in this same way. With respect to hazards resulting from human actions, the committee finds the following:
Finding: While to date there have been only minor attacks on the power system in the United States, large-scale physical destruction of key parts of the power system by terrorists is a real danger. Some physical attacks could cause disruption in system operations that last for weeks or months.
Finding: The United States has been fortunate that none of the cyber attacks that are being mounted against the power system have caused significant service disruption. However, the risks posed by cyber attacks are very real and could cause major disruptions in system operations.
Finding: While it is tempting to think of physical and cyber attacks as separate and discrete hazards, they could occur together and could also occur repeatedly. Furthermore, because the power system is essential to the operation of
___________________
3 In this discussion, the committee includes post-tropical cyclones like Superstorm Sandy where most of the damage was done after the winds had dropped below hurricane force and the storm had lost its hurricane structure.
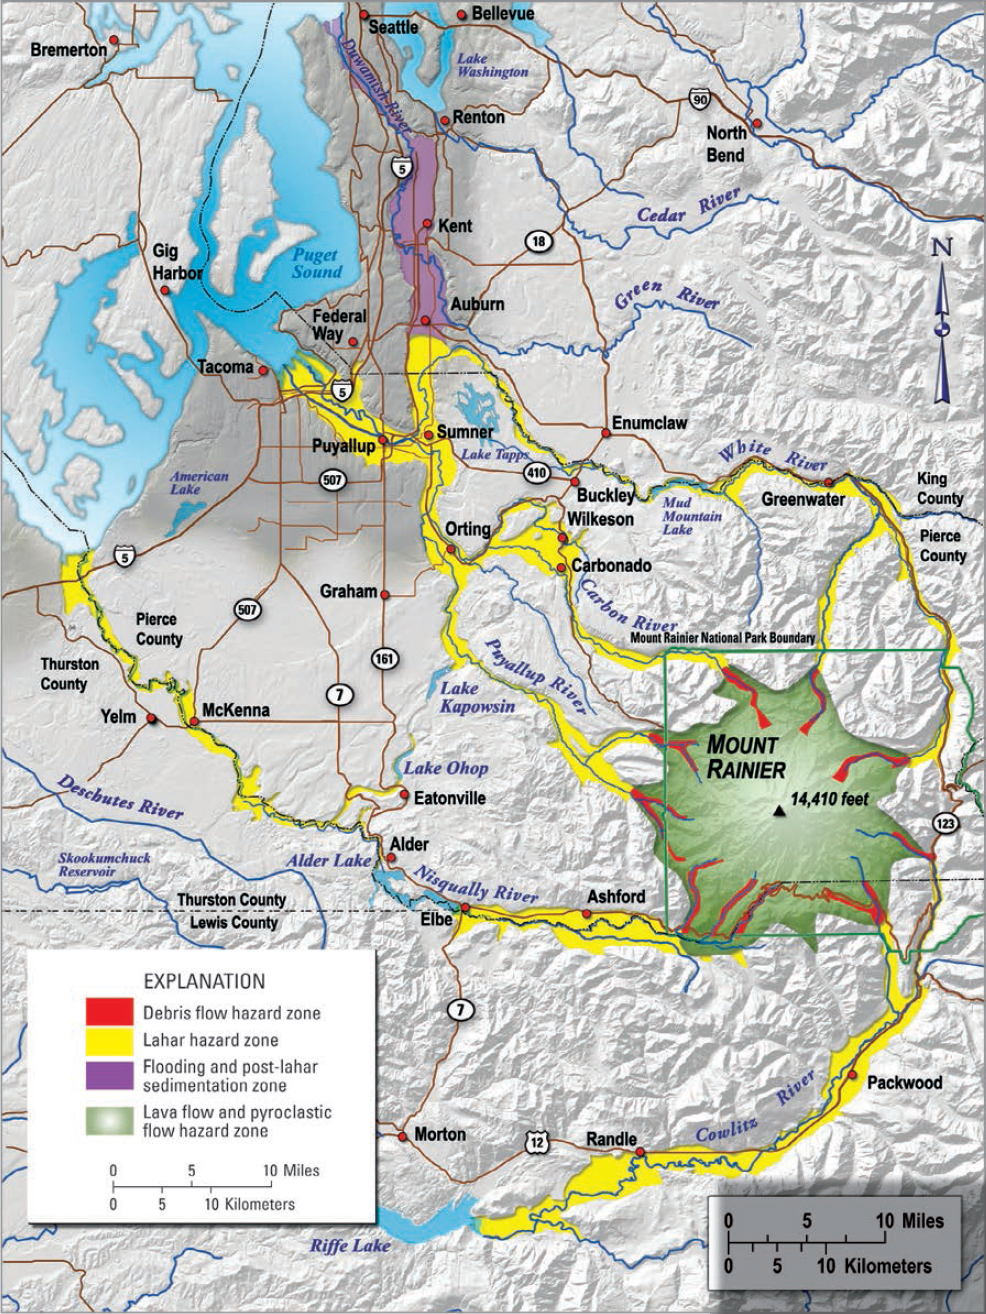
SOURCE: USGS (2008).
many important infrastructures, physical and/or cyber attacks on that system can impact delivery of other critical services. An attack on the power system undertaken in conjunction with other terrorist action could be especially harmful.
Recommendation 3.1: To better protect the grid from physical and cyber attacks, the intelligence communities, the Department of Homeland Security, the Department of Energy, and operating utilities should sustain and enhance their monitoring and information-sharing activities and continue to assure that adequate communication channels are maintained among all responsible parties. Additional steps, such as the creation of teams to test weaknesses in existing systems, should be taken to avoid the risks of complacency and to drive a culture of continual improvement.
With respect to hazards resulting from natural causes, the committee finds the following:
Finding: Good data on the causes, probabilities, and spatial and temporal distribution of natural hazards that can disrupt power systems are essential to assuring the resilient operation of those systems. Government and other responsible parties should support and strengthen the activities of organizations that collect these data.
Finding: The probability, intensity, and spatial distribution of many of the hazards that can disrupt the power system are changing. These changes are due in part to the consequences of ongoing climate change. Traditional measures, based on an assumption of statistical stationarity (e.g., 100-year flood), may need to be revised to produce measures that reflect the changing nature of some hazards.
Finding: Some organizations that are responsible for monitoring and preparing for natural hazards, such as floods and tornadoes, have a local focus that can overlook spatial correlation and broader system risks. Nonetheless, local assessments such as the “Threat and Hazard Identification and Risk Assessment,”4 encouraged by the Federal Emergency Management Agency, can provide valuable resources for utilities to build upon.
Recommendation 3.2: On a periodic basis (e.g., every 5 years), the Department of Homeland Security and the Department of Energy, as the energy sector lead, should work with state and local authorities and electricity system operators to undertake an “all-hazards” assessment of the natural hazards faced by power systems. Local utilities should customize those assessments to their local conditions and build on existing local assessments to include detailed electricity system information, keeping in mind that the past may not be an accurate predictor of the future.
THE LIFE CYCLE OF A POWER OUTAGE
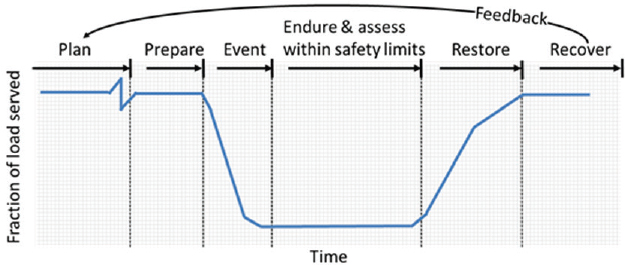
Although the type and extent of damage varies among the different threats previously described, a notional time-series model of a power outage is shown in Figure 3.14, which provides elaboration of some of the key steps in the four-stage process of resilience displayed in Figure 1.2A. The committee also uses these steps in Chapter 6 to illustrate strategies to achieve resilience in the face of a specific cause of disruption.
The blue line in Figure 3.14 illustrates the percentage of load that may be served over time, from the initial full level until the start of the event, at which point load begins to drop off. Load persists at a reduced level for some period until restoration beings. Power is then restored, although sometimes not to the full pre-event level, as electricity-consuming entities may have been damaged or destroyed. If the event caused significant physical damage, load may continue to build slowly during a multi-year recovery period as electricity systems are restored, homes are reoccupied, and businesses reopen.
The relative length of each stage and the activities undertaken by utilities and other organizations involved in the response are different depending upon the type of disruption. Likewise, the activities undertaken by utilities during each of these stages also varies significantly based on the resources available and the technological characteristics of the impacted system. As briefly introduced below and as outlined in the following chapters, there are many strategies that can help utilities perform better through the entire outage life cycle.
Plan
The majority of time is spent in the planning stage, which occurs continuously and well before any specific hazard is identified. While there is variation among organizations, utilities—from large vertically integrated firms to small distribution cooperatives—generally know what the major hazards are in their service territories, may have first-hand experience with such hazards, and may even be required by regulators to prepare and submit plans regularly for addressing these risks. For example, utilities in the Southeast prepare for hurricanes, whereas those in the far northeast focus more on ice storms. Utilities also generally know which parts of their physical systems are most vulnerable. This knowledge is acquired through experience and with diverse resources, such as data sets from NOAA and the National Weather Service. Nonetheless, the local impacts of most hazards, even those with a long history, are unknown during planning stages. Following Superstorm Sandy, the New Jersey utility Public Service Enterprise Group believed that the impact would have been much greater (perhaps double) if the storm track had been only 10 miles different, as more
___________________
4 See, for example, https://www.fema.gov/media-library-data/8ca0a9e54dc8b037a55b402b2a269e94/CPG201_htirag_2nd_edition.pdf.
critical substations could have been affected by flooding in drainage basins. Utilities have less experience handling certain risks—notably those related to cyber attack—which makes assessing and planning more difficult.
Activities during the planning phase are both preventative and preparatory. At the distribution level, these include hardening system components and installing more advanced technologies such as automatically reconfigurable circuits. The level of investment by different utilities is closely tied to state regulatory or board oversight decisions; thus, there is wide variability across different states, and planning decisions are not solely determined by utilities. For investor-owned utilities, state regulatory commissions strive to keep costs low for ratepayers by approving investments that have net benefits for customers and not allowing a utility to “gold plate” its system. On the transmission level, utilities maintain, harden, and expand the physical and cyber infrastructure (both hardware and software) with investments and reliability standards overseen by NERC and FERC. As the complexity and scale of the grid as a cyber-physical system continues to grow, there are opportunities to plan and design the system to reduce the criticality of individual components and to fail gracefully as opposed to catastrophically. Equally important, utilities routinely plan for restoration—for example, by developing mutual assistance agreements, investing in spare parts sharing programs, and conducting restoration drills and exercises. Utilities must also engage and maintain strong relationships with local emergency management agencies to integrate their own planning into local and national efforts, as discussed in greater detail in Chapters 5 and 6. Additionally, there is a critical need to engage electricity end users during planning to define the locations and characteristics of critical loads in a service territory and ensure appropriate use of backup generation.
Prepare
The preparation phase begins when a specific threat is identified—for example, when a hurricane forms with a projected track that will impact a specific utility. Some hazards have no advance warning, while others can be identified and monitored with sufficient time for utilities and other responders to move beyond general planning and develop specific actions. For example, utilities preparing for impeding hazard may check the health of critical components (including the health of cyber systems), check stocks of spare equipment, activate mutual assistance agreements, and bring local crews to a state of readiness, potentially pre-staging supplies and repair crews at specific locations. Operators assess the level of generation available, likely bringing additional reserve generation online, evaluate the adequacy and vulnerability of different fuel stocks and supply chains, and verify the state of charge of utility-scale storage assets if available. During preparation, utilities can begin coordinating with relevant disaster response organizations and encourage the public to purchase fuel and test backup generators. Utilities that have built and maintained strong relationships with local emergency management organizations know whom to engage, whereas organizations that have not built these relationships may waste valuable time and resources trying to connect with local efforts. There are growing opportunities to engage distributed energy resource (DER) owners so that system operators know the state of these resources, although current interconnection standards and contractual arrangements need to be revised to promote utility visibility and controllability of DERs.
Event
The duration of disruptive events varies significantly, as do the capabilities and resources of different utilities. The duration of the actual disruptive event is always much shorter than the period from planning through final recovery. It can last many hours for hurricanes to minutes or even seconds for tornadoes and earthquakes. Floods can last many days or a small number of weeks. The longest duration, however, is for cyber events. The outage may only last a short time, but the period from cyber breach to detection and remediation may last many months. In the recent hack in Ukraine, the breach occurred 9 months before power was interrupted. The hackers used this time to learn how to control the breached systems.
Except in the case of a cyber attack, when the event may be ongoing for an extended period but undetected, the principal activity during the event is to monitor the damage and failures as they emerge and to develop as clear an understanding of system state as possible. Distribution systems with large amounts of advanced meter infrastructure and automated reconfiguration may lessen the number of customers experiencing outages. Some utilities may not be aware of outages until they are reported by telephone. Some events may be so destructive to physical and cyber systems that automation technologies have no benefit and could even be detrimental in the case of a cyber attack (e.g., if microprocessor-based relays with software installed by the manufacturer are hacked, the utility may have to replace the relay entirely or send it back to the manufacturer). There is a great deal of activity at the level of generation and transmission systems. System operators can balance generation and load through generation dispatch, load control (e.g., rolling blackouts), controllable DERs, or intentional islanding. It may be possible to continue with some preparatory activities, but, with limited time, telemetry, and communications, major changes may not be possible.
Endure and Assess Within Safety Limits
For some events, conditions may prevent dispatch of crews (either boots on the ground or manned or unmanned aerial vehicles) because of safety concerns. This period may be zero (i.e., restoration can begin immediately), or it may stretch for a lengthy time if access to damaged facilities is blocked as by floodwater or landslides (utility crews can usually deal with downed trees). If cyber monitoring and control systems are intact, utilities can continue to assess the state of the system. During this phase, utilities communicate to understand the extent of damage, begin to prioritize repairs based on available information, and may even schedule the dispatch of restoration crews. As explained in Chapter 5 of this report, there are many strategies to reduce the adverse social and economic impacts of power outages, including using DERs, backup generators, and microgrids to provide local power to critical facilities.
Restore
Restoration is the most tangible and publicly visible phase of the event life cycle. As soon as conditions permit safe dispatch of crews, utilities develop a high-resolution understanding of damages with manned and unmanned aerial vehicles as well as crews on the ground. Based on this understanding, priorities for restoration are established and repairs initiated, often through the shared resources previously arranged in mutual assistance agreements. If a critical transformer without a replacement is damaged, the system may have to be operated in a reduced state until a suitable replacement can be provided. System operators manage switching to support physical restoration. Central operations also provide information to customers and support field crews by providing the necessary materials, replacement components, repair equipment, and qualified workers, as well as transportation and provisioning. This may require coordinating with state or federal officials to waive regulations or even using military resources in extreme cases. If there are regions of the interconnection with power, restoration may proceed from the “edge”; alternatively, utilities may initiate black-start5 procedures. As installations of DERs continue to increase, there are growing opportunities to use these resources in restoration and black start; however, significant research is needed to demonstrate this capability.
Recover
After the electrical grid has been repaired and service has been restored from a large-area, long-duration outage, utilities and regulators typically evaluate the event to identify root causes and opportunities to improve performance. These investigations directly inform planning and investment decisions made by utilities and overseen by regulators. As discussed in later chapters, there is often scrutiny of utility and infrastructure performance following a major outage, and there may be public and political support for grid investments that impact regulatory proceedings. In many cases (excluding cyber attacks and cascading failures) the commercial, residential, and public infrastructure are also damaged, may be long in returning, or may be lost permanently. In this case, the immediate restoration may be concluded, but the load served may be slightly or substantially less than prior to the event. Presuming the economy recovers and the impacted region is restored, the utility may be engaged in new construction for a number of years. At a minimum, this will entail a sustained period of increased capital spending and staffing for construction.
REFERENCES
Achanta, A., S.T. Watt, and E. Sagen. 2015. Mitigating GPS Vulnerabilities. Presented at the Power and Energy Automation Conference, Spokane, Wash. https://selinc.com/api/download/104197/. Accessed April 15, 2017.
Argonne National Laboratory, Brookhaven National Laboratory, Los Alamos National Laboratory, Oak Ridge National Laboratory, Pacific Northwest National Laboratory, and Sandia National Laboratories. 2016. Resilience of the U.S. Electricity System: A Multi-Hazard Perspective. https://energy.gov/sites/prod/files/2017/01/f34/Resilience%20of%20the%20U.S.%20Electricity%20System%20A%20Multi-Hazard%20Perspective.pdf.
Changnon, S.A., and T.R. Karl. 2003. Temporal and spatial variations of freezing rain in the contiguous United States: 1948–2000. Journal of Applied Meteorology 42(9): 1302–1315.
___________________
5 Most generators require power from the grid to energize their windings, which will not be available in the event of a major outage. “Black start” refers to the process of providing the necessary power to restore a generation plant when grid power is unavailable.
DOE (Department of Energy). 2015. “Modernizing the Electric Grid.” Quadrennial Energy Review First Installment: Transforming U.S. Energy Infrastructures in a Time of Rapid Change. https://energy.gov/sites/prod/files/2015/08/f25/QER%20Chapter%20III%20Electricity%20 April%202015.pdf.
DOE and EPRI (Electric Power Research Institute). 2016. Joint Electromagnetic Pulse Resilience Strategy. https://www.energy.gov/sites/prod/files/2016/07/f33/DOE_EMPStrategy_July2016_0.pdf.
E-ISAC (Electricity Information Sharing and Analysis Center) and SANS ICS (Industrial Control Systems). 2016. Analysis of the Cyber Attack on the Ukrainian Power Grid. https://ics.sans.org/media/E-ISAC_SANS_Ukraine_DUC_5.pdf.
FEMA (Federal Emergency Management Agency). 2016. “FEMA Flood Map Service Center.” http://msc.fema.gov/portal. Accessed February 28, 2017.
FERC (Federal Energy Regulatory Commission). 2015. “FERC Proposes New Reliability Standard on Geomagnetic Disturbances.” https://www.ferc.gov/media/news-releases/2015/2015-2/05-14-15-E-1.asp#.WJS5jm8rLGh. Accessed March 2017.
Gibney, E. 2017. Europe lines up for solar storm view. Nature 541: 271.
Groisman, P.Y., O.N. Bulygina, Y. Xungang, R.S. Vose, S.K. Gulev, I. Hanssen-Bauer, and E. Førland. 2016. Recent changes in the frequency of freezing precipitation in North America and Northern Eurasia. Environmental Research Letters 11(4): 045007.
IPCC (Intergovernmental Panel on Climate Change). 2013. Climate Change 2013: The Physical Science Basis. Contribution of Working Group I to the Fifth Assessment Report of the Intergovernmental Panel on Climate Change (T.F. Stocker, D. Qin, G.-K. Plattner, M. Tignor, S.K. Allen, J. Boschung, et al., eds.). Cambridge: Cambridge University Press.
IPCC. 2014. Climate Change 2014: Synthesis Report. Contribution of Working Groups I, II and III to the Fifth Assessment Report of the Intergovernmental Panel on Climate Change (Core Writing Team, R.K. Pachauri, and L.A. Meyer, eds.). IPCC, Geneva, Switzerland. http://ar5-syr.ipcc.ch/ipcc/ipcc/resources/pdf/IPCC_SynthesisReport.pdf.
Kunkel, K. 2016. “NOAA Cooperative Institute for Climate and Satellites (NC State).” Presentation to the Committee on Enhancing the Resilience of Nation’s Electric Power Transmission and Distribution System on July 11. Washington, D.C.
Lloyds. 2013. Solar Storm Risk to the North American Electric Grid. https://www.lloyds.com/~/media/lloyds/reports/emerging%20risk%20reports/solar%20storm%20risk%20to%20the%20north%20american%20electric%20grid.pdf.
MITRE. 2011. Impacts of Severe Space Weather on the Electric Grid. https://fas.org/irp/agency/dod/jason/spaceweather.pdf.
NASEM (National Academies of Sciences, Engineering, and Medicine). 2016. Attribution of Extreme Weather Events in the Context of Climate Change. Washington, D.C.: The National Academies Press.
National Atlas and USGS. 2005. “Hurricane Hazards—A National Threat.” https://walrus.wr.usgs.gov/infobank/programs/html/factsheets/pdfs/2005_3121.pdf. Accessed July 13, 2017.
NCAR (The National Center for Atmospheric Research). 1988. “NCAR Co-Hosts Wildfire Severity and Global Climate Change Workshop.” https://opensky.ucar.edu/islandora/object/archives%3A883. Accessed July 13, 2017.
NOAA (National Oceanic and Atmospheric Administration). 2016. “Historical Records and Trends.” https://www.ncdc.noaa.gov/climateinformation/extreme-events/us-tornado-climatology/trends. Accessed February 28, 2017.
NOAA and NSSL (National Severe Storms Laboratory). 2009. “Tornado Days (1990–2009).” Oklahoma Climatological Survey. http://climate.ok.gov/index.php/climate/map/tornado_days_1990_2009/tornadoes_severe_storms. Accessed February 28, 2017.
NRC (National Research Council). 2007. Elevation Data for Floodplain Mapping. Washington, D.C.: The National Academies Press.
NRC. 2008. Severe Space Weather Events—Understanding Societal and Economic Impacts: A workshop report. Washington, D.C.: The National Academies Press.
NRC. 2012. Terrorism and the Electric Power Delivery System. Washington, D.C.: The National Academies Press.
OTA (Office of Technology Assessment). 1990. Physical Vulnerability of Electric System to Natural Disasters and Sabotage, OTA-E-453. Washington, D.C.: U.S. Government Printing Office.
Parfomak, P. 2014. Physical Security of the U.S. Power Grid: High-Voltage Transformers Substations. https://fas.org/sgp/crs/homesec/R43604.pdf.
Peltier, R. 2012. “Dominion’s North Anna Station Sets New Standard for Earthquake Response.” Power, November 1. http://www.powermag.com/dominions-north-anna-station-sets-new-standard-for-earthquake-response/?pagenum=3. Accessed April 28, 2017.
Petersen, M.D., M.P. Moschetti, P.M. Powers, C.S. Mueller, K.M. Haller, A.D. Frankel, Y. Zeng, et al. 2014. Documentation for the 2014 Update of the United States National Seismic Hazard Maps. U.S. Geological Survey, Open-File Report 2014–1091.
Seneviratne, S.I., N. Nicholls, D. Easterling, C.M. Goodess, S. Kanae, J. Kossin, Y. Luo, et al. 2012. Changes in climate extremes and their impacts on the natural physical environment. Pp. 109–230 in Managing the Risks of Extreme Events and Disasters to Advance Climate Change Adaptation (C.B. Field, V. Barros, T.F. Stocker, D. Qin, D.J. Dokken, K.L. Ebi, M.D. Mastrandrea, et al., eds.). A Special Report of Working Groups I and II of the Intergovernmental Panel on Climate Change (IPCC). Cambridge: Cambridge University Press.
Tang, B. 2008. “National Center for Atmospheric Research.” http://www.ustornadoes.com/wp-content/uploads/2014/04/brian-tang-april27-ncar. png. Accessed July 13, 2017.
Tippett, M.K., C. Lepore, and J.E. Cohen. 2016. More tornadoes in the most extreme U.S. tornado outbreaks. Science 354(6318): 1419–1423.
UCS (Union of Concerned Scientists). 2016. “Hurricanes and Climate Change.” http://www.ucsusa.org/global_warming/science_and_impacts/impacts/hurricanes-and-climate-change.html#. WJS9OW8rLGg. Accessed November 27, 2016.
USGCRP (U.S. Global Change Research Program). 2014. “National Climate Assessment.” http://nca2014.globalchange.gov/. Accessed July 13, 2017.
USGS (U.S. Geological Survey). 2008. “Mount Rainier—Living Safely With a Volcano in Your Backyard.” https://pubs.usgs.gov/fs/2008/3062/fs2008-3062.pdf.
USGS. 2016a. “Tsunami hazards—A National Threat.” https://water.usgs.gov/edu/tsunamishazards.html. Accessed February 28, 2017.
USGS. 2016b. “U.S. Volcanoes and Current Activity Alerts.” https://volcanoes.usgs.gov/index.html. Accessed February 28, 2017.
Vastag, B. 2011. Nuclear power plant remains offline after August earthquake. The Washington Post, November 1.
Wuebbles, D., G. Meehl, K. Hayhoe, T.R. Karl, K. Kunkel, B. Santer, M. Wehner, et al. 2014. CMIP5 climate model analyses: Climate extremes in the United States. Bulletin of the American Meteorological Society 95(4): 571–583.


