
3
Risks and Realities of Cost Overruns for Large Strategic Missions
A major community concern about large strategic missions is their cost, particularly cost overruns. Because of this, they can have major impacts on space science budgets. One of the reasons why NASA asked the National Academies to undertake this study was because of what happened with large strategic missions during the previous decade, particularly when both the James Webb Space Telescope (JWST) and the Mars Science Laboratory (MSL)/Curiosity rover experienced significant cost growth. Both projects received considerable publicity and scrutiny because of this cost growth, and they had impacts on their respective divisions’ portfolios. Even today some stakeholders consider that there is a lingering stigma to large strategic missions because of recent experience. As this chapter explains, NASA, Congress, and the decadal surveys all took actions in response to these cost overruns, and the positive results of these actions are now becoming apparent.
The four NASA divisions have a different portfolio mix and vary in their amount of reliance on large strategic missions to achieve their overall science goals. The committee examined NASA’s allocation of missions over the past 20 years using acquisition approach as a figure for comparison, relying on a recent analysis conducted by The Aerospace Corporation.1
NASA benefits from having a variety of different acquisition approaches, which can be adapted to the needs of the project. NASA missions are acquired by being directed to NASA centers or competed through an Announcement of Opportunity. Additionally, NASA develops contributed instruments to be flown by other organizations (European Space Agency, Japan Aerospace Exploration Agency, U.S. Department of Defense [DOD], National Reconnaissance Office, etc.), relying on them to ensure that the science is implemented. Directed missions are typically more expensive missions based on high science value targets. Competed missions are selected based on science value with a fixed cost cap. For purposes of comparison in this particular analysis, large strategic missions have been taken to be synonymous with directed missions. (See Figure 3.1.) However, this group of missions differs from those shown in Figure 1.1, which is limited to missions with life cycle costs in excess of ~$1 billion (FY2015).2
___________________
1 Bob Bitten, Justin Yoshida, Elliott Tibor, and Christopher May (The Aerospace Corporation), Portfolio Mix of NASA Science Missions, December 7, 2016.
2 One factor in cost prediction and control is how budget reserves are managed. Prior to the instigation of the new policy, limited budget reserves were maintained at NASA headquarters and the majority of funding flowed down to the implementing center or lead organization. The policy of maintaining reserves in the form of unallocated future expenses—shown here as the difference between the 50th-percentile and the 70th-percentile estimates—resulted in flexibility with resources held at different levels within the agency. For example, if one project team was successful in delivering the system at or below the 50th-percentile estimated budget, then the UFE remained unallocated at the directorate
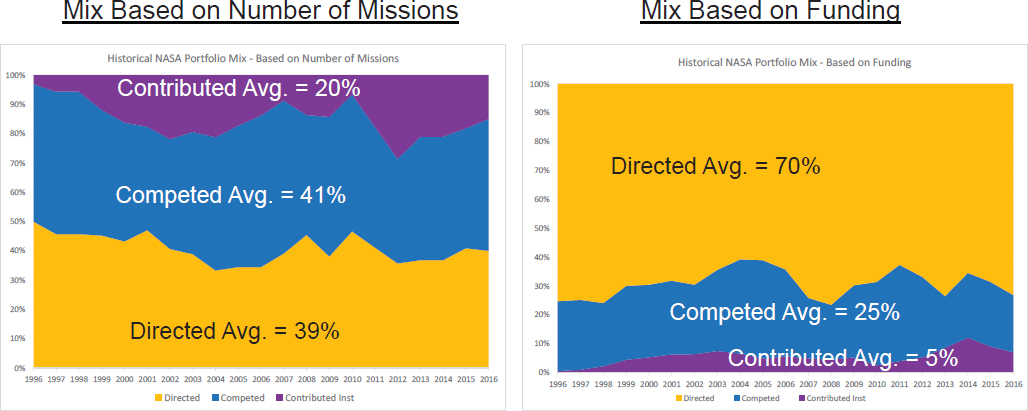
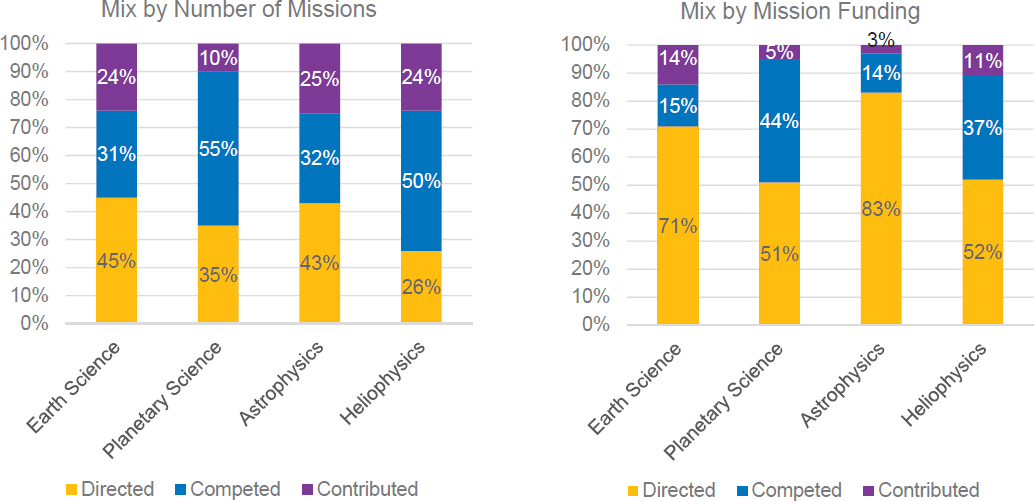
As noted in Chapter 1, according to the Science Mission Directorate (SMD), approximately half of the SMD’s budget—46 percent—is devoted to new missions. Of this budget for new missions, directed missions make up an average of 70 percent of the funding and the remainder is devoted to competed missions. Clearly directed missions consume a significant portion of the overall NASA science mission budget and a major portion of the new-mission funding. Figure 3.2 shows these same data broken out against the four science themes. What it also shows is that when the portfolio mix is evaluated by number of missions, the mix is much more evenly distributed, both within each division, and when the divisions are compared to each other. The difference between evaluating the portfolio mix by budget amounts versus numbers of missions highlights one of the difficulties of trying to assess “balance,” especially across divisions: Is balance determined by the percentages of money spent, or by the number of missions, or by some other factor? As noted in Chapter 2, the committee concluded that balance is an issue that is best defined by individual decadal surveys, both because they are closer to the requirements of the scientific discipline and because definitions of balance change over time. This study cannot presume what balance will be for a specific scientific discipline and by extension an SMD division 3, 5, or 7 years from now.
The balance of the astrophysics portfolio has been exacerbated in the past decade by the James Webb Space Telescope experience. JWST grew substantially from its early budget estimates and had major effects on NASA’s astrophysics budget, prompting the agency to remove JWST from the astrophysics budget and treat it as a separate program. The JWST experience also helped lead to reforms in the way that NASA estimates costs for missions, and how the agency manages missions. Those reforms, and the current state of cost estimation for NASA space science missions, are the subject of later sections in this chapter. Although the majority of SMD’s new-mission funding (approximately 70 percent) goes to directed missions; these missions do not consume all the new-mission budget within NASA divisions. They range from 51 percent for the Planetary Science Division to 83 percent for the Astrophysics Science Division. (See Figure 3.2; the same data are displayed in a different form in Figure 3.1.)
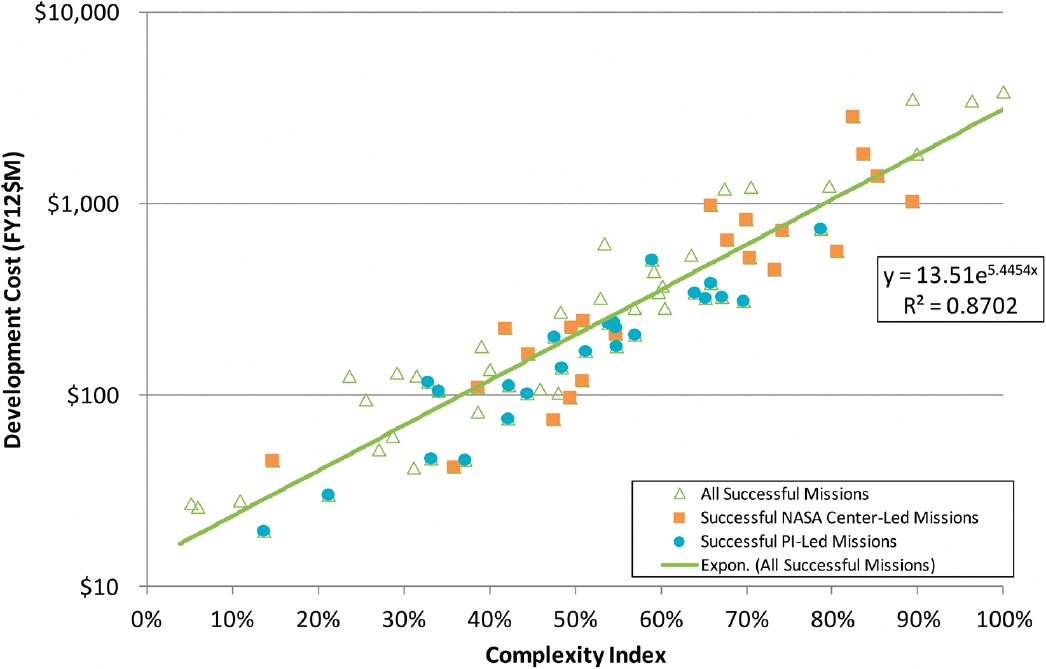
An Aerospace Corporation study performed in 2013 compared development costs of principal investigator (PI)-managed missions and center-managed missions. For this study, PI-managed missions represent smaller missions and center-managed missions represent large strategic missions. The purpose of the study was to identify
___________________
level and could be applied to other missions that were experiencing a larger amount of cost growth. By budgeting at the 70th-percentile and holding reserves at higher levels, funds were essentially fungible and cost performance improved at the portfolio level. Furthermore, the policy resulted in a significant reduction in breach of the Nunn-McCurdy Amendment and thus less disruption to the development team.
relative cost between implementation modes. Comparisons were based on development cost, development cost growth, and relative complexity using the complexity-based disk assessment (CoBRA) tool. The study focused on missions launched between 1998 and 2011.
A comparison of center-led and PI-led missions is shown in Figure 3.3. PI-led missions are generally less complex than center-led missions, and their average cost is commensurately lower than the average cost of center-led missions. The average cost of PI-led missions in the study is FY2012 $226 million, while the average cost of center-led missions in the study is FY2012 $620 million.
The committee notes that the best way to control costs is not by not selecting risky missions, but by providing for sufficient funds up front to retire the risks definitively prior to mission confirmation (i.e., elevating all systems to above technology readiness level 6 by the preliminary design review). This at first may seem like it merely increases the cost of a mission, but in reality it is an exercise to uncover true costs earlier in the entire mission development cycle, rather than later. Uncovering costs earlier rather than later provides NASA management with more options on how to address them and maintain balance across their entire portfolio.
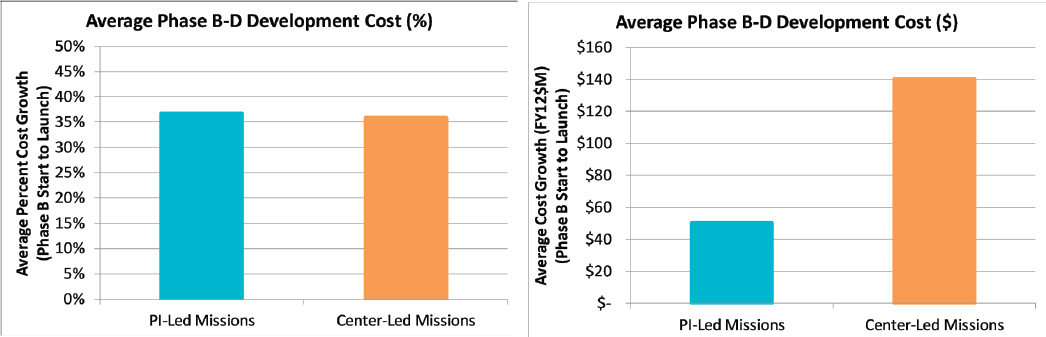
Capturing the inherent complexity of a program can assist decision makers and analysts in developing more realistic risk assessments and technology readiness assessments that can influence cost estimates and overall evaluation of program balancing. The study also examined the historical development cost growth (from Phase B start to launch) of the two mission subsets. While the difference in average costs between the two mission types drives a relatively large difference in absolute dollars of the growth, there is no significant difference between the development-cost growth averages. (See Figure 3.4.)
Although both center-led and PI-led missions have experienced similar cost growth, there may be different factors causing cost growth in these different missions. This could require different approaches to limiting cost growth. It is beyond the scope of this study to recommend how to control cost growth in NASA missions; the committee merely notes that failing to control cost growth for the largest missions poses the biggest threat to maintaining balance, as even a modest percentage increase in the cost of a large mission could eliminate an entire small mission.
NASA has initiated studies called explanations of change (EoCs) to get at the issue of what portion of cost growth might be attributable to external (less controllable or uncontrollable) versus internal (controllable by the project management) factor. Understanding this will be valuable to improving the accuracy of future cost estimates.
What these studies of cost growth in NASA missions demonstrate is that both small and large missions have similar percentage cost overruns, large missions naturally cost more than small missions, and the entire budget of the Science Mission Directorate is not consumed by large missions. Although the committee has stated throughout this report that the proper definition of balance is best determined by the relevant decadal surveys and their midterm reviews, the committee did not detect substantial imbalances within NASA’s science divisions.
PROGRAM LIFE CYCLES
NASA projects have life cycles defined by different phases ranging from pre-Phase A concept studies to Phase E science operations and Phase F end of life. (See Figure 3.5.) The phases are further divided into key decision
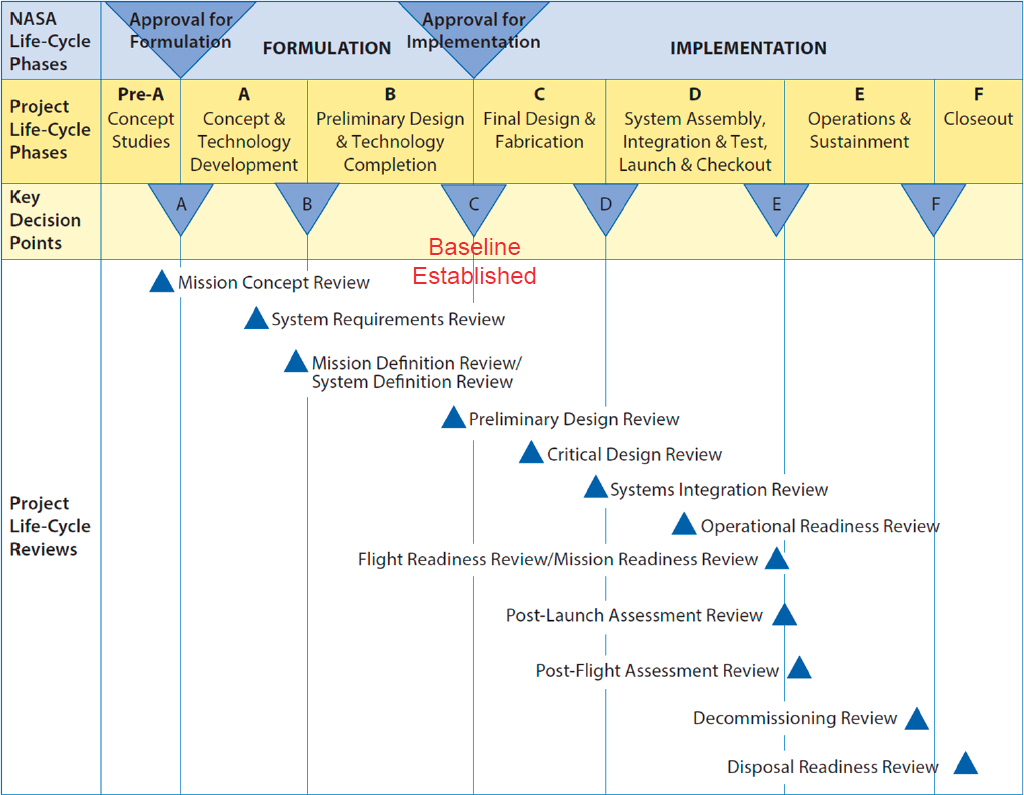
points and project life-cycle reviews.3 NASA establishes a project’s baseline budget at Key Decision Point C (KDP-C). However, it is not uncommon for the public, the press, and the scientific community to cite low-fidelity cost estimates made prior to KDP-C, thus creating the false impression that a mission’s costs have grown substantially when the reality is that the early “estimates” were not actual estimates, or were made by project advocates rather than an independent authority. The formal decision to proceed with a project is made at KDP-C, and the independent estimates made at this point are the only valid ones.
NASA holds KDP-C after the mission has undergone a preliminary design review (PDR) that comprehensively evaluates the overall mission design. Establishing a baseline budget at KDP-C—after the PDR—is important because mission concepts can substantially evolve prior to the PDR. Estimates at an early stage, even when done with the best procedures and best intentions, still represent a snapshot of a design that experience has demonstrated will evolve considerably before reaching PDR.
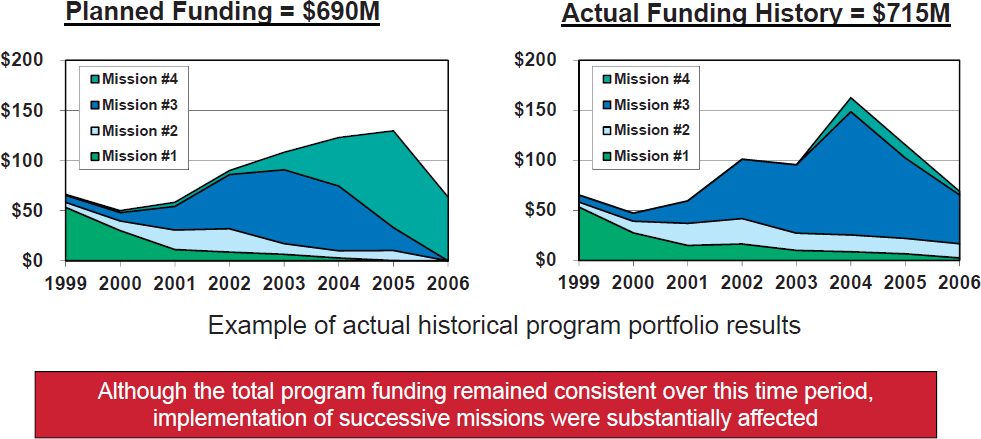
Establishing a mission’s cost is vital because at any given time NASA divisions have multiple missions under development or in future planning. If a mission’s cost increases beyond the initial plan, this will have impacts on future projects, leading to delays in those projects. Because large strategic missions are so expensive, their cost increases can have a greater impact than smaller missions, rippling through a division, or even the entire agency, with negative effects, and damaging NASA’s reputation. (See Figure 3.6.)
Cost growth on large strategic missions can be particularly challenging because of the large, sometimes multibillion-dollar base estimates, where even a small percentage cost growth during development can present budget pressure within the division, affecting its overall portfolio balance. Furthermore, the large strategic missions
___________________
3 NASA/SP-2014-3705, NASA Space Flight Program and Project Management Handbook.
typically have a larger number of stakeholders (perhaps an international partner), high complexity, and often a larger dependence on new technology. While science missions being developed within a science theme—for example, astrophysics—typically do not have large technical interdependencies, they are often related programmatically through budget, or might be in line to use the same launch vehicle or some other infrastructure or vendor that links them in a cost or schedule sense. When cost growth or schedule slip occurs within a fixed budget profile, collateral adverse effects on missions that are adjacent to the large strategic mission may be significant.
FINDING: Cost control of large strategic missions remains vital in order to preserve overall programmatic balance.
REFORMS IN HOW NASA ESTIMATES COSTS
Public Law 109-155 was implemented in December 2005 to address cost growth in NASA missions with Section 103, “Baseline and Cost Controls” stating:
- The Administrator shall determine whether the development cost of the program is likely to exceed the estimate provided in the Baseline Report of the program by 15 percent or more, or whether a milestone is likely to be delayed by 6 months or more.
- If the determination is affirmative, the Administrator shall transmit to the Committee on Science of the House of Representatives and the Committee on Commerce, Science, and Transportation of the Senate, not later than 15 days after making the determination, a report that includes
- A description of the increase in cost or delay in schedule and a detailed explanation for the increase or delay;
- A description of actions taken or proposed to be taken in response to the cost increase or delay; and
- A description of any impacts the cost increase or schedule delay, or the actions described under subparagraph (B), will have on any other program within NASA.
In March 2006 NASA set forth policy changes to reduce cost growth in its projects. The agency implemented these changes in three steps:
- Budgeting to the 70 percent probabilistic confidence level for both cost and schedule;
- Establishing unallocated future expenses (UFE) at the NASA Headquarters level by funding the project at no less than the 50 percent confidence level; and
- Establishing an estimate range at KDP-B (after conceptual design but prior to preliminary design) to account for any potential design or schedule growth.
The initial policy was set forth by then NASA Administrator Mike Griffin in March 2006, stating: “NASA’s standard practices will be to budget projects at a 70% confidence level based on the independent cost estimate.”4 The policy was further formalized in a NASA Interim Directive to NASA Procedural Requirement (NPR) 7120.5D and then fully formalized in NPR 7120.5E in 2009 with the intent that: “All space flight and information technology programs shall develop a joint cost and schedule probabilistic analysis and be baselined or rebaselined and budgeted such that there is a 70 percent probability of achieving the stated life-cycle cost and launch schedule.”5
Despite the establishment of these cost-estimating policies in 2006, JWST had already experienced cost growth in 2005. By 2010 the program required additional funding, which was not provided. The special Independent Comprehensive Review Panel investigation6 found that the baseline funding did not reflect the most probable cost with adequate reserves in each year of project execution. The replanning exercise prompted by that report resulted in an $8.8 billion life-cycle cost, which is the current baseline.
___________________
4 Tom Coonce, Joint Cost and Schedule Probabilistic Estimating and Budgeting Policy at NASA, February 2009.
5 Ibid.
6 James Webb Space Telescope (JWST) Independent Comprehensive Review Panel (ICRP), “Final Report” October 29, 2010, https://www.nasa.gov/pdf/499224main_JWST-ICRP_Report-FINAL.pdf.

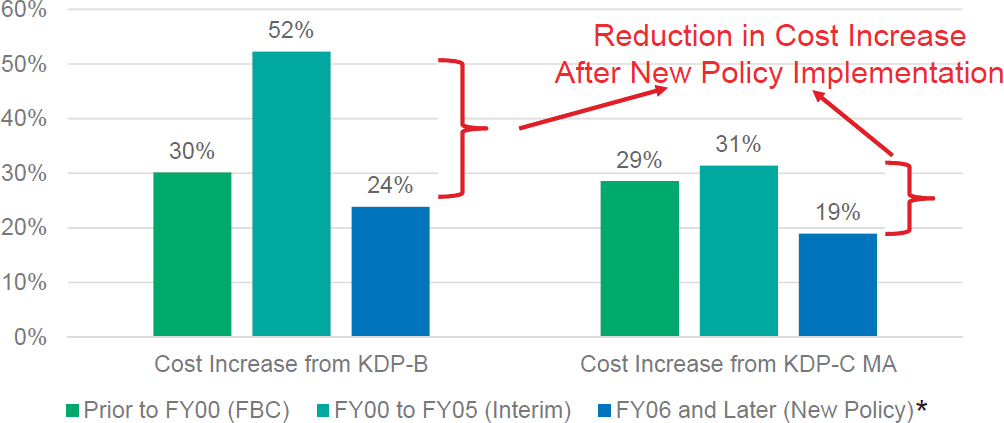
It has now been 11 years since the implementation of these reforms, and a number of new space science missions—including large strategic missions—have been started and have proceeded through KDP-C to launch and initial operations. This has enabled independent assessments of the success of NASA’s reforms. (See Figure 3.7.)
According to Aerospace Corporation’s Robert Bitten, the Aerospace Corporation looked at the cost increase from KDP-B and KDP-C for 42 missions in three distinct periods for projects having undergone a preliminary design review (see Figure 3.8):
- FY1999 or prior (also known as the Faster, Better, Cheaper era);
- From FY2000 to FY2005, after FBC but before new confidence-level policy; and
- After FY2006, when new confidence-level policy was introduced.
Bitten informed the committee that the results show that the new policy is making a difference in terms of cost increase as measured from both KDP-B and KDP-C.
The Aerospace Corporation’s conclusions have been supported by the Government Accountability Office (GAO) in its March 2016 report, “Assessments of Major Projects.”7 The GAO found that NASA is generally on track with its major space projects and had been successful at limiting cost growth. The GAO cautioned that several challenges may arise that affect the ability of NASA to manage its portfolio in the near future.8
The GAO noted that in 8 of the previous 9 years, NASA experienced at least one large-scale project with substantial budget and/or timetable growth. This form of growth usually occurred when the program reached the system assembly and integration phase. The GAO noted that there were nine projects that were reaching this
___________________
7 Available at www.gao.gov/assets/680/676179.pdf. Although the committee refers to the 2016 report, the GAO produced a report in 2017 while this committee’s report was in review. The GAO’s 2017 report is consistent with its 2016 report. NASA Assessment of Major Projects, GAO-17-303SP, Government Accountability Office, May 2017.
8 The GAO report included assessments of human spaceflight programs, which are beyond the scope of this study.
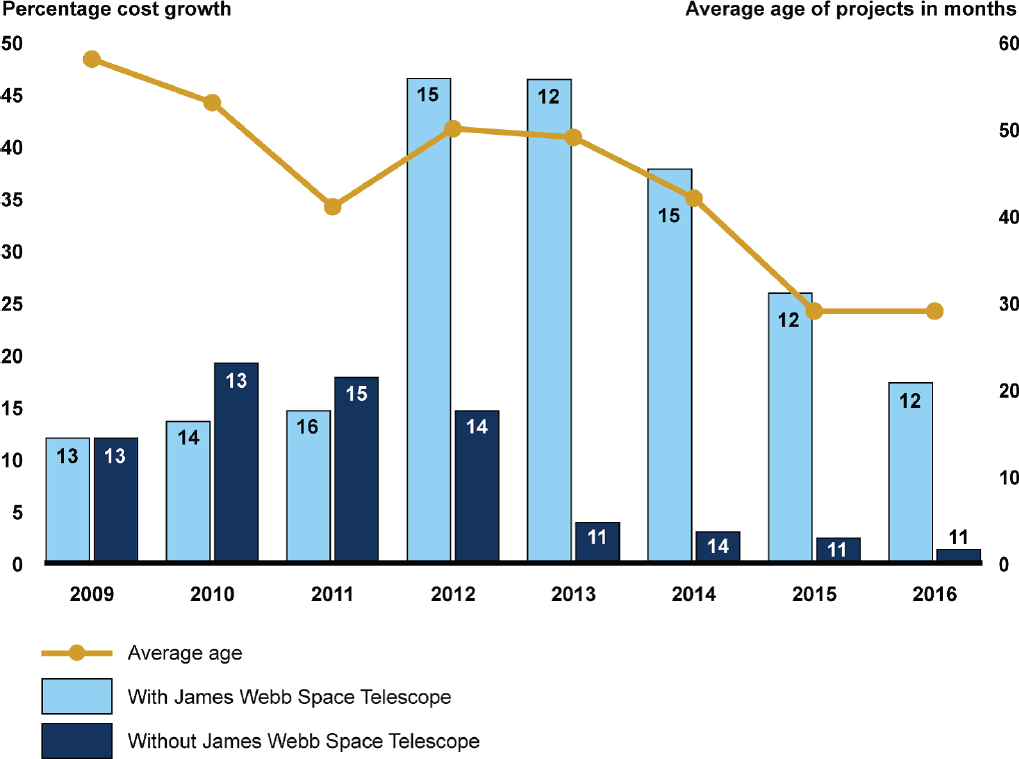
critical development phase in 2016; thus, the agency is currently in a period of higher risk for cost overruns.9 The GAO report stated that while NASA’s overall performance has improved, there is a continued requirement to remain vigilant. (See Figure 3.9.)
Technology maturity and design stability aspects of NASA’s large-scale projects were a common theme identified by GAO for 9 of the 11 major projects that passed the standards set by GAO best practices. The 2016 GAO report measured the overall costs for 12 projects in development at the time. The report found that the cost growth for development (excluding the James Webb Space Telescope)10 decreased to approximately 1.3 percent, and launch delays were typically decreased to an average of 4 months.
The GAO report also noted that a major factor in past cost growth was the introduction of new technology. The average number of critical technologies used in the NASA projects that GAO assessed decreased from 4.9 in 2009 to 2.3 in 2016, which also had an impact on reducing cost growth. The report cautioned that in the future, planned projects will more likely use more technology development.
Both Aerospace Corporation’s assessment and the 2016 GAO report are consistent and conclude that NASA has made significant strides in better estimating costs and limiting cost growth to its programs. The committee
___________________
9 Those projects are Parker Solar Probe; Ionospheric Connection; Ice, Cloud, and Land Elevation Satellite-2; Transiting Exoplanet Survey Satellite; Exploration Ground Systems; James Webb Space Telescope; Space Network Ground Segment Sustainment; Space Launch System; and Orion Multi-Purpose Crew Vehicle.
10 The JWST was not included in this report because its increase in schedule and cost was much larger than the other programs in development.
concluded that this has been an important NASA accomplishment in the past decade that has led to greater programmatic stability and allowed the divisions to better achieve their goals for balance. However, the committee also notes that there are additional methods that NASA can and has used to limit the impact of cost overruns, particularly of large strategic missions.
Over the past decade NASA has put in place a number of new approaches to cost control including establishment of independent cost estimates, periodic (up to monthly) project monitoring using earned value, major milestone cost/schedule reviews, and increased allocation of reserves, among other approaches, to estimate and control cost throughout the project life cycle. These approaches, as explained in the GAO and the Aerospace Corporation reports, appear to be working and improving cost and schedule performance. Breach reports have become unusual events.11 These approaches represent the kind of monitoring that has resulted in JWST staying on budget and schedule, and meeting milestones, since the program was restructured.
The 2005 “Baseline and Cost Controls” legislation included language similar to the Nunn-McCurdy-type controls for NASA projects. Thresholds were established for congressional notification for 15 percent cost growth
___________________
11 The Nunn-McCurdy Amendment was included in the Department of Defense Authorization Act of 1982.
over approved baseline or a 6-month launch slip beyond approved baseline. If cost growth exceeds 30 percent over the baseline, an 18-month time line starts, after which specific congressional approval is required to continue the project. The fact that a project commits to a budget at KDP-C (confirmation) allows the concept to mature, technology to be advanced, and risks to be retired before the agency commits to the Office of Management and Budget to execute the program.
The committee notes that program cost overruns are directly related to the program’s ability to accurately capture and mitigate risks, establish realism in the technical baseline, implement a method to introduce new technology and mature technology, and manage external factors that would lead to schedule and management issues. The ability to develop an accurate cost estimate does not lie solely in the hands of the cost-estimating tools, techniques, and data, but in the program’s ability to accurately reflect the program scope and risk.
FINDING: In the last decade NASA has introduced numerous cost control and cost evaluation mechanisms. These mechanisms have been effective at limiting unexpected overruns and impacts on programmatic balance.
THE DECADAL SURVEYS AND COST EVALUATIONS
Long before a large strategic mission is adopted by NASA, it is evaluated by a decadal survey committee. In advance of a decadal survey advocates for certain science goals may develop representative mission concepts designed to achieve a certain set of measurements. These concepts are typically called a “point design”: a specific instance or existence proof that can achieve the science goal.
The decadal surveys are iterative in nature: the scientific community provides inputs—often with the support of NASA in terms of specific mission concept studies—and the decadal surveys produce a recommended prioritized scientific program that NASA (and on occasion other agencies, depending on the survey) attempts to implement.
As the Europa orbiter and MAX-C examples have illustrated (see Box 3.1), by providing NASA a range of options at varying levels of science, complexity, and cost, a decadal survey can assist the agency in examining options within a balanced portfolio, make trades against budget constraints, or appropriately sequence mission priorities within the coming decade. The existence of trade-offs might allow large strategic missions to coexist with a science theme with other commitments—for example, developments already under way, R&A, or missions in the operations phase. The ability to make trade-offs or have variants of a mission concept might also inform the writing of decision rules that would provide NASA additional flexibility in the wake of a decadal survey. It is important to balance the desire for a range of science, risk, cost, performance, and schedule against practical considerations of team design capabilities, study funding limitations, or sufficient time to prepare notional missions in advance of a decadal survey.
RECOMMENDATION: NASA should ensure that robust mission studies that allow for trade-offs (including science, risk, cost, performance, and schedule) on potential large strategic missions are conducted prior to the start of a decadal survey. These trade-offs should inform, but not limit, what the decadal surveys can address.
Starting with the 2010 astrophysics decadal survey, the National Academies as required by law instituted a cost and technical evaluation process to assess risk, feasibility, and affordability of representative notional science missions. This process has been used for all subsequent decadal surveys. The CATE process has become particularly important for large strategic missions. Ideally, each decadal survey has latitude to apply or tailor a cost and risk evaluation process to its specific needs and to decide a dollar threshold above which to apply that process.
A CATE is not necessary for all mission concepts. However, the fundamental questions of whether the proposed approach to achieve a certain science goal and measurement is technically feasible and affordable within the coming decade are of paramount importance.
Cost estimation tools inherently lag behind the actual programs they assess. The reason is that NASA is often conceptualizing new approaches to increasingly ambitious science missions, many of which are first of a kind, or
taking advantage of new architectures or technologies. NASA is expected to push the state of the scientific and technological art and adopt new approaches in order to maximize science return. Cost models, whether empirical parametric tools or analogy-based approaches, are dependent on historical data for systems that have previously flown. Furthermore, new architectures such as large deployable optics, or CubeSats, sometimes extend beyond the boundaries of the existing cost databases on which the tools and estimates are based. (In the case of CubeSats, NASA may benefit from the substantial development work currently being done in industry, which also wants to produce accurate cost estimates for its large projects.) NASA currently invests in data capture and tool development and it is important that the agency continue to do so. Mechanisms to capture and normalize cost data such as the agency’s EoC studies and the Cost Analysis Data Requirement (CADRe) database are of tremendous value. Because technology and management and development procedures are always evolving, new cost models and approaches will have to be developed for new applications—cost estimation cannot be static. Innovative approaches to capture cost reduction associated with leveraging commercial or agile development approaches, or taking advantage of heritage, for example, need to be rapidly inserted into the analysis tools so that estimates are not overly conservative. As manufacturing approaches change (e.g., the industry moves to larger production runs on components, subsystems, or complete satellites), the tools and databases will need to be evolved rapidly to remain relevant.
RECOMMENDATION: NASA should continue to use its various cost estimation and cost management tools to assess and control the costs and risks of large strategic missions to ensure that they remain a viable option. As new technologies and new missions arise, new cost estimation tools will be required to enable NASA to determine their likely costs. NASA should support the development of new tools to perform robust cost estimates and risk assessment. These new cost estimation tools will also be helpful in support of the National Academies’ decadal surveys.
CONCLUSION
NASA’s Science Mission Directorate has achieved great success since 2010 at better estimating the costs of its missions and controlling cost overruns. Although cost overruns for missions garner headlines, a number of NASA missions have actually been developed below cost. In addition, many NASA spacecraft have lasted significantly longer than their design life, providing tremendous overall benefit compared to their development costs. These success stories have received relatively little attention, but they were not accidental. They resulted from significant work and oversight by agency personnel, contractors, and advisory bodies.
The risk of cost overruns for large strategic missions is much greater simply because of their size and complexity. They can threaten the rest of a division’s portfolio if they overrun by any substantial amount. For this reason, they receive substantial attention from agency leadership.


