
1
Introduction
The National Agricultural Statistics Service (NASS) is the primary statistical data collection agency within the U.S. Department of Agriculture (USDA). As noted on its website,1 the agency conducts hundreds of surveys annually and prepares reports covering virtually every aspect of U.S. agriculture. Among the small-area estimates produced by NASS are county-level estimates for crops (planted acres, harvested acres, production, and yield by commodity) and for cash rental rates for irrigated cropland, nonirrigated cropland, and permanent pastureland. Key users of these county-level estimates include USDA’s Farm Services Agency (FSA) and Risk Management Agency (RMA), which use the estimates as part of their processes for distributing farm subsidies and providing farm insurance, respectively.
In September 2014, NASS entered into a cooperative agreement with the Committee on National Statistics of the National Research Council to assess these county-level estimates and offer recommendations for their improvement. The statement of task for the study is shown in Box 1-1.
The study panel was specifically directed to consider annual county-level estimates for cash rents, crop acreage, and yields. These county-level estimates are published after NASS has published national- and state-level estimates for the year. The challenge of integrating multiple data sources to improve crop estimates needs to be accomplished in a way that brings NASS into conformance with the statistical standards promulgated by the
___________________
1 See https://www.nass.usda.gov/About_NASS/index.php [July 11, 2017].
U.S. Office of Management and Budget (OMB) (2006),2 which specify the steps to be taken to ensure that published statistical information is transparent, reproducible, and reliable.
NASS COUNTY-LEVEL ESTIMATES AND THEIR EVOLVING USES
USDA began regularly reporting estimates of final acreage, yields, and production for principal crops in 1866. Today, NASS is responsible for estimating acreage, production, and yield for most commodities grown in the United States. National- and state-level estimates are among OMB’s primary economic indicators. NASS has been publishing county-level crop and livestock inventories since 1917. Originally, these county-level estimates were prepared with federal funding, an arrangement that subsequently evolved into partnerships involving state funding via cooperative agreements. Crop surveys usually were sponsored by states, with NASS statisticians in the state offices defining the samples and processes used and developing the estimates.
NASS’s county-level estimates support the efficient functioning of agricultural markets by providing information about the supply of, demand for, and use of commodities. Participants in agricultural markets rely on such
___________________
2 See especially Standard 4.1.
information to make decisions: for producers, about what to grow and how to manage inventories; for processors and traders, about how to organize production and determine sales; and for retailers and consumers, about how to anticipate costs and assess the availability of food. When market participants share a common understanding of the fundamentals of supply and demand, market transactions accurately reflect the value of commodities to those along the supply chain and help ensure that food is grown, processed, and consumed at the lowest cost to the nation.
Complementing the data on agricultural production, NASS has long estimated rental rates for farmland at the state level. Between 1950 and 1994, state-level cash rents were estimated using a list survey of real estate appraisers. Beginning in 1994, state-level cash rents were estimated primarily by using the June Area Survey to ask farmers directly about their rental agreements. The 2008 farm bill extended the requirement for state-level rental estimates by mandating that NASS provide mean rental rates for all counties with at least 20,000 acres of cropland plus pasture.
Cash rents generally reflect the value of farmland as an input to agricultural production. These estimates are used by farm operators and land owners in negotiating rental agreements; by bankers in making farm operating and ownership loans; and by real estate agents, analysts, financial advisors, and extension services, among others. As with the crop production estimates, information on cash rents contributes to the efficiency of farmland markets by providing participants in these markets with data on supply and demand.
Over the past century, NASS has played a key role in providing information to participants in agricultural markets. At the same time, national farm policy has evolved, as has the use of agricultural statistics in administering federal programs. Since the 1930s, the federal government has provided support to the farm sector. Initially, this support entailed direct intervention in markets whereby supply was controlled through restrictions on what acreage farmers could plant, and prices were set nationally. With the rise in the importance of global trade and attendant policy liberalization, the federal government’s approach became more market oriented and less interventionist. This trend culminated in the 1996 farm bill’s direct “decoupled” payment scheme, based on past, not current, production. The 2002 farm bill reintroduced price-based “countercyclical” payments so that aid is provided when current revenues fall. This aid also is increasingly conditioned on the circumstances of each farmer, with payments being more closely related to the farmer’s own revenue experience. Thus, the need for accurate and disaggregated information on acreage, yield, and output to enable better alignment of payments with farmers’ actual outcomes is increasingly pressing.
One of the mainstays of farm support under the 2014 farm bill is Agricultural Risk Coverage (ARC)-County Option (CO), delivered by FSA.
Payments to farmers are based on the difference between a guaranteed level and an estimate of county revenue outcomes computed as the product of NASS season average price data and NASS season-end estimates of county yields. FSA also administers the Conservation Reserve Program (CRP), whereby the federal government makes a payment to a farmer in exchange for removing environmentally sensitive land from agricultural production and planting species that will improve environmental health and quality. Before 2008, FSA administered the CRP using rental rates estimated by appointed FSA boards of directors in each state. In 2009, FSA began using results from the NASS statistical survey of county average rental rates for cropland and pastureland to establish the rental rates used for the CRP. Federally subsidized crop insurance programs, such as the ARC-CO and group risk options, use NASS county yields in setting the guaranteed yield levels for policies based on outcomes in a farmer’s county (as opposed to the farmer’s personal experience).
NASS took steps to respond to these administrative requirements for information at the county level. First, the agency initiated the County Agricultural Production Survey3 (CAPS), beginning in a few states in 2011 and implemented in all eligible states in 2012. Today, CAPS provides survey data with which to estimate acreage and production for selected crops at the county level for use in state and federal programs in 44 states. CAPS replaced the nonprobability samples that previously had been selected and administered by state offices. Today, the NASS county crop estimates program is defined jointly by NASS, RMA, and FSA. States are partners in the process and may add commodities to the program to address local interests. In addition, the Cash Rents Survey was initiated in most states in 2008 to provide county-level estimates for use by FSA in administering the CRP.
In summary, in the last decade NASS has responded to the increasing uses of county-level data by introducing large-scale probability surveys to provide the required information. Despite these initiatives, however, farmers have raised questions with program agencies about the use of estimates derived from these surveys because they feel that a county average does not represent their own farm experience. As demonstrated in a presentation to the study panel by FSA, relatively small variation in a county yield estimate can result in relatively large changes in subsidy payments and possibly in a payment’s not being triggered at all.4 Substantive variability in
___________________
3 See http://www.nass.usda.gov/Surveys/Guide_to_NASS_Surveys/County_Agricultural_Production [October 2017].
4 Ideally, the conditions for triggering or determining the size of an ARC payment would be exogenous to the individual receiving the payment. Using county estimates based only on the sample risks making the payments dependent on the actions of the beneficiaries when the survey response rate is low. As a consequence, both the credibility of the estimates and the perceived fairness of the size and distribution of payments are called into question.
payment rates from one county to the next also can be driven by these yield differences. The monetary significance of a county yield estimate therefore focuses attention on how it is derived and, for an individual farmer, on how well it corresponds to that farmer’s own yield outcomes.
Another issue is difficulties that have emerged with shrinkage in the number of counties for which survey-based estimates are available, particularly in some areas of the county with high participation in federal commodity programs. When NASS county estimates are not available, FSA must resort to other, secondary sources of information that may not reflect a county’s experience with fidelity.5 For example, as noted by Johansson and colleagues (2017), “In the event that there is neither a NASS county estimate nor enough data to estimate an RMA county yield, the FSA State Committee will determine the county yield using best available data, including such possibilities as the NASS or RMA yield for a neighboring county, the NASS district yield estimate, or 70 percent of the transitional yield (or t-yield). NASS districts include multiple counties, which may make the yield determination too high for some counties and too low for others.”
NASS strives to provide yield estimates for as many counties as possible while ensuring the quality of these estimates for use by market participants and federal agencies. NASS applies a publication standard to determine those counties for which the number of survey responses is sufficient to support estimation. This standard requires that there be at least 30 valid responses6 for a crop in a county, or if there are fewer, they collectively must account for at least 25 percent of acreage by crop. If this standard is not met, a county’s estimate is not published. Unfortunately, survey response rates have been declining over time, and the result has been a decrease in the number of counties for which estimates meet the standard. For the Cash Rents Survey, for example, the response rate fell from a U.S. average of 75.9 percent in 2014 to 69.1 percent in 2016 (U.S. Department of Agriculture, National Agricultural Statistics Service, 2014, 2016). Reflecting this decline, NASS published data for 2,879 counties in 2014 and 2,597 in 2016. For the CAPS, the response rate for row crops was 62.8 percent in 2011 and 56.4 percent in 2016, while the response rate for small grains was 69.1 percent in 2011 and 63.4 percent in 2016.7 A decline in responses in a county increases the likelihood that an estimate cannot be published.
___________________
5 See http://nfu.org/wp-content/uploads/2016/03/ARC-County.pdf [July 2017].
6 NASS attempts to publish estimates for approximately 3000 counties, requiring much larger sample sizes that are much more costly than producing estimates only for the nation and state.
7 Based on a May 2016 presentation to the panel by Lindsay Drunasky, updated in April 2016 by Nathan Cruze. Drunasky’s presentation also included response-rate maps by state showing patterns of response.
FSA is required by law to make payments at the county level, regardless of the availability of NASS estimates. If NASS cannot provide the necessary data, FSA must turn to other channels. This situation can be particularly problematic in counties with significant participation in ARC-CO. The ARC-CO program provides revenue loss coverage at the county level. ARC-CO payments are issued when the actual county revenue (as estimated by the product of NASS market prices and NASS end-of-season estimates of county yield) of a covered commodity is less than the preset ARC-CO guarantee for that commodity. If NASS county-level data are not available, RMA or state committee yield is used instead. An example of this situation occurred in the Northern Plains in 2015. Response rates in 2015 for surveys on production of small grains (wheat, barley, and oats) are shown in Figure 1-1a. Counties in which fewer than half of those surveyed responded—circumstances in which NASS is least likely to publish an estimate—are concentrated in the Dakotas, Kansas, and western Minnesota. As seen in Figures 1-1b and 1-1c, these are areas in which ARC-CO payments are potentially significant (see https://www.fsa.usda.gov/Assets/USDA-FSA-Public/usdafiles/arc-plc/pdf/October-2016-updates/Wheat_ARC-County_Revenue_Maps_as_of_Oct_3_2016_optimized.pdf [December 2017). Figure 1-1b shows the range of county wheat revenue earned from the market in the absence of any federal payments; this map shows that the Upper Plains states had numerous counties in which that revenue fell at or below historical averages. Figure 1-1c indicates the significance of ARC-CO payments when they are added to market revenue, showing that revenue in many of those Upper Plains counties subsequently topped historical averages. The Congressional Research Service has noted “wide discrepancies” in the yield estimates8 for adjacent counties, some with and some without NASS estimates, which presumably only exacerbated producers’ concerns about the credibility of the estimates used to calculate ARC-CO payments (Congressional Research Service, 2017).
NASS has again responded by working to improve survey response rates. These efforts have included evaluating farms on the list frame to ensure that they are still operating as recorded, publishing articles and pamphlets describing the importance to farmers of participating in NASS surveys (Schleusener, 2016), and considering ways to make it easier for farmers to respond. Nonetheless, almost all federal statistical agencies are seeing a drop in survey response rates, so NASS faces a systemic problem not unique to agriculture. (See, e.g., National Academies of Sciences, Engineering, and Medicine [2017] for a full discussion of threats to the survey paradigm and National Research Council [2013] for a discussion of declining rates of response to social science surveys.)
___________________
8 Wide discrepancies in yield estimates may trigger legitimate discrepancies in ARC payments. The equations used are very sensitive.
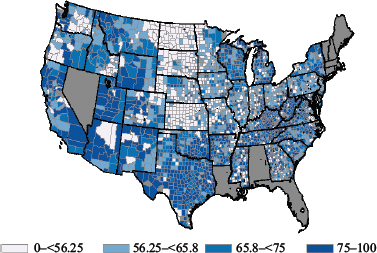
SOURCE: Presentation by Lindsay Drunasky, National Agricultural Statistics Service, to the Panel on Methods for Integrating Multiple Data Sources to Improve Crop Estimates, May 13, 2016, Washington, DC.
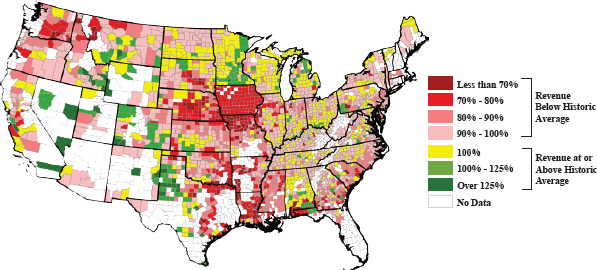
SOURCE: Understanding Agricultural Risk Coverage/Price Loss Coverage, Farm Service Agency, U.S. Department of Agriculture.
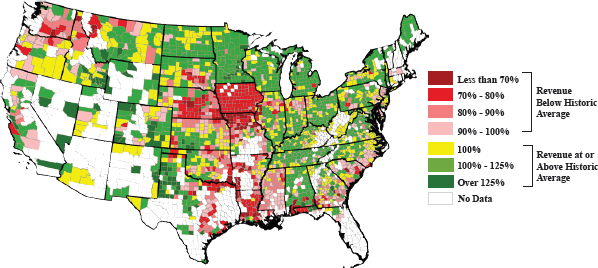
SOURCE: Understanding Agricultural Risk Coverage/Price Loss Coverage, Farm Service Agency, U.S. Department of Agriculture.
At the same time, it is important to note that survey results by themselves may not determine the official NASS county estimates for acreage, yield, or rental rates. The Agricultural Statistics Board (ASB), part of NASS, reviews all state-, district-, and county-level recommendations made by state and federal staff. ASB establishes official estimates based on a collaborative process involving NASS field offices that collect and process the data and headquarters statisticians who provide oversight and coordination. The federal statisticians consider direct survey results and their associated quality measures, as well as a range of additional information, including data from previous surveys and censuses, and, when appropriate, administrative data collected from farmers by FSA and RMA, remote sensing data on crop production, and estimates from statistical models. For the cash rents estimates, separate “indications”9 are drawn from the Cash Rents Survey, past surveys and censuses, and a model that combines 2 years of data from the Cash Rents Survey with information on relevant crop condition and agronomic factors. Regional field office statisticians derive estimates using this information and then provide justification to the Board should their recommendations differ from the survey indications. The panel learned that in 2014, 34,452 county-level estimates were made, with 939 (8.2%) ASB changes to indications from the Cash Rents Survey. Yet despite recruiting other information to augment the county survey results, NASS still may not judge derived estimates sufficiently valid to be published, which prevents their use in determining farm payments.
The decline in the number of counties for which NASS can publish statistically valid direct survey estimates has created challenges for its key customers, FSA and RMA. As noted earlier, these agencies rely on NASS estimates to the extent possible, but if NASS estimates are not available, they rely on other data. These include the NASS survey estimates for the Agricultural Statistics District (a group of counties including the one in question), production data or yield estimates from RMA, and subjective assessments of local FSA officials.
Given these circumstances, NASS, as it has in the past, is considering how to respond to the needs of program agencies for more comprehensive and reliable estimates of county yields and cash rents. While attempting to raise survey response rates, NASS also looks to other sources of information that may better inform official estimates developed through the ASB process. As evidenced by the nature of the indications already being considered by ASB, survey data can be augmented in a number of ways. Expanding the use and sophistication of statistical models is one obvious way to bolster
___________________
9 “Indication” is the NASS term for a preliminary calculation or judgment about the value of a variable. The output of the Board process that considers all indications is published and is termed the official NASS “estimate.”
the ability to publish county estimates and to do so in a systematic and transparent way. Models can potentially make use of information on crop output obtained from such sources as satellite data; field-level observations gathered by farm machinery; administrative data on farm operations reported to USDA program agencies; and other auxiliary information, such as weather and soil quality.
NASS also is facing a changing context for the development of crop estimates. Satellites and advanced farm machinery, respectively, are emerging as aerial and ground-based sources of information on agronomic conditions. Not only can such data be used by NASS in its estimation process, but they increasingly are being used by private-sector entities to derive their own estimates for commercial sale. Satellites and drones can generate readings on plant health, local weather, and crop conditions on a daily basis, all of which can be combined to provide real-time estimates of crop progress. Likewise, increases in the sophistication and capabilities of farm machinery have made it possible to gather field-level data on input application and crop output, which are examples of measurements used in precision agriculture, a crop management approach utilizing data from GPS systems and sensors on such equipment as tractors and combine harvesters. Both remotely sensed and ground observations can enhance analysts’ ability to monitor, predict, and measure crop conditions and outputs. There are challenges to effective use of such data, however, including how to combine these data to produce accurate crop estimates. In the case of precision agriculture measurements, access to the information may be hindered by questions of ownership: the farmer, or the firm that sells and services the machinery, or the company that analyzes the precision agriculture data as a service. Ultimately, the credibility of NASS in developing crop estimates for public use may depend on its ability to acquire and interpret these data as private-sector competition grows. Accordingly, this report considers how administrative, remotely sensed, and ground-gathered data might be integrated into NASS models to yield more accurate and timely estimates.
STUDY APPROACH
In the course of this study, the panel held four in-person meetings that included public sessions to collect information and one closed meeting to finalize this report. The panel also held many teleconferences. In addition, the panel requested and received numerous briefings from NASS on a wide range of topics, including the CAPS and the Cash Rents Survey; sample design and data collection; issues related to nonresponse and its impact; the publication standard and how it is used; the availability of auxiliary information, particularly remote sensing and FSA/RMA administrative data; the
Board process for deriving final county estimates; and NASS research into the development of small-area estimates to combine data sources.
The panel heard as well from representatives of FSA and RMA who described how they use NASS data in their programs, along with the Acreage and Crop Reporting Streamlining Initiative, which is improving the quality and availability of RMA and FSA data. Representatives of other agencies within USDA described their research on the use of new satellite data to predict crop yields and the development of spatial data on land characteristics and linkages to farm data from FSA. The panel also learned about a previous study of publication standards used by other statistical agencies and entities to publish direct survey data. The panel heard from the U.S. Census Bureau and the Bureau of Labor Statistics of the U.S. Department of Labor, statistical agencies that use small-area estimation methods as part of their publication programs. Another presentation described Statistics Canada’s adoption of a model-based approach using remote sensing data to replace a midseason survey estimate. Finally, the panel heard from yield modelers who are experts in midseason forecasts of yield.
The panel believes that with this report, it has satisfied its statement of task (Box 1-1) to the extent possible. Terms in the statement of task include “will explore more methods” and a list of “issues to consider.” While the panel could not pursue model development for each specific NASS estimate, general guidelines are offered in Appendix C. The panel has also advised NASS staff to continue their current cash rents and crop estimates modeling efforts as described in Chapter 5, Projects 2 and 3. The methods being employed in those efforts can be expanded to incorporate spatial terms. Once Common Land Units (CLUs) have been linked to NASS farms, unit-level models (or either farms or CLUs) can be pursued, as discussed in Appendix C.
ORGANIZATION OF THE REPORT
The panel presents its recommendations for improvement in terms of a vision for NASS in 2025 that is described in Chapter 2. This vision is motivated by the imperatives for a modern statistical agency to be responsive to its data users, to adopt the most robust technologies for data management, and to utilize nontraditional data sources and statistical methods.
Chapter 3 describes the multiple data sources that are available to enhance NASS’s county-level estimates of planted acres, harvested acres, production, and yield by commodity; describes how these sources are currently used; and suggests improvements for the future. Included among these multiple data sources are administrative data from FSA and RMA, satellite and other remote sensing data, and data from precision agriculture measurements.
Chapter 4 reviews the data sources that might inform the estimation of cash rents. It also describes a model that is currently used as input to the ASB process and explores how this model might be carefully assessed to determine how ASB could use it in a transparent and reproducible manner.
Finally, Chapter 5 suggests how NASS could implement the vision set forth in Chapter 2 by describing specific projects that would move the agency forward. These projects are linked to the panel’s recommendations, and are intended to involve different skills and different stages of implementation.
The report also includes four appendixes. Appendix A describes the survey methodology of the Cash Rents Survey and the CAPS. Appendix B details steps NASS might follow should it choose to adopt the Routine External Evaluation Protocol as part of an external evaluation, as suggested by Dorfman (2018). Appendix C explains small-area time and spatial modeling approaches for multiple sources of data. Finally, Appendix D provides biographical sketches of the panel members and staff.


