
2
A Vision of NASS in 2025
This chapter presents the panel’s vision for the National Agricultural Statistics Service (NASS) in 2025. This vision has three components. First, NASS prepares its county estimates using a transparent and well-documented process, publishing measures of uncertainty along with point estimates. Second, the NASS list frame is a georeferenced farm-level database, serving as a sampling frame for surveys and facilitating the use of farm data in statistical analysis. Third, NASS acquires all relevant georeferenced administrative and remotely sensed and ground-gathered information and uses this information to complement its traditional survey data.
THE VISION
The panel’s vision for NASS in 2025 is motivated by the imperatives for a modern statistical agency to be responsive to its data users, to adopt the most robust technologies for data management, and to utilize nontraditional data sources and statistical methods. As discussed in Chapter 1, the end uses of NASS data have expanded beyond informing market decisions to determining federal payments. The advent of geographic information systems (GIS) technology for data collection, management, and analysis has particular relevance for the location-specific circumstances of agriculture. And the emergence of remote sensing and precision agriculture measurements as means of acquiring timely georeferenced meteorological and agronomic data offers the opportunity to augment survey and administrative data and to enhance statistical modeling. Moving to make the vision presented in this chapter a reality will pose many challenges for NASS.
Nonetheless, the adoption of new ways of doing business is necessary to maintain the agency’s credibility and to promote efficiency in its operation. The following subsections describe in turn each of the three components of the panel’s vision for NASS in 2025.
Vision of a Transparent, Well-Documented Process
Achieving the first component of the panel’s vision will put NASS in compliance with the Standards and Guidelines for Statistical Surveys promulgated by the U.S. Office of Management and Budget (OMB) (2006). OMB Standard 4.1, Developing Estimates and Projections, lays out the steps to be taken to ensure that published statistical information, whether from surveys or from models that use survey data, is transparent, reproducible, and reliable:
Standard 4-1: Agencies must use accepted theory and methods when deriving direct survey-based estimates, as well as model-based estimates and projections that use survey data. Error estimates must be calculated and disseminated to support assessment of the appropriateness of the uses of the estimates or projections. Agencies must plan and implement evaluations to assess the quality of the estimates and projections (U.S. Office of Management and Budget, 2006).
In this report, the terms “measures of uncertainty” and “uncertainty measures” are used to describe error estimates that support assessment of the appropriateness of potential uses of the estimates. (For a discussion of uncertainty and models, see National Research Council, 1991a, pp. 89–96). Box 2-1 provides the OMB guidelines related to Standard 4.1.
For its direct survey-based indications, NASS uses accepted theory and methods, and sampling error is estimated. However, NASS’s published estimates are not necessarily those derived from its surveys. Instead, as summarized in Chapter 1 and described in more detail later in this chapter, NASS uses the Agricultural Statistics Board (ASB) process or expert judgment to determine the official estimate given a variety of auxiliary indications. The board process is neither transparent nor reproducible. The panel believes that to follow the OMB standards, NASS needs to develop statistical models to replace the subjective board process. In addition to developing and testing models, NASS would have to lay out the plan for ongoing routine evaluation procedures, develop and publish measures of uncertainty for county estimates, revise its publication standards to incorporate sound criteria and rules for publication of estimates, change the role of the ASB to rely on appropriate model-based estimates for transparency, provide documentation on its website of the survey and model methodologies that
lead to county estimates, and plan and implement evaluations to assess those methodologies. The panel is confident that acceptable models for crop estimates and for cash rents can be developed. Especially for crop estimates, the auxiliary information available to NASS provides strong predictors.
Vision of a Georeferenced Farm-Level Database
Development of a georeferenced farm-level list frame, the second component of the vision, would be done most expeditiously by adopting the geospatial convention already in use by the Farm Services Agency (FSA) and Risk Management Agency (RMA) (both important sources of administrative farm data). FSA defines the Common Land Unit (CLU) as an individual, contiguous farming parcel, which is the smallest unit of land that has a permanent, contiguous boundary; common land cover and land management; and a common owner and/or common producer association.1 FSA digitizes CLUs into geographic information system shapefiles or geodatabases and populates the associated farm data. NASS would identify the CLUs that make up each NASS farm,2 requiring changes to the list frame to accommodate the georeferenced CLUs. NASS would have to determine how to collect or identify CLU (or equivalent) information for farms that are not on FSA or RMA lists.
Vision of Using Data from Other Sources to Complement Survey Data
Achieving the third component of the vision will require progress on the second component and a nimble approach to surveys. Having georeferenced CLUs as the basic unit for the list frame will allow linkage to FSA and RMA administrative records, as well as to GIS data generated by remote sensing and precision agriculture measurements. To the extent that NASS can acquire information already provided by farmers to the U.S. Department of Agriculture (USDA), the respondent burden of surveys will potentially be reduced. Moreover, crop acreage data might be available earlier than current surveys permit, although the question of timing is complicated by agencies’ differing schedule requirements. Still, greater reliance on administrative data could allow redirection of scarce survey resources to farms not in FSA or RMA records or to areas where survey response is low. Although the administrative data are subsets of the universe, they can be used in statistically valid ways as described at the end of this chapter.
___________________
1 See the 2017 Common Land Unit information sheet at https://www.fsa.usda.gov/Assets/USDA-FSA-Public/usdafiles/APFO/support-documents/pdfs/clu_infosheet_2017_Final.pdf [June 2017].
2 Note that the CLUs that make up an NASS farm can change from year to year with leasing arrangements.
As for observations from remote sensing and precision agriculture measurements, they can be used as additional information in statistical models along with survey data and support unit-level modeling. Indeed, the ASB process already considers such sources.
Summary of the Vision
A commitment to achieving the vision outlined above will require changes in the way NASS manages and structures its operations. Figure 2-1 illustrates the panel’s concept of the ultimate configuration of the NASS process for developing county-level estimates. As discussed, multiple data sources, along with the accompanying measures of uncertainty, will be integrated through formal statistical models that will provide the basis for ASB’s decisions. ASB will exercise its judgment in deciding when model estimates can be improved by consideration of unforeseen events (e.g., a drought or a hurricane) or of systemic changes (e.g., rapid farm consolidation) that are not well captured in the models. ASB will determine whether a county estimate should not be published. As a means of providing quality control, ASB will drive a feedback loop with analysts that suggests modifications to improve model performance and interpretation. Documentation of these models and records of ASB decisions will be available to the public so that increased transparency bolsters confidence in the robust nature of the estimation process. A fuller discussion of the steps needed to achieve this vision follows. The section below describes how the current NASS environment affects the vision components, while the following section describes key factors in implementing the use of models needed for the vision. Two succeeding sections describe how to make the case for a change to more transparent use of models and the issue of selecting basic spatial units for a geospatially referenced database. The final section describes NASS surveys in the future.
CURRENT NASS ENVIRONMENT
Traditionally, government statistical agencies avoided the use of models and favored survey-based estimators having sound statistical properties with respect to the sample design theory. The most prominent virtue of the purely sample-based approach is the perceived objectivity of resulting estimates, stemming mainly from the avoidance of making further assumptions that require validation, as well as from the relative simplicity and tractability of the formulas used to develop estimates.3 Since important
___________________
3 See, for example, Kalton (2002).
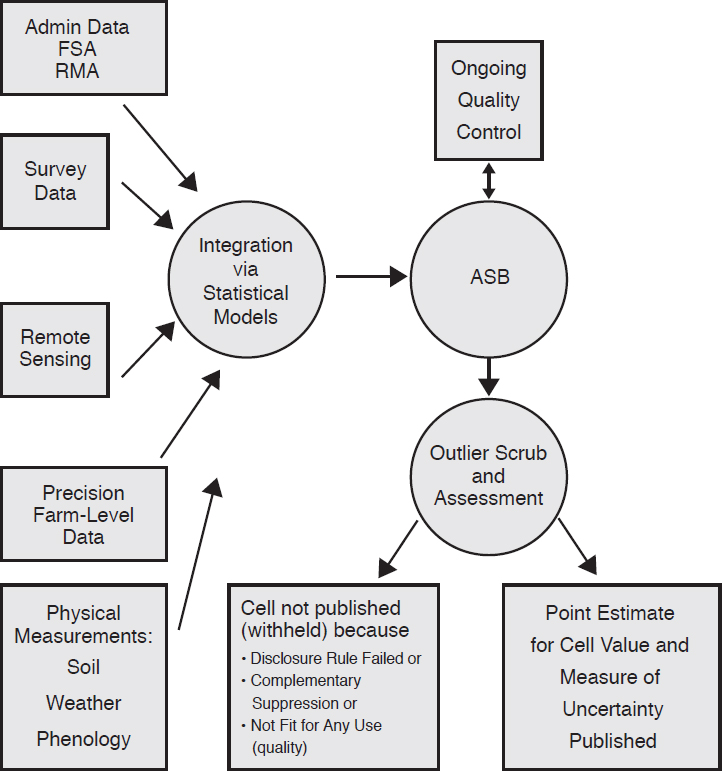
NOTES: ASB = Agricultural Statistics Board; FSA = Farm Services Agency; RMA = Risk Management Agency.
government policy decisions often rely on these numbers, the impartiality of the estimation process is of particular significance for statistical agencies.
In recent years, however, as a result of growing demand for estimates at finer levels of detail, together with challenges with meeting the budget constraints of complex surveys on the one hand and advances in both theoretical and practical aspects of the discipline of small-area estimation (SAE) on the other, statistical agencies have gradually become more open to the use of models as a transparent and sensible way to achieve fusion
of survey-based information with other data sources in pursuit of greater precision in estimation.
It is now generally accepted that, while the pure direct sample-based approach is appropriate for large samples, incorporating additional information with the help of statistical models is essential in smaller domains where samples are scarce. For a number of years, models have been employed in such important programs as Small Area Income and Poverty Estimates (SAIPE) (discussed further below) and Small Area Health Insurance Estimates (SAHIE) of the U.S. Census Bureau and for small domains in the Current Employment Statistics (CES) Survey conducted by the Bureau of Labor Statistics (BLS), as well as surveys conducted by Statistics Canada and others.
Like other statistical agencies, NASS has preferred to rely on traditional sample survey–based approaches, and many within NASS are concerned with the challenges associated with validating complex assumptions. At the same time, especially for the crop estimates program, NASS has been fortunate to have a variety of high-quality alternative data sources available in addition to survey data. The NASS approach to using these sources of information has been to charge ASB (described below) to consider all preliminary “indications” in some detail according to a set of rules and to make a judgment as to the most accurate “estimate.” This process may result in estimates that are perceived to be accurate, but it is neither transparent nor reproducible.
The process of integrating multiple data sources according to a set of rules (however accomplished) is already a departure from the purely survey-based approach as it is based on a set of implicit assumptions pieced together in a deliberative process such as that used by ASB (see Box 2-2). The challenge with a “deliberative model” is that it is neither transparent nor reproducible.
After giving a basic definition of a model in Box 2-2, this section describes the current ASB process for estimation, as well as four formal statistical models developed by NASS, three of which are already used to provide input to the ASB process.
The Agricultural Statistics Board Process
For national- and state-level estimates, ASB meets in a carefully controlled “lock-up” to review all available indications (survey, administrative, and/or model-based) and information and prepare estimates for dissemination. A similar ASB process, but not conducted in a lock-up, is used to set county-level estimates. Regional field office (RFO) statisticians collect survey data, perform editing, and conduct further analysis of the data. Estimates are established using survey indications as well as alternative sources of information.
NASS requires consistency of its published estimates at all geographic levels: national, principal region, state, Agricultural Statistics District (ASD) (a group of neighboring counties within the same state, denoted ASD), and finally county. National, principal region, and state estimates for acreage and production are based on surveys from the NASS list frame as well as data from the June Area Survey (an area sample intended to account for undercoverage of the list frame). Estimates for crop acreage and production generally are set first by ASB for the total produced for the region containing the principal states in which a commodity is grown. State totals in that region must add to that regional total and are set second. Then the national estimate is derived from the principal region total and the total for the remaining states producing the commodity. While no national estimate of cash rental rates is published, data obtained from the June Area Survey are used to publish state-level estimates.
For both estimation programs, NASS employs a “top-down” approach when establishing its substate estimates, meaning that national and state estimates generally are published before ASD and county estimates, even while additional data collection may be ongoing. To incorporate survey and auxiliary information into its crop estimates, NASS computes composites of available inputs for its acreage and production totals. The ASD-level composites are ratio adjusted to the published state total, and then rounding rules are enforced in producing the official ASD statistics. Subsequently, the county composite estimates are ratio benchmarked to the rounded ASD
totals; rounding rules are then enforced again at the county level to produce official county estimates. At each level, official NASS yield estimates are obtained as the ratio of the final production estimate to the final harvested area estimate.
In a similar manner, benchmarking is performed on total rented acres and total rent expenditures in support of estimates of cash rental rates. Upon review of all information, ASD totals are adjusted to state totals, and county totals are in turn adjusted to ASD totals, subject to NASS rounding rules. Note that, while this important consistency check is performed, NASS does not publish the separate acres rented or total rent estimates, only the cash rental rates.
For crops, alternative data sources include administrative data on planted acreage by crop from FSA and failed acreage by crop from RMA, and remote sensing estimates for acreage and yield for some commodities. NASS estimation software creates a weighted average indication from the benchmarked survey, administrative, and remote sensing indications using recommended weights provided by ASB. RFO staff use these composite indications as a starting point from which to set estimates for acreage, yield, and production for each commodity. For cash rents, the direct survey estimate is considered most important, and the only alternative indication available is a model-based result. Estimates established by RFO staff are submitted for review to ASB, with headquarters and RFO staff working from their respective duty stations. The RFO provides justification to ASB in cases in which recommended estimates deviate from survey results. ASB members review the estimates for accuracy and consistency across state boundaries, verify that proper procedures were followed throughout the process, and establish official estimates.
A report of the National Research Council (2008, p. 123) states that the ASB “process is intended to maximize the use of what is believed to be the best information and to ensure consistency with other estimates that are published by USDA.” That report offers the following recommendation: “Recommendation 6.9: NASS and ERS [USDA’s Economic Research Service] should provide more clarification and transparency of the estimation process” (p. 126). Adrian (2012) comments on the ASB process and its subjectivity in preparing in-season yield forecasts. He also suggests the use of statistical models as a way for NASS to achieve transparency and reproducibility.
Especially for crops, ASB is charged with assessing indications from multiple diverse data sources and producing coherent estimates for multiple geographic areas. ASB was established in 1905,4 long before automated
___________________
4 For a history of ASB, see U.S. Department of Agriculture-National Agricultural Statistics Service (2007).
methods of combining multiple data sources were available. The panel believes that the current ASB process for crop estimates relies on expert judgment and is neither reproducible nor transparent, and that NASS needs to pursue the development of methods based on formal statistical models that produce measurably accurate county-level estimates. Once such formal procedures were available, vetted, and accepted, the ASB function would be to carefully assess results for reasonableness. It is a widely accepted notion that estimates need to be reviewed before they are released to the public. The final review of well-defined estimates is commonly performed by analysts in other statistical agencies.5 The process for reviewing estimates needs to follow clear guidelines and result in a limited number of well-documented adjustments to otherwise automatically produced estimates, thus ensuring the transparency of the process.
RECOMMENDATION 2-1: The National Agriculture Statistics Service should evolve the Agricultural Statistics Board role from one of integrating multiple data sources to one of reviewing model-based predictions; macro-editing; and ensuring that models are continually reviewed, assessed, and validated.
Note that this recommendation maintains a role that involves judgment by ASB. Maintenance of this role acknowledges, as observed by Bunn and Wright (1991, p. 508) in their literature review, that in practice, expert ex post adjustment of model-based forecasts may be more accurate than automatic adoption of a model-based estimate. Typically, the expert judgment is better when the model contains specification error or structural change makes the current situation different from the past. Bunn and Wright (1991, p. 508) also observe, however, that the expert judgment approach is “hard to justify to others and may undermine the credibility of the whole process.” Hence this review process itself should be as transparent as possible, with changes made only for well-defined and documented reasons. The NASS Estimation Manual describes data sources and comparisons on which the NASS statisticians and analysts rely in reviewing the estimates. Making this manual publicly available might be a good start toward improving the transparency of the ASB review process.
___________________
5 For example, in BLS’s CES, analysts review sample-based estimates to see whether there are any outliers. If extreme estimates are found, analysts discuss the estimates as a team that includes analysts from the national office and from the states, and make decisions based on these discussions. Discussions are usually carried out via email within a very short time frame. As a first step in their review, analysts look at micro records to see whether an outlying estimate is due to a single or a few atypical observations or is supported by a larger sample. If adjustments are made to the estimates, the size of and reasons for those adjustments are documented.
Development of Models by NASS
NASS has been active in the pursuit of useful models for many years. Those NASS models that are particularly relevant to the preparation of county estimates are described below. The panel’s vision of NASS in 2025, particularly the use of models to synthesize multiple data sources to achieve transparency and reproducibility, is consistent with the views of many researchers within NASS, as is evident from comments in papers by NASS staff (see, for example, Adrian, 2012; Busselberg, 2011; and Cruze, 2015a, 2015b).
The four modeling approaches described below either provide indications for the current ASB process or have the potential to provide such input. These approaches can be considered as the basis for the development of improved methods.
The first approach is based on the composite indication, a linear combination of basic indications prepared from (1) direct survey estimates, (2) administrative data, (3) remote sensing data, and (4) estimates made for the past year. The panel was told that each of the basic indications is first ratio benchmarked so the sum over counties is equal to the previously published state total. Iwig (1996) describes the precursor to the current approach. In the early 1990s, the weights were determined individually and subjectively by state offices. NASS described the current approach to the panel at its November 2015 meeting. The currently used weights6 (see Table 2-1) are set by ASB and are considered to be relatively stable over time. They are changed when needed. For example, if remote sensing estimates were improved, the weight on that indicator would be increased. ASB uses the composite indication as a starting point in developing official NASS estimates.
In Table 2-1 the columns reflect variables that are inputs to the composite estimator. Column (1) contains the direct survey estimate for the indication shown in each row. Column (3) is the FSA estimate for planted acres; column (5) is the remote sensing estimate (planted acres and production); and column (6) contains the estimate published the previous year. Column (2) is a variable calculated as the product of a direct survey estimate for a ratio (harvested acres over planted acres or production over harvested acres) and the composite estimator for planted acres or harvested acres (as appropriate) from a row above. Column (4) is the product of the direct survey estimate for the ratio of harvested acres to planted acres and the composite estimator for planted acres from a row above.
The rows reflect the indications that will be determined during the ASB process: planted acres, harvested acres, and production. They are
___________________
6 Note that weights for each composite indication sum to 1 over data sources.
TABLE 2-1 Weights Used to Compute the Composite Indication
| Indication/Data Source | (1) Direct Survey | (2) Planted Indication Times Direct Survey Ratio | (3) FSA | (4) Planted Indication Minus RMA Failed | (5) Remote Sensing | (6) Past Data |
|---|---|---|---|---|---|---|
| Planted Acres (remote sensing available) | 0.15 | 0.65 | 0.20 | |||
| Planted Acres (remote sensing not available) | 0.20 | 0.80 | ||||
| Harvested acres | 0.14 | 0.70 | 0.08 | 0.08 | ||
| Production (remote sensing available) | 0.12 | 0.78 | 0.05 | 0.05 | ||
| Production (remote sensing not available) | 0.15 | 0.80 | 0.05 |
NOTES: FSA = Farm Services Agency; RMA = Risk Management Agency.
SOURCE: Data from presentation by Lance Honig, National Agricultural Statistics Service, to the Panel on Methods for Integrating Multiple Data Sources to Improve Crop Estimates, November 13, 2015, Washington, DC.
computed sequentially. The indication for planted acres is computed as a linear combination of the direct survey indication, the FSA indication, and the remote sensing indication (if one exists for that crop and county). The indication for harvested acres is computed as a linear combination of the direct survey estimate, the product of the just-established indication for planted acres and the direct survey indication for the ratio of harvested to planted acres, and the difference between the direct indication for planted acres and the RMA failed acres. The indication for production is computed as the linear combination of the direct survey indication for production; the product of the direct survey indication for yield and the just-established indication for harvested acres; and the remote sensing estimate, if one exists. If the remote sensing estimate does not exist, the past year’s production estimate for the county is used in the composite.
The weights shown in Table 2-1 provide an indirect NASS assessment of the quality of various input data sources. FSA data have the highest weight in calculation of planted acres. Column (2) variables—computed as the product of a direct survey indication for a ratio and an acreage value from a previous step—have the highest weight in computing harvested acres and production, respectively. Remote sensing indications (when available)
receive little weight for production but higher weight than the direct survey estimate for planted acres.
The composite estimate could be viewed and used as a model-based estimate if weights were derived statistically. For example, under the assumptions that the components are unbiased and mutually independent, the minimum variance of the composite estimator is achieved by using the weights that are inversely proportional to the variances of respective component indications. A similar approach is currently used for domain estimation in the CES (Gershunskaya, 2012). The above assumptions concerning lack of bias and independence, as well as the form of the target estimator, may be overly restrictive. More flexible classes of models exist (e.g., the classical Fay-Herriot model [Fay and Herriot, 1979] or adaptations) that can be used to effectively “mimic” the current ASB estimation process.
The second approach is based on the NASS Cropland Data Layer (CDL) (a remote sensing product), which provides pixels classified by land use (including a range of crops) as the basis for independent county-level indications of planted acreage by crop and yield for corn and soybeans in the Midwest cornbelt. Schaible (1996, Ch. 6) describes the remote sensing estimates of acreage that have been produced since the early 1990s. The key changes are that today’s Landsat satellites have smaller pixel sizes, and NASS uses the FSA CLU data as the training dataset for classifying pixels; in 1993 the June Area Survey data were used for that purpose. NASS makes use of the Battese and Fuller (1981) model, along with classified pixels from the CDL and segment mapping data from the June Area Survey, to produce remote sensing indications of planted acres by crop.
According to Johnson (2014) a data mining software product, Rulequest’s Cubist,7 is used to develop a predictive model for yield. Model inputs include weekly measurements of the Normalized Difference Vegetation Index (NDVI) during the growing season, temperature data from satellites over the past 6 years, and 6 years of past data on yield to establish a model for county yield. The current-year NDVI and temperature data are used as model inputs to predict current-year yield. (See Chapter 3 for additional detail on NASS’s approaches for preparing indications for planted acres and yield using satellite remote sensing variables.)
As described above, these estimates are input to ASB’s composite indication for some crops and some counties. The low weight given to remote sensing indications for yield shown in Table 2-1 implies that ASB does not regard them as particularly accurate in general, although they may be of value for some crops in some regions.
___________________
7 Described by the company’s website as a machine learning tool that automatically determines the best-fitting piecewise linear model to predict a continuous outcome variable. See https://www.rulequest.com/cubist-info.html [August 2017].
The third approach is based on the Berg, Cecere, and Ghosh (2014) model for cash rents. NASS implemented this model and used the results, along with direct survey estimates (the primary indication), as an indication for cash rents in the ASB process during 2013, 2014, 2016, and 2017. The model was derived on the basis of conducting the Cash Rents Survey annually. Revised language in the 2014 farm bill, however, specified that the Cash Rents Survey would be conducted “[no] less frequently than once every other year.” The survey was not conducted in 2015, and the 2016 production run of the cash rents model used 2016 and 2014 survey data. The Cash Rents Survey was conducted in 2017.
The cash rents model of Berg, Cecere, and Ghosh (2014) uses two univariate (Fay and Herriot, 1979) area-level models—one for the average of the cash rents in 2 survey years and the other for the difference. The authors used least squares to estimate the model parameters. The model accounts for the correlation between cash rents in the two survey years and the assumed equality of variances in these 2 years. The authors constructed a single index to capture the impact of several sources of auxiliary information, including (1) the county-level total dollar value of agricultural production from the 2007 Census of Agriculture; (2) county yields published by NASS for 2004–2009 to reflect the quality of the land in the county (separately for irrigated and nonirrigated cropland, where possible, and a separate hay yield index); and (3) three Natural Commodity Crop Productivity Indices (NCCPIs) as developed by the National Resources Conservation Service (NCCPI-corn, NCCPI-wheat, and NCCPI-cotton). The authors also used a two-stage process to benchmark the ASD estimates to the corresponding aggregated state estimates and the county-level estimates to the corresponding benchmarked ASD estimates.
After converting the cash rents model to make use of the surveys conducted in 2014 and 2016, NASS provided the results to ASB as an indication in 2016. Potential enhancements and an evaluation of the adaptation of the model to account for data collected every 2 years are described in Chapter 4. One challenge is that the panel does not know how the model results are actually used by ASB.
The fourth approach is based on NASS approaches to end-of-season model-based crop estimation, summarized by Erciulescu, Cruze, and Nandram at the panel’s January 2017 meeting. Previous efforts by the same authors include Cruze et al. (2016) and Erciulescu et al. (2016). In their January 2017 summary to the panel, they noted two types of models: unit-level models (Battese and Fuller, 1981; Battese et al., 1988); and area (e.g., county-level) models, such as those addressed by Fay and Herriot (1979), and subarea-level models, discussed by Fuller and Goyeneche (1998) and Torabi and Rao (2014). Unit-level models have not yet been actively pursued by NASS. Linkage of the CLU information to the NASS list frame
should make the development of unit-level models more feasible. NASS’s current efforts have made use of subarea models (for counties) so that benchmarking (to ASDs) can be incorporated into the modeling process.
Erciulescu, Cruze, and Nandram have explored estimation of planted acres, harvested acres, and yield in four states (Iowa, Illinois, Indiana, and Kansas). The parameters of interest in these models are the unknown true planted acres, harvested acres, and yield, written as a linear combination of auxiliary variables, including FSA planted acres and a National Oceanic and Atmospheric Administration (NOAA) weather variable, as well as random effects. Production is defined as the product of harvested acres and yield. The direct survey estimate divided by the sample size, conditional on unknown parameters, is assumed to follow a normal distribution, with mean equal to the parameter of interest (the regression equation) and variance related to the sample design. Appropriate assumptions also are made about the conditional distributions of parameters, including variances.
Erciulescu, Cruze, and Nandram used a Bayesian model fit using Markov chain Monte Carlo (MCMC) methods and compared the model results with survey estimates, estimates prepared by ASB, and either FSA planted acres or remote sensing estimates where applicable. Ratio benchmarking was applied to posterior iterations. Point estimates and estimated variances were based on ratio-adjusted posterior iterations.
The authors state that the model-based point estimates agree quite well with the ASB estimates, and benchmarking constraints are satisfied. They state further that the estimated variances/covariances are smaller than those of the direct survey indications. The authors are continuing to work through some of the challenges associated with use of their model, but results are promising. The model as implemented appears to be a somewhat expanded version of a Fay-Herriot (1979) model that relies most heavily on survey data, with the intent that the auxiliary information will help reduce the mean square error of the estimate relative to that of the survey.
This strategy may lead to models that are useful, and its consideration by ASB is warranted. However, it does not provide a way to integrate multiple data sources. Of all the auxiliary indications available with which to develop the required estimates for crops, the only one used in this model at present is FSA planted acres. The authors account for skewness by using the sample sizes as a weighting variable. See Chapter 5 for more detail on potential improvements for the modeling of crop estimates.
While NASS has actively pursued the development of models with a clear goal of improved transparency and reproducibility, the panel finds that substantial work is still needed to fulfill the vision set forth in this chapter. As has been observed for the Census Bureau’s SAIPE, which is the first of the major small-area models employed by statistical agencies:
The development of small-area estimates of income and poverty is a major effort that includes data acquisition and review, database development, geographic mapping and geocoding of data, methodological research, model development and testing and documentation and evaluation of procedure and outputs. Since the production of small-area poverty estimates supports a range of important public policies for federal, state, and local governments—including the allocation of funds—it is essential that the Census Bureau have adequate staff and other resources for all components of the estimation program, including evaluation and documentation. It is the responsibility of any agency that produces model-based estimates to conduct a thorough assessment of them, including internal and external evaluations of alternative model formulations. (National Research Council, 2000a, p. 167)
These observations apply equally to NASS as it pursues its small-area estimation program. Note that achieving this goal requires access to statistical/modeling talent through in-house staff, collaboration with other USDA and government agencies, and collaboration with academic researchers.
RECOMMENDATION 2-2: The National Agricultural Statistics Service should achieve transparency and reproducibility by developing, evaluating, validating, documenting, and using model-based estimates that combine survey data with complementary data in accordance with Office of Management and Budget standards.
The initial models described as part of the third and fourth approaches detailed above are promising starts, and the committee provides advice on potential improvements to these models in Chapters 4 and 5.
IMPLEMENTING THE USE OF MODELS
NASS’s adoption and full use of models will require identifying candidate models; updating the NASS publication standard; evolving the role of ASB; documenting the models; internally evaluating and externally validating the models; and, perhaps most important, preparing convincing documentation and communication using measures of uncertainty to demonstrate that the selected model-based approaches provide high-quality, defensible estimates. This convincing evidence will be the key to ultimate adoption and use of the models by ASB and the agencies that use the estimates.
The Committee on National Statistics has previously addressed how to establish and/or maintain the quality of model-based estimates in at least three National Research Council studies: on the Census Bureau’s SAIPE program (National Research Council, 2000a); on microsimulation
modeling of retirement income (National Research Council, 1997); and on microsimulation models (National Research Council, 1991a, 1991b). All of these reports recommend that these models be subject to internal validation, external validation, and sensitivity and uncertainty analysis, recommendations that apply to any important model.
The subsections in this section show how the NASS publication standard is related to uncertainty analysis and confidentiality and then describe these issues in general, as well as that of documentation. The discussion in this section illustrates these issues and others, such as internal and external evaluation, as recommended by the National Research Council (2000a) for the Census Bureau’s SAIPE program, which produces model-based estimates for school districts, counties, and states. The main objective of this now well-established small-area modeling program is to provide updated estimates of income and poverty for use in the administration of federal programs and the allocation of federal funds to local jurisdictions. These estimates combine data from administrative records, postcensal population estimates, and the decennial census with direct estimates from the American Community Survey (ACS) to provide consistent and reliable single-year estimates. These model-based single-year estimates are more reflective of current conditions relative to multiyear survey estimates.8
The Census Bureau’s county estimates of poor school-age children are produced using a county and a state regression model (National Research Council, 2000b, pp. 47–54). The Census Bureau uses the Fay-Herriot regression models, similar to models being considered by NASS. The National Research Council (2000b, pp. 54–61) report concludes that a comprehensive evaluation of these two components of the estimation procedure should include both internal and external evaluations, as detailed below.
Internal Evaluation
Internal evaluations investigate the validity of a model’s underlying assumptions and features, and typically are based on examination of the residuals from a regression model considering both functional form and error characteristics. In the evaluation of SAIPE documented in National Research Council (2000a, pp. 60–65), categories of counties were specified, and comparisons were conducted for each category. Functional form was assessed according to
- linearity between dependent and predictor variables,
- constancy of linear relationships over time, and
- inclusion or exclusion of predictor variables.
___________________
8 See https://www.census.gov/did/www/saipe/about/index.html [July 2017].
Error characteristics were assessed according to
- normality (symmetry and moderate tail length),
- homogeneous variances (variability constant across counties and not dependent on predictor variables), and
- the absence of outliers.
Methods for internal model evaluation (e.g., the deviance information criterion [DIC], cross-validation and out-of-sample comparisons) are described in the literature and should be part of the standard toolkit of researchers who work on developing models for NASS county estimates. (See, for example, the review of recently developed methods for model selection and checking in Pfeffermann [2013], and a discussion of issues related to goodness-of-fit approaches in mixed-effect generalized linear models in Tang et al. [2014].)
The panel has little evidence regarding the extent to which NASS has pursued detailed internal model evaluations for its current models. It may be that analysts conduct such evaluations but do not always include details of these evaluations in published papers. Such details are appropriately included in model documentation.
External Validation
External evaluation of potential models can shed light on their usefulness. NASS might conduct external model evaluation during preliminary stages of analysis, at the time of research, and for periodic monitoring of models already selected.
Comparison with a census, when available, is a standard approach to external validation. For example, BLS’s CES relies on the ability to compare estimates with the Quarterly Census of Employment and Wages (QCEW) levels over a number of years of estimation to provide assurance concerning the validity of the model estimates. As another example, the National Research Council (2000b) report suggests that external evaluation of SAIPE could employ comparison with decennial estimates (with the understanding that the census is not perfect) or assessment by stakeholders with local knowledge.9 The SAIPE report was prepared before the decennial census long form was replaced by the ACS. The availability of data from the ACS
___________________
9National Research Council (2000b, p. 57) describes the review by local stakeholders of 1990 decennial census estimates. The Census Bureau identified groups of counties for which estimates appeared to be high or low and contacted knowledgeable local people, such as state demographers and state data center staff, to review them and provide input.
has improved the accuracy of SAIPE estimates, but external validation by comparison with the decennial census is now no longer an option.
In a report documenting its assessment of the predecessor of SAIPE, the National Research Council (1980, p. 10) states, “An estimate is considered accurate if it is close to the value of the parameter it is estimating, which is typically unknown.” The report goes on to say, “ideally, an estimating procedure (or estimator) should meet four criteria: (1) low average error; (2) low average relative error; (3) few extreme relative errors; and (4) absence of bias for subgroups.” In a more recent assessment of SAIPE (National Research Council, 2000a, pp. 194–195), evaluation measures were summarized and illustrated by application to the 1990 census. The four measures used here were (1) the average absolute difference (the overall absolute model–census difference in terms of numbers of poor school-age children), (2) the average proportional absolute difference (the overall model–census difference in terms of percentage errors for counties), (3) the category algebraic difference (for selected categories of counties, such as population size and metropolitan status), and (4) the category average proportional difference. In this example, the evaluation was conducted for the key models under consideration.
A census does not always provide a truly perfect standard because, like other surveys, a census has limitations related to nonresponse, undercoverage, classification error, and response error. However, a census can provide a useful benchmark for estimates that represent the same time period as the census. The Census of Agriculture, conducted every 5 years, is appropriate for assessing the consistency of NASS county-level estimates for harvested acres and production (or yield as estimated by the ratio derived from production divided by harvested acres) for the year of the census. The Census of Agriculture provides no information with which to assess cash rents or planted acres. The Census of Agriculture has several drawbacks:
- It is conducted only once every 5 years.
- It is affected by undercoverage, nonresponse, and misclassification.
- It cannot be used in real-time estimation.
- It has good but not complete coverage of county estimates published by NASS.
The published ASB estimates are appropriate for use in assessing the quality and reasonableness of NASS model-based county-level estimates, especially at the research stage:
- ASB estimates are used for comparison for harvested acres in Bellow and Lahiri (2012) and for corn and soybean yields in Williams (2013).
- For certain groups of states, ASB estimates were used for exploratory analysis and shown to be within the confidence limits of model-based forecasts in most cases (Wang et al., 2012).
- Nandram and colleagues (2014, p. 509) use ASB estimates as response variables in models, thus highlighting the level of trust in those estimates.
Comparisons of model estimates with ASB estimates are likely to be necessary to convince ASB members that the model results are worthy of consideration.
Finally, Dorfman (2017) proposes that the Routine External Evaluation Protocol (REEP) be used as part of external evaluation. He argues that, as the demand for small-area estimation is ever-increasing, statisticians have the responsibility to develop a protocol aimed at setting criteria and enabling detection of “a tipping point” at which estimates produced using small-area models cannot be regarded as satisfactory. This determination is particularly difficult to make in groups of areas in which there is a small or no sample and that may behave differently from larger areas. For NASS, REEP would be based on comparing county model estimates with the corresponding direct sample-based estimates, with the latter being based on a large enough sample. The procedure would be implemented by selecting a random sample of counties within which a supplementary sample of farms would be selected and used to prepare direct estimates. Appendix B provides steps NASS might consider if it decided to pursue REEP.
NASS Publication Standard
The current NASS publication standard is related specifically to the publication of estimates derived from probability sample surveys. A county estimate from a sample survey can be published only if the survey had 30 nonzero respondents for the commodity represented by the cell, or fewer than 30 (but greater than 3) if the reported acreage of those respondents was at least 25 percent of the total county acreage for that cell. Bell and Barboza (2012) studied the effect of the currently used publication criteria on the coefficient of variation (CV) of the estimates and found that these criteria do not always lead to estimates with adequate precision. In addition, the panel was told by one FSA data user that, in his opinion, cells with at least 30 respondents are of acceptable accuracy. However, he thought this was not the case for some of those cells with a smaller number of respondents. Although NASS might benefit from a fresh look at the part of its publication standard that deals with fewer than 30 respondents, the panel observes that the major disadvantage of
the current standard is that it was designed specifically to be used for direct survey estimates and cannot apply to any other type of estimate. NASS needs a publication standard that applies to estimates derived from models as well as those derived from surveys.
The panel has chosen to recommend a generic publication standard that bases a publication decision on protection of respondent confidentiality and measures of uncertainty for point estimates. This proposed standard reflects NASS goals of protecting the confidentiality of respondents to surveys and publishing high-quality data. It also reflects the panel’s judgment that the user is key to deciding whether an estimate is of sufficiently high quality for his or her own use. To make such judgments possible, the estimate needs to be accompanied by a measure of uncertainty. Box 2-3 provides more detail on the quality of NASS estimates.
RECOMMENDATION 2-3: The National Agricultural Statistics Service (NASS) should adopt and use the following publication standards:
- County-level estimates may be withheld to protect confidentiality.
- County-level estimates may be withheld because NASS deems them unreliable for any use, based on its measure of uncertainty.
- All other county-level estimates will be published, along with their measure of uncertainty.
Measures of Uncertainty
To comply with the OMB standard, NASS must develop and publish measures of uncertainty for each of its published county-level estimates. NASS has measures of uncertainty for its direct survey indications, and indications based on statistical models also are expected to be accompanied by measures of uncertainty. Measures of uncertainty for estimates of planted acres derived from remote sensing are provided by Schaible (1996, Chapter 7). However, NASS told the panel that measures of uncertainty currently are not available for remote sensing indications even though the estimates are derived from models. Nor are measures of uncertainty for indications based on administrative data currently available. Measures of uncertainty are key to assessing the various indications and determining how they can best be used. For data users, measures of uncertainty are key to assessing estimates for fitness for use.
In addition to uncertainty measures derived as part of model estimation, uncertainty measures can be derived using such validation approaches as leave-one-out cross-validation. A popular Bayesian approach is the construction of posterior predictive p-values.
RECOMMENDATION 2-4: The National Agricultural Statistics Service should develop and publish uncertainty measures for county-level estimates.
Confidentiality
Like other statistical agencies, NASS collects survey data under a pledge of confidentiality and uses statistical disclosure limitation methods and suppression to protect the data. The result is a fair amount of data suppression, and this will likely continue to be the case as long as NASS relies on surveys and its current confidentiality criteria. Suppression sends a message to respondents that their data are protected, but researchers can and have provided estimates of those values to the public. (See, for example, Lokupitiya et al. [2007], in which estimates of suppressed values of area planted and yield for all counties in the United States for a period of 16 years are derived.) There has been research on confidentiality approaches that do not involve suppression, but the panel has not seen any that are ready for implementation in an operational environment. NASS would benefit from considering the implementation of new research methods for confidentiality protection as they evolve and are demonstrated to be useful.
The unanswered question is how/whether suppression analysis is required with estimates derived from auxiliary data sources (not surveys)
and/or models. FSA10,11 and RMA12 both collect administrative data for their programs. They differ in the extent to which they view their data as being confidential, but both agencies share individually identifiable data with other USDA agencies.
RECOMMENDATION 2-5: The National Agricultural Statistics Service (NASS) should work with its partner agencies, Farm Services Agency and Risk Management Agency, to determine whether to apply confidentiality protection to individually identifiable administrative data used by NASS for statistical purposes and if so, how to provide that protection. For data for which confidentiality protection is needed, NASS may propose that it apply the same confidentiality rules as those applied to NASS survey data collected under a pledge of confidentiality.
For estimates derived from models, the answer is less clear. Disclosure limitation methods are intended to ensure that the contribution to the cell total of the largest survey respondent cannot be estimated too closely from the published total. This assurance is of particular concern when the population is small. For example, in a county dominated by one farm, any estimate for the county is an estimate for the farm. Officially, suppression would be needed only if the estimate were based on data provided to the agency under a pledge of confidentiality and the farm did not provide a waiver. If the estimate were based entirely on nonconfidential data sources, such as publicly available data, it could be published. If the farm provided the data under a pledge of confidentiality, could the agency then publish an estimate derived entirely from other sources? Officially the answer would be yes, but how would the farmer view this publication?
___________________
10 FSA form 578 states, “The following statement is made in accordance with the Farm Security and Rural Investment Act of 2002 (Pub. L. 107-171). The information will be used to determine to whom program benefits will be paid. Furnishing the requested information is voluntary; however, failure to furnish the correct and complete information will result in a determination of ineligibility for program benefits. This information may be provided to other agencies IRS, Department of Justice, or other State and Federal law enforcement agencies, and in response to a court magistrate or administrative tribunal. The provisions of criminal and civil fraud statutes, including 18 USC 286, 287, 371, 641, 651, 1001; 15 USC 714m; and 31USC 3729, maybe applicable to the information provided.”
11 FSA’s annual acreage spreadsheet provides acreage data by crop by FSA farm without using a threshold or dominance rule. However, if a farm has multiple owners, the values of acreage provided may be multiplied by the ownership fraction. Additionally, the definition of “county” used in the spreadsheet is the county where the farmer submitted his or her application rather than the county where the farm is located. These actions may help protect confidentiality.
12 The panel was told that RMA applies a confidentiality analysis when preparing its county-level production estimates.
The experience of other agencies in applying confidentiality protection to modeled results is instructive. The SAIPE program, for example, produces model-based estimates for the counts and percentages of school-age children in poverty in school districts and counties based on data from the ACS, aggregated income tax records, and other administrative data. Although estimates are sent to the Census Bureau’s Disclosure Review Board every year for a disclosure assessment prior to release, no estimates have been suppressed because of confidentiality concerns. According to the Disclosure Review Board, “given that this data product is fully synthetic, the synthesis itself is the disclosure avoidance protection technique. If this product reported information from the underlying microdata (e.g., counts, or regression estimates) without going through the synthetic model(s), then we would need to check that each cell passes a cell count threshold.”
The SAIPE example relates to population statistics (about people) instead of farm-level statistics (about farms that may be of widely differing sizes). However, the concept of “suitably synthetic” may be as useful as “publicly available” in assessing the need for suppression.
Another instructive example is the CES conducted by BLS, which uses a confidentiality rule in conjunction with a threshold to determine whether model-based estimates can be published. If the confidentiality rule fails (so the direct survey estimate cannot be published) and sample coverage is less than a given threshold, the model-based estimate can be published. Cells that fail the confidentiality rule and have sample coverage above the threshold are not published unless waivers (letters of consent) are obtained from the largest respondent(s).
NASS will have to determine whether estimates that are derived indirectly from respondent-level data—such as estimates based on remote sensing—are subject to confidentiality rules. For example, even though FSA data are used in classifying pixels, and June Area Survey data are used in the Battese-Fuller regression estimate for planted acres, remote sensing estimates of planted acres by crop for a county would difficult to link either to a respondent to the June Area Survey or the FSA administrative data. The current remote sensing yield estimates rely on having a time series (6 years) of previously published county yield estimates. If a county estimate were suppressed in any of the previous 6 years, a remote sensing estimate would not be available for that county. Hence, one might conclude that these remote sensing estimates are suitably synthetic and are not a confidentiality risk.
Documentation
To its credit, NASS encourages both staff and contractors to publish papers documenting proposed models and how well they work. It also
conducts occasional staff-level evaluations of competing models that are presented at conferences and published (e.g., Adrian, 2012; Bellow, 2007; Crouse, 2000; Cruze, 2015b; Williams, 2013). Panel members have been part of expert groups invited by NASS to review aspects of models during their development. This is a valuable approach to gaining expert insight. However, the fact that expert reviews have taken place does not appear to be documented by NASS. At present, there is little official NASS documentation for models, even though some model-based estimates are being used as indicators by ASB. At present, NASS appears to rely on published proceedings and journal papers for documentation.
In its evaluation of the SAIPE model, National Research Council (2000a, p. 167) makes the following statement:
An integral part of the evaluation effort is the preparation of detailed documentation of the modeling procedures and evaluation results. No small-area estimates should be published without full documentation. Such documentation is needed for analysts both inside and outside the Census Bureau to judge the quality of the estimates and to identify areas for research and development to improve the estimates in future years.
RECOMMENDATION 2-6: The National Agricultural Statistics Service (NASS) should prepare documentation for any indication submitted to the Agricultural Statistics Board for review. Such documentation should include a description of the input data sources and the methodology used, the estimates produced, a summary of the quality of the estimates, details of assessments, and descriptions of previous and planned validations. The documentation should be easily accessible from the NASS website.
MAKING THE CASE FOR CHANGE
One of the issues NASS will have to address is the development of a decision process for the use of models. If a model performs well for most publication cells, a decision might be to rely on that model for all county estimates. An alternative approach might be a decision process with a series of steps leading to selection of specific model-based indications to serve as the estimate in different situations.
It is important to establish a procedure (consisting of steps and criteria) that could be applied to determine which county indications are suitable for use as official NASS estimates. The CV or other measure of uncertainty of alternative model-based indications and the direct sample-based indication could be used to decide which indication to use as the official estimate in specific instances.
Researchers need to be able to convince others within NASS, as well as users outside of NASS, about the value of model-based approaches. Researchers need to expect to prepare convincing evidence concerning the quality of model-based versus design-based estimates, especially if model-based results are to be used in lieu of design-based estimates or if survey estimates are not publishable.
At a minimum, the mean difference, mean absolute difference, mean relative difference, and mean absolute relative difference and assessments of outlying observations among model-based county indications, ASB county-level estimates, and other county indications need to be prepared and summarized in meaningful ways. It is important that preparation and use of such statistics be a regular part of ASB’s quality assurance efforts.
Encouraging collaboration between ASB members and NASS modelers will be a key way to facilitate communication between the two groups. Modelers need to understand how ASB reviews and assesses indications from multiple data sources. This knowledge may help them identify convincing ways to present model-based estimates to ASB, and may also help them determine different ways in which the various data inputs can be used in the models.
RECOMMENDATION 2-7: A representative of the National Agricultural Statistics Service modelers should be a full member of the Agricultural Statistics Board (ASB). Additionally, modelers should be able to observe ASB deliberations, especially when model-based results are part of the deliberations.
GEOSPATIALLY REFERENCED DATABASE: SELECTING BASIC SPATIAL UNITS
In the panel’s vision for the future of NASS, the list frame will provide a high-quality georeferenced farm-level database. The first challenge in developing such a database is to select meaningful and appropriate spatial units of analysis that are also feasible for NASS to obtain and use. These spatial units will be the building blocks for the analysis of location-specific attributes.
Problems arise whenever a major project must contend with datasets that use different spatial units. For NASS, for example, remote sensing data are based on pixels that vary in size and position depending on the particular satellite and sensor, while aerial photography uses its own set of pixels, and survey data often are collected for irregularly shaped basic units, such as farms. This problem of “spatial mismatch” can be addressed with GIS tools, but this approach introduces an inevitable level of uncertainty. These problems of spatial mismatch and uncertainty could be reduced for NASS
if a basic spatial unit could be adopted, and all data could be expressed as attributes of one or more basic spatial units. This is the strategy adopted by the Census Bureau, where the block is the basic unit, and all other units, such as block groups and census tracts, are aggregations of blocks. The obvious candidate for NASS is FSA’s CLU, aggregated into farms, counties, districts, and so on.
Challenges and Advantages
Use of this strategy entails four immediate challenges. First, CLUs are not aggregates of the pixels used in satellite remote sensing, and while the errors introduced by estimating CLU properties from pixels are small when pixels are much smaller than CLUs, the errors become substantial for such sources as the Moderate Resolution Imaging Spectroradiometer (MODIS), with its 250 meter pixels. Second, there are substantial gaps between CLUs (roads, water, nonagricultural areas). The Census Bureau deals with this issue by creating pseudoblocks outside settled areas. In NASS’s case, it would be simpler to ignore non-CLU areas entirely. Third, boundary files exist for counties that cross CLUs. This issue could be addressed if USDA adopted a practice of snapping CLU boundaries to county boundaries, and functions exist in GIS to do this automatically. Finally, for CLUs to function as basic spatial units, it would be desirable to regard them as permanent to the extent possible, freezing them and minimizing any changes over time.13
While challenges are associated with using the CLU as a basic spatial unit, the approach offers advantages as well: CLUs were intended to serve as a standardized GIS data layer14 that would ultimately include all farm fields, rangeland, and pastureland in the United States; they have unique identification numbers;15 they are updated annually by FSA;16,17 and they undergo a certification process.18 They also are widely used within USDA and are readily available to NASS. As discussed below, NASS has not used
___________________
13 Although CLUs are relatively stable, they can change, primarily as a result of FSA farm reconstitutions—changes that are due to combining or dividing tracts or farms, usually because of changes in ownership or operator (Neill, 2011).
14 See http://www.esri.com/news/arcuser/0402/usda.html [July 2017].
15 See https://www.fsa.usda.gov/programs-and-services/aerial-photography/imagery-products/common-land-unit-clu/index [July 2017].
16 See https://www.fsa.usda.gov/Internet/FSA_Notice/cm_787.pdf [July 2017].
17 See https://www.fsa.usda.gov/Assets/USDA-FSA-Public/usdafiles/APFO/support-documents/pdfs/clu_infosheet_2016.pdf [July 2017].
18 There are two different categories of CLUs—certified and noncertified. Noncertified CLUs are the “original” CLUs generated by FSA (usually in the county FSA offices). Certified CLUs are those that have undergone a process whereby FSA confirms the acreages and boundaries with owners and operators.
CLUs as the basis for its list frame because of differences in farm definitions among NASS, FSA, and RMA.
RECOMMENDATION 2-8: The National Agricultural Statistics Service should adopt the Farm Services Agency’s Common Land Unit as its basic spatial unit.
RMA reporting by field location (CLU) began in 2010, and in 2016 RMA started requiring that all farms report field location on its acreage report (U.S. Department of Agriculture, 2016). Bulletin MGR-16-005 states:
As a service to their insureds, many AIPs [Approved Insurance Providers] have adopted technologies that facilitate the identification of field location. To better accommodate these new technologies, RMA developed the resource land unit (RLU) data standard in consultation with AIPs. Reporting by RLU enables field location reporting without specifically reporting a FSA Farm, Tract, and Field Number. In reinsurance year 2016, RLUs were authorized as a means to identify field location where CLUs did not exist.
Beginning in 2017, “the insured can meet the acreage reporting requirement for field location identification by
- if known and accurate, providing the FSA Farm, Tract, and Field Number, including the FSA administrative State and County; or otherwise
- clearly identifying the field location(s) and associated boundaries using AIP map-based reporting or other mapping resources which clearly delineate the fields’ location.”
While it is the panel’s understanding that most farms report by CLU, they can report by RLU. Reporting by RLU is being encouraged by AIPs19 and is likely to increase in the future.
Although the panel is recommending that CLUs be used as the NASS basic spatial unit, NASS should plan to maintain RLUs and, when they become available, precision agriculture reports of field location, in its databases. (See Chapter 3 for additional discussion of precision agriculture.) These data will be particularly useful for identifying GIS field locations for all farms.
___________________
19 See http://www.proag.com/News/Real-Time-Revolutionizes-USDAs-Crop-Insurance-Verification-Program-2017-04-03/5851 [May 2017].
RECOMMENDATION 2-9: The National Agricultural Statistics Service should be prepared to maintain alternative geospatial field-level boundaries (e.g., resource land units and precision agriculture measurements) in its databases to facilitate completing the geospatially referenced farm-level database.
There are many advantages to incorporating CLUs into NASS list frames. First, CLUs/RLUs will provide unique linkages among FSA, RMA, and NASS reported data, providing valuable information on current-year planted acres by crop that would improve NASS surveys (the panel’s ideas are discussed at the end of this chapter). Second, FSA and RMA update the CLUs/RLUs annually, providing information about changes in farm ownership and operation that NASS can use to keep its list frame up to date. Third, having a georeferenced database means that NASS farm-level data can be linked to such parcel-specific independent variables as weather, soil quality, remote sensing information (NDVI, ground temperature), and distance to markets that are potentially very useful for farm- or unit-level models.
The following subsection describes NASS frames and the panel’s assessment of the impact of the geospatial building blocks on those frames. It also describes the different definitions of “farm” used by NASS, FSA, and RMA and the impact of those definitional issues on the goal of incorporating CLUs into the NASS list frame.
IMPACT ON NASS FRAMES
NASS makes use of two sampling frames—an area frame and a list frame.20 The area frame is defined as the entire land mass of the United States and ensures complete coverage of the U.S. farm population. The list frame is a roster of known farmers and ranchers and includes a profile of each operation indicating its size and the commodities it historically has produced. The main strengths of the area frame are its completeness and stability. Its weaknesses are its inefficiency for crops grown in small acreages or geographic regions and its cost to build and collect data. The list frame can be sampled more efficiently (at the commodity-specific level, if necessary), and data can be collected using less expensive methods (mail, telephone, web). The list frame does not, however, provide complete coverage of all farms and requires continual updating (as do most business registers) since farming arrangements are constantly changing. NASS uses
___________________
20 This description was drawn from information provided by NASS. See, for example, the description of the use of sampling frames in https://www.nass.usda.gov/Education_and_Outreach/Understanding_Statistics/Yield_Forecasting_Program.pdf [August 2017].
its area frame to adjust for undercoverage of the list frame. For the 2012 Census of Agriculture, the adjustment for frame undercoverage for the number of farms was 12.3 percent, and the coverage adjustment for land was 3.4 percent.21
County-level indications (prior to benchmarking) for both crops and cash rents are based on probability sample survey data collected using samples from the list frame. Benchmarking of county-level estimates to agree with previously published state totals accounts for list frame undercoverage, and is done by using an identical multiplicative factor applied to each county.22
The success of NASS surveys and the Census of Agriculture depends on the quality of the sampling frames (area and list). The list frame contains basic data: name, contact information, location, and demographic information. For updating the list frame, NASS uses annual lists of participating farms from FSA and RMA, outside source lists, and web scraping. It also has approval to use federal tax information at the record level. However, if a farm is identified from the tax information, it cannot be added to the frame until it has also been identified in another source and that other source information is used on the list frame. Maintaining the list frame is a major ongoing effort for NASS regional offices. Frame maintenance and updating are coordinated in the St. Louis office. The National Agriculture Classification Survey is used to help ensure that the list frame is as complete as possible for the Census of Agriculture.
NASS told the panel during its October 2016 meeting that, in researching issues associated with declining response rates, it had established that a fair amount of nonresponse is due to “deadwood”—farmers that are no longer in business—on its list frame and in surveys. In an initial check by field offices, NASS found that 40–50 percent of farms identified through an algorithm as deadwood were actually no longer in business. NASS plans to expand its verification effort. NASS also told the panel that it has decided to link FSA CLUs to the list frame to help maintain the status of farms. The panel enthusiastically supports this decision and views this linkage as key to achieving the vision of the NASS list frame being a premier farm parcel database, serving as a sampling frame for NASS surveys and as a valuable tool for analysis.
___________________
21 Appendix A of the NASS Census of Agriculture publication provides measures of census undercoverage, nonresponse, and classification error. See https://www.agcensus.usda.gov/Publications/2012/Full_Report/Volume_1,_Chapter_1_US/usappxa.pdf [March 2017]. For the following major crops, it shows frame undercoverage to be as follows: corn for grain = 4.0 percent of farms and 1.6 percent of acreage; winter wheat = 3.4 percent of farms and 1.8 percent of acreage; soybeans for beans = 3.8 percent of farms and 1.8 percent of acreage; cotton = 3.1 percent of farms and 1.3 percent of acreage; etc.
22 This process accounts for undercoverage only if certain assumptions hold.
RECOMMENDATION 2-10: The National Agricultural Statistics Service (NASS) should update its list frame to make use of Common Land Unit information as geospatial building blocks by developing linkages between the NASS list frame and the Farm Services Agency and the Risk Management Agency administrative data.
The area frame is used to assess the completeness of the list frame. If farms not on the list frame are found, they are not added to the list frame because doing so would negate the independence of the list and area frames, thereby violating a key assumption underlying the dual-frame survey estimation and census capture–recapture adjustment for undercoverage.
The list frame is kept in a relational database developed in the mid-1990s called the Enhanced List Management Operations (ELMO) database. NASS has chosen to characterize farms by “operation” and by “people” (owners, operators, others). As a result, ELMO has three key tables: a person table (PID); an operations table (OIDS); and a person/operations table (POIDS), linking each person with all the operations with which he or she is involved. An individual person may be involved in multiple operations, and multiple people may be involved in each operation. The PID uniquely identifies people involved in farming, particularly owners and operators, and includes name, contact information, and demographics. The OIDS uniquely identifies an operation, and includes business name, physical address, location (county), and identification number. The POIDS includes identification number, current operating status, and whether the unit is a target for operator-dominant surveys such as the County Agricultural Production Survey (CAPS). For operator-dominant surveys, sampling units are defined by the “target name” for the farm or ranch, usually a person’s name. The target name reports for all of the operations in which he or she is involved.
The Census of Agriculture and some minor, commodity-specific surveys use a frame based on the operation-dominant list (also a link between the PID and OIDS, but with operation dominant). For the census and these surveys, a selected operation reports only for that operation.
Farms in the United States are complex and are defined by different USDA agencies in different ways (see Box-2-4 for the definitions of “farm” used by NASS, FSA, and RMA). NASS and USDA’s Economic Research Service (ERS) have jointly established a National Academies of Sciences, Engineering, and Medicine Panel on Improving Data Collection and Reporting about Agriculture with Increasingly Complex Farm Business Structures to evaluate complex farm structures. This panel recently started its work, and its report is expected in 2018.
These differences in the definition of “farm” make linkage of the data reported to NASS, FSA, and RMA more challenging. For example, NASS
told the panel that a project in support of the 2012 Census of Agriculture to link the FSA payments database and the NASS list frame resulted in only a 63 percent match rate with 6 percent possible matches. At the panel’s second meeting, NASS representatives described an effort undertaken in 2010 to match FSA farms to NASS farms in Nebraska (see Barboza and Iwig, 2010). This effort was quite time consuming, and the initial match rate achieved
was 80 percent, with a 45 percent one-to-one farm match rate. After review, the match rate rose to 97 percent, with a 53 percent one-to-one match rate.
Difficulties in matching the NASS list frame with the FSA list are due to the complexity of farm operations and the fact that NASS and FSA farms are not necessarily the same. NASS identifies an “operator” willing to report for as much farmland as possible, but it is not clear to the panel how NASS ensures that the selected person knows and reports for exactly the farm operations NASS expects. The available geospatial information on farm operations should facilitate such assessments. The NASS study in Nebraska showed that there were 2.4 FSA farms for every NASS farm. As NASS well knows, achieving this vision will not be easy; however, it will be extremely valuable. Once it has been achieved, NASS will have gained the ability to keep a high proportion of the frame (better than 95% of planted acres in the United States) up to date by regularly checking matched FSA (and ultimately RMA) farm records for changes; will have detail for matched farms concerning planted and failed acres by crop for the current year and be able to use these data to fine tune its surveys to collect only the missing information; and will be able to develop unit-level model-based approaches that can take advantage of such geospatial information as soil productivity and weather.
NASS has said that it has little experience with linking to RMA data. However, the panel was told about the Acreage and Crop Reporting Streamlining Initiative (ACRSI), a multiagency project within USDA. FSA and RMA have been the key players in this project to date and have developed a common reporting system for acreage reports intended to allow farmers who participate in both programs to complete one acreage report for use by both programs. While the ACRSI project is still evolving, it has made great strides in achieving a common automated system whereby producers can submit their FSA/RMA acreage reports through a common site. Data reported to FSA are available electronically to AIPs, and data reported to RMA by AIPs are available electronically to FSA. FSA, RMA, the Natural Resources Conservation Service (NRCS), and NASS will all be able to use the reported information for their respective agency programs. For example, FSA would use the information for program purposes, RMA would use it for crop insurance purposes if the producer purchased crop insurance, and NASS would use it for statistical purposes.
Achieving complete linkage with these administrative sources will be time consuming, and NASS needs to plan an approach that can build to success. The first step will be planning how to accommodate the CLU data and FSA and RMA identifiers (IDs) in ELMO (or in files easily accessed by ELMO). Second, NASS may have information on matched FSA and NASS farms from previous work. For several years, for example, the June Area Survey has made use of FSA CLUs, and remnants of the 2010 record
linkage effort in Nebraska may be available. Third, NASS’s traditional matching approaches using owner/operator names can provide a link for the least complex farms—those for which there is one NASS farm for one FSA farm. The Nebraska matching experiment indicated that there was an “easy” one-to-one exact match for almost 50 percent of farms. NASS needs to develop revised survey forms for matched farms that take advantage of administrative data to simplify reporting and reduce respondent burden. With the promise of a simple reporting form, perhaps NASS can work with all respondents to encourage them to provide the FSA IDs with which they are associated. Completing the match through manual reviews would be possible but time consuming. Over time, the geographic information available for FSA and RMA farms should make it possible to track down the NASS farms to identify matches. Expensive manual efforts at matching would best be dedicated to achieving matches for the largest farms.
While conducting this linkage may be complex, maintaining the linked database should be relatively simple. FSA and RMA update their data annually. The panel heard that FSA makes some changes in CLU definitions over time, possibly because of changes in ownership or land use. At its second meeting, the panel heard from ERS analysts who have linked FSA and other USDA data and maintained that linkage over time. They estimated that no more than 10 percent of CLUs are changed from one year to the next.
NASS SURVEYS IN THE FUTURE
Well-executed NASS surveys have been the major tool for supplying useful information about crop production in the United States for decades. The new sources of information examined in this report will not replace the need for the surveys or survey infrastructure NASS has developed any time soon, and surveys will continue to be as important as ever for producing estimates. For the new data sources to have maximum utility, however, some changes to the survey machinery will be necessary. For example, methods will need to be developed for associating the new information with the units on the sampling frame. In this way, the auxiliary information can be used to improve either the sample design or the estimation process or both. This section outlines a strategy for how this might be accomplished. It includes subsections on using Internet survey forms, imputing for nonresponse, and improving estimation using alternative estimation methods.
Once this has been accomplished, alternative sources of information can provide a variety of potential improvements to survey methods, several of which are discussed in this section (see Chapter 3 for detailed discussion). For example, allowing alternative sources of data to substitute for operator-supplied data can reduce the burden on operators, potentially increasing response rates or even improving accuracy. These changes will require a
long planning horizon, experimentation, and testing. The available sources of data are likely to continue to change as new technologies develop. Therefore, a system that builds in continuous testing and change will likely be required to take advantage of the new technologies as they appear.
The NASS surveys that feed into the county-level crop and cash rents estimates are described in Appendix A. These surveys have been providing useful county-level estimates for crops since 2012 and for cash rents since 2009. As noted previously, however, declining response rates have resulted in a decline in the number of counties for which estimates can be published. NASS has initiated efforts to evaluate and address issues related to nonresponse. The panel expects that as NASS moves toward achieving the vision set forth in this chapter, it will continue to rely on high-quality surveys but will need to become more nimble, regularly assessing the quality of auxiliary data by county and ultimately focusing surveys in those areas in which auxiliary data are not sufficient.
Internet Survey Form to Facilitate Reporting by FSA/RMA Linked Farms
As more of the FSA and RMA data are linked to the list frame, it may be useful for NASS to develop an easy-to-use Internet survey form to facilitate reporting by farms that also participate in FSA and RMA programs. The administrative data available prior to collection of CAPS data identify planted acres, crops, and some failed acres, but do not provide information on production or yield. Since the planted acres by crop would be known from FSA/RMA data, the Internet form would collect only data not available from administrative sources. The availability of such a form might encourage farmers to identify their FSA numbers to NASS so they could make use of the streamlined form.
RECOMMENDATION 2-11: The National Agricultural Statistics Service (NASS) should develop a user-friendly Internet form to be completed by Farm Services Agency (FSA) and Risk Management Agency participants matched to the NASS list frame in lieu of completing the County Agricultural Production Survey/Acreage, Production, and Stocks surveys. NASS could use the availability of such a form as an incentive for farmers to help in providing NASS/FSA linkage information.
Imputation
The demand for small-area estimates, resource constraints, and the availability of high-quality auxiliary data indicate the potential benefit of incorporating FSA/RMA farm-level data on planted acres, when available, into NASS’s imputation methodology for CAPS and Acreage, Production,
and Stocks. The panel received a copy of a 2006 internal paper documenting a NASS experiment that involved using data on FSA planted acres by crop for imputation. The experiment demonstrated that this approach to imputation was not feasible at the time (because of difficulty in matching farms and disagreement between FSA and NASS data). However, this was before Barboza and Iwig (2010) had documented the differences between FSA and NASS farms. Once a reasonable number of FSA farms and their CLUs have been linked with the NASS list frame, using current-year information from FSA on planted acres by crop for imputation will be feasible.23 Over time as more FSA farms are linked, NASS may realize significant improvements in accuracy due to the inclusion of this current-year information. The panel was told that cash rents, especially rented acres, are fairly stable over time, which may indicate that a simple model of imputation for rented acres based on historical data could be beneficial.
As precision agriculture data become available, they also may prove valuable in imputation for nonresponse. The current sample-based data collection and estimation method could be used, but nonresponse for such items as planted and harvested acreage could be imputed using data from the actual nonresponding farm or from a “similar” farm. Either of these approaches might require permission to access the data from a unit that is not a responder to the survey, depending on how the data were obtained. If it were possible to obtain access to such data on an opt-out basis, this might be a way to address this issue. If only opt-in permission is possible, it may be unrealistic to expect that a nonresponding unit would be willing to extend permission.
RECOMMENDATION 2-12: As farm-level administrative data and precision agriculture data become available, the National Agricultural Statistics Service should consider imputing for nonresponse based on these auxiliary sources of information.
Improving Estimation
Both FSA and RMA data define subpopulations of all farms, and NASS could potentially obtain access to relevant data from precision agriculture databases on an ongoing basis for a substantial fraction of the total farm population. These auxiliary data for well-defined subpopulations could be used to provide more efficient estimators relative to the current NASS sampling and estimation methods.
___________________
23 The panel was told that crop switching causes considerable concern during imputation. Imputation relies on past-year data for a missing farm to select crops for imputation. However, past-year data may not be related to the crops that the farmer plants in the current year.
Data from precision agriculture databases, FSA program participants, and RMA purchasers of insurance clearly are not probability samples and are not likely to be representative of the total farm population. Thus the data could not be treated as a direct replacement for or even an augmentation of the probability sample. A topic of current research interest in survey methods is how to make use of data from nonprobability samples (see Baker et al., 2017). The availability of data through new technologies and social media has inspired this research, and it is important for NASS to stay abreast of these developments. Still, there are methods for employing data from nonprobability samples that can be used in ways that are familiar to those accustomed to probability sampling methodology. All of these methods require that it be possible to link the data from the nonprobability samples to the list frame. These methods make use of the data either to improve the sample design or to serve as auxiliary information to improve estimation derived from a probability sample. Two such methods are described below.
First, suppose that all of the information normally collected by one of NASS’s surveys is available for a subset of the population from the precision agriculture database, and it can be matched to the NASS list frame. (The same methodology holds for FSA and RMA participants linked to the list frame.) Then the frame can be divided into two strata distinguished by whether the needed data are available—stratum N (not available) and N′ (available)—and the fraction of units for which the data are not available is denoted by pN. Then the resources for sampling can all be directed to the stratum with no available data, and the estimator of the total is just the sum of the known total from stratum N′ and the estimated total from stratum N. If the design effects for the new and original designs are similar and the finite population sampling correction (fpc) is negligible, then the relative precision for this estimator is
where ![]() and
and ![]() denote the variance of the acreage in the entire population and the variance of the acreage of the part of the population in stratum N. This relative precision can be substantial if the coverage of the precision agriculture database is large.
denote the variance of the acreage in the entire population and the variance of the acreage of the part of the population in stratum N. This relative precision can be substantial if the coverage of the precision agriculture database is large.
Now suppose that the variable available from the auxiliary database is not the same as that needed for estimation, but is correlated with it. So, for example, suppose that only acreage aggregated over crops is available rather than acreage for the specific crop of interest. These data can still be
used in estimation, and they will provide increased precision under certain circumstances. Denote the desired specific acreage from farm i as yi. An indicator ri denotes whether (= 1) or not (= 0) auxiliary data are available for farm i, and xi denotes the farm’s available (e.g., aggregated acreage) value. Then a ratio estimator can be constructed that uses as auxiliary data the variable ri xi. That is, the estimator is defined as
where ![]() is the total of the auxiliary data over all farms for which these data are available, and
is the total of the auxiliary data over all farms for which these data are available, and ![]() and
and ![]() are the estimated totals of the specific crop acreage and the available auxiliary data for the population making up the probability sample. If the proportion of the population providing auxiliary data ((1 – pN)) and the correlation between x and y are high enough, the variance of
are the estimated totals of the specific crop acreage and the available auxiliary data for the population making up the probability sample. If the proportion of the population providing auxiliary data ((1 – pN)) and the correlation between x and y are high enough, the variance of ![]() can be substantially lower than that of
can be substantially lower than that of ![]() (Liu et al., 2017). If the data available from the auxiliary sources are considered to be equivalent to yi (or even of higher quality), but the matching of frame to database may contain errors,
(Liu et al., 2017). If the data available from the auxiliary sources are considered to be equivalent to yi (or even of higher quality), but the matching of frame to database may contain errors, ![]() may still perform adequately. With the auxiliary data being treated as supplemental to the sample, the variance, rather than the bias, is increased when errors occur in either matching or the accuracy of xi as a proxy for yi.
may still perform adequately. With the auxiliary data being treated as supplemental to the sample, the variance, rather than the bias, is increased when errors occur in either matching or the accuracy of xi as a proxy for yi.
RECOMMENDATION 2-13: Once alternative data have been linked to the National Agricultural Statistics Service’s list frame for a sufficiently large percentage of farms, alternative estimation methods that make use of the linked data should be evaluated.


