3
Multiple Data Sources for Crops: Challenges and Opportunities
The National Agricultural Statistics Service’s (NASS’s) Agricultural Statistics Board (ASB) considers multiple data sources when developing its county-level crop estimates. The NASS county estimates program produces annual estimates for planted acres, harvested acres, production, and yield (production divided by harvested acres). The main source of data used to develop these estimates is the County Agricultural Production Survey (CAPS)/Acreage, Production, and Stocks (APS) survey system,1 which provides information for all required estimates.
These survey-based estimates are considered highly reliable because they are developed using appropriate statistical procedures (Johansson et al., 2017). Over time, however, NASS has been able to publish estimates for fewer counties because of falling response rates. NASS is fortunate to have high-quality auxiliary data available to inform these estimates and is challenged in determining how best to use these data in a manner that is transparent and reproducible. As discussed in Chapter 2, these auxiliary data sources include recorded data, such as administrative data from the Farm Services Agency (FSA), the Risk Management Agency (RMA), and potentially precision agriculture measurements, as well as data observed using remote sensing tools. This chapter describes current and emerging alternative data sources potentially available to NASS. It explains how they are currently used by NASS, if they are so used, and presents the panel’s recommendations for enhancements. The focus is on how NASS can achieve
___________________
1 See Appendix A for a description of NASS surveys.
the goal of saving resources and reduce the response burden on farmers while improving its estimates.
The chapter begins by examining the challenges and opportunities with respect to NASS’s use of administrative data from FSA and RMA. It then turns to the potential use of a new and potentially very important source of recorded data to which NASS currently lacks access—precision agriculture measurements—and highlights the benefits and challenges of incorporating this information into NASS’s county-level estimation process. This is followed by a discussion of data observed by satellite and other remote sensing tools. Satellite remote sensing data are available through government agencies or private vendors; other sources of remote sensing data include data collected by drones and aircraft (available through private vendors) or flux towers in fields (available through the Agricultural Research Service [ARS]). These data also are not currently used by NASS.
Until NASS has high-quality auxiliary data on production or yield, it will need to rely on its surveys, using auxiliary data to improve certain estimates for certain crops/regions. The panel sees two possibilities for achieving the goal of high-quality auxiliary data on production or yield. First, if RMA moves the date for collecting production data forward, as it is currently considering, NASS may be able to use these data directly to improve its estimates in some areas. Second, NASS has developed its satellite remote sensing program on a shoestring budget. If NASS can improve its satellite remote sensing estimates of yield and expand the number of commodities covered, it will have many options available for achieving this goal.
ADMINISTRATIVE DATA FROM THE FARM SERVICES AGENCY (FSA) AND RISK MANAGEMENT AGENCY (RMA)
FSA Administrative Data
The FSA manages a number of programs to benefit farmers, using NASS data in program administration and collecting important administrative data. NASS county-level yield estimates are used in the Agricultural Risk Coverage Program, NASS county-level production estimates are used in the Marketing Loan Benefits Program, and NASS county-level cash rents estimates are used in the Conservation Reserve Program, as described in Chapter 1.
To apply for participation in one of these FSA programs, producers must file an annual application (form FSA-578) that certifies (i.e., “signs up”) their acreage for participation. The FSA-578 is due to FSA by July 15 for many crops. Updates to failed acres are provided within 15 days of the failure. The FSA data are reported by Common Land Unit (CLU), roughly a field, as described in Chapter 2. Generally, the information in
which NASS is interested on the FSA-578 form includes the specific crop(s) (by type) grown, the number of acres planted in that crop, the FSA farm number (and sometimes tract and field numbers), the intended usage of the crop, and whether irrigation was available. FSA provides county-level aggregates of these data by both physical acres (where the acres are located) and administrative acres (the county that administers FSA programs). FSA also developed and maintains CLU2 information for each FSA-578 farm. In 2017, FSA data covered about 95 percent of planted acres in the United States for major commodities.
RMA Administrative Data
The RMA and the Federal Crop Insurance Corporation (FCIC) (a wholly owned government corporation that administers the federal crop insurance program) design insurance products, develop standards, and establish premium rates for federal crop insurance. All crop insurance policies are sold to farmers by private crop insurance agents, or Approved Insurance Providers (AIPs),3 who are paid by FCIC to market and service policies.
Michael Alston of RMA told the panel that in 2015, the two largest types of FCIC insurance were revenue policies (75%) and actual production history policies (19%). Revenue policies protect producers against loss of revenue due to price fluctuations and yield loss due to natural causes. Actual production history and yield protection policies insure producers against yield losses due to natural causes. The remaining 6 percent of policies were based on county results rather than individual farms and used adjusted gross revenue, with a fixed dollar amount of insurance. RMA uses county-level production history and county-level estimates of yield from NASS. In 2017, RMA data covered about 85 percent of planted acres of major commodities in the United States.
Farm product insurance agents sell the same federal insurance products at rates that depend on a producer’s productivity and location. For a given producer, premium rates are the same regardless of the insurance provider. Insurance providers compete by providing customer service, part of which includes preparing the data for reporting to RMA. (The data items are similar to what is reported to FSA, as well as to NASS in the CAPS.) In January 2017, David Zanoni from RMA told the panel that AIPs have various systems for collecting these data, including precision agriculture measurements. Examples include subcontracting with a software vendor to process
___________________
2 See https://www.fsa.usda.gov/Assets/USDA-FSA-Public/usdafiles/APFO/support-documents/pdfs/clu_infosheet_2017_Final.pdf [June 2017].
3 A list of AIPs in 2017 can be found at https://www3.rma.usda.gov/tools/agents/companies/indexCI.cfm [July 2017].
machine files straight off the tractor; building their own software to do the same; using custom farm management information systems that allow producers or agents to “draw” their acreage through geographic information systems (GIS) and attach the necessary crop data on mobile software (i.e., an agent uses an iPad in the field to draw the acreage report); and agents buying commercial GPS systems and mapping the fields themselves as a service to the producers. RMA specifies the data that must be reported with insurance applications, but does not specify how the data should be collected from (or for) farmers. RMA has developed a web service application that AIPs can use to report boundary information. It is based on arcGIS software using a commonly accepted agriculture data format, GeoJSON, for reporting by resource land unit (RLU).4
Acreage data are reported to insurance agents/companies for many crops by July 15. Production data are reported to insurance agents/companies by about the end of May following the planting year. There is a lag in the reporting of the data by insurance agents/companies to RMA.
NASS Use of FSA and RMA Data
Definitions of planted acres, failed acres, and production are similar enough among NASS, FSA, and RMA that data from one agency can be used to compute the data for another. CLUs provide geospatial identifiers for most planted acres in the United States, with attribute data available from the FSA-578 form. The Acreage and Crop Reporting Streamlining Initiative (ACRSI) has resulted in greater consistency between RMA and FSA in lists of commodities and reporting dates. It also has resulted in the use of a common reporting system for the collection of FSA and RMA data and RMA’s adoption of CLU/RLU as its approach for identifying the geospatial location of farm fields.
The FSA data account for all farms that participate in FSA programs but not the universe of farms. FSA collects data needed for classifying crop use (grain and seed, forage, or by cropping practice) early in the year and does not require farmers to report the final usage of the crops they planted, while NASS’s data are intended to reflect actual crop use. Also, if irrigation is available for a field, FSA records the acres as irrigated regardless of whether any water was applied to the crop during the growing season. The most challenging difference between the FSA and NASS data is that FSA and NASS farms are not identical (see also Chapter 2).
ASB currently uses FSA data on planted acres as part of its process for estimating planted acres in two ways. First, FSA data on county-level
___________________
4 See https://www.rma.usda.gov/ftp/Publications/M13_Handbook/2017/approved/RES_LAND_UNIT_SUMM.PDF [June 2017].
planted acres serve as a minimum level for NASS planted acres because they represent data for part of the population (a very large part in some areas for some crops). Second, FSA data on planted acres by county benchmarked to previously published state totals are an input to the composite indicator described in Chapter 2.
This discussion illustrates that administrative data from FSA and RMA represent high-quality acreage and production data collected by these agencies during farm program administration. The main challenges with these data are that they are incomplete, as they cover only certain parts of the required NASS estimates and not for all crops, and they are not timely. For example, FSA collects data on planted and failed acres by crop from farmers that participate in its programs (about 95% of total planted acres, with coverage varying by crop and region). FSA data on planted acres by crop are invaluable in preparing NASS estimates for planted acres, but the data on failed acres (potentially useful for estimating harvested acres) are viewed as being incomplete, especially at the time the NASS county-level estimates are developed. RMA collects data on planted acres by crop, failed acres, and production from farms that purchase RMA insurance products (about 85% of total planted acres, with coverage varying by crop and region). NASS uses RMA data on failed acres in estimating harvested acres. NASS views RMA data on failed acres as more complete than those reported by FSA because farmers must report failed acres to receive insurance payments. While precision agriculture measurements, discussed later in this chapter, are another excellent source of recorded data, they also are unlikely to provide complete coverage of all planted acres. The high coverage rates of FSA and RMA data make them valuable to NASS. It should be observed, however, that these data are based on farm policy, and specifically subsidies. A reduction in benefits could also cause participation to drop.
Timing is another important issue for the use of these data. Table 3-1 illustrates that while acreage data from both FSA and RMA are available in the fall as crops progress and have proven highly beneficial for producing acreage estimates (Good and Irwin, 2016), producers are not required to report their production to their insurance agents/companies until they sign up for program participation for the following year (typically the end of May). This timing makes it impossible for NASS to use these administrative data for county production and yield estimates, which typically are published in mid-February. However, NASS production and yield estimates are used for farm payments only after the marketing year is over (May for wheat, July for cotton, August for corn and soybeans). Thus it appears that changes in the timeline for data collection by RMA and/or for release of NASS’s county-level estimates could greatly simplify the task of providing county estimates without sacrificing their availability for intended uses later in the year.
TABLE 3-1 Timeline for Reporting and Use of County-Level Corn and Soybean Data, September–August Marketing Year
| Month | NASS Input | FSA Input | RMA Input | NASS Pub. | FSA Pub. | FSA Use |
|---|---|---|---|---|---|---|
| Jun | JASa, APSb | |||||
| July | FSA-578c | |||||
| Aug | Acreaged | Acreagee | ||||
| Sept | APS | Acreage | ||||
| Oct | Acreage | |||||
| Nov | Acreage | |||||
| Dec | CAPSf APS | Acreage | ||||
| Jan | Acreage | |||||
| Feb | County estimatesg | |||||
| Mar | APS | |||||
| Apr | ||||||
| May | ||||||
| Jun | Yieldh | |||||
| July | ||||||
| Aug | ||||||
| Sep | ARC paymentsi |
NOTE: APS = Acreage, Production, and Stocks; ARC = Agricultural Risk Coverage; CAPS = County Agricultural Production Survey; FSA = Farm Services Agency; JAS = June Area Survey; NASS = National Agricultural Statistics Service; RMA = Risk Management Agency.
aThe June Area Survey collects data on acres planted for corn and soybeans in the current year.
bThe quarterly Acreage, Production, and Stocks surveys capture the flow of planting through harvest for many crops.
cFrom FSA-578, annual acreage report, due June 30 for small grains, July 15 for all other crops. If planted after that date, within 15 days of planting. Change reported within 15 days of a loss.
dAcreage reporting due to insurance agent/company at same time as FSA. There is a lag in reporting to RMA. Generally RMA has about 80% of the acreage covered by mid-August. Sales closing is generally March 15, production reported to agent/company within 45 days after sales closing.
eAcreage spreadsheet is published monthly with increasing completeness over the season at https://www.fsa.usda.gov/news-room/efoia/electronic-reading-room/frequently-requested-information/crop-acreage-data/index [December 2017].
fThe County Agricultural Production Survey collects data on planted acres, harvested acres, and yield or production at the end of the growing season.
gCounty estimates published by NASS.
hThe reporting deadline for producers to send production data to agents/companies, is near the end of May (generally 45 days after sales closing, usually March 15). There may be a delay in sending the data to RMA. RSA yield data are available at https://www.rma.usda.gov/FTP/Miscellaneous_Files/Area_Yield_Data/Final_Yields/ [November 2017].
iPayments under the Agriculture Risk Coverage Program.
The panel understands that RMA is rethinking the reporting of its production data, and the report deadline may be moved forward. RMA officials told the panel that they doubted any new reporting data would be timely enough to enable NASS to use the data in preparing its county-level estimates absent a change in the current publication schedule. However, as discussed in Chapter 2, should RMA production data become available in an appropriate time frame, NASS could consider using these data in conjunction with its own survey data to improve production and yield estimates. RMA data should be particularly helpful to NASS in counties with high RMA coverage. Linkage of RMA data to the list frame also would enhance the utility of the RMA production data, making it feasible to use these data for imputation and estimation as described in Chapter 2. Even if RMA production data were not available in time for the release of NASS county-level estimates on the current schedule, it might be possible for NASS to provide additional estimates for county-level yield/production that previously were not publishable by NASS standards later in the year, after the RMA production data became available and before these estimates were needed by FSA. As described below in the section on near-term enhancements to NASS remote sensing indications, RMA farm-level production data, with location available from the farms’ CLUs, may be useful in training or ground-truthing remote sensing estimates of yield.
RECOMMENDATION 3-1: The National Agricultural Statistics Service (NASS) should collaborate with the Risk Management Agency to obtain relevant individually identifiable acreage and production data and to conduct comparisons with NASS data for the same entity.
Future Enhancements to NASS’s Use of FSA and RMA Data
RECOMMENDATION 3-2: The National Agricultural Statistics Service (NASS) should collaborate with the Farm Services Agency (FSA) and Risk Management Agency (RMA) in the development of an approach for using RMA data in conjunction with NASS survey data to prepare crop estimates for counties for which NASS estimates are withheld. These estimates should be available in time to be used by FSA.
RMA has extensive experience in yield modeling and county yield forecasting that may be useful for NASS to explore. A report by Coble and colleagues (2010) provides an extensive review and summary of the literature on crop yield modeling. The challenges highlighted by these studies include evidence of yield heteroscedasticity over time (e.g., Atwood et al., 2002, 2003; Gallagher, 1987; Harri et al., 2009; Hazell, 1984; Traxler et
al., 1995; Yang et al., 1992) and a trend toward increases in mean yields due to technological advances (e.g., Goodwin and Ker, 1998; Zhu et al., 2008). Furthermore, McCarl and colleagues (2008) argue that variability in yield is nonstationary and influenced by climate. Of particular relevance to NASS’s county-level yield estimation goals are the studies examining the spatial heterogeneity of yield distributions. Glauber (2004) and Babcock (2008) argue that this heterogeneity can be explained partly by varying weather/climate conditions and resource endowments (e.g., soil quality, topography). The authors demonstrate how publicly available data, such as monthly total rainfall, mean temperature, and mean Palmer Drought Index, can be used to model heterogeneity in yield. They further argue “that a significant amount of the county-to-county variation in rates may be explained by differences in soil types, elevation, slope, production systems employed and other data that should be readily collectible and either stable across time or with changes that can be documented” (Coble et al., 2010, p. 75).
To address estimation challenges entailed in modeling yield, the Statplan database, which contains historical insurance records from 1948 forward, was constructed (Coble et al., 2010, p. 15). It appears that access to this database could be very useful for NASS’s yield modeling efforts. According to Coble and colleagues (2010, p. 29), “RMA uses credibility weighting to smooth rates among adjoining counties. Credibility in the RMA process is a function of net acres insured so a historical record of net acres insured is retained in the Statplan process. . . . RMA refers to the surrounding counties as the county group or credibility complement.”
As described in Coble et al. (2010, p. 38), the “RMA Type/Practice Rating Methodology Interim Underwriting Guidelines” describe the procedure RMA currently uses to aggregate counties with similar type/practice factors:
[I]n deriving the TpFactors for irrigated and non-irrigated practices in the western States, grouping a smaller number of geographically clustered counties within the state is more typical since the average rainfall changes significantly over shorter distances. In contrast, the Eastern States have rainfall patterns that are more stable across greater distances and grouping more counties, whole states or multiple states may be appropriate. Determination of the county groupings for use in developing type/practice factors is largely left to the subjective judgment of the RMA regional offices.
A credibility procedure similar to that described above is then applied.
This approach of grouping counties with similar type/practice factors is sharply different from the NASS approach of developing estimates based on administrative boundaries, such as county, Agricultural Statistics District (ASD), and state. Figure 3-1 illustrates that differing values of key variables (in this case cash rents) do not necessarily follow ASD boundaries (the dark
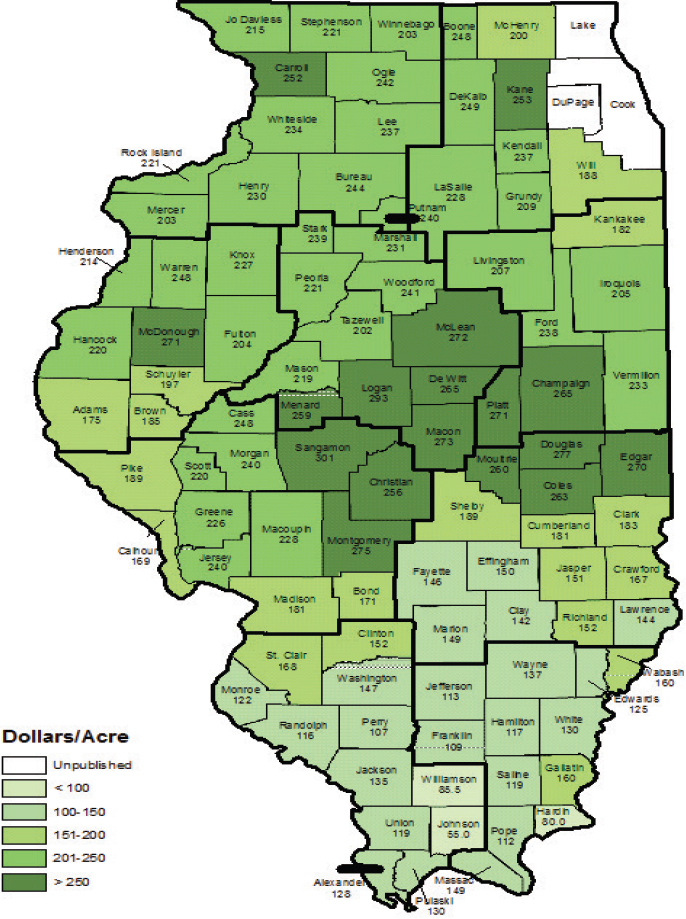
SOURCE: National Agricultural Statistical Service, U.S. Department of Agriculture, QuickStats. See https://www.nass.usda.gov/Statistics_by_State/Illinois/Publications/County_Estimates/2016/IL_Cash_Rent_Map [December 2017].
lines in the figure) and that key variables may be highly heterogeneous across counties. Adopting the approach of grouping counties with similar characteristics for purposes of model fitting or estimation regardless of the administrative units (ASD, state) to which they belong might result in improved estimates. Keith Coble, in his discussion with the panel in January 2016, noted that soil type is a key variable for grouping of farm-level data to estimate yield. He noted that including spatial relationships smooths outliers. Another way to account for such variability is to explicitly include spatial variation in models (see Appendix C).
NASS would benefit from exploring the impact of soil productivity on yield by defining estimation groups based on the National Commodity Crop Productivity Index (NCCPI).5
A NEW SOURCE OF RECORDED DATA: PRECISION AGRICULTURE
Precision agriculture is a site-specific crop management approach that depends on measuring field variability in crops. Precision agriculture is enabled by GPS systems, computers, and sensors built into modern combine harvesters and other equipment. Penetration of tractor guidance using GPS had grown to about 50 percent of planted acres for such crops as corn, rice, and peanuts by 2013 (Schimmelpfennig, 2016). Penetration of GPS soil and yield mapping technologies lagged behind, with adoption rates of about 25 percent. At a minimum, and relevant to NASS crop estimates, these GPS technologies can provide the GIS boundary of the field planted, area planted, and yield, all by commodity. Precision agriculture measurements are becoming highly valuable.
According to Blake Hurst (2015) of the Missouri Farm Bureau Federation in testimony to Congress in 2015:
Most combines traveling across fields in the Midwest this fall had a GPS receiver located in the front of the cab. Although agriculture has been experimenting with this technology for a decade or so, only now is the industry starting to consider all the uses of this transformative technology. . . . If 1,000 machines randomly spread across the Corn Belt were recording yield data on the second day of harvest, that information would be extremely valuable to traders dealing in agricultural futures.
___________________
5 The NCCPI is an index produced by the Natural Resources Conservation Service (NRCS), which rates land according to its potential for production based on soil and other physical characteristics. There are some commodity-specific indices, but only the general one is considered here. In other words, the same covariate applies for corn and for soybeans for any county that produces both crops. For more information about the NCCPI, see the user guide (U.S. Department of Agriculture-Natural Resources Conservation Service, 2012).
Traders have traditionally relied on private surveys and U.S. Department of Agriculture yield data. These yield estimates are neither timely nor necessarily accurate. But now, real-time yield data is available to whoever controls those databases. The company involved says it will never share the data. Farmers may want access to that data, however, and they may not be averse to selling the information to the XYZ hedge fund either, if the price is right—but that’s only possible if farmers retain ownership and control of the data.
Hurst went on to describe the efforts of a number of farm and commodity organizations, agriculture service providers, and agriculture technology providers (ATPs) to collaborate around several issues. First was the development of a set of principles for data privacy and security for farm data. Second was the design of a transparency evaluator, an automated tool to assist farmers in assessing the data protection/sharing features in the “fine print” in contracts. Third was the organization of an agriculture data repository that would protect data but also make them available for specific uses approved by the farmer.
At its January 2016 meeting, the panel heard from Mary Kay Thatcher, American Farm Bureau, who provided an update on these initiatives. She reported that additional organizations have signed on to these collaborative efforts, agreeing with the principles developed. The transparency evaluator has been completed and allows farmers to compare and contrast specific issues within contracts. It provides a seal ATPs can use that demonstrates their adherence to the data principles and commitment to data transparency. Finally, the Ag Data Coalition was established to provide a farmer-controlled, secure, and flexible data repository, established as a cooperative. In 2017, the collaborating entities joined forces with the Grower Information Services Cooperative to announce the AgXchange, an independent data repository available commercially through the Growers Ag Data Cooperative.6
In the past, only the government had access to most U.S. ground (as opposed to aerial) farm-level data for a crop. But some of these ground farm-level data now are available through precision agriculture measurements to private organizations that provide decision-making tools and analysis for growers submitting the precision agriculture data. Monsanto Corporation and Dow AgroSciences (2016) are two such companies that may offer farm management tools, site-specific weather information, and seed planting prescriptions to individual farmers who submit their precision agriculture data. Current data sharing and privacy agreements allow the parent company to use the aggregated data obtained from its farm
___________________
6 See http://agdatacoalition.org/newsroom [August 2017].
customers. While the company may not have access to data from all or even most growers of a crop, it may have enough information to develop credible estimates, and it is not clear how these estimates might be used. NASS estimates have always been freely available to everyone on the official release date. If a private organization had better or equivalent earlier estimates, it could use them to speculate in commodity markets.
The panel offers the following recommendations for facilitating NASS access to data collected via precision agriculture measurements.
RECOMMENDATION 3-3: The National Agricultural Statistics Service should collaborate with farmer cooperatives to ensure that it is one of the government agencies with which farmers can choose to share their relevant precision agriculture data.
RECOMMENDATION 3-4: The National Agricultural Statistics Service (NASS) should collaborate with current vendors of software that may be used to report relevant farm-level data directly to the Farm Services Agency or indirectly to the Risk Management Agency through Approved Insurance Providers/insurance agents to ensure that the software allows the option of reporting relevant data to NASS.
RECOMMENDATION 3-5: The National Agricultural Statistics Service should develop a precision agriculture reporting option for the County Agricultural Production Survey/Acreage, Production, and Stocks survey system. Farmers who reported relevant precision agriculture data would either not receive an additional survey form or receive one that was simplified and easy to use.
RECOMMENDATION 3-6: The National Agricultural Statistics Service (NASS) should work to educate farmers that use precision agriculture concerning the advantages of using that technology to report to NASS. A convincing argument might be that having NASS collect the relevant data with a promise of privacy and making summary data available to all farmers at the same time would keep the playing field level.
According to Johansson and colleagues (2017):
The fact that USDA reports its estimates freely means that both buyers and sellers can have equal information about the supply and demand of a crop. Such information may come directly through USDA’s own reports, but often reaches users through news and information sources that depend on USDA reports to inform their clients and customers. In a market without
this free information, large firms might well be able to invest in market intelligence that small firms and farms would not have available.
DATA OBSERVED BY SATELLITE AND OTHER REMOTE SENSING TOOLS
An increasing number of satellites, aircraft, drones, flux towers, and weather stations collect geospatially referenced data that may be useful for monitoring crop-growing conditions. These data may be available from other government agencies or for purchase from private companies.7 The current NASS program based on satellite remote sensing and other external sources of information provides indications of planted acres and yield, but only for some crops and some regions.
A number of private organizations are now producing satellite-based estimates of yield and publishing them as alternatives to the official NASS monthly estimates of state-level yields during the growing season. Many of these organizations are publishing estimates frequently (daily or weekly) and at a fine level of detail (county). These estimates are direct competitors with the NASS state-level in-season yield forecasts that are not within the purview of this panel. In time, however, these methods may lead to estimates of county-level final yield that are viewed as competitors with those produced by NASS. Of course, one of the disadvantages of any county-level estimates prepared by these companies would be that the methodology used to derive them would be proprietary and not publicly released. At this stage of development, these companies judge the quality of their estimates by comparison with end-of season estimates from NASS.
The Agricultural Research Service (ARS) has a system of energy flux towers in the Midwest that provide ground-based remote measurements of a number of variables potentially relevant in the preparation of yield estimates over time. Each flux tower has a GIS location and collects a vast array of data, depending on its sensors. ARS uses these data, in conjunction with satellite data, to quantify carbon, measure production, and understand ecosystem dynamics. It would be valuable for NASS to consider how it might use the data from these flux towers as input to improve its yield models, especially those that link ground-based farm-specific reports with location information. ARS also is conducting research on the use of the OCO-2 satellite8 data in conjunction with the flux tower data (Wood et al., 2017), especially to monitor carbon emissions and photosynthetic
___________________
7 For example, for data collected by drones, see http://agribotix.com [July 2017].
8 The OCO-2 satellite was launched July 2, 2014. It carries an imaging sensor that can detect chlorophyll fluorescence and hence provide estimates of crop growth.
production, commonly known as gross primary productivity (GPP). NASS would be well advised to monitor the progress of this research.
In documentation provided to the panel at its November 2015 meeting, NASS included a list of weather-related resources. These include the National Oceanic and Atmospheric Administration’s (NOAA) Climate Divisional Database, which contains a variety of weather and precipitation data;9 Oregon State University’s Program in Statistics and Methodology (PRISM),10 which provides station-level temperature and precipitation data that may map to CLUs; the Applied Climate Information System, operated and maintained by NOAA Regional Climate Centers;11 and the United States Drought Monitor.12
Multiple Sources of Remote Sensing Data, Sources of Uncertainty, and Models
Each of the sources being considered as inputs to modeling has footprints on the earth’s surface:
- Satellite remote sensing. Each pixel in an earth image covers a square area on a flattened earth. The size of the square varies depending on the sensor, from less than 1 meter to 1 kilometer in linear measure. The projection used to flatten the earth also varies. Merging data from different sensors and merging with other sources of data thus requires a complex process that takes into account the position, orientation, and geometry of each pixel on the flattened earth and the projection used for flattening. The nature of the response recorded in each pixel also must be addressed. This is a convolution of what is actually on the ground and the optics of the sensor; in the simplest case, it is an average over the area of the pixel. When the pixel’s geometry is overlaid on another data source, the unknown heterogeneity of the pixel becomes important, although in most cases it is simply assumed away.
- Digitized county boundaries. These boundaries are commonly available, created from published maps, and have a positional accuracy of approximately 0.5 millimeter at the scale of the map. For example, boundaries digitized from 1:100,000 mapping will have a positional accuracy of roughly 50 meters. Some sources may be more accurate: the Topologically Integrated Geographic Encoding
___________________
9 See https://catalog.data.gov/dataset/noaas-climate-divisional-database-nclimdiv [July 2017].
10 See http://www.prism.oregonstate.edu [July 2017].
11 See http://www.rcc-acis.org/index.html [July 2017].
12 See http://www.droughtmonitor.unl.edu [July 2017].
- and Referencing (TIGER) data used by the U.S. Census Bureau have been upgraded to roughly 5 meter accuracy. Boundaries of standard reporting units are likely expressed in a common coordinate system, such as Universal Transverse Mercator (UTM), state plane, or latitude/longitude.
- CLUs. The CLUs used by the U.S. Department of Agriculture (USDA) have been digitized from digital orthophotos. The standard digital ortho quarter quad (DOQQ) program has a stated and tested positional accuracy of 6 m, although the orthophotos used by USDA in some areas may be more or less accurate. Unless CLUs have been snapped to county boundaries during the digitizing process, they will not match, and instead, small slivers will exist between the county boundaries and those CLU boundaries that follow county lines.
In summary, each source of geospatial data comes with its own geometry, expressed in one of a number of coordinate systems. Combining sources as input to models requires a complex process of addressing spatial mismatch that takes into account map projections and coordinate systems. Suppose, for example, that the modeling effort seeks to predict yield y over a small area, say, a CLU, using a number of input variables xi, i = 1, n derived from geospatial layers. Estimating each x for the small area from data whose spatial units do not precisely match the small area introduces a degree of uncertainty. The degree of uncertainty depends on the size of the original spatial unit relative to the size of the area to be estimated. For satellite remote sensing, the natural heterogeneity of pixel contents should be addressed, but likely will be assumed away.
NASS Satellite Remote Sensing Indications
The methodology used for producing NASS satellite remote sensing indications of planted acres was first described by Graham and Iwig (1996). The methodology for planted acres has not changed appreciably since that time, although the newer Landsat satellites have a smaller pixel size, and FSA CLUs now provide training data for classification, whereas in the 1990s, the June Area Survey was used as the source of training data for classification.
Classification
The Cropland Data Layer (CDL) is a georeferenced, crop-specific data layer of land cover created annually by NASS for the continental United States using Landsat 8’s moderate-resolution (30 m) satellite imagery,
Deimos-1 and UK-DMC2 moderate-resolution (22 m) satellite imagery, and agricultural ground truth. It offers nationwide coverage of pixels classified by land use.13 The CDL is created using 70 percent of the FSA CLU and Form FSA-578 data as ground truth along with satellite data to classify pixels by crop in a decision tree. The remaining 30 percent of CLUs are used in a pixel-by-pixel comparison to assess the quality of the classification. NASS also uses the U.S. Geological Survey (USGS) Land Cover Database as a training and validation dataset for nonagricultural categories. Software used for classification includes ERDAS Imagine 2011, Rulequest See5/C5, and SAS.
The accuracies associated with crop-specific covers for major crops in selected states are shown in Table 3-2. The table counts only “buffered” pixels, that is, pixels that are wholly contained within a field, and ignores pixels that straddle a field edge and are therefore planted only partially with the crop. Errors of omission occur when a pixel that does indeed contain the crop is nevertheless not classified as such from remote sensing; errors of commission occur when a pixel is classified incorrectly as containing the crop. Remote sensing clearly has the greatest difficulty identifying winter wheat in Minnesota, followed by cotton in Oklahoma. But for other crops, notably corn and soybeans, the imagery clearly provides high levels of accuracy, at least for these buffered pixels.
Estimation of Planted Acres
NASS uses the classified pixels from the CDL, June Area Survey data, and the regression described by Battese and Fuller (1981) adjusted according to Walker and Sigman (1982) to estimate planted acres. The CDL pixel count is an auxiliary data source in the unit-level regression model, the unit in this case being a June Area Survey segment. The CDL pixels can be matched to the segment boundaries from the June Area Survey. County estimates are constructed by using the coefficients estimated for the state along with the constant term adjusted based on June Area Survey segments in the county. In 2014, satellite remote sensing estimates for planted acres were available for corn in 37 states, for soybeans and wheat in 27 states, for alfalfa in 14 states, and for cotton in 11 states. Estimates for planted acres of barley, beets, canola, dry beans, peanuts, potatoes, rice, sorghum, sugarcane, sunflowers, tobacco, durum wheat, and spring wheat were each available in fewer than 7 states.
A regression model such as the Battese-Fuller (1981) model provides estimates of uncertainty. However, the variance is likely to be understated because when estimates are rolled up for larger areas (estimates from pixels
___________________
13 See https://nassgeodata.gmu.edu/CropScape [July 2017].
TABLE 3-2 Examples of Classification Accuracy
| Commodity | State | Production | Buffered Pixels | Pixels Classified as Commodity | Pixels Correctly Classified as Commodity | Actual Pixels of Commodity | Percentage Pixels Incorrectly Classified as Commodity | Percentage Pixels Incorrectly not Classified as Commodity |
|---|---|---|---|---|---|---|---|---|
| Corn | Iowa | 2740.5 million bushels | 944,966 | 397,529 | 391,624 | 396,284 | 1.2 | 1.5 |
| Corn | Ohio | 524.7 million bushels | 928,450 | 226,117 | 220,008 | 225,195 | 2.3 | 2.7 |
| Soybeans | Illinois | 560.9 million bushels | 939,373 | 280,544 | 273,966 | 279,843 | 2.1 | 2.3 |
| Soybeans | Arkansas | 146.6 million bushels | 949,805 | 272,025 | 264,779 | 280,643 | 5.7 | 2.7 |
| Cotton | Texas | 7436 thousand bales | 1,964,758 | 222,419 | 209,102 | 233,831 | 10.6 | 6.0 |
| Cotton | Oklahoma | 350 thousand bales | 943,356 | 14,729 | 12,807 | 15,541 | 17.6 | 13.0 |
| Winter Wheat | Kansas | 4674 thousand bushels | 962,256 | 205,127 | 196,774 | 206,806 | 4.9 | 4.1 |
| Winter Wheat | Minnesota | 75 thousand bushels | 969,727 | 276 | 94 | 121 | 22.3 | 65.9 |
SOURCE: Based on data from https://www.nass.usda.gov/Research_and_Science/Cropland/sarsfaqs2.php [August 2017]. Data from links are in answer to question 12.
rolled up to CLUs, for example), spatial dependence becomes an issue. The estimates being rolled up are not independent, and the result is that variance is likely to be underestimated.
Estimation of Yield
The NASS CDL classification is used to establish in-season corn and soybean fields for estimating yield. Currently, yield estimates are developed only for corn and soybeans, although yield estimates for other crops are under consideration.
The current methodology for estimating yield was implemented in 2013 and is described by Johnson (2014). The Normalized Difference Vegetation Index (NDVI) and Daytime Land Surface Temperature (DLST) have been demonstrated to be correlated with plant yield during the growing season for a variety of commodities in a number of references, including Johnson (2016) and Hatfield (1983). Johnson (2016) states that the peak correlation between yield and NDVI during the growing season for corn and soybeans was .8 and .7 respectively, and that correlation with DLST was negative .6 and negative .5, respectively. The seasonal NDVI profile describes the crop growth and development; surface temperature provides additional information on potential crop stress conditions.
NASS computes an 8-day composite of the NDVI and daytime land surface temperature from the Moderate Resolution Imaging Spectroradiometer (MODIS) on two earth science research–oriented satellites, Terra and Aqua, operated by the National Aeronautics and Space Administration. MODIS provides NDVI measurements with 250 meter resolution and daytime and nighttime land temperature measurements with 1 kilometer resolution.
According to Johnson (2014), a data mining software product, Rulequest’s Cubist,14 is used to develop a predictive model for yield. A grid-based reference frame, the 250 meter sinusoidal MODIS-based equal-area map projection, has been selected to prepare the data for input to the model. With this reference frame, a 250 meter resolution raster-based mask file is created for each crop and state/county to identify the classified 30 meter Landsat pixels within the state/county border. Boundary definitions are derived from Esri’s Data and Maps Detailed Counties shapefile. A majority-area rule is used to assign pixels split by two or more states/counties. Each final state mask is aligned spatially with the 250 meter MODIS reference grid. Counts of classified pixels of the crop of interest (corn or soy) within each 250 meter reference grid are determined. Johnson (2014) reports that 16–49 pixels are assigned to each grid for a crop. The
___________________
14 Described on the Rulequest website as a machine learning tool that automatically determines the best-fitting piecewise linear model to predict a continuous outcome variable.
total number of classified pixels of the crop of interest in each MODIS grid cell are divided by the maximum possible to derive an areal proportion. Finally, that proportion is compared with .9 to determine whether that grid cell contained enough of the crop of interest to be used in estimation. County-level means of NDVI and land surface temperature are computed for each of the 32 time periods from mid-February to mid-October. Inputs to the model include the 32 values collected for NDVI and land surface temperature during the season; the areal proportion of pixels of the crop of interest; and the NASS-estimated county yields for a 6-year period, 2006–2011. Johnson (2014) reports that midseason values of NDVI and land surface temperature were most important in the predictive model, and that a county-level within-sample R2 of .93 was found with both crops.
The model and its estimated parameters are used with current-year satellite measurements of NDVI and land surface temperature in projecting yield for the current year to provide out-of-sample forecasts. Johnson (2014) reports that results compared reasonably well with published official NASS estimates, with an R2 of .77 for corn and .71 for soybeans. The root mean square errors (RMSEs) were 1.26 and .42 metric tons per hectare. Johnson also “hindcast” years 2006 through 2011 showing similar results to those for 2012 (e.g., a hindcast of 2009 would remove the data from 2009, refit the model, and use the model to predict results for 2009). The resulting R2 for corn ranged from .66 to .77, with an RMSE of .96 to 1.26 metric tons per hectare, and for soy ranged from .47 to .71, with an RMSE of .38 to .47 metric tons per hectare.
At present, NASS does not provide measures of uncertainty for its remote sensing estimates of acreage or yield, even though both are derived from models. ASB considers indications for planted acres and yield for selected regions and crops when preparing estimates; however, as shown in Table 2-1 (in Chapter 2) these indications receive little weight in computation of the composite indication. The panel concludes that NASS does not yet view the current remote sensing indications as being as accurate as other sources of information.
The Statistics Canada/Agriculture and Agri-Food Canada Approach to In-Season Estimates of Yield
At its January 2017 meeting, the panel heard from Gordon Reichert about Statistics Canada’s Integrated Canadian Crop Yield Forecaster (ICCYF) (see also Reichart et al., 2016). The ICCYF is a crop yield monitoring model that uses remote sensing and agroclimatic data along with survey data to estimate yield during the growing season. (See Chipanshi et al. [2015] for an evaluation of the model, and Newlands et al. [2014] for a more detailed description of the model.) Based on the results of the
modeling effort, Statistics Canada decided in 2016 that it could replace one of its growing season surveys, the September survey, with the remote sensing estimate, thereby reducing the burden on farmers, reducing costs, and enhancing timeliness.
The goal of the model is to predict final crop yield for the current year. Hence the model’s dependent variable is the crop yield estimate from the November Farm Survey. During development of the model, 80 potential explanatory variables were considered, including same-year yield estimates from the July survey, NDVI (1 km resolution) from the NOAA series of satellites, and many weather and precipitation variables obtained from Agriculture and Agri-Food Canada’s (AAFC) Versatile Soil Moisture Budget (VSMB) model. These weather variables were obtained from 416 climate stations throughout the agriculture region of interest and were prepared using information about soil type and crop phenology. The variables ultimately selected for the model include daily measures of the cumulative (through the growing season) growing degree days (GDDs), cumulative precipitation, and crop moisture stress. Also included are the standard deviation of daily GDD and the standard deviation of daily precipitation.
The ICCYF uses a stepwise selection process—the least absolute shrinkage and selection operator (LASSO)—to determine the variables to use as independent variables. Previous work (Bédard and Reichert, 2013) had established that five of the climate variables should be included.
The ICCYF raises several points of potential relevance to NASS. First, it makes use of agroclimatic data not from remote sensing but from a large number of weather stations. Second, Statistics Canada uses the VSMB model to integrate the agroclimatic data, along with soil type and crop phenology information, to derive a variety of relevant county-level input variables. Two of the key input variables are measures of uncertainty: the standard deviation of the daily stress index and the standard deviation of daily GDD. Chipanshi and colleagues (2015) provide an evaluation of the ICCYF model for spring wheat, barley, and canola. Their paper describes how the authors selected three model comparison measures: the coefficient of determination (R2), the mean absolute percent error (MAPE), and the Nash-Sutcliffe efficiency index (Krause et al., 2005; Szulczewski et al., 2012) (one minus the sum of squared differences between predicted and observed divided by the sum of squared differences between observed and the mean of observed values). Reichart and colleagues (2016) further evaluated the model for 15 crops in total. The authors chose to examine these measures using a leave-one-out validation approach. They concluded that the model results and September survey results at the national level were generally comparable for the 15 products considered. Their conclusions led to the adoption of the ICCYF as a replacement for the September survey in 2016.
A model such as the VSMB could prove very helpful to NASS in identifying and preparing relevant independent variables that could be used to improve both remote sensing models and area-level models for yield. Most likely such a model could be obtained, used, and/or adapted from work done by other agencies within USDA, such as ARS. Having such a model also would help NASS make better use of data from ground-based weather stations, and possibly even from flux towers.
Near-Term Enhancements to NASS Remote Sensing Indications
Estimating Acreage
Currently, NASS uses 70 percent of FSA data for “training” to classify pixels and withholds 30 percent for assessing the accuracy of the classification. NASS uses the June Area Survey data by segment in the Battese-Fuller regression model (Battesse and Fuller, 1981) for estimating acreage by crop. NASS could consider using the 30 percent of FSA CLUs withheld for accuracy assessment as ground truth for the Battese-Fuller regression, either as a replacement for or in addition to the June Area Survey segments. NASS also could consider using the Battese-Harter-Fuller (Battese et al., 1988) regression model instead of the Battese-Fuller model since there is no stratification to account for with the use of FSA CLUs. Additionally, NASS could consider using the uncertainty measures from these regression estimates in developing its uncertainty measures for remote sensing estimates of acreage.
RECOMMENDATION 3-7: The National Agricultural Statistics Service should consider using the 30 percent of Common Land Units withheld to assess the accuracy of classification in the Battese-Fuller regression either as a replacement for or in addition to data from the June Area Survey segments.
Estimating Yield
RMA data can currently be used to identify insured acres as a proxy for planted acres as well as failed acres by CLU/RLU and production for a farm by crop. RMA has required reporting by CLU/RLU for all farms since 2016, but collected these data for many farms in preceding years. Data on acreage are reported to insurance agents by July 15 of the crop year. Farm-level production is reported to insurance agents by about May 20. There are delays in the reporting of data to RMA. This dataset would provide ground truth information for use in building a model that would use the model and fitted parameters from the previous year along with satellite remote sensing data from the current year to estimate yield. The RMA data can provide
yield information for a specific GIS location on the ground. Location information can be linked to satellite measurements, as well as to information about land productivity, such as the NCCPI, and to weather data.15
Additional Sources of Remote Sensing Data
If NASS does not use the most up-to-date satellite data when they are pertinent, private organizations using these data may produce better estimates. The increasing number of satellites and the complex types of information they provide make it an ongoing challenge to incorporate the latest satellite data into estimates in a timely fashion. As NASS states in its Estimation Manual,16 “Having the flexibility to use multiple sensors and adapt to new ones is essential in the NASS operational model.” Many agencies within USDA are considering how to develop improved production/yield estimates, especially using satellite data and growth models. In addition to NASS, the Foreign Agricultural Service and ARS are examples. NASS needs to be a full partner in these efforts.
The JASON Deliberative Study (2016) entailed a comprehensive review of the field of remote sensing and the many new satellites and sensors that have been launched in recent years, and this review might provide useful data for NASS. While NASS is already using Landsat data (30 meter resolution), the JASON report also draws attention to similarly free data from the European Space Agency (ESA)-2 satellites (10 meter resolution). It further suggests possible augmentation with data purchased from Rapideye (from the Satellite Imaging Corporation, with five satellites and 5 meter resolution) and the Disaster Monitoring Constellation (a number of remote sensing satellites constructed by Surrey Satellite Technology, operated by the Disaster Monitoring Constellation for International Imaging [DMCii], and designed to be comparable in resolution to Landsat). NASS reported to the panel that it has access to the second-generation DMC satellites Deimos-1 and UK-DMC2, with moderate resolution (22 meter). In its report, JASON also mentions ResourceSat-2 (launched in December 2016), with sensors that include the Advanced Wide-Field Sensor (AWiFS) with 56 meter resolution, the Linear Imaging Self-Scanning Sensor (LISS-III) with 23.5 meter resolution, and the LISS-IV Camera with 5.8 meter resolution. Each of these
___________________
15 NASS has identified the following potential sources of weather data: (1) NOAA National Climactic Data Center—Climate Divisional Database nCLIMDIV (http://catalog.data.gov/dataset/noaas-climate-divisional-database); (2) Oregon State University’s PRISM (http://www.prism.oregonstate.edu); (3) Applied Climate Information System (http://www.rcc-acis.org/index.html); (4) United States Drought Monitor (http://www.droughtmonitor.unl.edu); and (5) NOAA/National Weather System (NWS) Advanced Hydrologic Prediction Service (http://www.nws.noaa.gov/ohd/ahps). All urls were active as of December 2017.
16 NASS Estimation Manual, Volume 2, Section 6.2.3. Provided to the panel.
sensors has its own repeat interval (the number of hours or days between successive imaging of a given point), its own spectral characteristics (the portion or portions of the electromagnetic spectrum sensed by the imager), and its own acquisition details (cost and length of time between the capturing of an image and its availability for analysis by an agency such as NASS).
In addition to the sensors discussed in the JASON report, many other newer sensors are being developed for deployment on satellites, aircraft, drones, towers, and agricultural machinery. Mention has already been made of OCO-2, a satellite designed to detect emissions of special relevance to plant growth. Radar, light detection and ranging (LIDAR), and microwave are examples of types of active sensors that both emit and receive radiation, in contrast to the passive basis of traditional remote sensing.
The days when only the federal government possessed the resources to invest in remote sensing are long gone, and the private sector and farmers themselves are increasingly important sources of data for crop monitoring and estimation. The number of sensors that might be useful to NASS is clearly growing rapidly, and at an increasing rate. To NASS this should be a simple matter of costs and benefits: How do the costs (including the programmatic costs of switching to a new source of imagery) compare with the benefits? Finer spatial resolution will require more powerful processing, and is unlikely to yield more accurate identification of crops except in extremely small fields. Estimation of total crop area, on the other hand, will be improved with smaller pixels because of the issues at field boundaries. If each pixel is length b on a side and assuming a square field of B on a side, the number of edge pixels (pixels rejected as compromised by the boundary) will be approximately 4B/b, covering an area of 4Bb, or 4b/B as a proportion of the total. Thus the error due to edge pixels is proportional to b, and reducing pixel size from 30 m to 10 m can be expected to reduce error in estimating field size and thus yield by a factor of 3.
RECOMMENDATION 3-8: The National Agricultural Statistics Service should explore collaboration with other U.S. Department of Agriculture agencies that are actively involved in remote sensing applications to obtain access to data with finer spatial resolution and possibly also to share in the costs of processing those data.
NASS should continue to focus on producing timely and accurate estimates. In light of changing markets and emerging data sources, such as precision agriculture measurements and remote sensing measurements, it should consider whether purchasing private data would support this effort.
There are disadvantages to private data. Transparency of source data and methods may be difficult for proprietary data vendors. Data vendors may change their products over time. They may change their marketing
strategy. They may go out of business. However, they may also offer data for purchase that are not easily produced by NASS (or other government surveys). NASS should evaluate the costs and benefits of external data, considering the following questions: Do the data fill a gap? How closely do the data fit with NASS concepts and definitions? What is the time frame of the data? How representative are the data? How consistent are the data, and how likely is it that consistency will be maintained? How transparent are the data?
RECOMMENDATION 3-9: The National Agricultural Statistics Service (NASS) should keep abreast of emerging data sources; how they are used; and how they might be used to improve county estimates, especially of yield. Based on a careful evaluation, NASS might consider purchasing data.