
Appendix A
Supporting Documentation for the Survey*
SAMPLING AND WEIGHTING PLANS
Sampling
This document, dated May 25, 2016, updates the sampling-and-weighting-plans document dated April 1, 2015, based on committee comments, an analysis of data files received from the Department of Veterans Affairs (VA), and the selection of a sample of veterans from the data files received from the VA. Italics font indicates new material. Tables A-1 and A-2 are also new material.
A two-phase sample design will be employed for the survey of Operation Enduring Freedom/Operation Iraqi Freedom/Operation New Dawn (OEF/OIF/OND) veterans. In the first phase of sampling, the VA selected a random sample of 25 percent of all OEF/OIF/OND veterans. The Institute of Medicine (IOM)1 requested that the VA provide an identifier, plus 27 additional auxiliary variables for each sampled veteran. Westat will use a subset of the auxiliary variables to stratify the first-phase sample and then select a stratified second-phase sample. The identifiers for the second-phase sample will be provided to the VA, who will then provide back to Westat the identities and contact information for these veterans. Westat will use the contact information to conduct data collection.
The VA has provided Westat two data files. One file, containing 470,606 records, provides data for a 25 percent sample of OEF/OIF/OND veterans who have had in-theater service and according to VA records were alive on October 1, 2015. The data source for this file was the OEF/OIF/OND roster file. The second file, containing 724,738 records, provides data for a 25 percent sample of OEF/OIF/OND veterans who were not deployed to Iraq or Afghanistan. The VA created this second file from multiple
___________________
* The following documents were prepared by Westat, an independent research corporation, which assisted the committee with the design, implementation, and analysis of the survey.
1 At the time the survey work began, the Institute of Medicine was a program unit in the National Academies of Sciences, Engineering, and Medicine. After an organizational restructure in March 2016, the Health and Medicine Division of the National Academies carries out the work previously undertaken by the Institute of Medicine.
TABLE A-1a Variables on VA-Provided Data Relevant to the Selection of the Second-Phase Sample
| Type of Variable | Description | Percent Missing | |
|---|---|---|---|
| Deployed | Not Deployed | ||
| Demographic | Date of birth | 0.04% | 81% |
| Sex | 0.02% | 81% | |
| Military | Deployment status | 0% | 0% |
| Component (active or reserve) | 0% | 100% | |
| Rank | 0% | 100% | |
administrative data sources, with a veteran’s demographic variables being included only if the veteran appeared in VA medical records. Table A-1a describes the demographic and military variables on these two files relevant to the selection of the second-phase sample.
The VA had been asked to provide particular demographic and military variables for use as stratification variables. One of the requested military variables was Branch of Service, but this variable was missing on both data files. The requested demographic variables and the other requested military variables were present on the data file of deployed veterans. However, these variables were not present on the data file of veterans who had not been deployed. Because sex and date of birth were not present on the file of non-deployed veterans, we requested a second file for non-deployed veterans that contained sex and date of birth. On the second file provided by the VA, sex and date of birth were recorded only for the non-deployed veterans who had received mental health services in the last 24 months.
A medical variable that was present on both data files was ANYMH24, an indicator for the use of VA mental health services in the last 24 months. The proportions of veterans in the provided samples that have used VA mental health services in the last 24 months was 30 percent for deployed veterans and 11 percent for veterans who had not been deployed. Another medical variable that was present on both data files was OPALL_CNT24, the number of mental health outpatient encounters with a mental health diagnosis code in the last 24 months. This variable was recorded only for records in which ANYMH24 indicated the veteran had received mental health services in the last 24 months. When OPALL_CNT24 was not missing it was positive for 67 percent of deployed veterans and for 57 percent of non-deployed veterans. Table A-1b contains additional information about the distribution of OPALL_CNT24 for those veterans who had used VA mental health services in the last 24 months.
There are several different objectives in using stratification for selecting the second-phase sample. One objective is to oversample low-prevalence domains in order to improve the precision of domain
TABLE A-1b Distribution of the Non-Missing Values of OPALL_CNT24, the Number of Mental Health Outpatient Encounters with a Mental Health Diagnosis Code in the Last 24 Months
| Statistic | Deployed | Not Deployed | |
|---|---|---|---|
| OPALL_CNT24 = 0 | Number of records | 47,118 | 33,893 |
| Proportion of records | 33% | 43% | |
| OPALL_CNT24 > 0 | Number of records | 94,658 | 45,456 |
| Proportion of records | 67% | 57% | |
| Mean | 17.0 | 17.8 | |
| Minimum | 1 | 1 | |
| First quartile | 3 | 3 | |
| Median | 6 | 7 | |
| Third quartile | 15 | 16 | |
| Maximum | 1,438 | 1,002 |
estimates and to increase the power of associated statistical tests. We plan to create major strata based on sex (where possible), deployment status, and ANYMH24 in order to oversample female veterans, deployed veterans, and veterans who used VA mental health services.
A second objective for stratification is to increase the sampling rates for veterans who are expected to respond at lower rates than other veterans. Westat’s experience in conducting the 2010 National Survey of Veterans was that young veterans have lower response rates than older veterans. The result of increasing the sampling rates for younger veterans is they then have lower base sampling weights, which then compensate for their higher non-response adjustment factors. The reduced variability in the final, adjusted, weights reduces the loss in precision due to weighting. We plan to create two substrata within each major stratum: a substratum for veterans younger than 30, which we will over-sample to compensate for their lower expected response rates, and a substratum of veterans age 30 and above.
A third objective for stratification is to provide a balanced representation of the first-phase sample with respect to certain stratification factors, thereby improving the precision of the survey estimates. For this objective, we plan to create implicit strata by sorting the cases within each explicit stratum by one or more variables and then using equal-probability systematic sampling to select the sample from the explicit strata. For the strata containing users of VA mental health services, the primary sorting variables will be OPALL_CNT24, the number of mental health outpatient encounters with a mental health diagnosis code in last 24 months, and the secondary sorting variable will be the veteran’s date of birth. For strata that do not contain users of VA mental health services, the sorting variables for deployed veterans will be military component (active or reserve) and rank, and will be zip code for non-deployed veterans. This implicit stratification will increase the representativeness of the second-phase sample of the first-phase sample and, in turn, of the population of OEF/OIF/OND veterans.
Table A-2a describes 13 created sampling strata for selection of the second phase sample and specifies the variables used to sort the cases to be exposed to sampling within each stratum. The veterans assigned to Stratum 1 are those who were not deployed and have not received any mental health services from VA in the last 24 months. Information about sex and date of birth was not available for nearly all veterans in Stratum 1 but was available for all veterans in the other strata. Hence, it was not possible to further stratify Stratum 1 by sex and age. Table A-2b contains for each stratum the size of the first- and second-phase samples. Table A-2c indicates the distribution of the expected number of completed surveys with respect to the values of the variables used to define the major strata.
TABLE A-2a Definitions of Strata for Selection of the Second Phase Sample
| Deployed? | Use VA’s Mental Health Services | Sex | Age Category | Stratum # | Sorting Variables |
|---|---|---|---|---|---|
| No | No | unav | unav | 1 | Zip code |
| Yes | Female | <30 | 2 | Primary: OPALL_CNT24 | |
| 30+ | 3 | Secondary: Date of birth | |||
| Male | <30 | 4 | |||
| 30+ | 5 | ||||
| Yes | No | Female | <30 | 6 | Primary: Military component |
| 30+ | 7 | Secondary: Rank | |||
| Male | <30 | 8 | |||
| 30+ | 9 | ||||
| Yes | Female | <30 | 10 | Primary: OPALL_CNT24 | |
| 30+ | 11 | Secondary: Date of birth | |||
| Male | <30 | 12 | |||
| 30+ | 13 |
TABLE A-2b Sample Sizes by Second Phase Sampling Strata
| Deployed? | Use VA Mental Health Services | Sex | Age Category | Stratum # | Sample Size | |
|---|---|---|---|---|---|---|
| 1st Phase | 2nd Phase | |||||
| No | No | unav | unav | 1 | 645,389 | 7,855 |
| Yes | Female | <30 | 2 | 3,590 | 145 | |
| 30+ | 3 | 16,872 | 510 | |||
| Male | <30 | 4 | 8,612 | 195 | ||
| 30+ | 5 | 50,275 | 850 | |||
| Yes | No | Female | <30 | 6 | 6,183 | 410 |
| 30+ | 7 | 31,046 | 1,535 | |||
| Male | <30 | 8 | 47,569 | 970 | ||
| 30+ | 9 | 244,032 | 3,725 | |||
| Yes | Female | <30 | 10 | 3,385 | 165 | |
| 30+ | 11 | 14,935 | 545 | |||
| Male | <30 | 12 | 23,896 | 605 | ||
| 30+ | 13 | 99,560 | 1,890 | |||
| Total | 1,195,344 | 19,400 | ||||
Figure A-1 is an overview of the sample design. We plan to include on the survey instrument validated questions that will identify veterans with current mental health needs. These veterans are of the greatest analytic interest. Our target number of completed surveys was 4,000 such veterans—2,000 veterans who need mental health services and are using VA mental health services and 2,000 veterans who also need mental health services but who have not elected to use the mental health services provided by the VA. We expect that in addition to the 4,000 veterans identified as having current mental health needs and who complete the survey there will be additional 4,900 veterans who will complete the screener but will not be identified as having a current need for mental health services.
TABLE A-2c Expected Completes and Effective Sample Sizes for the Second Phase Sample
| All Completes | Completes for Veterans with MH Needs | |||||||
|---|---|---|---|---|---|---|---|---|
| Expected Completes | Design Effect* | Effective Sample Size* | Expected Completes* | Design Effect* | Effective Sample Size* | Max Margin of Error* (%) | ||
| Gender | ||||||||
| Female | 146,430 | 1,917 | 1.8 | 1,076 | 952 | 1.6 | 585 | 4.1% |
| Male | 1,048,914 | 7,007 | 1.2 | 5,639 | 3,079 | 1.3 | 2,454 | 2.0% |
| Total | 1,195,344 | 8,924 | 1.3 | 6,643 | 4,031 | 1.4 | 2,978 | 1.8% |
| Use VA Mental Health services | ||||||||
| No | 974,219 | 6667 | 1.3 | 5,060 | 2,000 | 1.3 | 1,518 | 2.5% |
| Yes | 221,125 | 2257 | 1.3 | 1,778 | 2,031 | 1.3 | 1,600 | 2.4% |
| Total | 1,195,344 | 8924 | 1.3 | 6,643 | 4,031 | 1.4 | 2,978 | 1.8% |
| Deployed | ||||||||
| No | 724,738 | 4397 | 1.2 | 3,533 | ||||
| Yes | 470,606 | 4527 | 1.4 | 3,336 | ||||
| Total | 1,195,344 | 8924 | 1.3 | 6,643 | ||||
*In addition to a calculated design effect associated with non-proportional allocation to the major strata, we assumed an additional design effect of 1.2 resulting from non-response adjustments to the weights.
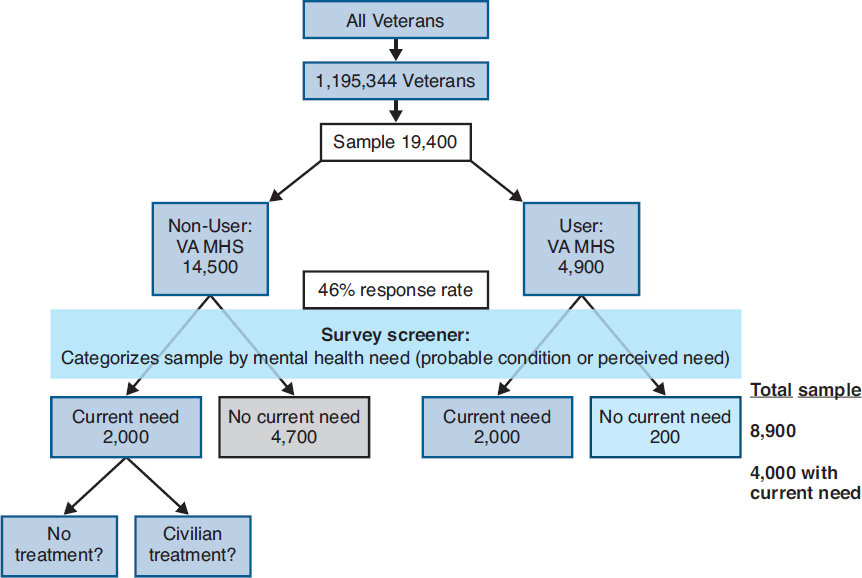
We determined the stratum sample sizes by first allocating the 4,000 + 4,900 = 8,900 screener completes to the major sampling strata, based on sex, deployment status, and usage of VA mental health services. The nonlinear-program solver in Excel was used to determine the allocation of the 8,900 screener completes to the major sampling strata so that the distribution of completed surveys indicated in Figure A-1 was achieved and desired oversampling—described in more detail below—was also achieved, yet the loss in precision for overall estimates was minimized. The design effect for overall estimates due to the disproportionate allocation to the major strata was 1.1. Fielded sample sizes were then determined for each stratum by assuming that the overall response rate would be 46 percent—also described in more detail below—and assuming that the response rate for veterans younger than 30 would be 75 percent of the response rate for veterans age 30 and above.
Whether or not we will need to under- or over-sample the veterans using VA-provided mental health services to achieve the targets specified in Figure A-1 will depend on the proportion of veterans who have used VA mental health services and the proportion of them in current need of mental health services. Based on results in Seal et al. (2010),2 we had assumed in the earlier version of this document that approximately 24 percent of OEF/OIF/OND veterans were users of VA mental health services. Table 2 in Elbogen et al. (2013)3 indicates that 43.2 percent of Iraq and Afghanistan veterans screened positive
___________________
2 Seal, K. H., S. Maguen, B. Cohen, K. S. Gima, T. J. Metzler, L. Ren, D. Bertenthal, and C. R. Marmar. 2010. VA mental health services utilization in Iraq and Afghanistan veterans in the first year of receiving new mental health diagnoses. Journal of Traumatic Stress 23:5–16. doi.org/10.1002/jts.20493.
3 Elbogen, E. B., H. R. Wagner, S. C. Johnson, P. Kinneer, H. Kang, J. J. Vasterling, C. Timko, and J. C. Beckham. 2013. Are Iraq and Afghanistan veterans using mental health services? New data from a national random-sample survey. Psychiatric Services 64:134–141.
TABLE A-3 Fielded Sample Sizes, Number of Respondents, and Number of Screened-Positive Completed Surveys
| Users of VA-Provided Mental Health Services | Non-Users of VA-Provided Mental Health Services | Total Sample | |
|---|---|---|---|
| Fielded sample | 4,900 | 14,500 | 19,400 |
| Assumed response rate | 46% | 46% | |
| # respondents | 2,200 | 6,700 | 8,900 |
| Assumed screened-positive rate | 90% | 30% | |
| # completed screened positive surveys | 2,000 | 2,000 | 4,000 |
NOTE: Screened-positive refers to those veterans who had a positive result on at least one of the mental health screeners administered as part of the survey.
for posttraumatic stress disorder (PTSD), major depression, or alcohol misuse. Thus, if nearly all of the estimated 24 percent of OEF/OIF/OND veterans who have used VA mental health services were to be identified by the survey instrument as currently needing mental health services—say, 22 percent out of 24 percent—then approximately half of the veterans in need of mental health services would be receiving such care from the VA and half would not. In this case, the same sampling fraction could be used for the two groups. However, the administrative data provided to us by the VA permitted us to estimate that only 18.5 percent of OEF/OIF/OND veterans were users of VA mental health services. Because this estimate is lower than our earlier assumption, it was necessary to over-sample veterans who are users of VA mental health services. A large screening sample size of non-users was also needed because only some of those sampled will have a current mental health need, a subpopulation of interest in this study.
We assume that the unweighted Web response rate will be approximately 20 percent and the follow-up computer-assisted telephone interview (CATI) response rate among Web non-respondents will be approximately 33 percent.4 Hence, the overall assumed response rate is approximately 0.20 + (1−0.20)*0.33 = 46 percent. Table A-3 shows how the total fielded sample size needs to be approximately 19,400. Because it is possible that the overall response rate will be less than 46 percent, we plan to select 38,800 veterans initially for the second-phase sample. We will randomly partition the initial second-phase sample into a main sample of 19,400 veterans that will be fielded at the beginning of the data collection period and a reserve sample of 19,400 veterans that will be set aside for use if response rates or rates of eligibility are lower than expected. The reserve sample will be randomly partitioned into multiple release groups within each sampling stratum so that, if necessary, the size of the fielded sample can be increased incrementally on a stratum-by-stratum basis.
In general, the sample size is large enough to support analyses of numerous subgroups with high levels of precision. Table A-4 contains the estimated maximum margins of error (MOEs) for domain-level proportions and the associated worst-case minimum detectable effects (MDEs) for non-specific domains as a function of the prevalence of the domain and its complement in the veteran population.5 These worst-case measures occur when the estimated proportions are equal to 50 percent.
___________________
4 We considered a three-phase sample design in which the second-phase sample described above was modified to use CATI data collection only in a subsample of the Web respondents. We found, however, that this modification decreased precision when using the double sample estimator described by Hansen and Hurwitz (1946) and produced only modest gains in precision for an alternative estimator. Hansen, M. H., and W. N. Hurwitz. 1946. The problem of nonresponse in sample surveys. Journal of the American Statistical Association 41:517–529.
5 Calculated margins of error and maximum detectable effects in Tables A-4 through A-6 are based on sampling variances for a stratified sample in which the maximum margin of error for an overall estimate of a proportion is equal to 1.8 percent.
TABLE A-4 Maximum MOEsa and Worst-Case MDEs (over all possible comparisons) for Non-Specific Domains for Veterans Identified as Currently Needing Mental Health Services
| Prevalence of Domain in Population | Maximum MOE | Worst-Case MDE Between Domain and Balance of Population (%) |
|---|---|---|
| 10% | 5.8% | 8.7% |
| 90% | 1.9% | |
| 20% | 4.1% | 6.6% |
| 80% | 2.0% | |
| 30% | 3.3% | 5.7% |
| 70% | 2.2% | |
| 40% | 2.9% | 5.4% |
| 60% | 2.4% |
aMOEs are half-widths of 95 percent confidence intervals about an estimate of 50 percent. MDE calculations are for two-tailed 95% confidence tests with 80% power.
As Table A-4 shows, for the sample of 4,000 veterans who screen as having a current mental health condition, we can further divide this group and still be able to detect differences between groups of 8.7 percent or better. For example, an analysis may be conducted to compare survey results for younger (ages 18–24) versus older (age 25 and older) OEF/OIF/OND veterans with mental health needs. Based on Seal et al. (2010), these proportions may be approximately 33 percent (younger) versus 67 percent (older). A relatively small difference of 5.7 percent in survey results would be necessary to detect a statistically significant difference between these two veteran subgroups with 80 percent power. Additionally, if we compare groups within the full sample of 8,900 respondents such as VA mental health users versus non-users, the MDEs will be even smaller. As such, the sample size and tiered structure give a great deal of flexibility in the comparisons that can be supported.
Table A-5 indicates the margin of errors for estimated proportions other than 50 percent. For example, for the domain of younger veterans (with a prevalence of about 30 percent), an associated estimated proportion of 50 percent has a MOE of 3.3 percent, but an estimated proportion of 5 percent or 95 percent has a margin of error of only 1.4 percent.
Table A-6 indicates worst-case MDEs for estimated proportions other than 50 percent. For example, for comparing a proportion estimated from data for younger veterans to a proportion estimated from the data for older veterans, both Tables A-4 and A-6 indicate that the worst-case MDE over all possible
TABLE A-5 MOEs for Estimated Proportions in Non-Specific Domains for Veterans Identified as Currently Needing Mental Health Services
| Prevalence of Domain in Population | Estimated Proportion | |||
|---|---|---|---|---|
| 50% | 25% or 75% | 10% or 90% | 5% or 95% | |
| 10% | 5.8% | 5.0% | 3.5% | 2.5% |
| 20% | 4.1% | 3.5% | 2.5% | 1.8% |
| 30% | 3.3% | 2.9% | 2.0% | 1.5% |
| 40% | 2.9% | 2.5% | 1.7% | 1.3% |
| 50% | 2.6% | 2.2% | 1.6% | 1.1% |
| 60% | 2.4% | 2.0% | 1.4% | 1.0% |
| 70% | 2.2% | 1.9% | 1.3% | 1.0% |
| 80% | 2.0% | 1.8% | 1.2% | 0.9% |
| 90% | 1.9% | 1.7% | 1.2% | 0.8% |
| 100% | 1.8% | 1.6% | 1.1% | 0.8% |
TABLE A-6 Worst-Case MDEs for Comparing a Proportion Estimated for a Non-Specific Domain to a Proportion Estimated for the Balance of the Population for Veterans Identified as Currently Needing Mental Health Services
| Prevalence of Domain in Population | Estimated Proportion That Is Closer to 50% | |||
|---|---|---|---|---|
| 50% | 25% or 75% | 10% or 90% | 5% or 95% | |
| 10% or 90% | 8.8% | 7.6% | 5.3% | 3.8% |
| 15% or 85% | 7.4% | 6.4% | 4.4% | 3.2% |
| 20% or 80% | 6.6% | 5.7% | 4.0% | 2.9% |
| 30% or 70% | 5.8% | 5.0% | 3.5% | 2.5% |
| 40% or 60% | 5.4% | 4.7% | 3.2% | 2.3% |
| 50% | 5.3% | 4.6% | 3.2% | 2.3% |
comparisons of two proportions is 5.8 percent. If, however, the two proportions being compared are very small so the proportion that is closer to 50 percent is less than or equal to 10 percent, then the worst-case MDE is only 3.5 percent.
Over-sampling affects the precision of associated estimates. For example, the over-sampling of female veterans will increase the precision of statistics computed for female veterans. Similarly, since veterans who have used VA mental health services are over-sampled, there will be in an increase in the precisions computed for such veterans. Over-sampling low-prevalence domains, however, can decrease the precision of overall estimates and the precision of estimates for high-prevalence domains that cut across multiple strata in which one or more of the strata are disproportionately allocated.
Table A-7 is from the appendix of the earlier version of this document, and it contains predicted maximum MOEs for estimated proportions and the associated worst-case MDEs for domains based on gender or the usage of VA mental health services, taking into account the decreases in precision due to over-sampling female veterans with an over-sampling factor of 2.0. The actual second-phase sample over-sampled females, deployed veterans, and users of VA mental health services by factors of 2.0, 1.6, and 1.5, respectively. Sex was missing in the VA-provided data for nearly all veterans assigned to Stratum 1, so females were not oversampled in Stratum 1. By using VA’s VetPop model, however, we were able to estimate the proportion of female veterans in Stratum 1 and thus were able to compute an overall over-sampling factor for females across all the sampling strata. Table A-8 is the same as Table A-7, except it is based on the actual, instead of planned, second-phase sample. Comparing Tables A-7 and A-8, it can be seen that compared to the planned sample the actual sample has less power to
TABLE A-7 Planned-Sample Predictions of MOEsa and Worst-Case MDEs for Estimated Proportions for Domains Based on Gender or Usage of VA Mental Health Services for Veterans Identified as Currently Needing Mental Health Services
| Maximum MOE | ||||
|---|---|---|---|---|
| Female Veterans | Male Veterans | All Veterans | Worst-Case MDE Across User Status | |
| Users of VA mental health services | 4.6% | 3.0% | 2.7% | 5.3% |
| Non-users of VA mental health services | 4.4% | 2.9% | 2.5% | |
| All veterans | 3.2% | 2.1% | 1.8% | |
| Worst-case MDE across sex (%) | 5.9% | |||
a MOEs are half-widths of 95 percent confidence intervals about an estimate of 50 percent. MDE calculations are for two-tailed 95% confidence tests with 80% power.
TABLE A-8 Actual-Sample Estimates of MOEsa and Worst-Case MDEs for Estimated Proportions for Domains Based on Gender or Usage of VA Mental Health Services for Veterans Identified as Currently Needing Mental Health Services
| Maximum MOE | ||||
|---|---|---|---|---|
| Female Veterans | Male Veterans | All Veterans | Worst-Case MDE Across User Status | |
| Users of VA mental health services | 4.5% | 2.8% | 2.4% | 4.5% |
| Non-users of VA mental health services | 6.9% | 2.7% | 2.5% | |
| All veterans | 4.1% | 2.0% | 1.8% | |
| Worst-case MDE across sex (%) | 6.6% | |||
a MOEs are half-widths of 95 percent confidence intervals about an estimate of 50 percent. MDE calculations are for two-tailed 95% confidence tests with 80% power.
determine that male-versus-female differences are significantly different but has more power to test for significant differences between users and non-users of VA mental health services.
Table A-7 indicates that the worst-case MDE across sex was estimated to be 5.9 percent for the planned sample, but for the actual sample it is estimated to be 6.6 percent. We had considered oversampling veterans with female first names in Stratum 1, but because of the need to select the sample expeditiously we did not do so. Had we done this, the loss in power for testing male-versus-female differences would possibly have been reduced but not eliminated, because there will be some misclassification when using a veteran’s first name to predict his or her sex.
The main and reserve second-phase samples have already been selected, and identifiers for the sampled veterans have been sent to the VA to obtain their Social Security numbers to be used in address tracing. If it is felt necessary, to attempt to over-sample female veterans in Stratum 1, this could be done by using the veteran’s first name to predict sex in Stratum 1 of both the main and reserve second-phase samples. Then some of the predicted female veterans in Stratum 1 of the reserve sample could be reassigned to the main sample, and an equal number of predicted male veterans in Stratum 1 of the main sample reassigned to the reserve sample.
Weighting and Non-Response Bias Analysis
The Office of Management and Budget guidelines require that a non-response bias analysis (NRBA) be conducted when the response rate for a federally sponsored survey is less than 80 percent, which we expect will be the case for this survey. Because one of the reasons for developing and then using analysis weights is to reduce the non-response bias in resulting estimates, an NRBA includes many of the analysis procedures we use in developing weights and in verifying that they were calculated correctly. In the remainder of this section, we describe the procedures we will use to develop the analysis weights and then describe the associated data analyses we plan to perform to support the weighting procedures and/or the NRBA.
A non-response adjusted sample weight will be calculated for each respondent regardless of whether or not the respondent screened positive for needing mental health services. These weights will permit Westat and the National Academies of Sciences, Engineering, and Medicine staff to estimate the means, percentages, and totals from the collected data that will be representative of the population of OEF/OIF/OND veterans. The same weights can be used to calculate subclass means for the veterans who screen positive for needing mental health services. For this purpose it will be necessary for analysts to perform domain analyses in which the domain variable is the survey outcome for screening positive.
The goal of weighting is to make the weighted survey estimates approximately unbiased for the corresponding population parameters. The weights first reflect the selection probabilities of the sampled veterans (the base weights) and then adjustments to the base weights to compensate for non-response and to make the weighted distributions for some key variables conform to known or well-estimated distributions for those variables. Because the proposed sample design is for a two-phase sample, the weights will be the product of a first-phase weight and a second-phase weight. The first-phase weight will be the reciprocal of the sampling rate for the first-phase sample, which according to the RFP is approximately 25 percent. Thus, the first-phase weight will be approximately 4. To calculate the first-phase weight, we are dependent on first-phase sampling information being provided by the VA. However, the first-phase weight is not needed for estimating rates and averages, but it is needed to estimate totals.
Our calculation of weights will consist of the following steps:
- Calculating second-phase base weights, which are the reciprocals of the conditional probability that a veteran was selected for the second-phase sample given that the veteran had been selected for the first-phase sample selected by the VA.
- Using the VA-provided information for the veterans in the first-phase sample (contained in a subset of the 27 frame variables) to adjust the second-phase base weights for non-response. Depending on the number of frame variables being used (see discussion below about the data analysis procedure to be used to select the variables), this step will either use the frame variables to create post-stratification cells and the associated cell totals or will use the frame variables to compute control totals from the first-phase sample for use in raking the second-phase base weights.
- Raking the final weights (the product of the first- and second-phase weights), if population control totals are available and if VA provides the first-phase weights, to available population totals.
- Determining the variability of the final weights and the presence of outliers. If there are outliers in the final weights that would cause large losses in precision due to weight variability, they will be trimmed to reduce the variability of the weights.
We plan to carry out three analyses of the survey’s non-response properties, using a dataset that contains the computed weights and the frame data provided by the VA for all veterans in the first-phase sample. The first analysis will compare the second-phase survey response rates for different levels of categorical frame variables. These variables include gender, military service branch, military service component, rank at separation (enlisted versus officer), deployment status, and whether or not the veteran used VA-provided mental health care services. This first analysis will be included in the NRBA, and we will also use it to indicate which frame variables we will use in weighting to create post-stratification cells or to rake the second-phase base weights. The second analysis will use multiple sets of weights to compare weighted distributions of the categorical frame variables used in the first analysis. There will be four sets of weighted estimates that will be compared:
- Using data for all veterans in the first-phase sample, the estimated frequencies computed with first-phase weights (with an equal probability first-phase sample, this can be an unweighted calculation);
- Using data for all veterans sampled for the second-phase sample, the estimated frequencies computed with second-phase base weights;
- Using data for all veterans responding to the second-phase sample, the estimated frequencies computed with second-phase base weights; and
- Using all veterans responding to the second-phase sample, computed with final base weights (that is, the product of the first- and second-phase weights).
This second analysis, which will be included in the NRBA, will also be able to identify additional frame variables that should be used in creating non-response adjustment cells. This analysis permits one to estimate the non-response bias in subgroup means for each variable being analyzed. Hence, this analysis allows us to check if the weighting adjustments were effective because the estimated non-response biases for the variables used to make weighting adjustments should be essentially zero.
The third analysis will be similar to the second analysis but will compare weighted means computed from the following continuous frame variables and will also compare estimated regression coefficients for a set of models in which the dependent variable in each model is one of the following variables:
- For each veteran, the total number of VA outpatient health care encounters since separation;
- For each veteran, the total number of VA inpatient health care stays since separation;
- For each veteran, the total number of VA outpatient mental health service encounters since separation, defined as an encounter in which the diagnosis includes and ICD-9 code in the subset of mental health ICD-9 codes; and
- For each veteran, the total number of VA inpatient mental health service stays since separation, defined as an encounter in which the diagnosis includes an ICD-9 code in the subset of mental health ICD-9 codes.
Weighting Procedures
Westat received two first-phase-sample files from the VA. One file, containing 470,606 records, contained information for a sample of OEF/OIF/OND veterans who have had been deployed to Iraq or Afghanistan and, according to VA records, were alive on October 1, 2015. The data source for this file was the OEF/OIF/OND roster file. The second file, containing 724,738 records, contained information for a sample of OEF/OIF/OND veterans who were not deployed to Iraq or Afghanistan. The VA created this second file from multiple administrative data sources, with a veteran’s demographic variables being included only if the veteran appeared in VA medical records.
Westat combined the two VA-provided data files to create a sampling frame for the selection of a stratified second-phase sample. The stratification variables for the second-phase sample were deployment status (2 levels: yes or no), usage of VA mental health services (2 levels: yes or no/missing), sex (3 levels: male, female, missing), and age category (2 levels: <30, 30+, and missing). Table A-9 describes the second-phase sampling strata and the size of the first- and second-phase samples associated with these strata.
Response Rates and Comparisons of Respondents and Non-Respondents
Table A-10 contains weighted and unweighted response rates6 by stratum and for levels of other categorical variables present on the sampling-frame file. The weights that were used to compute the weighted response rates are the overall base weights with respect to both the first- and second-phase samples. (The calculation of the overall base weights is described in a separate memo about the weighting process.) For these same categorical variables, Table A-117 contains the results of a chi-square test of the association between the response status and the levels of the categorical variable. The p-values in Table A-11 incorporate the second-order Rao–Scott correction.
___________________
6 Revised from an earlier version of this document.
7 Revised from an earlier version of this document.
TABLE A-9 Second-Phase Sampling Strata
| Deployed? | Use VA Mental Health Services | Sex | Age | Stratum # | Sample Size | |
|---|---|---|---|---|---|---|
| 1st Phase | 2nd Phase | |||||
| No | No | Missing | Missing | 1 | 645,389 | 7,855 |
| Yes | Female | <30 | 2 | 3,590 | 145 | |
| 30+ | 3 | 16,872 | 510 | |||
| Male | <30 | 4 | 8,612 | 195 | ||
| 30+ | 5 | 50,275 | 850 | |||
| Yes | No | Female | <30 | 6 | 6,183 | 410 |
| 30+ | 7 | 31,046 | 1,535 | |||
| Male | <30 | 8 | 47,569 | 970 | ||
| 30+ | 9 | 244,032 | 3,725 | |||
| Yes | Female | <30 | 10 | 3,385 | 165 | |
| 30+ | 11 | 14,935 | 545 | |||
| Male | <30 | 12 | 23,896 | 605 | ||
| 30+ | 13 | 99,560 | 1,890 | |||
| Total | 19,400 | |||||
CHAID Trees
Because of the number of categorical variables present on the sampling-frame file, we decided to use the CHAID algorithm to develop the cells to be used to compute non-response adjustment factors. For the CHAID analyses, instead of using only the two age categories of <30 and 30+ that were used to define the sampling strata, we used the more detailed age categories shown in Table A-10.
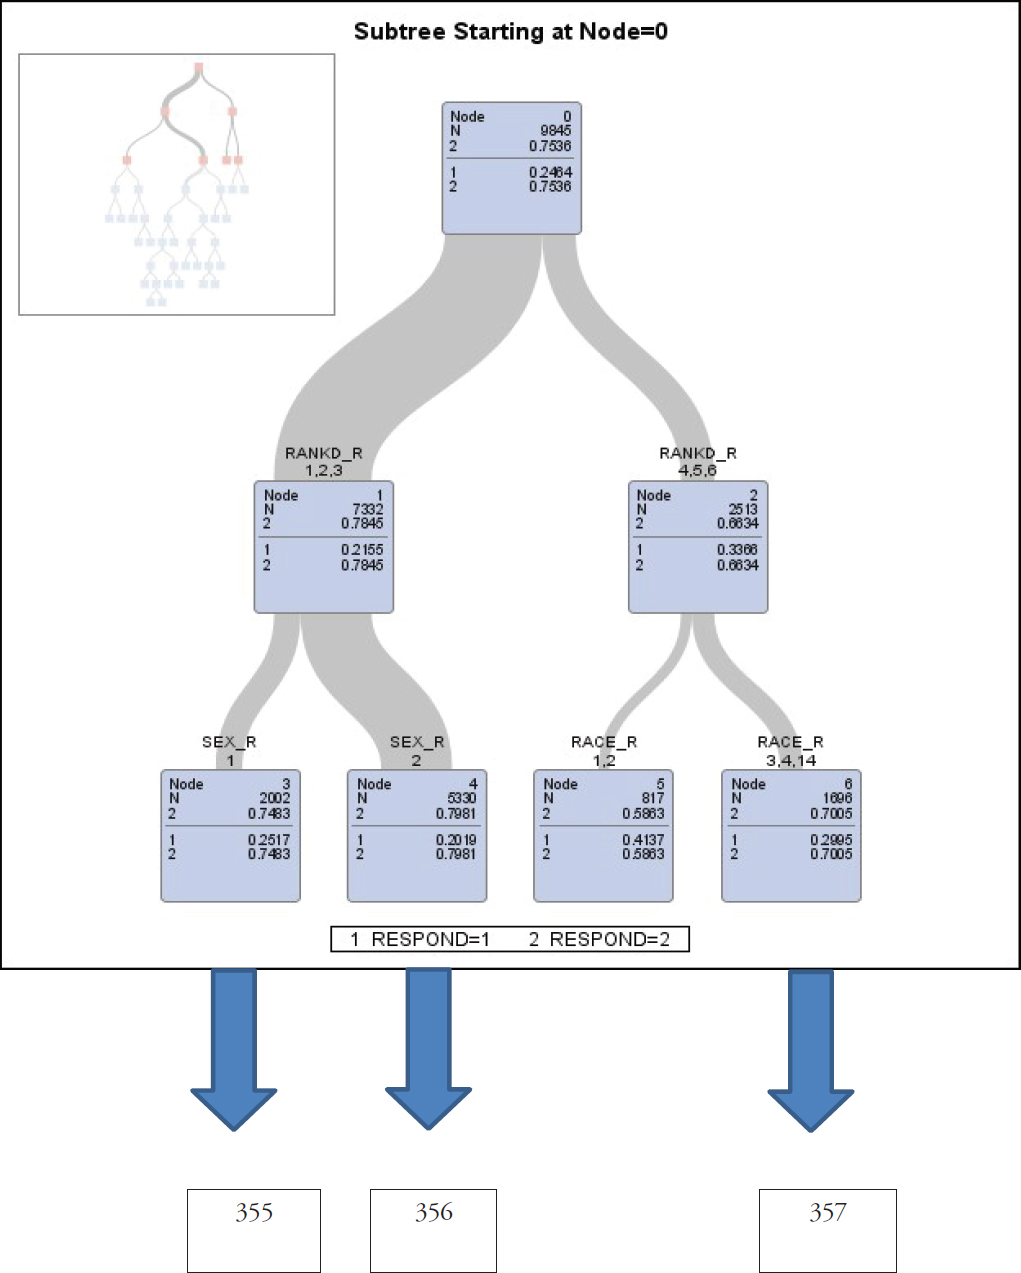
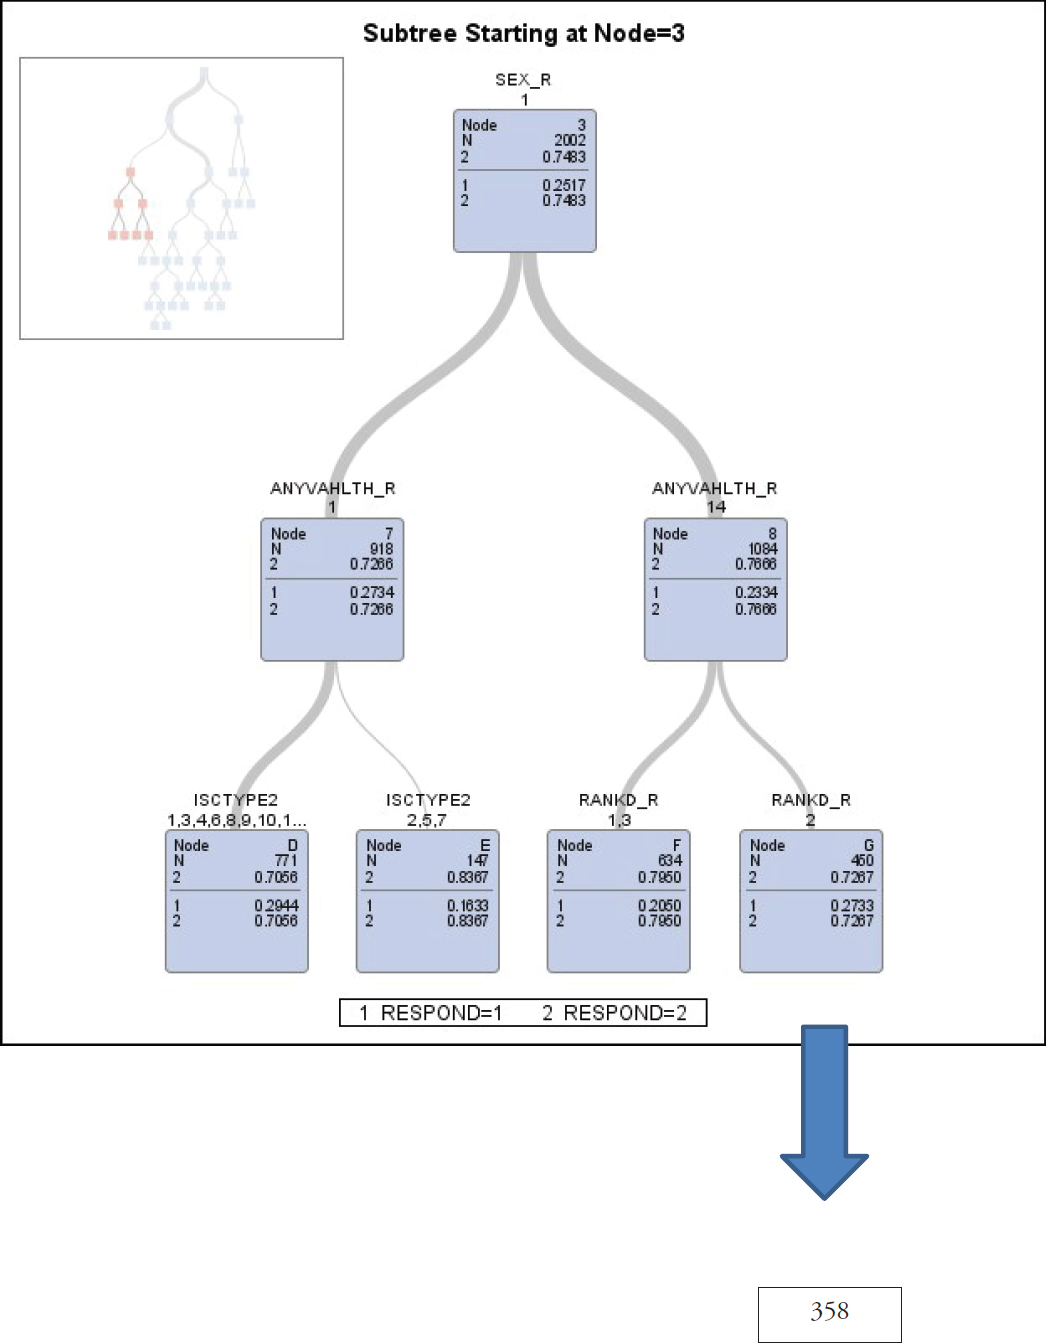
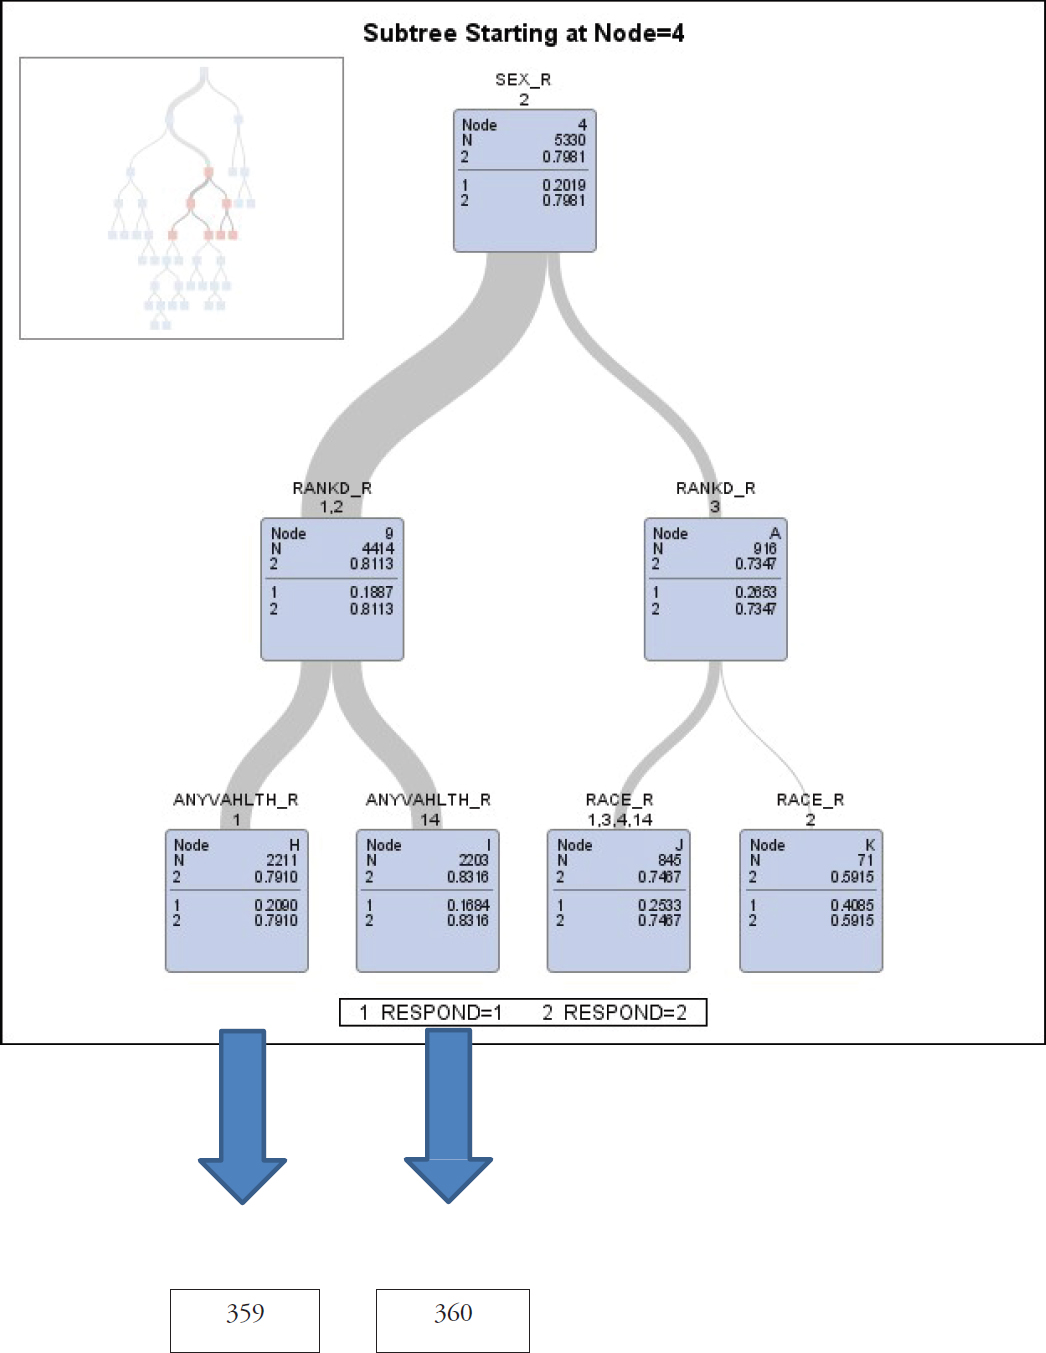
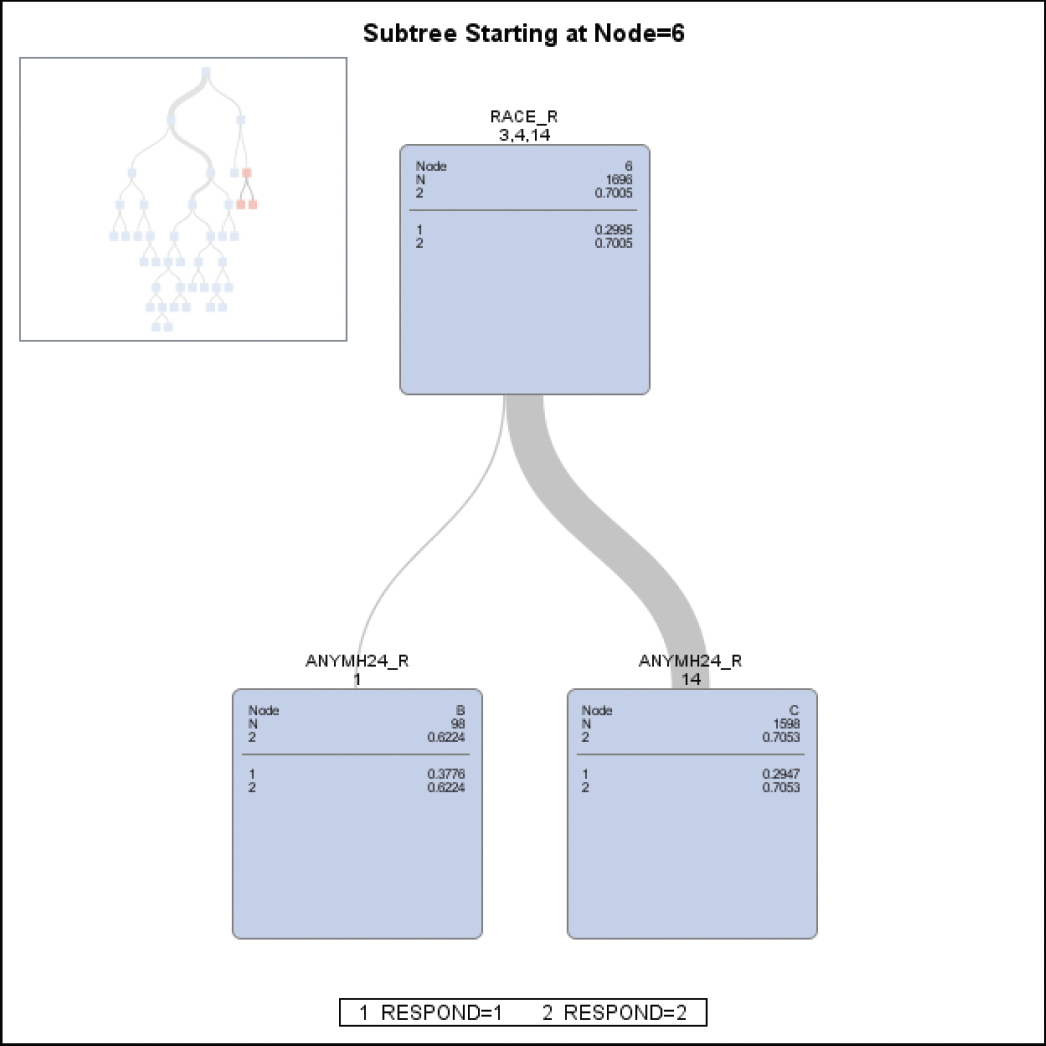
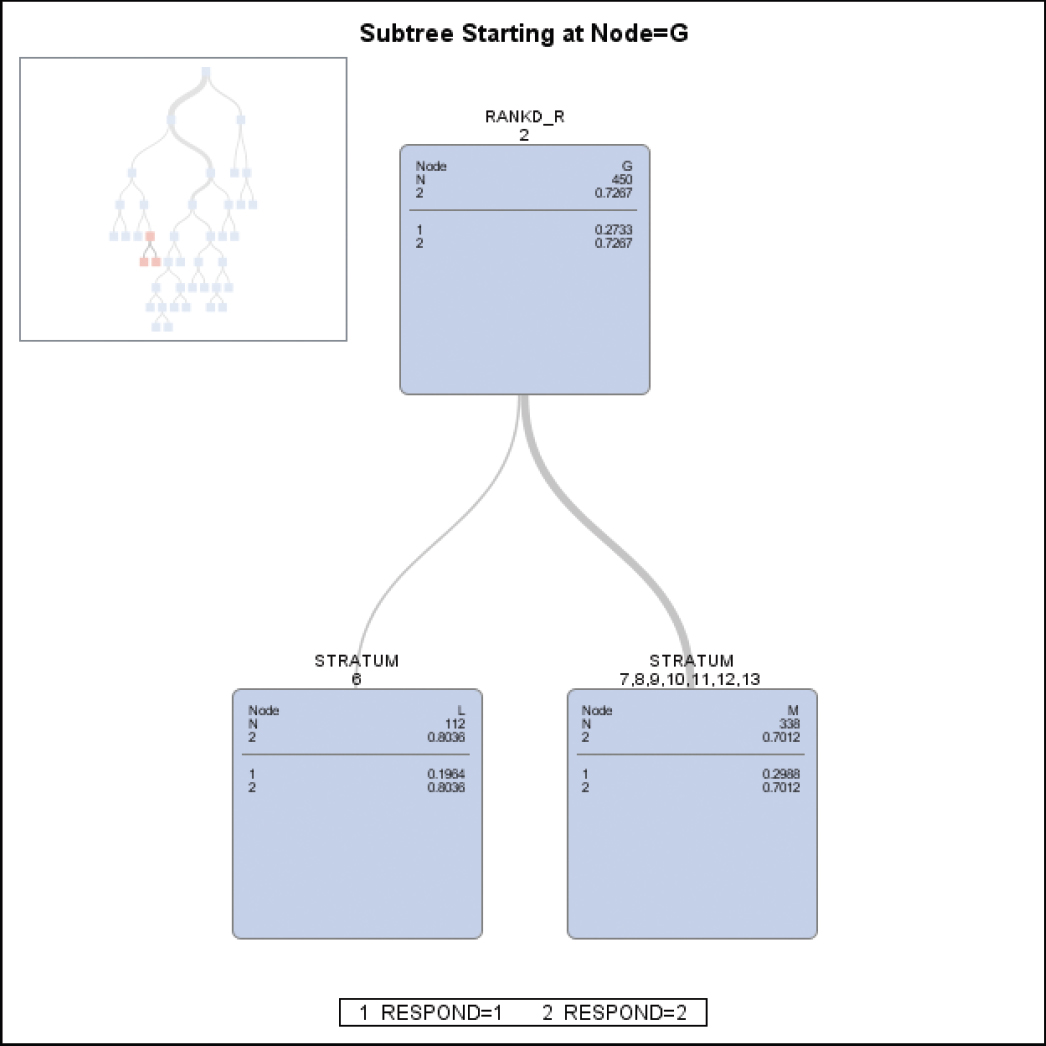
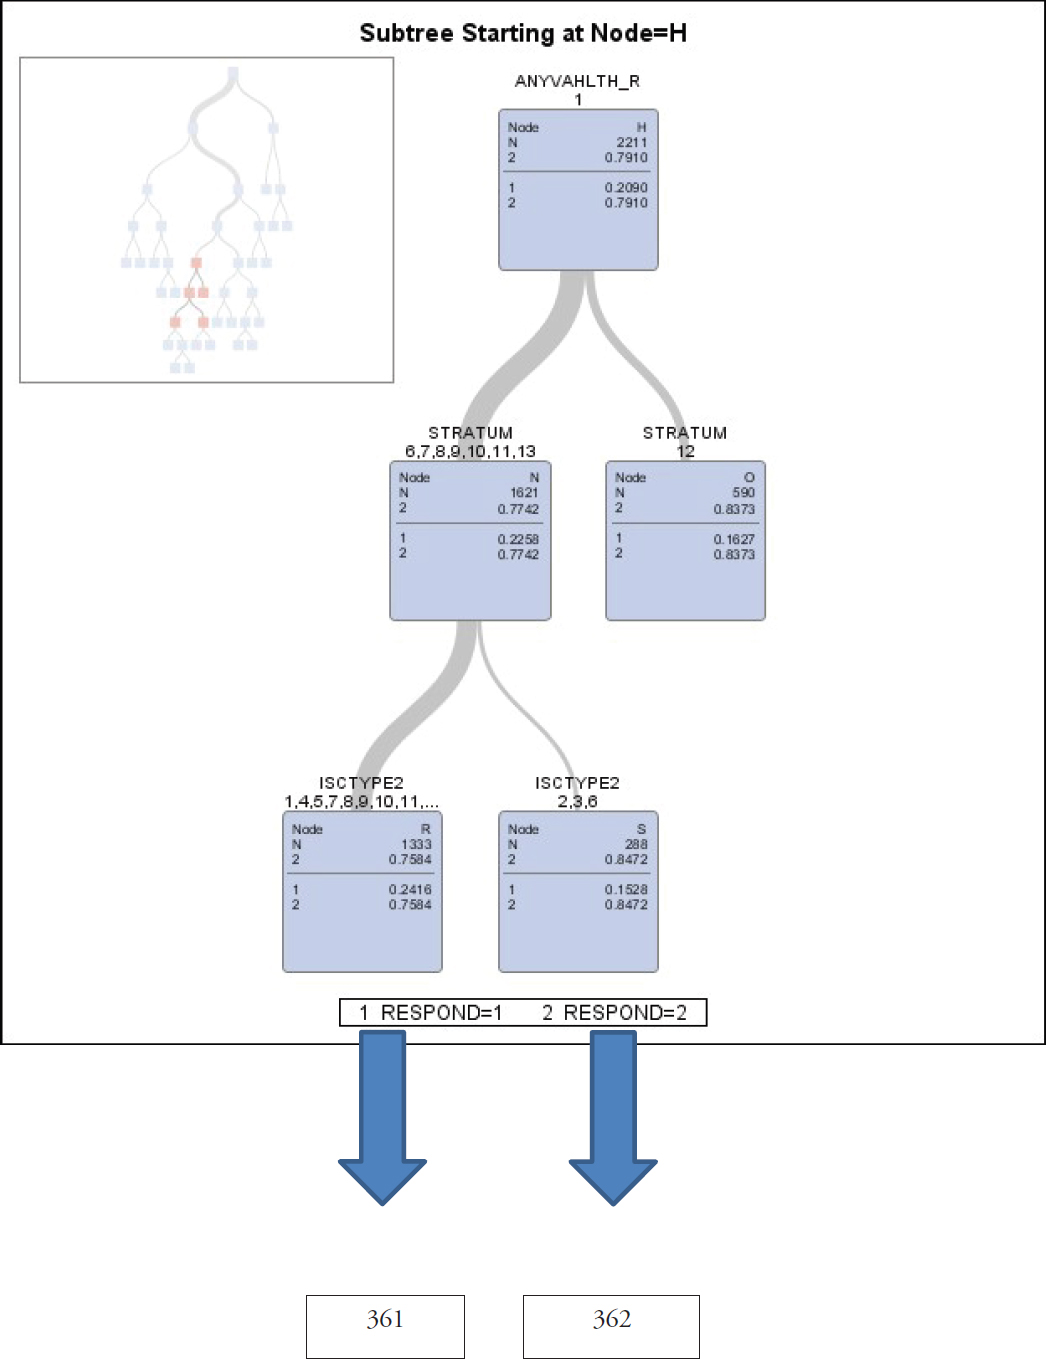
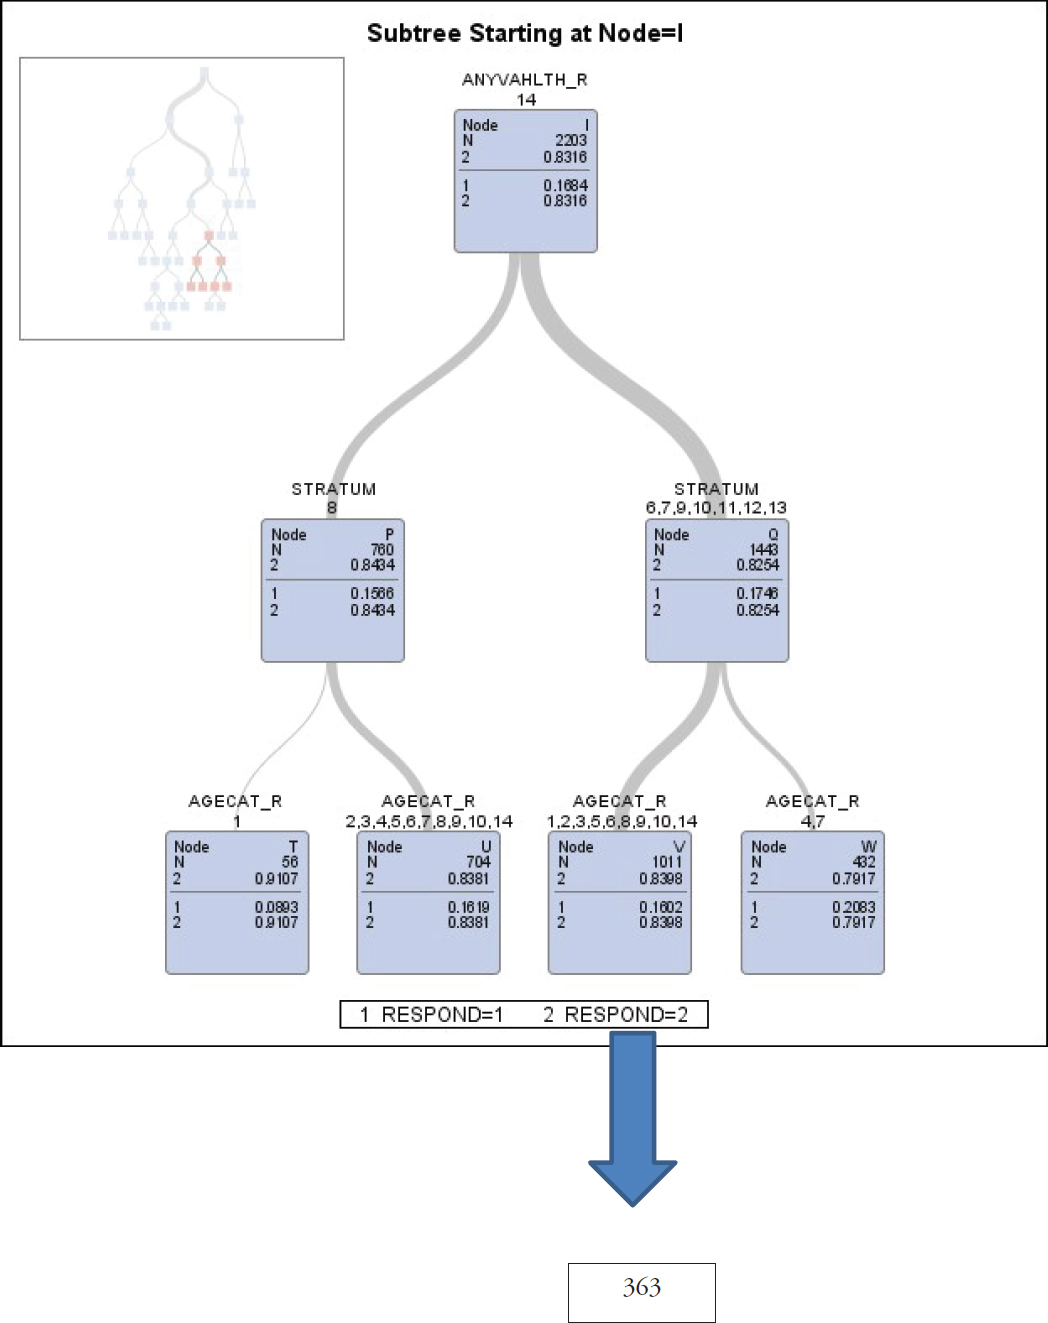
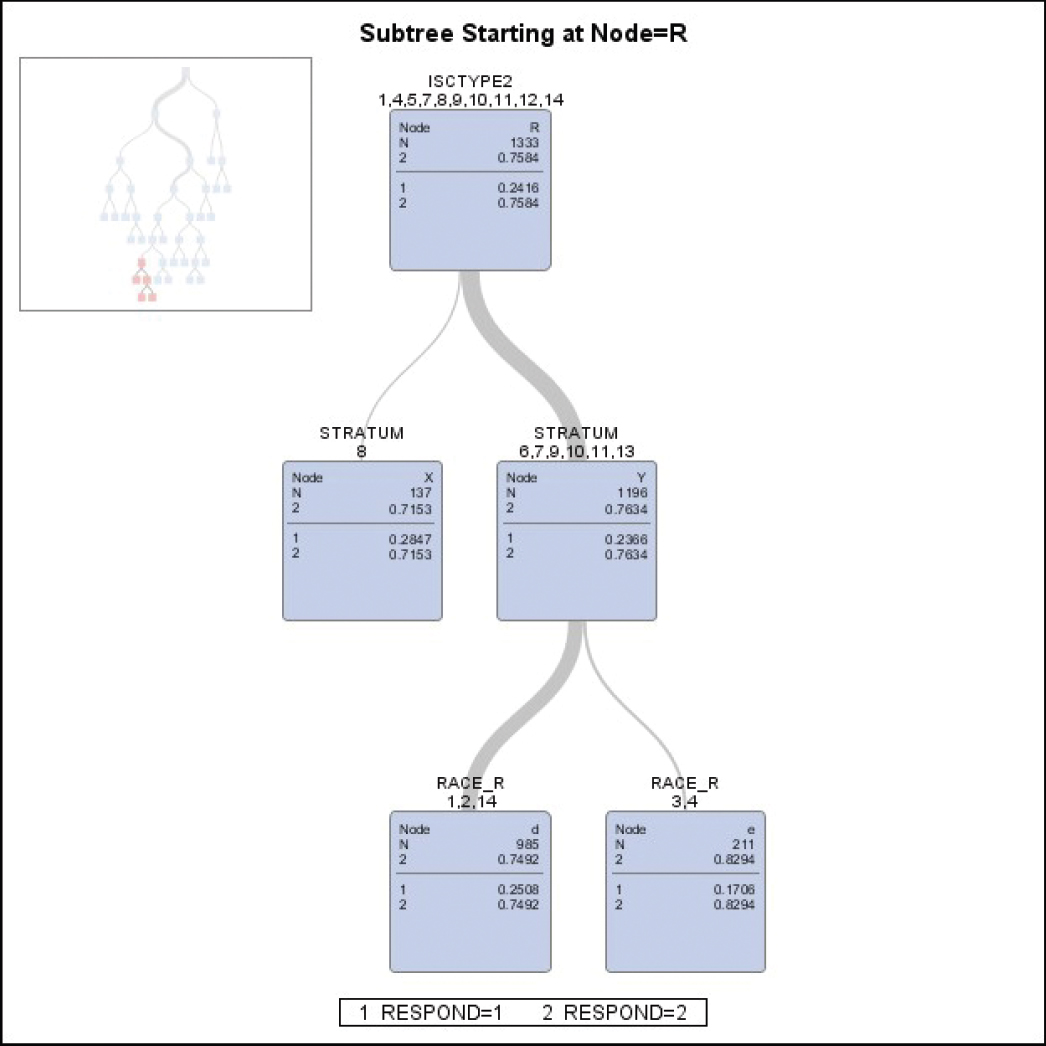
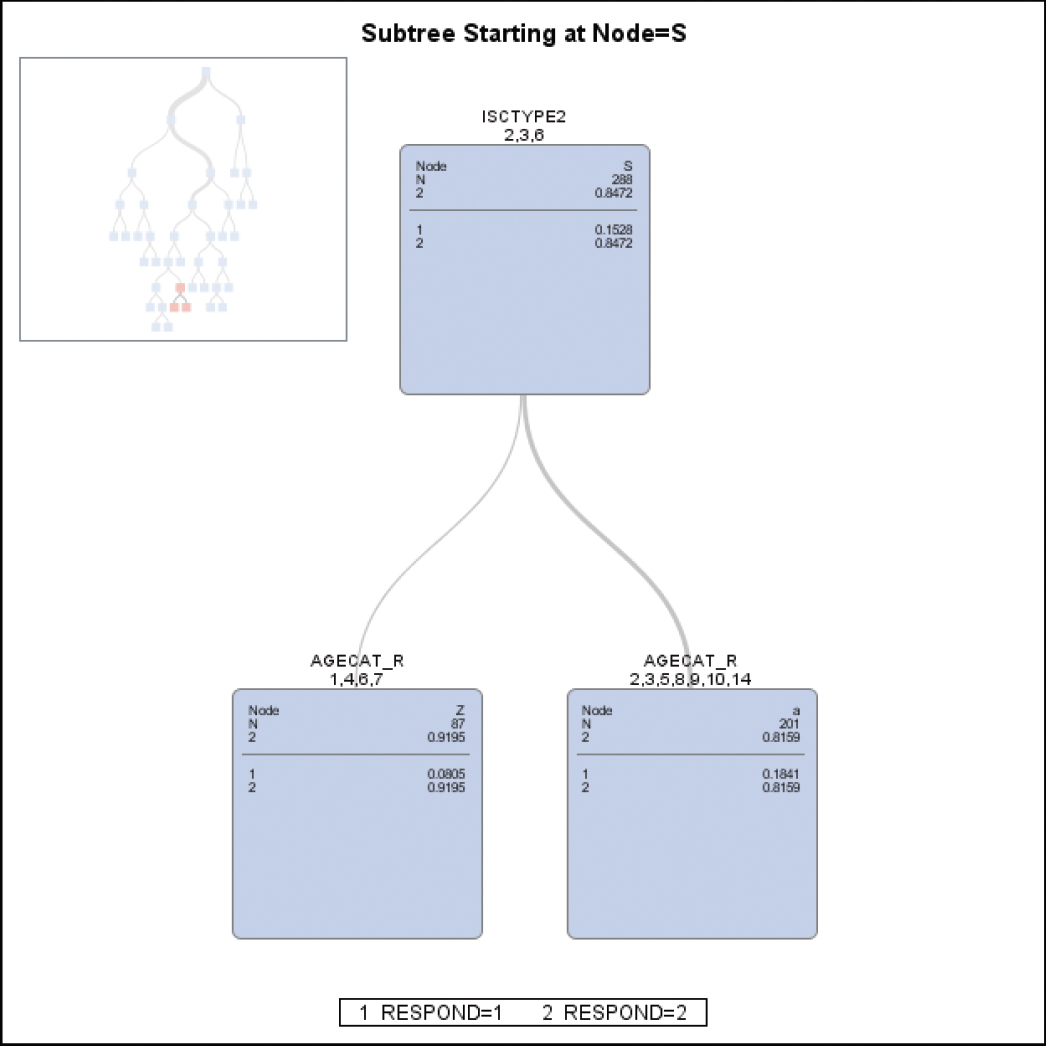
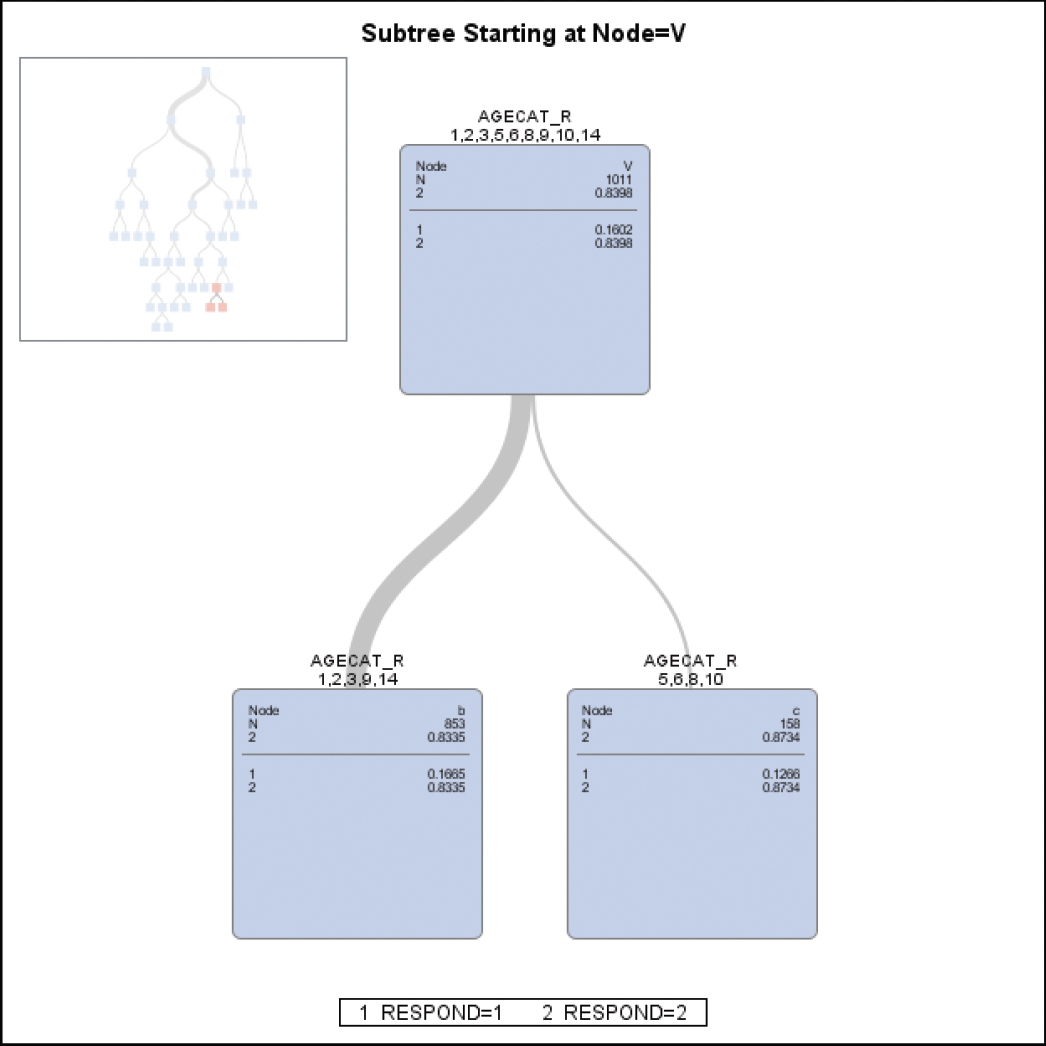
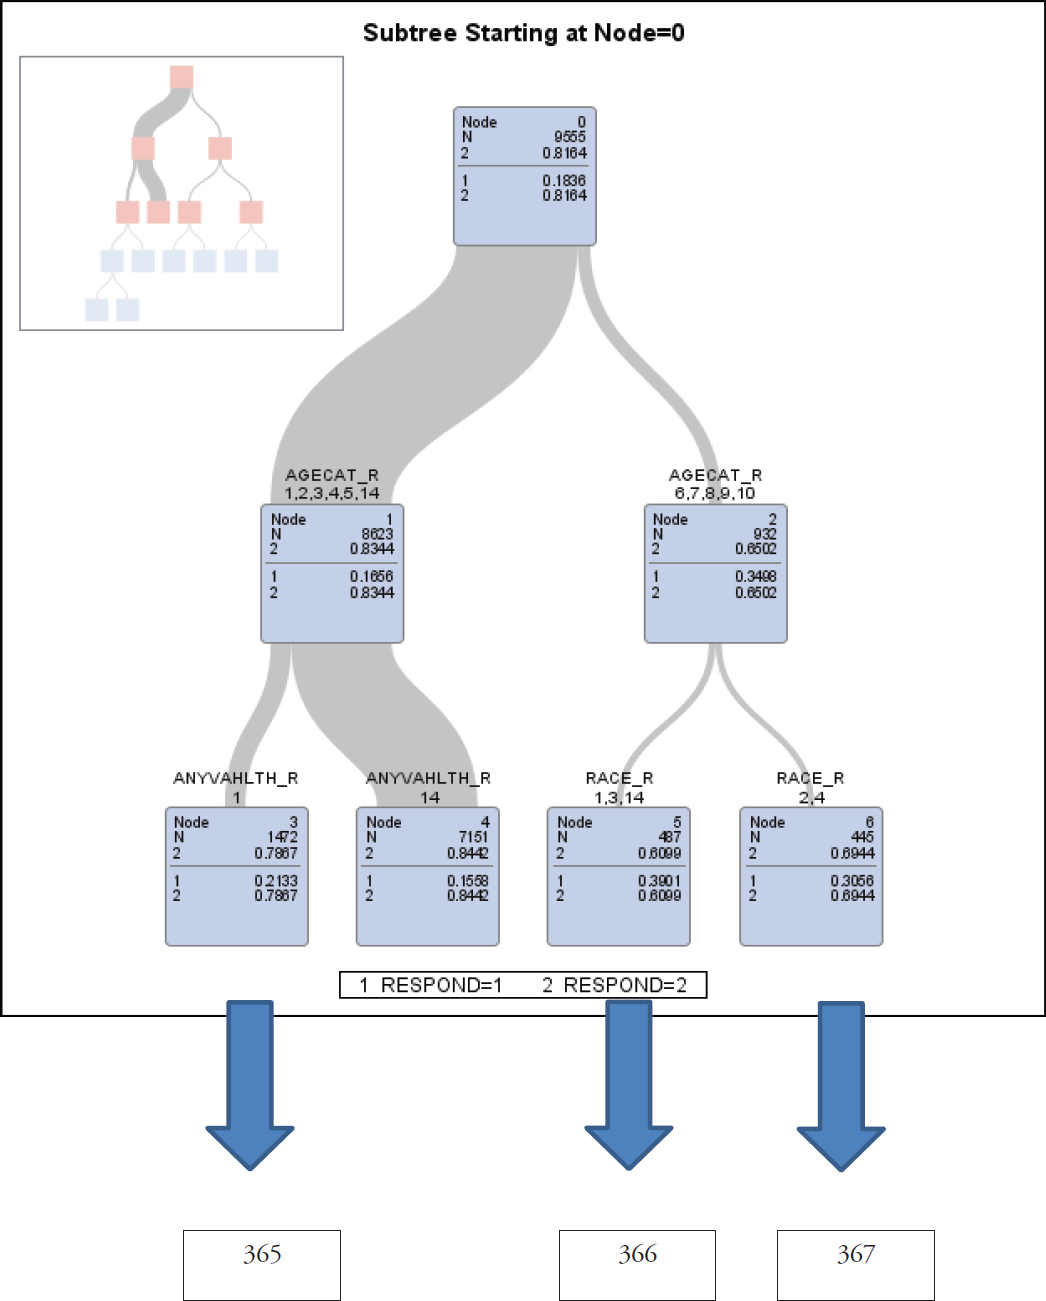
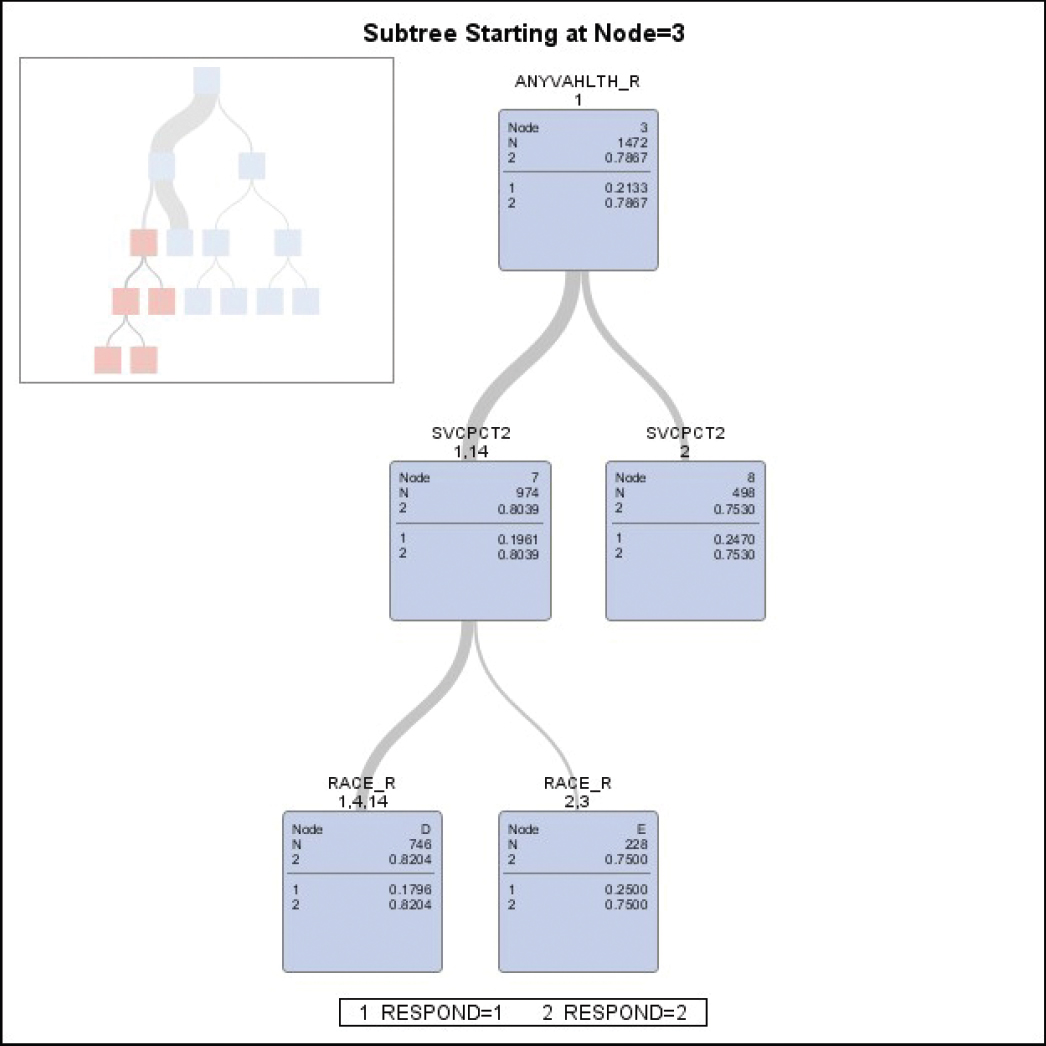
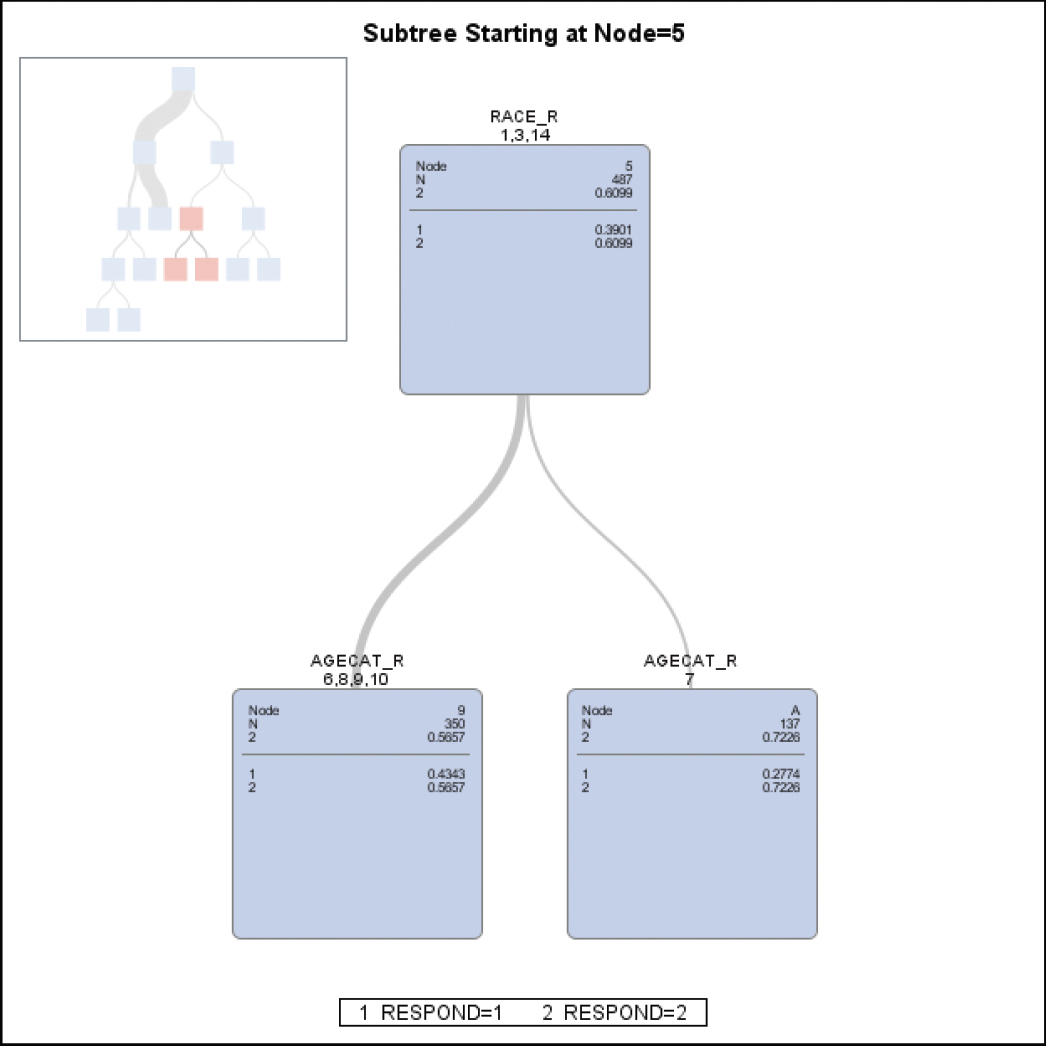
Below is a CHAID classification tree consisting of 21 leaves for survey response by veterans who were deployed to Iraq or Afghanistan. There is a similar tree consisting of 8 leaves for survey response by veterans who were not deployed to Iraq or Afghanistan. The information above the nodes indicates the names and associated levels of the variables that define the nodes. See Tables A-9 and A-10 for descriptions of the variable levels. The N value for each node is the number of associated fielded veterans. The 1 and 2 proportions for each node are the associated unweighted response and non-response rates, respectively. (We will use weighted response rates when we compute the non-response adjustment factors associated with the leaves of the tree.) No pruning of the classification trees was performed, but when growing each tree, the required minimum leaf size was 50.
Tables A-12a and A-12b list the variables the CHAID analyses selected to define the classification trees. Tables A-12a and A-12b also include the listed variables’ importance, which is a data-mining metric based on a variables’ contribution to reducing the residual sum of squares, and count, which is the number of times a variable is used by the CHAID algorithm to split a node of the tree into two children nodes.
All of the results in this memorandum were obtained by analyzing data in Westat’s high-security enclave, where there is a strict protocol for the installation of approved software. We developed the CHAID trees using SAS’s PROC HPSLIT, because the SAS/STAT procedures have been approved for use in the high-security enclave. Unlike other implementations of the CHAID algorithm, SAS’s PROC HPSPLIT does not permit the use of weights. Nevertheless, the leaves of the developed trees can still be used to define non-response adjustment cells, which a Westat-developed SAS macro, named CollAdj, will analyze in order to compute non-response adjustment factors based on weighted response rates and will compute metrics to allow Westat statisticians to determine if there should be any collapsing of cells.
TABLE A-10 Response Rates (calculated with AAPOR RR3 formula) for Levels of Sampling-Frame Categorical Variables
| Variable | Description | Level Number | Weighted RR3 (%) | Unweighted RR3 (%) |
|---|---|---|---|---|
| OVERALL | 20.4 | 22.0 | ||
| STRATUM | See Table 1 | 1 | 17.2 | 17.2 |
| 2 | 20.7 | 20.7 | ||
| 3 | 30.8 | 30.8 | ||
| 4 | 20.0 | 20.0 | ||
| 5 | 26.4 | 26.4 | ||
| 6 | 22.4 | 22.4 | ||
| 7 | 28.2 | 28.2 | ||
| 8 | 18.8 | 18.8 | ||
| 9 | 25.0 | 25.0 | ||
| 10 | 24.8 | 24.8 | ||
| 11 | 31.7 | 31.7 | ||
| 12 | 16.4 | 16.4 | ||
| 13 | 27.3 | 27.3 | ||
| ANYMH24_R | Use VA mental health services | 1 | 26.1 | 26.1 |
| Do not use VA mental health services or missing | 14 | 19.2 | 20.6 | |
| ANYVAHLTH_R | Use VA health services | 1 | 27.3 | 27.2 |
| Do not use VA health services or missing | 14 | 17.8 | 19.1 | |
| ISCTYPE2, Type of separation | Enlisted, expiration of term of service | 1 | 21.1 | 21.8 |
| Enlisted, early release | 2 | 19.2 | 19.4 | |
| Enlisted, disability | 3 | 18.1 | 19.9 | |
| Enlisted, unqualified | 4 | 28.9 | 27.2 | |
| Enlisted, retirement | 5 | 31.8 | 31.9 | |
| Enlisted, drugs | 6 | 17.9 | 18.4 | |
| Enlisted, pregnancy or parenthood | 7 | 24.4 | 25.0 | |
| Enlisted, other | 8 | 20.4 | 21.2 | |
| Officer, expiration of term of service | 9 | 30.2 | 27.3 | |
| Officer, voluntary release | 10 | 31.7 | 31.0 | |
| Officer, retirement | 11 | 40.4 | 40.5 | |
| Officer, other | 12 | 24.9 | 30.0 | |
| Missing | 14 | 19.6 | 21.1 | |
| RACE_R | White | 1 | 28.3 | 28.0 |
| Black | 2 | 28.1 | 28.9 | |
| Asian | 3 | 25.9 | 25.6 | |
| Other | 4 | 23.2 | 23.0 | |
| Missing | 14 | 17.8 | 19.1 | |
| SEX_R | Female | 1 | 28.5 | 28.0 |
| Male | 2 | 24.5 | 24.2 | |
| Unknown | 3 | 17.2 | 17.2 | |
| UNITCODE_R | Active | 1 | 23.6 | 23.9 |
| Reserve | 2 | 26.7 | 26.8 | |
| Missing | 14 | 18.2 | 18.9 | |
| AGECAT_R | <24 | 1 | 16.4 | 16.5 |
| 25–29 | 2 | 18.8 | 19.5 | |
| 30–34 | 3 | 21.0 | 22.2 |
| Variable | Description | Level Number | Weighted RR3 (%) | Unweighted RR3 (%) |
|---|---|---|---|---|
| 35–39 | 4 | 23.2 | 24.1 | |
| 40–44 | 5 | 24.3 | 25.2 | |
| 45–49 | 6 | 32.3 | 32.2 | |
| 50–54 | 7 | 32.4 | 33.8 | |
| 55–59 | 8 | 36.6 | 35.9 | |
| 60–65 | 9 | 39.3 | 39.9 | |
| 66+ | 10 | 38.2 | 37.7 | |
| Missing | 14 | 16.2 | 16.2 | |
| NUM_DEPLOY2, number of deployments | 1 | 1 | 24.5 | 24.5 |
| 2 | 2 | 24.2 | 25.1 | |
| 3 | 3 | 25.2 | 25.1 | |
| 4 | 4 | 26.1 | 26.1 | |
| 5+ | 5 | 27.5 | 27.7 | |
| Zero or missing | 14 | 18.2 | 18.9 | |
| RANKD_R, pay grade | E1-E3 | 1 | 19.1 | 19.8 |
| E4 | 2 | 21.2 | 22.3 | |
| E5 | 3 | 26.6 | 26.2 | |
| Other enlisted | 4 | 33.7 | 34.2 | |
| Warrant officers | 5 | 39.6 | 40.0 | |
| Commissioned officers | 6 | 33.9 | 33.8 | |
| Missing | 14 | 18.2 | 18.9 | |
| SVC_PCT2, service disability percent | 10–40 | 1 | 28.1 | 27.9 |
| 50+ | 2 | 28.5 | 28.8 | |
| Zero or missing | 14 | 18.6 | 20.0 |
A recent simulation study conducted by Lohr et al. (2015) suggests that not using weights when using tree-based methods to develop non-response adjustment cells is superior to using weights.8
Non-Response Bias Analysis
Tables A-13 and A-14 compare the estimated bias in weighted second-phase-sample estimates computed with overall base weights versus final weights. Each table contains estimates computed for variables present on the first-phase-sample file of VA-provided administrative data. The two sets of weights—overall base weights and final weights—for the respondents to the second-phase sample, along with the corresponding administrative data, were used to compute the second-phase-sample estimates. The bias in each second-phase-sample estimate was estimated by subtracting from the estimate the weighted estimate computed from the first-phase-sample base weights and the administrative data for all of the first-phase sample cases.
Table A-13 compares the estimated biases for base-weighted and final-weighted estimated proportions computed for the following categorical variables present on the first-phase-sample file of VA-provided administrative data:
___________________
8 Lohr, S., V. Hsu, and J. Montaquila. 2015. Using classification and regression trees to model survey nonresponse, Proceedings of the Survey Research Section, American Statistical Association, pp. 2071–2085.
TABLE A-11 Test for Association Between Response Status and Levels of Sampling-Frame Categorical Variablesa
| Variable | Description | Respondents | Non-Respondents | CHISQ | P_VALUE | ||
|---|---|---|---|---|---|---|---|
| Percentage | Stdrd Err | Percentage | Stdrd Err | ||||
| STRATUM | See above | 50.8 | 0.62 | 62.4 | 0.16 | 285.4580 | <.0001 |
| 0.3 | 0.05 | 0.3 | 0.01 | ||||
| 2.4 | 0.17 | 1.4 | 0.04 | ||||
| 0.8 | 0.11 | 0.8 | 0.03 | ||||
| 6.1 | 0.21 | 4.3 | 0.05 | ||||
| 0.5 | 0.06 | 0.4 | 0.02 | ||||
| 3.0 | 0.10 | 1.9 | 0.03 | ||||
| 3.0 | 0.18 | 3.4 | 0.05 | ||||
| 20.7 | 0.53 | 15.9 | 0.14 | ||||
| 0.3 | 0.04 | 0.2 | 0.01 | ||||
| 1.6 | 0.07 | 0.9 | 0.02 | ||||
| 1.3 | 0.14 | 1.7 | 0.04 | ||||
| 9.2 | 0.43 | 6.3 | 0.11 | ||||
| 100.00 | 100.0 | ||||||
| ANYMH24_R | Use VA mental health services | 22.0 | 0.51 | 16.0 | 0.13 | 89.3850 | <.0001 |
| Do not use VA mental health services or missing | 78.0 | 0.51 | 84.0 | 0.13 | |||
| 100.0 | 100.0 | ||||||
| ANYVAHLTH_R | Use VA health services | 36.4 | 0.76 | 24.8 | 0.31 | 143.8640 | <.0001 |
| Do not use VA health services or missing | 63.6 | 0.76 | 75.2 | 0.31 | |||
| 100.0 | 100.0 | ||||||
| Enlisted, expiration of term of service | 10.0 | 0.46 | 9.6 | 0.14 | 83.3751 | <.0001 | |
| ISCTYPE2, type of separation | Enlisted, early release | 0.9 | 0.11 | 1.0 | 0.07 | ||
| Enlisted, disability | 1.4 | 0.14 | 1.6 | 0.08 | |||
| Enlisted, unqualified | 0.6 | 0.10 | 0.4 | 0.04 | |||
| Enlisted, retirement | 4.7 | 0.23 | 2.6 | 0.08 | |||
| Enlisted, drugs | 0.5 | 0.09 | 0.5 | 0.06 | |||
| Enlisted, pregnancy or parenthood | 0.4 | 0.06 | 0.3 | 0.03 | |||
| Enlisted, other | 2.0 | 0.17 | 2.0 | 0.10 | |||
| Officer, expiration of term of service | 0.6 | 0.11 | 0.4 | 0.03 | |||
| Officer, voluntary release | 0.6 | 0.11 | 0.3 | 0.04 | |||
| Officer, retirement | 1.5 | 0.16 | 0.6 | 0.05 | |||
| Officer, other | 0.2 | 0.05 | 0.1 | 0.03 | |||
| Missing | 76.5 | 0.61 | 80.5 | 0.20 | |||
| 100.0 | 100.0 | ||||||
| RACE_R | White | 22.4 | 0.69 | 14.5 | 0.26 | 170.7225 | <.0001 |
| Black | 7.2 | 0.35 | 4.7 | 0.16 | |||
| Asian | 1.1 | 0.16 | 0.8 | 0.08 | |||
| Other | 5.6 | 0.37 | 4.8 | 0.17 | |||
| Missing | 63.6 | 0.76 | 75.2 | 0.31 | |||
| 100.0 | 100.0 | ||||||
| Variable | Description | Respondents | Non-Respondents | CHISQ | P_VALUE | ||
|---|---|---|---|---|---|---|---|
| Percentage | Stdrd Err | Percentage | Stdrd Err | ||||
| SEX_R | Female | 8.1 | 0.23 | 5.2 | 0.06 | 255.1879 | <.0001 |
| Male | 41.2 | 0.62 | 32.4 | 0.16 | |||
| Unknown | 50.8 | 0.62 | 62.4 | 0.16 | |||
| 100.0 | 100.0 | ||||||
| UNITCODE_R | Active | 22.7 | 0.58 | 18.8 | 0.18 | 122.4881 | <.0001 |
| Reserve | 17.0 | 0.50 | 11.9 | 0.15 | |||
| Missing | 60.3 | 0.61 | 69.2 | 0.16 | |||
| 100.0 | 100.0 | ||||||
| AGECAT_R | <24 | 0.5 | 0.09 | 0.7 | 0.05 | 262.7585 | <.0001 |
| 25–29 | 6.1 | 0.27 | 6.8 | 0.11 | |||
| 30–34 | 11.1 | 0.46 | 10.7 | 0.20 | |||
| 35–39 | 9.3 | 0.37 | 7.9 | 0.17 | |||
| 40–44 | 6.2 | 0.38 | 4.9 | 0.14 | |||
| 45–49 | 7.7 | 0.31 | 4.1 | 0.13 | |||
| 50–54 | 6.7 | 0.35 | 3.6 | 0.13 | |||
| 55–59 | 4.2 | 0.33 | 1.9 | 0.10 | |||
| 60–65 | 2.5 | 0.25 | 1.0 | 0.07 | |||
| 66+ | 2.3 | 0.29 | 0.9 | 0.09 | |||
| Missing | 43.4 | 0.78 | 57.6 | 0.28 | |||
| 100.0 | 100.0 | ||||||
| NUM_ DEPLOY2, number of deployments | 1 | 17.5 | 0.50 | 13.8 | 0.19 | 125.9334 | <.0001 |
| 2 | 11.6 | 0.43 | 9.2 | 0.18 | |||
| 3 | 4.8 | 0.28 | 3.6 | 0.11 | |||
| 4 | 2.6 | 0.19 | 1.9 | 0.09 | |||
| 5+ | 3.2 | 0.22 | 2.2 | 0.10 | |||
| Zero or missing | 60.3 | 0.61 | 69.2 | 0.16 | |||
| 100.0 | 100.0 | ||||||
| RANKD_R, pay grade | E1–E3 | 9.5 | 0.34 | 10.3 | 0.12 | 245.8406 | <.0001 |
| E4 | 9.4 | 0.35 | 8.9 | 0.11 | |||
| E5 | 5.8 | 0.24 | 4.1 | 0.08 | |||
| Other enlisted | 9.0 | 0.31 | 4.5 | 0.09 | |||
| Warrant officers | 0.6 | 0.08 | 0.2 | 0.02 | |||
| Commissioned officers | 5.4 | 0.29 | 2.7 | 0.07 | |||
| Missing | 60.3 | 0.61 | 69.2 | 0.16 | |||
| 100.0 | 100.0 | ||||||
| SVC_PCT2, service disability percent | 10–40 | 9.4 | 0.42 | 6.2 | 0.19 | 136.1223 | <.0001 |
| 50+ | 16.1 | 0.58 | 10.3 | 0.20 | |||
| Zero or missing | 74.6 | 0.67 | 83.5 | 0.28 | |||
| 100.0 | 100.0 | ||||||
aBase weights and associated replicate weights were used to compare the categorical distributions respondents and other non-respondents. P-value incorporates second-order Rao–Scott correction.
- Use of VA Health Services. The proportion of veterans who use VA health services was more than 10 percentage points higher when estimated with the overall base weights than when estimated with the final weights due to the higher response rates of veterans who use VA health services. (See Table A-10.) The estimated bias in the base-weighted estimate is slightly less than 10 percentage points, whereas the estimate bias in the final-weighted estimate is less than 1 percentage point.
TABLE A-12a Variables Selected by CHAID to Define the Classification Tree for Response by Deployed Veteransa
| Variable | Description | Importance | Relative Importance | Count |
|---|---|---|---|---|
| RANKD_R | Pay grade | 8.14 | 1.00 | 3 |
| RACE_R | Race | 4.45 | 0.55 | 3 |
| ISCTYPE2 | Type of military separation | 2.83 | 0.35 | 2 |
| SEX_R | Sex | 2.69 | 0.33 | 1 |
| STRATUM | Sampling stratum | 2.47 | 0.30 | 4 |
| ANYVAHLT_R | Use of VA health services | 2.29 | 0.28 | 2 |
| AGECAT_R | Age category | 1.92 | 0.24 | 4 |
| ANYMH24_R | Use of VA mental health services | 1.13 | 0.14 | 1 |
aImportance is a data-mining metric based on a variable’s contribution to reducing the residual sum of squares. Count is the number of times a variable is used to split a node of the tree into two children nodes.
TABLE A-12b Variables Selected by CHAID to Define the Classification Tree for Response by Non-Deployed Veteransa
| Variable | Description | Importance | Relative Importance | Count |
|---|---|---|---|---|
| AGECAT_R | Age category | 7.87 | 1.00 | 2 |
| ANYVAHLT_R | Use of VA health services | 2.84 | 0.36 | 1 |
| RACE_R | Race | 2.25 | 0.29 | 2 |
| STRATUM | Sampling stratum | 1.46 | 0.19 | 1 |
| SVCPCT2 | Service disability percent | 1.31 | 0.17 | 1 |
aImportance is a data-mining metric based on reduction of residual squared error. Count is the number of times a variable is used to define a split.
- Race. Race is missing on many of the records in the administrative data. However, the response rate for veterans with missing race values is less than for veterans in which race is not missing, so the base-weighted estimate of the proportion of these estimates is biased downward by nearly 10 percentage points. The estimated absolute biases of the final weighted estimated proportions, on the other hand, are all less than 1 percentage point.
- Active Versus Reserve. The estimated absolute biases in the base-weighted estimated proportions range from 3.28 to 7.38 percentage points, whereas the estimated absolute biases of the final-weighted estimated proportions are all less than 0.2 percentage points.
- Military Rank. The largest estimated absolute bias in the base-weighted estimated proportion is over 7 percentage points for veterans with missing rank information in the administrative data, whereas for the final-weighted estimated proportions for categories of military rank all of the estimated absolute biases are less than 0.4 percentage points.
Table A-14 compares base-weighed and final-weighted estimated means computed for selected continuous variables present on the first-phase-sample file of VA-provided administrative data. The ratio of the absolute bias for the base-weighted estimated mean to that for the corresponding final-weighted estimated mean ranges from 2.69 to 7.8.
___________________
9 Italics indicates revision to text of an earlier version of this document.
TABLE A-13 Comparison of Estimated Bias for Weighted Proportions Computed with Overall Base Weights Versus Final Weights for Selected Categorical Variables (standard errors are shown in parentheses)
| Variable | Description | Weighted Proportion (%) | 2nd-Phase Sample | |||||
|---|---|---|---|---|---|---|---|---|
| 2nd-Phase Sample | Est. Bias (%) | P Values | ||||||
| Base Weights | Final Weights | 1st-Phase Sample | Base Weights | Final Weights | Base Weights | Final Weights | ||
| ANYVAHLTH_R | Use VA health services | 36.80 | 26.36 | 27.06 | 9.73 (0.79) | −0.70 (0.10) | <0.001 | <0.001 |
| Do not use VA health services or missing | 63.20 | 73.64 | 72.93 | −9.73 (0.79) | 0.70 (0.10) | <0.001 | <0.001 | |
| RACE_R | White | 22.64 | 16.11 | 16.36 | 6.28 (0.66) | −0.24 (0.34) | <0.001 | 0.47 |
| Black | 7.31 | 4.76 | 5.06 | 2.25 (0.39) | −0.30 (0.22) | <0.001 | 0.17 | |
| Asian | 1.17 | 0.86 | 0.83 | 0.33 (0.17) | 0.03 (0.13) | 0.05 | 0.79 | |
| Other | 5.69 | 4.62 | 4.82 | 0.87 (0.37) | −0.19 (0.26) | 0.02 | 0.45 | |
| Missing | 63.20 | 73.64 | 72.93 | −9.73 (0.79) | 0.70 (0.10) | <0.001 | <0.001 | |
| UNITCODE_R | Active | 22.76 | 19.31 | 19.48 | 3.28 (0.62) | −0.17 (0.37) | <0.001 | 0.66 |
| Reserve | 16.86 | 12.03 | 12.77 | 4.10 (0.54) | 0.17 (0.37) | <0.001 | 0.65 | |
| Missing | 60.38 | 67.756 | 67.757 | −7.38 (0.78) | −0.001 (0.00) | <0.001 | 1.00 | |
| RANKD_R, pay grade | E1-E3 | 9.51 | 9.78 | 10.15 | −0.64 (0.40) | −0.37 (0.25) | 0.11 | 0.15 |
| E4 | 9.35 | 9.14 | 8.98 | 0.36 (0.40) | 0.16 (0.25) | 0.37 | 0.53 | |
| E5 | 5.81 | 4.43 | 4.37 | 1.44 (0.33) | 0.06 (0.07) | <0.001 | 0.36 | |
| Other enlisted | 9.00 | 5.21 | 5.16 | 3.84 (0.41) | 0.05 (0.10) | <0.001 | 0.61 | |
| Warrant officers | 0.56 | 0.31 | 0.30 | 0.26 (0.11) | 0.02 (0.05) | <0.001 | 0.75 | |
| Commissioned officers | 5.39 | 3.35 | 3.27 | 2.12 (0.32) | 0.08 (0.10) | <0.001 | 0.41 | |
| Missing | 60.38 | 67.756 | 62.757 | −7.38 (0.78) | -0.001 (0.00) | <0.001 | 1.00 | |
TABLE A-14 Comparison of Estimated Bias of Weighted Means Computed with Overall Base Weights Versus Final Weights for Selected Continuous Variables* (standard errors are shown in parentheses)
| Variable | Description | Weighted Proportion (%) | 2nd-Phase Sample | ||||||
|---|---|---|---|---|---|---|---|---|---|
| 2nd-Phase Sample | 1st-Phase Sample | Est. Bias (%) | P Values | ||||||
| Base Weights | Final Weights | Base Weights | Final Weights | Ratio Base-to-Final | Base Weights | Final Weights | |||
| OPALL_CNT24 | The number of mental health outpatient encounters with a mental health diagnosis code in the last 24 months | 2.48 | 1.76 | 1.86 | 0.62 (0.20) | −0.09 (0.14) | 7.8 | 0.002 | 0.52 |
| OPALL_CNT_SEP | The number of mental health outpatient encounters with a mental health diagnosis code since separation | 6.33 | 4.38 | 4.79 | 1.54 (0.45) | −0.41 (0.28) | 3.8 | <0.001 | 0.14 |
| OPMH_CNT24 | The number of mental health outpatient encounters with a mental health stop code in the last 24 months | 3.07 | 2.21 | 2.42 | 0.65 (0.23) | −0.21 (0.16) | 3.1 | 0.004 | 0.19 |
| OPMH_CNT_SEP | The number of mental health outpatient encounters with a mental health stop code since separation | 7.89 | 5.51 | 6.18 | 1.71 (0.51) | −0.67 (0.32) | 2.6 | <0.001 | 0.03 |
*Italics indicates revision to text of an earlier version of this document.
CHAID Tree for Responding Deployed Veterans. A node’s proportion for Category 1 indicates the node’s response rate.
CHAID tree for Responding Non-Deployed Veterans. A node’s proportion for Category 1 indicates the node’s response rate.

NON-RESPONSE BIAS ANALYSIS AND CALCULATION OF WEIGHTS
Calculation of Base Weights for Sampled Veterans in First-Phase Sample
Westat received a first-phase sample from the VA and then selected from the first-phase sample a stratified second-phase sample. The first-phase sample consisted of two data files. One file, containing 470,606 records, contained information for a sample of OEF/OIF/OND veterans who had been deployed to Iraq or Afghanistan and according to VA records were alive on October 1, 2015. The data source for this file was the OEF/OIF/OND roster file, which Dr. Rani Hoff of the VA described as follows10:
The OEF/OIF/OND Registry consists of all service members who served or are serving in the OEF/OIF/ON era and have enrolled with VA. Enrollment means that they have applied and been considered to be eligible for VA services; it does not mean that those individuals have received VA care. In addition, service members under certain circumstances (e.g., Reserve and National Guard member) can be eligible for VA services prior to the formal discharge from military services.
On March 15, 2016, the VA provided Westat and IOM/NAS a tabulation of the OEF/OIF/OND roster file from which the first-phase sample of deployed veterans (n’ = 470,606) had been selected. This tabulation indicated that the OEF/OIF/OND registry contained N = 1,400,569 veterans. Hence, the first-phase-sample base weight for deployed veterans is equal to N/n’= 1,400,569/470,606 = 2.9761. In other words, the first-phase sample of deployed veterans was approximately a 1-in-3 sample.
The second file the VA provided to Westat, containing 724,738 records, was a first-phase sample of OEF/OIF/OND veterans who had not been deployed to Iraq or Afghanistan. The VA selected this sample from multiple administrative data sources, with a veteran’s demographic variables being included on the file provided only if the veterans appeared in VA medical records. The VA did not provide Westat with any counts of the number of veterans present in the administrative data sources used to select the sample of non-deployed veterans nor the vintages of the administrative data sources. The VA selected the first-phase sample of non-deployed veterans in early 2016.
We had asked the VA to select a 1-in-4 sample of both deployed and non-deployed veterans. However, as noted above, the first-phase sample of deployed veterans was approximately a 1-in-3 sample. We therefore carried out a check on the sampling fraction used for the first-phase sample of non-deployed veterans. This check was based on the VetPop2014 Model predictions produced by the VA’s Office of the Actuary, predictions that are based on ACS estimates and DoD administrative data. Table 2L from the VetPop2014 Model contains the predictions for September 30, 2015, and September 30, 2016, shown below:
| Description | Projected Living Veterans, 9/30/2015 | Projected Living Veterans, 9/30/2016 |
|---|---|---|
| Gulf War (Pre 9/11) and Gulf War (Post 9/11) only) | 1,315,019 | 1,358,341 |
| Gulf War (Post 9/11) only | 2,794,947 | 2,985,802 |
| Total | 4,109,966 | 4,343,902* |
*Due to rounding, the individual projections do not sum to the total.
Note that September 30, 2015, differs by only 1 day from the date of the data used to select the sample of deployed veterans from the OEF/OIF/OND register file containing 1,400,569 records. Hence, an estimate of the number of non-deployed OEF/OIF/OND veterans on September 30, 2015, can be obtained by subtraction, and then an estimate of the number of non-deployed OEF/OIF/OND veterans
___________________
10 Email from Rani Hoff of the VA to Laura Aiuppa of the National Academies, May 6, 2016.
on September 30, 2016, can be obtained by multiplying the 2015 estimate by the 2016-to-2015 ratio for all OEF/OIF/OND veterans. Along with the estimate obtained by multiplying the size of the nondeployed sample by 4, below are the estimates of the number of non-deployed OEF/OIF/OND veterans in the administrative data sources from which the VA selected the sample of non-deployed veterans:
| N Based on | Calculation of N | Estimated N | Base Weight |
|---|---|---|---|
| 9/30/2015 projection | N = 4,109,956 − 1,400,569 | 2,709,387 | 3.7384 |
| 9/30/2016 projection | N = 2,709,387 × 4,343,902 / 4,109,956 | 2,863,610 | 3.9512 |
| Assumed 1 in 4 sample | N = 4 × 724,738 | 2,898,952 | 4.0000 |
The base weights in this table are very similar. Given the likely inaccuracies in the two projections, we prefer not to use either of them for developing the first-phase weights. Our conclusion from this analysis is that the sample of non-deployed OEF/OIF/OND veterans was a one-in-four sample, and a first-phase sample base weight of 4.0 should be used for this sample. Because of the large size of the sample of non-deployed OEF/OIF/OND veterans (n’ = 724,738), we believe that the best estimate of N for non-deployed OEF/OIF/OND veterans is obtained by multiplying the first-phase sample size by 4.
Calculation of Overall Base Weights for Sampled Veterans in the Second-Phase Sample
Westat combined the two VA-provided data files to create a sampling frame for the selection of a stratified second-phase sample. The stratification variables for the second-phase sample were deployment status (2 levels: yes or no), the usage of VA mental health services (2 levels: yes or no), sex (3 levels: male, female, missing), and age category (3 levels: <30, 30+, and missing). For the purposes of increasing the precision of subpopulation estimates, female veterans, deployed veterans, and veterans who use VA mental health services were oversampled. Also, veterans younger than 30 were over-sampled due to their expected lower response rates compared to older veterans.
Table A-15 describes the second-phase sampling strata and the size of the first- and second-phase samples associated with these strata, denoted n’h and nh, respectively. The computed overall base weight for a veteran selected for the second phase was equal to the appropriate first-phase-sample base weight times the ratio n’h/nh.
TABLE A-15 Second-Phase-Sampling Sample Design
| Deployed? | Use of VA MH Services | Sex | Age Category | Stratum | Sample Size | |
|---|---|---|---|---|---|---|
| 1st Phase | 2nd Phase | |||||
| No | No | Missing | Missing | 1 | 645,389 | 7,855 |
| Yes | Female | <30 30+ |
2 3 |
3,590 16,872 |
145 510 |
|
| Male | <30 30+ |
4 5 |
8,612 50,275 |
195 850 |
||
| Yes | No | Female | <30 30+ |
6 7 |
6,183 31,046 |
410 1,535 |
| Male | <30 30+ |
8 9 |
47,569 244,032 |
970 3,725 |
||
| Yes | Female | <30 30+ |
10 11 |
3,385 14,935 |
165 545 |
|
| Male | <30 30+ |
12 13 |
23,896 99,560 |
605 1,890 |
||
| Total | 19,400 | |||||
TABLE A-16 Breakdown of Second-Phase Category by Survey Outcome
| Aggregated Outcomes | Detailed Outcomes | ||
|---|---|---|---|
| Description | # Cases | Description | # Cases |
| Respondents | 4,271 | Eligible completed cases | 4,180 |
| Known ineligibles: | 91 | ||
| Deceased | 38 | ||
| Not a Veteran / Never in service | 15 | ||
| Separated/retired before 1/1/2002 Still on active duty | 22 | ||
| 16 | |||
| Non-respondents | 15,129 | Responded declining to participate (refusal) | 17 |
| Failed to respond | 15,112 | ||
| Total | 19,400 | ||
Calculation of Non-Response Adjustment Factors
Table A-16 contains a breakdown of the 19,400 veterans who were selected for the second-phase sample and invited to participate in the survey.
For weighting purposes, the population of inference is defined to be the population at the time of sampling, so that the known ineligible cases are classified as “respondents.” This definition facilitates the use of population controls for that population. All “respondents” will thus be assigned weights for the analysis, but analysts can simply subset their analyses to eligible completed cases.
The dependent variable for the CHAID analysis was the base-weighted proportion of “respondents” in the second-phase sample. (A separate document updates an earlier memo we wrote about the CHAID analysis.) Weighting cells were created by using the scoring code produced by the CHAID analysis to assign each of the 19,400 sampled veterans to one of 29 leaves of the CHAID tree. Cells were combined when necessary to achieve a minimum cell size of 29 “respondents.”11 In particular, two weighting cells were combined if one or both of the cells had fewer than 29 ‘respondents’ and both cells had the same parent node in the CHAID tree. This reduced the number of weighting cells to 24.
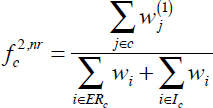
After the weighting cells were formed, a non-response adjustment factor was computed for each cell as the combination of (1) the inverse of the response rate in the cell and (2) an adjustment factor to align the sum of the adjusted overall weights of “respondents” to the second-phase sample to the sum of the first-phase sample weights of veterans selected for the first-phase sample. This operation was conducted in a single step. To compute the needed sums of first-phase sample weights by cell, we used the scoring code from the CHAID analysis to assign each of the 1,195,344 veterans in the first-phase-sample file to a weighting cell and then summed to the cell level the associated first-phase-sample base weights. The following formula was used to compute the adjustment factor for each weighting cell:
___________________
11 Sampled cases—that is, both respondents and non-respondents—were used to create the CHAID tree, which had a minimum of 50 sampled cases per leaf. Some of the leaves contained fewer than 29 “respondents,” however, and to form weighting cells these leaves were combined with another leaf having the same parent in the CHAID tree.
where  is the sum of the first-phase-sample weights for all first-phase sampled veterans in weighting cell c,
  is the sum of overall base weights for eligible respondents in weighting cell c, and
  is the sum of overall base weights for veterans know ineligibles in weighting cell c.
The magnitudes of the adjustment factor ranged from 2.32 to 6.19. The adjusted weights were calculated by multiplying the overall base weights of the “respondents” by the adjustment factor and by setting the adjusted weight of the non-respondents to zero.
Raking to Population Totals
To the raking cells for deployed veterans associated with the four interior cells of Table A-17, we added a fifth raking cell for non-deployed veterans, which contained the control total 2,898,952, obtained by multiplying the size of the first-phase sample for non-deployed veterans by 4. For this raking step, the sample file was subset to include only “respondents,” with each “respondent” assigned to a raking cell based on the values of sex, deployment status, and the usage of VA mental health services during the past 24 months present on the VA-provided administrative data for the first-phase sample. Because there was only a single raking dimension, consisting of five cells, the raking factor associated with a raking cell was the cell’s control total divided by the sum of the adjusted overall base weights for the cell. The raking factors ranged from 0.91752 to 1.12489. The final raked weight for a “respondent” was its adjusted base weight multiplied by the raking factor for the raking cell to which it had been assigned.
The precision of survey estimates is improved if known information about the total population is used during the weighting process. We used a raking method to incorporate into the weights population-level totals shown in the following VA-provided tabulation of the OEF/OIF/OND registry.
The following are unweighted quantiles for the raked weights:
| 100% max | 2035.7 |
| 99% | 2035.7 |
| 95% | 2035.7 |
| 90% | 2035.7 |
| 75% Q3 | 2035.7 |
| 50% median | 725.2 |
| 25% Q1 | 415.0 |
| 10% | 238.3 |
| 5% | 200.4 |
| 1% | 149.5 |
| 05 Min | 97.7 |
A rule we use for determining whether large weights should be trimmed is to trim those weights that exceed 3.5 times the median weight. Because the largest weight was only 2035.7/725.2 = 2.8 times the median weight, we decided not to trim any of the weights. The largest weights were for “respondents” in sampling stratum 1, which contains non-deployed veterans who had not used VA mental health services in the past 24 months. The smallest weights were for “respondents” in sampling strata 6 and 7, which contain deployed female veterans who had also not used VA mental health services in the past 24 months.
Design Effects
Though over-sampling increases the precision of some subpopulation estimates, it can produce a loss in precision for population-level estimates. A measure of this loss in precision due to over-sampling is the design effect, which is the ratio of the stratified-sample variance to the variance of an unstratified sample of the same size. An approximation for the design effect, denoted deff, of an estimated mean is the following:
![]()
where c is the coefficient of variation of the weights of the eligible completed cases used to compute the mean. Table A-18 contains the values of c and deff for the intermediate and final versions of calculated weights.
Variance Estimation
We also calculated replicate weights, using the JKn method. Each of the 13 sampling strata was a variance stratum, each of which in turn contained 15 variance units, yielding 195 replicate samples.12 Our adjustment of the overall base weights to totals of first-phase-sample base weights and also the raking of the adjusted weights for deployed veterans to population totals can reduce the sampling variability of estimates computed from data correlated with the variables used to compute these totals. The use of the replicate weights to estimate standard errors captures this reduction in sampling variability, whereas the use of Taylor linearization to estimate standard errors does not.
Table A-19 compares standard errors computed using replicate weights with those computed using Taylor linearization for some weighted proportions computed from the administrative data for the second-phase sample’s eligible completed cases. Table A-20 is similar to Table A-19, except that it is for weighted means computed from selected continuous administrative-data variables.
TABLE A-18 Coefficients of Variation of the Weights for Eligible Completed Cases
| Type of Sample Weight | c | deff |
|---|---|---|
| First-phase-sample base weights | 0.1471 | 1.02 |
| Overall weights | ||
| Base weights | 0.4433 | 1.20 |
| Adjusted base weights | 0.6870 | 1.47 |
| Raked weights | 0.6901 | 1.48 |
___________________
12 To create the 15 variance units within each sampling stratum, we sorted the second-phase sample by the same variables that the first-phase sample had been sorted by when selecting the second-phase sample. The second-phase-sample cases were then assigned systematically to the 15 variance units associated with each sampling stratum. Second-phase-sample case number 1 was assigned to Variance Unit 1, sample case number 2 was assigned to Variance Unit 2, . . ., sample case number 15 was assigned to Variance Unit 15, sample case number 16 was assigned to Variance Unit 1, etc.
TABLE A-19 Comparison of Calculated Standard Errors for Selected Categorical Variables
| Variable | Description | Weighted Proportion (%) | Estimated Standard Error (%) | |
|---|---|---|---|---|
| Replication | Taylor | |||
| ANYMH24_R | Use VA mental health services | 16.3 | 0.30 | 0.53 |
| Do not use VA mental health services or missing | 83.7 | 0.30 | 0.53 | |
| ANYVAHLTH_R | Use VA health services | 26.4 | 0.10 | 0.70 |
| Do not use VA health services or missing | 73.6 | 0.10 | 0.70 | |
| RACE_R | White | 16.1 | 0.34 | 0.55 |
| Black | 4.8 | 0.22 | 0.28 | |
| Asian | 0.9 | 0.13 | 0.13 | |
| Other | 4.6 | 0.26 | 0.32 | |
| Missing | 73.6 | 0.10 | 0.70 | |
| UNITCODE_R | Active | 19.3 | 0.37 | 0.59 |
| Reserve | 12.9 | 0.37 | 0.47 | |
| Missing | 67.8 | 0.00 | 0.76 | |
| RANKD_R, pay grade | E1-E3 | 9.8 | 0.25 | 0.44 |
| E4 | 9.1 | 0.25 | 0.42 | |
| E5 | 4.4 | 0.07 | 0.26 | |
| Other enlisted | 5.2 | 0.10 | 0.26 | |
| Warrant officers | 0.3 | 0.05 | 0.06 | |
| Commissioned officers | 3.4 | 0.10 | 0.21 | |
| Missing | 67.8 | 0.00 | 0.76 | |
TABLE A-20 Comparison of Calculated Standard Errors for Selected Continuous Variables
| Variable | Description | Weighted Proportion (%) | Estimated Standard Error (%) | |
|---|---|---|---|---|
| Replication | Taylor | |||
| OPALL_CNT24 | The number of mental health outpatient encounters with a mental health diagnosis code in the last 24 months | 1.76 | 0.14 | 0.16 |
| OPALL_CNT_SEP | The number of mental health outpatient encounters with a mental health diagnosis code since separation | 4.38 | 0.28 | 0.33 |
| OPMH_CNT24 | The number of mental health outpatient encounters with a mental health stop code in the last 24 months | 2.21 | 0.16 | 0.18 |
| OPMH_CNT_SEP | The number of mental health outpatient encounters with a mental health stop code since separation | 5.51 | 0.32 | 0.39 |
SURVEY ITEM SOURCES FOR THE OEF/OIF/OND VETERANS’ ACCESS TO HEALTH SERVICES SURVEY
| Item | Source References appear at the end of the table |
|---|---|
|
Q1. In what component(s) have Active Duty |
National Health Study for a New Generation of U.S. Veterans1 |
|
Q2. In what branch(es) did you serve? Select all that apply Army |
National Health Study for a New Generation of U.S. Veterans1 |
|
Q3. What was the highest rank and pay grade you held while in the military? E1–E4 |
National Vietnam Veteran Readjustment Study,2 MODIFIED |
|
Q4. Do you have a VA service-connected disability rating? Yes |
2010 National Survey of Veterans3 |
|
Q5. What is your VA service-connected disability rating? 0 percent |
2010 National Survey of Veterans3 |
|
Q6. Since September 11, 2001, how many months were you away in total for all deployments in support of OEF/OIF/OND? Include deployments to a combat area, noncombat area, or training mission. 1–6 months I have not been deployed in support of OEF/OIF/OND since September 11, 2001 |
New development |
| Item | Source |
|---|---|
|
Q7. How many of your deployments in support of OEF/OIF/OND were to the following combat areas? Mark zero if no deployments to these areas. Zero, 1, 2, 3, 4, 5, 6 to 9, 10 or more
|
2014 Wounded Warrior Project Annual Alumni Survey4 |
|
Q8. The statements below are about your experiences. Please indicate if you experienced the following events during your deployments in support of OEF/OIF/OND since September 11, 2001, by selecting the response that best fits your answer. The statements below are about your experiences. Please indicate if you experienced the following events during your deployments in support of OEF/OIF/OND since September 11, 2001, by selecting the response that best fits your answer. Never, Once or twice, Several times over entire employment, A few times each month, A few times each week, Daily or almost daily
|
DRRI, subset Aftermath and Combat Experience scales5 (subset based on guidance from Richard Kulka and Dawne Vogt) |
|
Q9. What is your date of birth? MM/DD/YYYY |
VA Health ViEWS6 |
|
Q10. Are you male or female? Male |
NHANES7 |
|
Q11. Are you of Hispanic, Latino, or Spanish origin? Select all that apply No, not of Hispanic, Latino, or Spanish origin |
2014 American Community Survey8 |
| Item | Source |
|---|---|
|
Q12. What is your race? Select all that apply White |
2014 American Community Survey8 |
|
Q13. What is the highest degree or level of school you have completed? Less than high school GED |
2010 National Survey of Veterans3 |
|
Q14. During the last week, were you . . . Working, or on paid vacation or sick leave from work |
2010 National Survey of Veterans3 |
|
Q15. What is the main reason you were not looking for work? You are retired |
2010 National Survey of Veterans,3 MODIFIED (to include health-related option) |
| Item | Source |
|---|---|
|
Q16. What is your current marital status? Now Married |
2010 National Survey of Veterans3 |
|
Q17. How many people, including yourself, live in your household? |
National Survey of Women Veterans9 |
|
Q18. Which income range category represents the total combined income of all members of this household during the past 12 months? Less than $10,000 |
2010 National Survey of Veterans,3 MODIFIED (collapsed response categories) |
|
Q19. Are you CURRENTLY covered by any of the following types of health insurance or health coverage plans? Select all that apply No health insurance |
2014 American Community Survey,8 MODIFIED (to include ACA option and also moved VA insurance up to first option) |
|
Q20. In the past 24 months, have you used any of the following VA benefits or services? Select Yes or No for each item.
|
New development |
| Item | Source |
|---|---|
|
Q21. In the past 24 months, have you used any of the following physical health care services (any care other than mental health)? Yes, No, but I am or have been eligible in the past 24 months, No, and I have not been eligible in the past 24 months
|
New development |
|
Q22. In the past 24 months, have you used any of the following mental or behavioral health care services? Select Yes or No for each item
|
New development |
|
Q23. Have you used the VA for any mental or behavioral health services, either inpatient or outpatient, such as group therapy, psychotherapy, social skills training, or rehabilitation programs since [MONTH, YEAR]? Yes |
New development |
|
Q24. Are you currently receiving mental health care through the VA? Yes |
New development |
|
Q25. During the past 4 weeks, have you had any of the following problems with your work or other regular daily activities as a result of any emotional problems (such as feeling depressed or anxious)? Yes, all of the time, Yes, most of the time, Yes, some of the time, Yes, a little of the time, No, none of the time
|
VR-12/3610 |
|
Q26. During the past 30 days, about how often did you feel . . . All of the time, Most of the time, Some of the time, A little of the time, None of the time
|
Kessler-611 |
| Item | Source |
|---|---|
|
Q27. In your life, have you ever had any experience that was so frightening, horrible, or upsetting that, in the past month, you: Yes, No
|
PC-PTSD12 |
|
Q28. Over the past 2 weeks, how often have you been bothered by any of the following problems?
|
PHQ-213 |
|
Q29. How often do you have a drink containing alcohol? Never |
AUDIT14 |
|
Q30. How many drinks containing alcohol do you have on a typical day when you are drinking? 1 or 2 |
AUDIT14 |
|
Q31. How often do you have six or more drinks on one occasion? Never |
AUDIT14 |
|
Q32. How often during the last year have you found that you were not able to stop drinking once you had started? Never |
AUDIT14 |
| Item | Source |
|---|---|
|
Q33. How often during the last year have you failed to do what was normally expected from you because of drinking? Never |
AUDIT14 |
|
Q34. How often during the last year have you been unable to remember what happened the night before because you had been drinking? Never |
AUDIT14 |
|
Q35. How often during the last year have you needed an alcoholic drink first thing in the morning to get yourself going after a night of heavy drinking? Never |
AUDIT14 |
|
Q36. How often during the last year have you had a feeling of guilt or remorse after drinking? Never |
AUDIT14 |
|
Q37. Have you or someone else ever been injured as a result of your drinking? No |
AUDIT14 |
|
Q38. Has a relative, friend, doctor, or another health professional ever expressed concern about your drinking or suggested you cut down? No |
AUDIT14 |
| Item | Source |
|---|---|
|
The following questions (Q39 to Q48) concern information about your possible involvement with drugs not including alcoholic beverages during the past 12 months.
“Drug abuse” refers to (1) the use of prescribed or over-the-counter drugs in excess of the directions, and (2) any nonmedical use of drugs. The various classes of drugs may include cannabis (marijuana, hashish), solvents (e.g., paint thinner), tranquilizers (e.g., Valium), barbiturates, cocaine, stimulants (e.g., speed), hallucinogens (e.g., LSD) or narcotics (e.g., heroin). Remember that the questions do not include alcoholic beverages. Please answer every question. If you have difficulty with a statement, then choose the response that is mostly right. Remember, all your answers are confidential and will not be traced back to you. These questions refer to the past 12 months only. |
DAST15,16 |
|
Q39. In the past 12 months, have you used drugs other than those required for medical reasons? Yes |
|
|
Q40. In the past 12 months, have you abused more than one drug at a time? Yes |
|
|
Q41. In the past 12 months, have you always been able to stop abusing drugs when you wanted to? Yes |
|
|
Q42. In the past 12 months, have you had blackouts or flashbacks as a result of drug use? Yes |
|
|
Q43. In the past 12 months, have you ever felt bad or guilty about your drug use? Yes |
|
|
Q44. In the past 12 months, has your spouse (or parents) ever complained about your involvement with drugs? Yes |
|
|
Q45. In the past 12 months, have you neglected your family because of your use of drugs? Yes |
|
| Item | Source |
|---|---|
|
Q46. In the past 12 months, have you engaged in illegal activities in order to obtain drugs? Yes |
|
|
Q47. In the past 12 months, have you experienced withdrawal symptoms (felt sick) when you stopped taking drugs? Yes |
|
|
Q48. In the past 12 months, have you had medical problems as a result of your drug use (e.g., memory loss, hepatitis, convulsions, bleeding)? Yes |
|
|
Q49. Was there ever a time during the past 24 months when you felt that you might need to see a professional because of problems with your emotions or nerves or your use of alcohol or drugs? Yes |
National Comorbidity Study17 |
|
Q50. In the past 24 months, has a health care professional told you that you have any of the following? Yes, No, Not sure
|
New development |
|
Q51. About how many miles from where you live is the nearest VA facility that offers mental health services? 0–10 miles |
National Survey of Women Veterans,9 MODIFIED |
|
Q52. How long does it take to get from where you live to the nearest VA facility that offers mental health services? Less than 10 minutes |
New development |
| Item | Source |
|---|---|
|
Q53. Would you say that transportation to the nearest VA facility that offers mental health services is: Very easy |
Barriers for Women Veterans to VA18 Health, MODIFIED |
|
Q54. There is a VA provider in my area that offers all of the mental health care services Veterans need. Strongly agree |
2011 Survey of Veteran Enrollees’ Health and Reliance Upon VA,19 MODIFIED |
|
Q55. How burdensome is the process for obtaining mental health care through the VA (e.g., paperwork, enrollment, scheduling)? Very burdensome |
New development |
|
Q56. In the past 24 months, how often was it easy to get appointments with VA mental health providers? Never |
Survey of Healthcare Experiences of Patients Ambulatory Care 2013,20 MODIFIED (to add does not apply type option) |
|
Q57. In the past 24 months, how often were you able to get the mental health care you needed from a VA facility during evenings, weekends, or holidays? Never |
Survey of Healthcare Experiences of Patients Ambulatory Care 2013,20 MODIFIED (to add does not apply type option) |
|
Q58. During the past 24 months, how satisfied were you with the period of time between requesting a VA appointment for mental health care and the actual appointment date? Very satisfied |
National Survey of Women Veterans,9 MODIFIED (to be specific to mental health care) |
| Item | Source |
|---|---|
|
Q59. Thinking about the past 24 months, how satisfied or dissatisfied are you with the availability of the following health care services at the VA? Very satisfied, Somewhat satisfied, Somewhat dissatisfied, Very dissatisfied, No opinion
|
New development |
|
Q60. Thinking about the past 24 months, how satisfied or dissatisfied are you with the availability of the following types of mental health providers at the VA? Very satisfied, Somewhat satisfied, Somewhat dissatisfied,
|
New development |
|
Q61. Thinking about the past 24 months, how satisfied or dissatisfied are you with the availability of the following mental health services at the VA? Very satisfied, Somewhat satisfied, Somewhat dissatisfied,
|
New development |
| Item | Source |
|---|---|
|
Q62. The following is a list of reasons why you might have chosen to use the VA for mental health care in the past 24 months. Please indicate how strongly you agree or disagree with each of these reasons. You chose to use the VA for mental health care because: Strongly agree, Somewhat agree, Somewhat disagree, Strongly disagree
|
National Survey of Women Veterans9 |
|
Q63. Choices for your treatment or health care can include choices about medicine or other treatment. In the past 24 months, did a VA mental health provider tell you there was more than one choice for your treatment or health care? Yes |
Survey of Healthcare Experiences of Patients Ambulatory Care 2013,20 MODIFIED (to be specific to mental health) |
|
Q64. Did the VA mental health provider you have seen most recently help you . . . A lot |
Post-Deployment Health of Armed Forces Personnel,21 MODIFIED (to specify most recent provider) |
|
Q65. All things considered, how satisfied are you with your mental health care at the VA in the past 24 months? Completely satisfied |
National Health Study for a New Generation of U.S. Veterans1 |
|
Q66. In the past 24 months, what effect has the counseling or treatment you got through the VA had on the quality of your life? Very helpful |
Experience of Care and Health Outcomes (ECHO®) Survey Adult Supplemental Items22 |
| Item | Source |
|---|---|
|
Q67. In the past 24 months, have you ended treatment with a VA mental health provider before the provider wanted you to? Yes |
New development |
|
Q68. Either based on your own experiences or what you have heard from others, please rate your opinion of the following aspects of VA mental health care: Extremely negative, Somewhat negative, Neutral, Somewhat positive, Extremely positive
|
Survey of Post-deployment Adjustment Among Enduring Freedom and Operational Iraqi Freedom (OEF/OIF) Veterans23 |
|
Q69. How would you rate the following aspects of the VA mental health treatment facility: Poor, Fair, Good, Very Good, Excellent, Don’t know
|
Survey of Healthcare Experiences of Patients Ambulatory Care 201320 |
|
Q70. How satisfied or dissatisfied are you with the availability of personnel at VA facilities offering mental health care to answer your questions . . . Very satisfied, Somewhat satisfied, Somewhat dissatisfied, Very dissatisfied, Does not apply, have not had this experience
|
New development |
|
Q71. At the VA, you can see the same mental health care provider on most visits. Strongly Agree |
National Survey of Women Veterans,9 MODIFIED (to include Not sure option) |
|
Q72. VA mental health care providers give Veterans more than one choice for treatment or health care. Strongly Agree |
New development |
| Item | Source |
|---|---|
|
Q73. What were the reasons you did not use the VA for mental health care services in the past 24 months? Was it because . . .
|
2010 National Survey of Veterans,3 MODIFIED (to add items) |
|
Q74. Veterans may face obstacles getting or using mental health services for a number of reasons. Please indicate whether or not each of the following is an obstacle for you, personally, for getting or using mental health services. Yes, No, Not Applicable
|
Modified from Post-deployment Health of Armed Forces Personnel;21 Elbogen et al., 2013;24 Sharp et al., 201525 |
|
Q75. How strongly do you agree or disagree with the following statements? Think about the mental health provider you have seen most often over the past 24 months. Strongly agree, Somewhat agree, Somewhat disagree, Strongly disagree
|
Survey of Disparities in Quality of Health Care: Spring 200126 and new development |
| Item | Source |
|---|---|
|
Q76. In the past 24 months, how often did you have a hard time communicating with your mental health provider because of accents or language barriers? Never |
Survey of Healthcare Experiences of Patients Ambulatory Care 201320 |
|
Q77. In the past 24 months, have any of the following people in your life encouraged you to get treatment for PTSD or other emotional problems? Yes, No
|
Spoont et al., 201427 MODIFIED (to include coworkers) |
|
Q78. Read each statement carefully and indicate your degree of agreement using the responses below. Strongly agree, Somewhat agree, Somewhat disagree, Strongly disagree
|
Attitudes Toward Seeking Professional Help scale,28 MODIFIED (response options modified to fit with similar questions in the survey) |
| Item | Source |
|---|---|
|
Q79. How likely are you to use any VA services in the future? Very likely |
New development |
|
Q80. If you had a mental health need in the future, how likely would you be to use the VA for mental health services? Very likely |
New development |
|
Q81. What are the reasons you do not plan to use VA mental health services in the future? Is it because . . . Yes, No
|
New development |
|
Q82. How important is it to you that the VA makes the following changes? Very important, Moderately important, Slightly important, Not at all important
|
New development |
|
Q83. How likely would you be to recommend VA mental health services to other Veterans? Very likely |
New development |
|
Q84. Would you use VA mental health services by any of the following modes in the future? Definitely yes, Probably yes, Probably no, Definitely no
|
New development |
1. U.S. Department of Veterans Affairs. 2009. National Health Study for a New Generation of U.S. Veterans. Washington, DC: U.S. Department of Veterans Affairs.
2. Kulka, R. A., W. E. Schlenger, J. A. Fairbank, R. L. Hough, B. K. Jordan, C. R. Marmar, and D. S. Weiss, D. S. 1988. Contractual report of findings from the National Vietnam Veterans’ Readjustment Study: Volumes 1–4. North Carolina: Research Triangle Institute.
3. Westat. 2010. National survey of veterans. Rockville, MD: Westat.
4. Westat. 2014. Wounded Warrior Project annual alumni survey. Rockville, MD: Westat.
5. Vogt, D. S., B. N. Smith, L. A. King, D. W. King, J. A. Knight, and J. J. Vasterling. 2013. Deployment Risk and Resilience Inventory-2 (DRRI-2): An updated tool for assessing psychosocial risk and resilience factors among service members and Veterans. Journal of Traumatic Stress 26:710–717. doi: 10.1002.jts.21868 PILOTS ID: 87988.
6. Westat, U.S. Department of Veterans Affairs. 2011. HealthViEWS study: Health of Vietnam Era Women’s Study survey. Rockville, MD: Westat.
7. CDC (Centers for Disease Control and Prevention)/NCHS (National Center for Health Statistics). 2014. National Health and Nutrition Examination Survey questionnaire. Hyattsville, MD: U.S. Department of Health and Human Services, Centers for Disease Control and Prevention.
8. U.S. Census Bureau. 2014. American Community Survey. https://www2.census.gov/programs-surveys/acs/methodology/questionnaires/2014/quest14.pdf.
9. VA (U.S. Department of Veterans Affairs). 2009. National Survey of Women Veterans. https://www.reginfo.gov/public/do/DownloadDocument?objectID=6395701.
10. Kazis, L. E., D. R. Miller, J. A. Clark, K. M. Skinner, A. Lee, X. S. Ren, A. Spiro, 3rd, W. H. Rogers, and J. E. Ware, Jr. 2004. Improving the response choices on the Veterans Sf-36 Health Survey Role functioning scales: Results from the Veterans Health Study. Journal of Ambulatory Care Management 27(3):263–280.
11. Kessler, R. C., P. R. Barker, L. J. Colpe, J. F. Epstein, J. C. Gfroerer, E. Hiripi, M. J. Howes, S.-L. T. Normand, R. W. Manderscheid, E. E. Walters, and A. M. Zaslavsky. 2003. Screening for serious mental illness in the general population. Archives of General Psychiatry 60(2):184–189.
12. Prins, A., P. Ouimette, R. Kimerling, R. P. Cameron, D. S. Hugelshofer, J. Shaw-Hegwer, A. Thrailkill, F. D. Gusman, and J. I. Sheikh. 2003. The Primary Care PTSD screen (PC–PTSD): Development and operating characteristics (PDF). Primary Care Psychiatry 9:9–14. doi: 10.1185/135525703125002360.
13. Kroenke, K., R. L. Spitzer, and J. B. Williams. 2003. The Patient Health Questionnaire-2: Validity of a two-item depression screener. Medical Care 41:1284–1292.
14. Babor, T. F., J. R. de la Fuente J. Saunders, and M. Grant. 1992. AUDIT: The Alcohol Use Disorders Identification Test. Guidelines for use in primary health care. Geneva: World Health Organization.
15. Skinner, H. A. 1982. The Drug Abuse Screening Test. Addict Behavior 7(4):363–371.
16. Yudko, E., O. Lozhkina, and A. Fouts. 2007. A comprehensive review of the psychometric properties of the Drug Abuse Screening Test. Journal of Substance Abuse and Treatment 32:189–198.
17. Kessler, R. C. 2000. National Comorbidity Survey: Baseline, 1990–1992. ICPSR Data Holdings. doi:10.3886/ICPSR06693.v6.
18. Altarum Institute, U.S. Department of Veterans Affairs. 2015. Study of barriers for women veterans to VA health care: Final report. https://www.womenshealth.va.gov/docs/Womens%20Health%20Services_Barriers%20to%20Care%20Final%20Report_April2015.pdf.
19. U.S. Department of Veterans Affairs, Veterans Health Administration Office of the Assistant Deputy Under Secretary for Health for Policy and Planning. 2012. 2011 survey of veteran enrollees’health and reliance Upon VA. https://www.va.gov/HEALTHPOLICYPLANNING/SOE2011/SoE2011_Report.pdf.
20. VA (U.S. Department of Veterans Affairs). 2013. Survey of healthcare experiences of patients’ ambulatory care 2013. https://www.reginfo.gov/public/do/DownloadDocument?objectID=40394201.
21. RAND. 2007. Post-deployment health Of Armed Forces personnel survey. Santa Monica, CA: RAND Corporation.
22. AHRQ (Agency for Healthcare Research and Quality). 2007. Experience of Care and Outcomes (ECHO) survey: Adult supplemental items, version 3.0. https://www.ahrq.gov/cahps/surveys-guidance/echo/instructions/mcosurveylist.html.
23. VA (U.S. Department of Veterans Affairs). 2012. Survey of post-deployment adjustment among Operation Enduring Freedom & Operation Iraqi Freedom (OEF/OIF) veterans. https://www.reginfo.gov/public/do/PRAViewIC?ref_nbr=201111-2900008&icID=186169.
24. Elbogen, E. B, H. R. Wagner, S. C. Johnson, P. Kinneer, H. Kang, J. J. Vasterling, C. Timko, and J. C. Beckham. 2013. Are Iraq and Afghanistan veterans using mental health services? New data from a national random-sample survey. Psychiatric Services 64(2):134–141. doi: 10.1176/appi.ps.004792011.
25. Sharp, M., N. T. Fear, R. J. Rona, S. Wessely, N. Greenberg, N. Jones, and L. Goodwin. 2015. Stigma as a barrier to seeking health care among military personnel with mental health problems. Epidemiologic Review 37:144–162 doi: 10.1093/epirev/mxu012.
26. Commonwealth Fund, Princeton Survey Research Associates. 2001. Survey on disparities on quality of health care. http://www.commonwealthfund.org/usr_doc/qualitysurvey_2001_questionnaire.pdf.
27. Spoont, M. R., D. B. Nelson, M. Murdoch, T. Rector, N. A. Sayer, S. Nugent, and J. Westermeyer. 2014. Impact of treatment beliefs and social network encouragement on initiation of care by VA service users with PTSD. Psychiatric Services 65(5):654–662. doi: 10.1176/appi.ps.201200324.
28. Whittlesey, V. 2001. Diversity activities for psychology. Boston: Allyn and Bacon, and Fischer, E., and A. Farina. 1995. Attitudes toward seeking psychological professional help: A shortened form and considerations for research. Journal of College Student Development 36:368–373.
FINAL SURVEY INSTRUMENT (ANNOTATED)
OEF/OIF/OND Veterans’Access
to Health Services Survey
OMB# 2900-0842
Estimated burden: 35
minutes Expiration Date 3/31/2019
The Paperwork Reduction Act of 1995: This information is collected in accordance with section 3507 of the Paperwork Reduction Act of 1995. Accordingly, we may not conduct or sponsor and you are not required to respond to, a collection of information unless it displays a valid OMB number. We anticipate that the time expended by all individuals who complete this survey will average 35 minutes. This includes the time it will take to follow instructions, gather the necessary facts and respond to questions asked. The purpose of this web-based survey is to help the VA to better understand why Veterans choose to use or not use VA mental health services available to them. The survey results will lead to improvements in the quality of service delivery by helping to improve Veterans’ access to VA mental health services. Participation in this survey is voluntary and failure to respond will have no impact on benefits to which you may be entitled.
Welcome
INFORMED CONSENT STATEMENT
SURVEY PURPOSE: The National Academies of Sciences, Engineering, and Medicine (the Academies) is conducting this study on behalf of the Department of Veterans Affairs (VA) to evaluate the mental health care provided to Veterans of the Iraq and Afghanistan operations. Results from this study will be used by Congress and the VA to better understand why Veterans choose to use or not use VA services available to them, and will also help improve Veterans’ access to VA mental
health services. The Academies have partnered with Westat, an independent contractor, to conduct this survey.
VOLUNTARY RESPONSE/CONFIDENTIALITY:
Your participation is voluntary. Refusal to participate will involve no penalty or loss of benefits to which you are otherwise entitled, and you may discontinue participation at any time without penalty or loss of benefits. We will do everything we can to keep all data confidential, including your survey responses and administrative data that Westat, our contractor, receives from the VA about health services you may have used. Only researchers at Westat and the Academies-appointed experts who are approved to work on this study and who have signed an agreement to keep all data confidential will have access to individual survey and administrative data for analysis purposes. Westat will provide the VA with the survey responses, but will have deleted your name and any other information that could be used to identify you. The Academies will release a publicly available report in 2017. When reporting the results of this study, all information about you will be combined with information from other Veterans, and only group statistics will be reported. We will not disclose your responses or data to anyone who could use it to identify you or any other participants. Westat will destroy all data in its possession no later than one year after the study has been completed or, if the VA requests additional analysis, after that analysis has been completed.
To further help us protect your privacy, we have obtained a Certificate of Confidentiality from the United States Department of Health and Human Services (DHHS). With this Certificate, we cannot be forced (for example by court order or subpoena) to disclose information that may identify you in any federal, state, local, civil, criminal, legislative, administrative, or other proceedings. The researchers will use the Certificate to resist any demands for information that would identify you, except to prevent serious harm to you or others, and as explained below. You should understand that a Certificate of Confidentiality does not prevent you, or a member of your family, from voluntarily releasing information about yourself, your family, or your involvement in this study. If an insurer or employer learns about your participation, and obtains your consent to receive research information, then we may not use the Certificate of Confidentiality to withhold this information.
This means that you and your family must also actively protect your own privacy. You should understand that we will in all cases, take the necessary action, including reporting to authorities, to prevent serious harm to yourself, children, or others. A Certificate of Confidentiality does not represent an endorsement of the research study by the Department of Health and Human Services or the National Institutes of Health.
SURVEY LENGTH: This web survey will take approximately 35 minutes to complete. Depending on your responses, it may take more or less time.
RESOURCES FOR YOU: The survey contains some sensitive questions that you may find upsetting. Sometimes people who answer questions about their experiences or how they are feeling would like to talk to a mental health specialist. If you feel this way at any time, click the “Mental Health Resource” button located at the bottom of each page.
HOW TO COMPLETE THE SURVEY: After you complete each page, you may go to the next page by clicking on the “Next>>” button. If you wish to review a previous answer, click on the “<<Previous”
button. If you need to save your responses and complete the survey later, click on the “Save and Continue Later” button. When you log on later, you can continue where you left off.
TO THANK YOU: We know your time is valuable. To thank you for your participation, we will send you {$5/$20} in the mail after we receive your survey.
To begin your survey, click the “Next>>” button below. Doing so also implies your consent to participate in the survey.
Derived variables to guide survey pathways, based on self-response:
ALL RESPONDENTS WILL BEGIN WITH VAUSER = 0; CIVUSER = 0; AND POSSCRN = 0
[MONTH, YEAR] = Month user first accessed survey, year-2 (will be 2014)
OEF/OIF/OND Veterans’Access
to Health Services Survey
Military History and Demographics
The following questions ask some basic information about you and your military history.
- In what component(s) have you served?
Select all that apply
Active Duty COMP_1
Reserve COMP_2
National Guard COMP_3 - In what branch(es) did you serve?
Select all that apply
Army BRANCH_1
Marine Corps BRANCH_2
Navy BRANCH_3
Air Force BRANCH_4
Coast Guard BRANCH_5 - What was the highest rank and pay grade you held while in the military? RANK
E1–E4 1
E5–E6 2
E7–E9 3
W1–W5 4
O1–O3 5
O4–O6 6
O7–O10 7 - Do you have a VA service-connected disability rating? RATING_1
Yes → continue to question 5 1
No → skip to question 6 0[IF MISSING, SKIP TO DEP_TIME]
- What is your VA service-connected disability rating? RATING_2
0 percent 1
10 to 20 percent 2
30 to 40 percent 3
50 to 60 percent 4
70 percent or higher 5
Don’t know 98
-
Since September 11, 2001, how many months were you away in total for all deployments in support of OEF/OIF/OND? Include deployments to a combat area, noncombat area, or training mission. DEP_TIME
1–6 months 1
7–12 months 2
13–24 months 3
25–36 months 4
37–48 months 5
More than 48 months 6
I have not been deployed in support of OEF/OIF/OND since September 11, 2001 → skip to DOB 7[IF MISSING, SKIP TO DOB]
The next few questions ask about experiences you may have had while deployed.
- How many of your deployments in support of OEF/OIF/OND were to the following combat areas? Mark zero if no deployments to these areas.
| Zero 0 | 1 1 | 2 2 | 3 3 | 4 4 | 5 5 | 6 to 9 6 | 10 or more 7 | |
|---|---|---|---|---|---|---|---|---|
|
||||||||
|
||||||||
|
||||||||
- The statements below are about your experiences. Please indicate if you experienced the following events during your deployments in support of OEF/OIF/OND since September 11, 2001 by selecting the response that best fits your answer.
| Never 0 | Once or twice 1 | Several times over entire deployment 2 | A few times each month 3 | A few times each week 4 | Daily or almost daily 5 | |
|---|---|---|---|---|---|---|
|
||||||
|
||||||
|
||||||
|
||||||
|
||||||
|
||||||
|
| Never 0 | Once or twice 1 | Several times over entire deployment 2 | A few times each month 3 | A few times each week 4 | Daily or almost daily 5 | |
|---|---|---|---|---|---|---|
|
||||||
|
||||||
- What is your date of birth?
| | |/| | |/| | | | |
M M / D D / Y Y Y YDOB_MONTH DOB_DAY DOB_YEAR
- Are you male or female? GENDER
Male 1
Female 2 - Are you of Hispanic, Latino, or Spanish origin?
Select all that apply
No, not of Hispanic, Latino, or Spanish origin HISP_1
Yes, Mexican, Mexican American, or Chicano HISP_2
Yes, Puerto Rican HISP_3
Yes, Cuban HISP_4
Yes, another Hispanic, Latino, or Spanish origin — Specify origin, for example, Argentinean, Colombian, Dominican, Nicaraguan, Salvadoran, Spaniard, and so on. HISP_5
|____________________| HISP_HISPOTHER - What is your race?
Select all that apply
White RACE_1
Black or African American RACE_2
American Indian or Alaska Native — Specify name of enrolled or principal tribe RACE_3
|____________________| RACE_3SPEC
Asian Indian RACE_4
Chinese RACE_5
Filipino RACE_6
Japanese RACE_7
Korean RACE_8
Vietnamese RACE_9
Other Asian — Specify race, for example, Hmong, Laotian, Thai, Pakistani, Cambodian, and so on RACE_10
|____________________| RACE_10SPEC
-
Native Hawaiian RACE_11
Guamanian or Chamorro RACE_12
Samoan RACE_13
Other Pacific Islander — Specify race, for example, Fijian, Tongan, and so on. RACE_14
|____________________| RACE_14SPEC
Some other race —Specify race RACE_15
|____________________| RACE_15SPEC - What is the highest degree or level of school you have completed? EDU
Less than high school 1
GED 2
High school diploma 3
Some college credit, but less than 1 year of college credit 4
1 or more years of college credit, no degree 5
Associate’s degree (for example, AA, AS) 6
Bachelor’s degree (for example, BA, BS) 7
Master’s degree (for example, MA, MS, MEng, MEd, MSW, MBA) 8
Professional degree beyond a bachelor’s degree (for example, MD, DDS, DVM, LLB, JD) 9
Doctorate degree (for example, PhD, EdD) 10 - During the last week, were you . . . EMP
Working, or on paid vacation or sick leave from work → skip to q16 1
Not working, but looking for work → skip to q16 2
Not working and not looking for work → continue to q15 3[IF MISSING, SKIP TO MARITAL]
- What is the main reason you were not looking for work? UNEMP
You are retired 1
You are disabled 2
You were unable to work because of other health-related reasons 3
You stopped looking for work because you could not find work 4
You were temporarily laid off from work 5
You were taking care of your home and family 6
You were going to school 7 - What is your current marital status? MARITAL
Now Married 1
Widowed 2
Divorced 3
Separated 4
Never Married 5
Civil Commitment or Union 6
- How many people, including yourself, live in your household? HSHLD
- Which income range category represents the total combined income of all members of this household during the past 12 months? INC
Less than $10,000 1
$10,000 to $24,999 2
$25,000 to $49,999 3
$50,000 to $74,999 4
$75,000 to $99,999 5
$100,000 to $149,999 6
$150,000 or more 7 - Are you CURRENTLY covered by any of the following types of health insurance or health coverage plans?
Select all that apply
No health insurance INS_1
VA (including those who have ever used or enrolled for VA health care) INS_2
Insurance through a current or former employer or union (of yours or another family member) INS_3
Insurance purchased directly from an insurance company (by you or another family member) INS_4
Insurance through HealthCare.gov or a state insurance marketplace or exchange INS_5
Medicare, for people 65 and older, or people with certain disabilities INS_6
Medicaid, Medical Assistance, or any kind of government-assistance plan for those with low incomes or a disability INS_7
TRICARE, TRICARE for Life, or other military health care INS_8
Indian Health Service INS_9
Any other type of health insurance or health coverage plan INS_10 [specify]
_______________________INS_10OTHER
Use of VA Services
The next few questions ask about your use of VA benefits and services. When answering these questions, think about your use of VA benefits and services over the past 24 months, that is, since [MONTH, YEAR].
- In the past 24 months, have you used any of the following VA benefits or services? Select Yes or No for each item
| Yes 1 | No 0 | |
|---|---|---|
|
||
|
||
|
||
|
||
|
||
|
||
- In the past 24 months, have you used any of the following physical health care services (any care other than mental health)?
| Yes 1 | No, but I am or have been Eligible in the Past 24 Months 2 | No, and I have not been Eligible in the Past 24 Months 3 | |
|---|---|---|---|
|
|||
|
|||
- In the past 24 months, have you used any of the following mental or behavioral health care services? Select Yes or No for each item
| Yes 1 | No 0 | |
|---|---|---|
|
||
|
||
|
||
|
||
|
||
IF MHSERV_1 OR MHSERV_2 = 1, THEN VAUSER = 1
IF MHSERV_4 OR MHSERV_5 = 1, THEN CIVUSER = 1
IF MH_SERV_1 – MH_SERV_5 = MISSING, CONTINUE TO VASERV
IF MH_SERV_1 AND MH_SERV_2 = 0 OR MISSING, AND ANYMH24 = 1, CONTINUE TO VASERV
IF MH_SERV_1 OR MH_SERV_2 = 1, THEN SKIP TO VAHC
IF MH_SERV_1 AND MH_SERV_2 = 0 AND ANYMH24 = 0 SKIP TO HEALTH AND WELL-BEING SECTION]
- Have you used the VA for any mental or behavioral health services, either inpatient or outpatient, such as group therapy, psychotherapy, social skills training, or rehabilitation programs since [MONTH, YEAR]? VASERV
Yes 1
No 0
IF VASERV = 1, THEN VAUSER = 1 - [VAUSER = 1] Are you currently receiving mental health care through the VA? VAHC
Yes 1
No 0
Health and Well-being
This next section asks about your health, well-being, and lifestyle. Remember, all of your answers are confidential.
To start, think about how you have been feeling over the past 4 weeks.
- During the past 4 weeks, have you had any of the following problems with your work or other regular daily activities as a result of any emotional problems (such as feeling depressed or anxious)?
| Yes, All of the Time 5 | Yes, Most of the Time 4 | Yes, Some of the Time 3 | Yes, a Little of the Time 2 | No, None of the Time 1 | |
|---|---|---|---|---|---|
|
|||||
|
|||||
- During the past 30 days, about how often did you feel . . .
| All of the Time 4 | Most of the Time 3 | Some of the Time 2 | A Little of the Time 1 | None of the Time 0 | |
|---|---|---|---|---|---|
|
|||||
|
|||||
|
|||||
|
|||||
|
|||||
|
|||||
MISSING = 0 FOR SCORING
IF FEEL_SCORE ≥ 13, THEN POSSCRN = 1
- In your life, have you ever had any experience that was so frightening, horrible, or upsetting that, in the past month, you:
| Yes 1 | No 0 | |
|---|---|---|
|
||
|
||
|
||
|
||
MISSING = 0 FOR SCORING
IF FEAR_SCORE ≥ 3, THEN POSSCRN = 1
The next questions ask about how you have been feeling over the past 2 weeks.
- Over the past 2 weeks, how often have you been bothered by any of the following problems?
| Not at All 0 | Several Days 1 | More than Half the Days 2 | Nearly Every Day 3 | |
|---|---|---|---|---|
|
||||
|
||||
MISSING = 0 FOR SCORING
IF DEPRESS_SCORE ≥ 3, THEN POSSCRN = 1
These next questions ask about your use of alcohol and drugs over the past year. Again, all your answers are confidential and will not be traced back to you.
- How often do you have a drink containing alcohol? DRNK_1
Never 0 → skip to DRNK_9
Monthly or less 1
2 to 4 times a month 2
2 to 3 times a week 3
4 or more times a week 4[If missing, skip to DRNK_9]
- How many drinks containing alcohol do you have on a typical day when you are drinking? DRNK_2
1 or 2 0
3 or 4 1
5 or 6 2
7, 8, or 9 3
10 or more 4 - How often do you have six or more drinks on one occasion? DRNK_3
Never 0
Less than monthly 1
Monthly 2
Weekly 3
Daily or almost daily 4 - How often during the last year have you found that you were not able to stop drinking once you had started? DRNK_4
Never 0
Less than monthly 1
Monthly 2
Weekly 3
Daily or almost daily 4IF DRNK_3 AND DRNK_4 BOTH = 0 OR MISSING, SKIP TO DRNK_9
-
How often during the last year have you failed to do what was normally expected from you because of drinking? DRNK_5
Never 0
Less than monthly 1
Monthly 2
Weekly 3
Daily or almost daily 4 - How often during the last year have you been unable to remember what happened the night before because you had been drinking? DRNK_6
Never 0
Less than monthly 1
Monthly 2
Weekly 3
Daily or almost daily 4 - How often during the last year have you needed an alcoholic drink first thing in the morning to get yourself going after a night of heavy drinking? DRNK_7
Never 0
Less than monthly 1
Monthly 2
Weekly 3
Daily or almost daily 4 - How often during the last year have you had a feeling of guilt or remorse after drinking? DRNK_8
Never 0
Less than monthly 1
Monthly 2
Weekly 3
Daily or almost daily 4
These next two questions are about times you may have ever consumed alcohol.
- Have you or someone else ever been injured as a result of your drinking? DRNK_9
No 0
Yes, but not in the last year 1
Yes, during the last year 4
-
Has a relative, friend, doctor, or another health professional ever expressed concern about your drinking or suggested you cut down? DRNK_10
No 0
Yes, but not in the last year 1
Yes, during the last year 4MISSING = 0 FOR SCORING
DO NOT SCORE IF MORE THAN 3 ITEMS IN DRNK_1 – DRNK_10 MISSING. IF DRNK_ SCORE ≥ 16, THEN POSSCRN = 1
The following questions concern information about your possible involvement with drugs not including alcoholic beverages during the past 12 months.
“Drug abuse” refers to (1) the use of prescribed or over-the- counter drugs in directions, and (2) any nonmedical use of drugs.
The various classes of drugs may include cannabis (marijuana, hashish), solvents (e.g., paint thinner), tranquilizers (e.g., Valium), barbiturates, cocaine, stimulants (e.g., speed), hallucinogens (e.g., LSD) or narcotics (e.g., heroin). Remember that the questions do not include alcoholic beverages.
Please answer every question. If you have difficulty with a statement, then choose the response that is mostly right.
Remember, all your answers are confidential and will not be traced back to you. These questions refer to the past 12 months only.
- In the past 12 months, have you used drugs other than those required for medical reasons? DRUG_1
Yes 1
No 0 → Skip to HELP[IF MISSING, SKIP TO HELP]
- In the past 12 months, have you abused more than one drug at a time? DRUG_2
Yes 1
No 0 - In the past 12 months, have you always been able to stop abusing drugs when you wanted to? DRUG_3
Yes 0
No 1 - In the past 12 months, have you had blackouts or flashbacks as a result of drug use? DRUG_4
Yes 1
No 0
-
In the past 12 months, have you ever felt bad or guilty about your drug use? DRUG_5
Yes 1
No 0 - In the past 12 months, has your spouse (or parents) ever complained about your involvement with drugs? DRUG_6
Yes 1
No 0 - In the past 12 months, have you neglected your family because of your use of drugs? DRUG_7
Yes 1
No 0 - In the past 12 months, have you engaged in illegal activities in order to obtain drugs? DRUG_8
Yes 1
No 0 - In the past 12 months, have you experienced withdrawal symptoms (felt sick) when you stopped taking drugs? DRUG_9
Yes 1
No 0 - In the past 12 months, have you had medical problems as a result of your drug use (e.g., memory loss, hepatitis, convulsions, bleeding)? DRUG_10
Yes 1
No 0MISSING = 0 FOR SCORING
DO NOT SCORE IF MORE THAN 2 ITEMS IN DRUG_1 – DRUG_10 MISSING. IF DRUG_ SCORE ≥ 3, THEN POSSCRN = 1
Now think about your life over the past 24 months.
- Was there ever a time during the past 24 months when you felt that you might need to see a professional because of problems with your emotions or nerves or your use of alcohol or drugs? HELP
Yes 1
No 0IF HELP = 1, THEN POSSCRN = 1
- In the past 24 months, has a health care professional told you that you have any of the following?
| Yes 1 | No 0 | Not Sure 97 | |
|---|---|---|---|
|
|||
|
|||
|
|||
|
|||
|
|||
|
|||
|
|||
IF ANY DIAG_1 – DIAG_7 = 1, THEN POSSCRN = 1
Access to Services [POSSCRN = 1 OR VAUSER = 1]
This next section asks about your ability to access mental health services provided by the VA. Please answer each question to the best of your ability even if you have never used the VA for mental health services.
- About how many miles from where you live is the nearest VA facility that offers mental health services? VAMH_1
0–10 miles 1
11–20 miles 2
21–30 miles 3
31–40 miles 4
41–50 miles 5
More than 50 miles 6
Not sure 97 - How long does it take to get from where you live to the nearest VA facility that offers mental health services? VAMH_2
Less than 10 minutes 1
10 to 20 minutes 2
21 to 30 minutes 3
31 to 45 minutes 4
46 minutes to one hour 5
More than one hour 6
Not sure 97 - Would you say that transportation to the nearest VA facility that offers mental health services is: VAMH_3
Very easy 5
Somewhat easy 4
Neither easy nor hard 3
Somewhat hard 2
Very hard 1
Not sure 97
How much do you agree or disagree with the following statement?
- There is a VA provider in my area that offers all of the mental health care services Veterans need. VAMH_4
Strongly agree 4
Somewhat agree 3
Somewhat disagree 2
Strongly disagree 1
Not sure 97 - How burdensome is the process for obtaining mental health care through the VA (e.g., paperwork, enrollment, scheduling)? VAMH_5
Very burdensome 1
Somewhat burdensome 2
Not very burdensome 3
Not burdensome at all 4
Not sure 97
Now, think about your experience with VA mental health services since [MONTH, YEAR].
- In the past 24 months, how often was it easy to get appointments with VA mental health providers? VAMH_6
Never 1
Sometimes 2
Usually 3
Always 4
I have not tried to get an appointment with a VA mental health provider in the past 24 months 5 → skip to AVAIL[IF MISSING, SKIP TO AVAIL]
- In the past 24 months, how often were you able to get the mental health care you needed from a VA facility during evenings, weekends, or holidays? VAMH_7
Never 1
Sometimes 2
Usually 3
Always 4
I have not tried to get an appointment during evenings, weekends, or holidays in the past 24 months. 5
-
During the past 24 months, how satisfied were you with the period of time between requesting a VA appointment for mental health care and the actual appointment date? VAMH_8
Very satisfied 4
Somewhat satisfied 3
Somewhat dissatisfied 2
Very dissatisfied 1
- Thinking about the past 24 months, how satisfied or dissatisfied are you with the availability of the following health care services at the VA?
| Very Satisfied 4 | Somewhat Satisfied 3 | Somewhat Dissatisfied 2 | Very Dissatisfied 1 | No Opinion 99 | |
|---|---|---|---|---|---|
|
|||||
|
|||||
|
|||||
- Thinking about the past 24 months, how satisfied or dissatisfied are you with the availability of the following types of mental health providers at the VA?
| Very Satisfied 4 | Somewhat Satisfied 3 | Somewhat Dissatisfied 2 | Very Dissatisfied 1 | No Opinion 99 | |
|---|---|---|---|---|---|
|
|||||
|
|||||
|
|||||
|
|||||
|
|||||
|
|||||
- Thinking about the past 24 months, how satisfied or dissatisfied are you with the availability of the following mental health services at the VA?
| Very Satisfied 4 | Somewhat Satisfied 3 | Somewhat Dissatisfied 2 | Very Dissatisfied 1 | No Opinion 99 | |
|---|---|---|---|---|---|
|
|||||
|
|||||
|
|||||
|
|||||
|
|||||
Experience with VA Mental Health Services [POSSCRN = 1 OR VAUSER = 1]
[INTRO IF VAUSER = 1]
Veterans have different experiences when using the VA for mental health services. Think about your own experience with VA mental health services since [MONTH, YEAR].
- [VAUSER = 1] The following is a list of reasons why you might have chosen to use the VA for mental health care in the past 24 months. Please indicate how strongly you agree or disagree with each of these reasons.
You chose to use the VA for mental health care because:
| Strongly Agree 4 | Somewhat Agree 3 | Somewhat Disagree 2 | Strongly Disagree 1 | |
|---|---|---|---|---|
|
||||
|
||||
|
||||
|
||||
|
||||
|
||||
|
||||
|
||||
|
||||
|
||||
|
||||
-
[VAUSER = 1] Choices for your treatment or health care can include choices about medicine or other treatment. In the past 24 months, did a VA mental health provider tell you there was more than one choice for your treatment or health care? CHOICE
Yes 1
No 0 -
[VAUSER = 1] Did the VA mental health provider you have seen most recently help you . . . PROF
A lot 4
Some 3
A little 2
Not at all 1
-
[VAUSER = 1] All things considered, how satisfied are you with your mental health care at the VA in the past 24 months? MH_SAT
Completely satisfied 7
Very satisfied 6
Somewhat satisfied 5
Neither satisfied nor dissatisfied 4
Somewhat dissatisfied 3
Very dissatisfied 2
Completely dissatisfied 1 -
[VAUSER = 1] In the past 24 months, what effect has the counseling or treatment you got through the VA had on the quality of your life? QOL
Very helpful 5
A little helpful 4
Not helpful or harmful 3
A little harmful 2
Very harmful 1 -
[VAUSER = 1] In the past 24 months, have you ended treatment with a VA mental health provider before the provider wanted you to? COMPL
Yes 1
No 0[INTRO FOR VAUSER = 0, DISPLAY ON SCREEN FOR VAUSER = 0 FOR EACH PAGE Q68–72] Even if you haven’t used the VA for mental health care, you may have impressions about their services based on what you have heard from others. Thinking about your impressions of VA mental health care since [MONTH, YEAR], please answer the next questions to the best of your ability.
- [POSSCRN = 1 OR VAUSER = 1] Either based on your own experiences or what you have heard from others, please rate your opinion of the following aspects of VA mental health care:
| Extremely Negative 1 | Somewhat Negative 2 | Neutral 3 | Somewhat Positive 4 | Extremely Positive 5 | |
|---|---|---|---|---|---|
|
|||||
|
|||||
|
|||||
|
|||||
|
|||||
- [POSSCRN = 1 OR VAUSER = 1] How would you rate the following aspects of the VA mental health treatment facility:
| Poor 1 | Fair 2 | Good 3 | Very Good 4 | Excellent 5 | Don’t Know 99 | |
|---|---|---|---|---|---|---|
|
||||||
|
||||||
|
||||||
|
||||||
- [POSSCRN = 1 OR VAUSER = 1] How satisfied or dissatisfied are you with the availability of personnel at VA facilities offering mental health care to answer your questions. . .
| Very Satisfied 4 | Somewhat Satisfied 3 | Somewhat Dissatisfied 2 | Very Dissatisfied 1 | Does not apply, have not had this Experience 99 | |
|---|---|---|---|---|---|
|
|||||
|
|||||
How strongly do you agree or disagree with the following statements?
-
[POSSCRN = 1 OR VAUSER = 1] At the VA, you can see the same mental health care provider on most visits. MHPROV_1
Strongly Agree 4
Somewhat Agree 3
Somewhat Disagree 2
Strongly Disagree 1
Not sure 97 -
[POSSCRN = 1 OR VAUSER = 1]VA mental health care providers give Veterans more than one choice for treatment or health care. MHPROV_2
Strongly Agree 4
Somewhat Agree 3
Somewhat Disagree 2
Strongly Disagree 1
Not sure 97
Reasons for not using the VA[POSSCRN = 1 AND VAUSER = 0]
Veterans choose to use or not use the VA for mental health services for a variety of reasons. The next question is about why you have not used the VA for mental health series since [MONTH, YEAR].
- What were the reasons you did not use the VA for mental health care services in the past 24 months?
Was it because . . .
| Yes 1 | No 0 | |
|---|---|---|
|
||
|
||
|
||
|
||
|
||
|
||
|
||
|
||
|
||
|
||
|
||
Opinions About Mental Health Services
[POSSCRN = 1 OR VAUSER = 1] For the next questions, think about mental health care both in the VA and outside of the VA.
- Veterans may face obstacles getting or using mental health services for a number of reasons. Please indicate whether or not each of the following is an obstacle for you, personally, for getting or using mental health services.
| Yes 1 | No 0 | Not Applicable 98 | |
|---|---|---|---|
|
|||
|
|||
|
|||
|
|||
|
|||
|
|||
|
|||
|
|||
|
|||
|
|||
|
|||
|
|||
|
|||
- [VAUSER = 1 or (CIVUSER = 1 and POSSCRN = 1)] How strongly do you agree or disagree with the following statements? Think about the mental health provider you have seen most often over the past 24 months.
| Strongly Agree 4 | Somewhat Agree 3 | Somewhat Disagree 2 | Strongly Disagree 1 | |
|---|---|---|---|---|
|
||||
|
||||
|
||||
- [VAUSER = 1 or (CIVUSER = 1 and POSSCRN = 1)] In the past 24 months, how often did you have a hard time communicating with your mental health provider because of accents or language barriers? LANG
Never 4
Sometimes 3
Usually 2
Always 1 - [POSSCRN = 1 OR VAUSER = 1] In the past 24 months, have any of the following people in your life encouraged you to get treatment for PTSD or other emotional problems?
| Yes 1 | No 0 | |
|---|---|---|
|
||
|
||
|
||
|
||
|
||
|
||
|
||
- [POSSCRN = 1 OR VAUSER = 1] Read each statement carefully and indicate your degree of agreement using the responses below.
| Strongly Agree 4 | Somewhat Agree 3 | Somewhat Disagree 2 | Strongly Disagree 1 | |
|---|---|---|---|---|
|
||||
|
||||
|
||||
|
||||
| Strongly Agree 4 | Somewhat Agree 3 | Somewhat Disagree 2 | Strongly Disagree 1 | |
|
||||
|
||||
|
||||
|
||||
|
||||
|
||||
Expectations for future use of the VA [ALL RESPONDENTS]
Programming note: Display bracketed text only for VAUSER = 1 or POSUSER = 1 [Throughout the survey, you have answered questions about your past and current use of VA health services.] These last few questions are about your possible future use of VA services.
- How likely are you to use any VA services in the future? USE_1
Very likely 4
Likely 3
Somewhat likely 2
Not likely at all 1 - If you had a mental health need in the future, how likely would you be to use the VA for mental health services? USE_2
Very likely → skip to CHNG 4
Likely → skip to CHNG 3
Somewhat likely → skip to CHNG 2
Not likely at all 1[IF MISSING, SKIP TO CHNG]
- What are the reasons you do not plan to use VA mental health services in the future? Is it because . . .
| Yes 1 | No 0 | |
|---|---|---|
|
||
|
||
|
||
|
||
|
||
|
||
|
||
|
||
- How important is it to you that the VA makes the following changes?
| Very Important 4 | Moderately Important 3 | Slightly Important 2 | Not at all Important 1 | |
|---|---|---|---|---|
|
||||
|
||||
|
||||
|
||||
|
||||
|
||||
- How likely would you be to recommend VA mental health services to other Veterans? RCCMD
Very likely 4
Likely 3
Somewhat likely 2
Not likely at all 1 - Would you use VA mental health services by any of the following modes in the future? MODE
| Definitely Yes 4 | Probably Yes 3 | Probably No 2 | Definitely No 1 | |
|---|---|---|---|---|
|
||||
|
||||
|
||||
In order to receive your {$5/$20}, please confirm or update your mailing address below:
Address 1: prefill address from frame but make editable, will need to get you the variables.
Address 2: prefill address from frame but make editable, will need to get you the variables.
City: prefill address from frame but make editable, will need to get you the variables.
State: prefill address from frame but make editable, will need to get you the variables.
Zip Code: prefill address from frame but make editable, will need to get you the variables.
If you are satisfied with your responses, please submit your survey by clicking on the “Submit survey” button below. Once you submit your survey, you will not be able to access your survey again.
Thank you for your participation!
The information you have provided will help VA to better serve all Veterans. For more information on Department of Veterans Affairs (VA) services, please go to the VA website at http://www.va.gov/health/.
Your answers have been submitted. You may now close your browser.
This page intentionally left blank.


