
2
Collection and Use of Sustained Ocean Climate Observations
The in situ ocean observing system that exists today provides a diverse suite of critical climate information documenting the present state of the ocean. When sustained, this information can capture the change and evolution of the ocean and inform our understanding of the linkages between the ocean and climate. Ocean circulation patterns that affect climate act on very long timescales, providing a strong impetus for designing and sustaining a long-term observing system. The existing observing system has evolved, and will continue to evolve, with experience, technological advancements, and coordination within the international ocean observing community. The integration of in situ ocean measurements with data from other types of observational systems, satellites in particular, has resulted in significant advances in our understanding of the fundamental role of the oceans in climate change processes. This improved knowledge spans the three budgets that are the focus of this report—heat, carbon, and fresh water—as well as many other metrics that have direct societal relevance, including sea-level rise. This chapter describes the ocean observations necessary to close the heat, carbon, and fresh water budgets, drawing on work conducted at the international level to develop specifications for a global network of observing platforms collecting priority ocean data (described further in Chapter 3). The in situ ocean observing system also addresses many other societal needs, ranging from weather prediction and hurricane tracking on short timescales, to evolution of the ocean ecosystem and fisheries on longer timescales. Expanded observational capacity into poorly observed areas of the ocean, technological improvements, and well-developed data assimilation methodologies are needed to advance the contributions of the ocean observing system toward understanding climate.
PROGRAMS AND INFRASTRUCTURE OF THE PRESENT OCEAN OBSERVING SYSTEM
The present ocean observing system is comprised of numerous programs foundational to the collection of in situ, climate-related data (Table 2.1). The groundwork for coordination of these programs was established at the OceanObs’99 conference, when the ocean science and observing community met to evaluate the technical readiness, capabilities, and contributions of different elements of the global ocean observing efforts then under way (Smith and Koblinksy, 1999). Among the foundational in situ elements were the profiling floats (Argo), ship-based profile and water sampling (GO-SHIP), moorings that collect time series (OceanSITES), global sea-level observing (tide gauges, GLOSS), observations made from merchant ships (SOT and SOOP), drifting surface buoys and moored buoys for weather and other observations (DBCP), and coastal and regional observing efforts (in the United States, this consists of the 11 regional systems that make up the Integrated Ocean Observing System, IOOS). As new research and data needs are identified and new instrumentation and platforms are developed and proven, they are added to existing programs. The observing programs outlined in Table 2.1 are implemented under the umbrella of the international Global Ocean Observing System (GOOS) framework, of which the United States is an important actor in most programs, with substantial contributions from government agencies and academic institutions that are detailed in Chapter 4. As understanding of the ocean’s role in climate continues to develop, additional observing requirements are expected to be identified and growth in the multidisciplinary aspect and diversity of the observing system is anticipated.
The primary infrastructure needed to maintain the in situ global ocean observing system includes the measurement platform itself, as well as the research ships from which deployment, maintenance, and recovery of equipment occurs. The human resources needed to develop and maintain these programs and infrastructure are also an essential component, as described in Chapter 1.
IMPROVEMENTS TO THE BUDGETS CONSTRAINED BY OCEAN CLIMATE DATA
Ocean observations have contributed to the vital insights into changes in the heat, carbon, and fresh water budgets of the planet and informed understanding of other related ocean changes, including sea-level rise. This section briefly describes the ocean observations that have led to improved understanding of these budgets, illustrates changes based on collected data, and identifies key knowledge gaps where increased observational efforts are required to close the budgets globally. Closing these budgets has been identified as a priority in national and international global ocean observing planning and climate research programs (US CLIVAR, 2013; Benway et al., 2016; GCOS, 2016). These programs provide the highest level of guidance for building and sustaining ocean observing and out-
TABLE 2.1 Programs of the Global Ocean Observing Systema
| Ocean Observing Program | Program Elements | Program Size | U.S. Share | Scale | Budgets Informed |
|---|---|---|---|---|---|
| Argo | Argo profiling floats | 3900+ floats worldwide | 2,078 floats; Scripps Institution of Oceanography (SIO), U. Washington, WHOI, NOAA/PMEL, NOAA/AOML 100 extras floats by U.S. Navy | Regional Global |
Heat Fresh water |
| Deep Argo (pilot) | 30 deep floats currently in regional pilot arrays | 21 | Regional Global |
Heat Fresh water |
|
| Biogeochemical Argo (BGC-Argo) (pilot) | 300 floats currently having 1 or more BGC sensors | 142 | Regional Global |
Carbon | |
| Global Ocean Ship-based Hydrographic Investigations Program (GO-SHIP) | Full ocean depth, decadal repeating hydrographic transects | 61 lines (54 core, and 7 associated lines with greater sampling frequency and fewer requirements) | 19 lines NOAA/OOMD funds NOAA/PMEL and AOML. NSF funds SIO plus about 8 academic institutions | Regional Global |
Heat Carbon Fresh water |
| OceanSITES | Moored buoys, time-series sites | 290 sites | 128 active sites; Many U.S. institutions (NOAA, NSF, SIO, LDEO, WHOI, UW, U. Miami, U. Hawaii, MBARI). | Regional | Heat Carbon Fresh water |
| Ocean Observing Program | Program Elements | Program Size | U.S. Share | Scale | Budgets Informed |
|---|---|---|---|---|---|
| The Global Sea Level Observing System (GLOSS) | Long-term climate change and oceanographic sea level monitoring | 290 stations in the Global Core Network (GCN) | NOAA operates 25 stations, University of Hawaii operates 52 stations | Regional Global |
Heat Fresh water |
| Ship Observations Team (SOT) | Voluntary Observing Ships (VOS) surface atmosphere measurements | Weather observations from about 1,700 operational ships around the world. | The U.S. VOS Program services about one quarter of the world’s VOS fleet. | Regional Global |
Heat Fresh water |
| Automated Shipboard Aerological Programme | Atmospheric profiles with balloons launched by about 20 ships, mainly North Atlantic | No U.S. participation | Regional | Heat | |
| Ship of Opportunity Program (SOOP) eXpendable BathyThermograph (XBT) temperature profiles | Approximately 15,000 XBTs are deployed per year in 36 repeating boundary current and ocean-spanning transects, 2,000 XBTs elsewhere | NOAA/AOML and SIO are together responsible for about 25 repeating transects in the Atlantic, Pacific, and Indian Oceans | Regional | Heat | |
| Ship of Opportunity Program (SOOP) Surface water CO2 (transitioning from pilot to mature) | Approximately 50 ships are outfitted with automated pCO2 systems worldwide | NOAA/OOMD funds: AOML, PMEL, ESRL/GMD and 3 academic partners who provide 30% of the global observations in SOCAT | Global | Carbon |
| Data Buoy Cooperation Panel (DBCP) | Surface Drifter | 1461 | 830: NOAA/AOML, SIO Many U.S. institutions | Global | Heat Fresh water |
| Fixed Platform | 103 | 9 | Regional | Heat Fresh water |
|
| Ice Buoy | 23 | 4 | Regional | Heat Fresh water |
|
| Metocean Moored Buoy | 379 | 209 | Regional | Heat Fresh water |
|
| Tsunameter | 35 | 28 | Regional | Heat Fresh water |
|
| Coastal and regional GOOS systems | Buoys, tide gauges, radar stations, gliders (international Glider Network coordination is at pilot stage) | 14 GOOS Regional alliances | Integrated Ocean Observing System (IOOS) | Regional | Heat Carbon Fresh water |
a Table is accurate as of February, 2017 though the number of deployed platforms may frequently change. Information obtained from JCOMMOPS (http://www.jcommops.org), NOAA (http://www.vos.noaa.gov/), U.S. GO-SHIP (https://usgoship.ucsd.edu/hydrotable/), GLOSS (http://www.gloss-sealevel.org/), SOCAT (http://www.socat.info) and individual contributors. To avoid duplication, programs that utilize the elements of the programs listed here have been left out. The Tropical Moored Buoy Array is part of both OceanSITES and DBCP.
line specifications for spatial and temporal sampling of priority ocean observation variables (described further in Chapter 3), and the committee has drawn on these activities to describe the observing requirements for closing the three budgets.
Whenever possible, the ocean observing system design includes direct measurement of all elements of the budgets, to avoid residual calculation of unmeasured terms. A modest degree of redundancy across observing platforms is valuable to understand and characterize measurement and sampling errors. Existing observation gaps inhibit the ability to capture the full temporal and spatial variability of the ocean and its linkages to climate. To fully close the budgets that inform understanding of climate, observations of ocean climate variables need to be extended to the full depth of the ocean, regions of vigorous circulation such as western boundary currents and the Antarctic Circumpolar Current, and to more far-reaching areas such as the polar regions—including under sea ice, areas that are becoming newly ice-free, and near where the ocean is in contact with the polar ice sheets. Additionally, to distinguish seasonal-to-decadal variability from multidecadal trends, uninterrupted time series of observations need to be collected at a frequency sufficient to capture the shorter timescale patterns. As capabilities to measure new variables mature and new scientific and societal needs emerge, additional variables will be added to the ocean observing network to aid in closing the budgets and advancing understanding of the ocean’s role in climate.
Heat Budget
An accurate estimate of ocean heat content, formed by depth-integration of temperature anomalies, is a fundamental index of the evolving climate system and a determinant of how much future global surface warming is expected for a given future increase in CO2 emissions (and other greenhouse gases). Water has a much higher heat capacity than the atmosphere, resulting in about 90 percent of the net global surface heat gain (i.e., the Earth’s radiative imbalance) going into warming of the oceans (Levitus et al., 2012). The ocean is the dominant reservoir for heat in the climate system. Heat absorbed by ocean waters is distributed laterally and vertically through the depth layers and basins by mixing and currents. Satellites measuring the Earth’s net radiation imbalance can help quantify the interannual variability in ocean heat content (Johnson et al., 2016b), but are not sufficiently accurate to capture multiyear trends and need to be calibrated by ocean observations for absolute accuracy. In situ measurement of temperature change in the ocean, integrated over depth and area, is the most accurate way of monitoring the multiyear heat budget of the Earth’s climate system. On a regional basis, closure of the heat budget requires observations of ocean heat content, air-sea heat exchange, heat transport by ocean currents, and mixing, while the global balance is between the global integrals of heat gain and air-sea flux.
The challenge for ocean observing has not been simply that of making accurate temperature measurements (present shipboard instruments can measure to
an accuracy of 0.001°C). Instead, the challenges lie in collecting samples across the vast spatial extent and full depth of the ocean to form robust spatial averages (or integrals), and with high enough frequency to capture temperature changes accompanying the seasons, storms, and passage of features such as eddies (e.g., Wunsch, 2016). Undersampling translates into large uncertainty in heat content estimates. Although surface drifters and commercial and research ships provide in situ temperature observations near the ocean surface and satellite remote sensing provides spatial coverage by mapping sea surface temperature, the need for temperature observations at depth has been identified as a crucial measurement to account for heat movement and storage in deeper layers of the ocean.
Prior to 2004, temperature profiles were collected by ships, either lowering instruments that recorded temperature as a function of depth (CTDs, which measure conductivity, temperature, and depth) or dropping expendable bathythermograph (XBT) probes. However, there were relatively few high-quality ship-based profiles, and these were not well distributed across the globe or across seasons. Since about 2004, the Argo program has been the dominant source of near global coverage of ocean temperature profiles to a depth of 2,000 m. The Argo program has been transformational through its contribution to the heat budget, by covering a much greater fraction of the global ocean, and at much higher frequency, than is possible with ship-based technologies. Calibrated temperature sensors are used and Argo data are checked against profiles from ship-based measurements to ensure data accuracy. Today, over 3,900 Argo floats, each profiling every 10 days, provide about 140,000 temperature (and salinity) profiles per year from the sea surface to 2,000 m depth, with measurements spread across the globe. Estimates of ocean heat content use Argo data together with other datasets, including shipboard hydrography (thermometers and CTDs) and XBTs, in order to extend the datasets to pre-Argo decades (Johnson et al., 2016a).
As a result of the global Argo program that revolutionized sampling of the upper ocean, estimates of ocean heat content using very different analytical methods converged (Figure 2.1a). This improvement has been attributed to reliable, consistent data collection across the globe, even while managed by many different research organizations. This is in contrast with prior variability in estimates caused by differences in researcher compilation and analysis of sparse historical temperature data records.
Figure 2.1b, showing the changes in heat content in both the Argo-sampled upper 2,000 m and in the deeper ocean based solely on shipboard profiles, shows that increasing heat content penetrates below 2,000 m and so measuring only to this depth misses information needed to close the changing heat budget. Current estimates indicate that the deep ocean may have contributed about 10-15 percent of the total heat storage since the 1950s (Rhein et al., 2013; Llovel et al., 2014). Although Argo sampling has been a great advancement, the availability of temperature data from deeper than 2,000 m remains limited. To address this, new Deep Argo floats have been developed and are currently being deployed
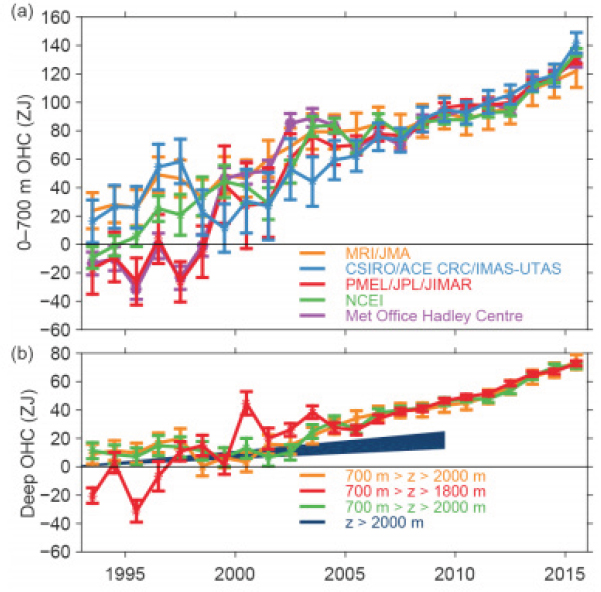
in regional pilot arrays. This new Deep Argo program will extend sampling to 6,000-m depth and enable estimation of ocean heat gain over the full water column. The addition of the Deep Argo program illustrates how the ocean observing system is evolving in response to the goal of closing the global heat budget. Tracking the absorption of heat by the ocean into the future will be improved by sustaining this new program as well as continuing the sampling of the upper 2,000 m.
Other advancements in deep ocean observations include the addition of temperature sensors to existing moorings at depths greater than 2,000 m, which adds high temporal resolution of deep temperature variability to complement the Deep Argo program. To further enhance the value of the Argo program, sampling is planned to be extended into previously unsampled waters, including ice-covered and newly ice-free polar regions. The needs for and uses of deep ocean
temperature data extend well beyond closing the global heat budget. Deep ocean temperature data are needed to initialize and constrain ocean models and improve their representation of mixing of heat downward into the deep ocean. Changes in deep ocean temperature are a measure of change in the large-scale ocean circulation (Purkey and Johnson, 2013). Warming of the deep ocean contributes to the thermal expansion of the ocean that is a contributor to sea-level rise.
However, although progress has been made to quantifying how much and where heat is stored in the ocean, further work remains to improve understanding of all terms in the heat budget. Some of the key observations needed to quantify contributions to the heat budget (e.g., surface heat flux and transports of heat) are reflected in present efforts to identify and prioritize variables ready to be observed (see further discussion in Chapter 3). Other processes, vertical mixing in particular, continue to be the subject of ocean research projects that stimulate ongoing development of methods to estimate and directly observe their contributions. This research and development feeds into the overall context for sustained ocean observing and may in time demonstrate observing methods suited to sustained use. For now, it is important to work not only toward this but also to build understanding of all contributions to the heat budget.
Carbon Budget
Quantifying the capacity of the ocean to absorb CO2 from the atmosphere is essential to predicting climate warming and changes in ocean chemistry. When CO2 is removed from the atmosphere, radiative forcing decreases and climate warming is lessened. Each year, the ocean absorbs, and also emits, an amount of CO2 equivalent to approximately 10 percent of the total mass in the atmosphere (Ciais et al., 2013); however, as slightly more CO2 enters the ocean than leaves it, the partial pressure of CO2 (pCO2) in the ocean rises. This dissolved CO2 becomes a weak acid that lowers the pH of sea water (negative logarithm of the hydrogen ion concentration), a phenomenon termed ocean acidification. Ocean acidification has complex implications for marine life; growth rates of some marine plants may increase while many other organisms are expected to suffer negative impacts, for example, by reducing the availability of carbonate ions used to build calcium carbonate shells and coral skeletons, resulting in weaker structures. (NRC,12010). The dominant sink of anthropogenic carbon in the ocean on the decadal-to-centuries timescale is the dissolution of CO2 into surface sea water, which mixes into the rest of the ocean. Although there are other carbon sinks that operate on this timescale (e.g., sedimentation and salt marshes), none of them approaches the capacity of that resulting from CO2 dissolution. On longer timescales (millennia and beyond), the neutralization of anthropogenic CO2
___________________
1 Effective July 1, 2015, the institution is called the National Academies of Sciences, Engineering, and Medicine. References in this report to the National Research Council are used in an historic context identifying reports published prior to this date.
by the dissolution of calcium carbonate sediments becomes important and could restore atmospheric CO2 to lower levels, but this would occur over many tens of thousands of years (Ciais et al., 2013).
In the carbon system, measurement of two parameters defines the others through chemical equilibrium. Surface water pCO2 is important because it directly influences air-sea exchange, and extensive data have been obtained by underway research and merchant vessels. There is a close relationship between pH and pCO2, and measurement of either one provides comparable information; until recently, pH has not been extensively measured but it may become preferable with the recent availability of new sensors. A second parameter is also necessary, the most useful being alkalinity or total dissolved inorganic carbon. These parameters generally have only been available from shipboard measurements on research vessels. A useful estimate of alkalinity can also be provided by regional regression estimates from measurement of temperature, salinity, and nutrients or oxygen. In situ measurements of the rise in atmospheric CO2 concentration concurrent with the ocean’s increase in pCO2 and decrease in pH clearly illustrate a correlation between these variables in their long-term trends (Figure 2.2). These observations provide strong support for theory and models of CO2 exchange with the ocean and are an essential component to understanding climate change and the global carbon budget. Additional datasets illustrate similar patterns (e.g., Tamburri et al., 2011; Bates et al., 2014).
Ocean carbon distributions show regional variation, and comprehensive in
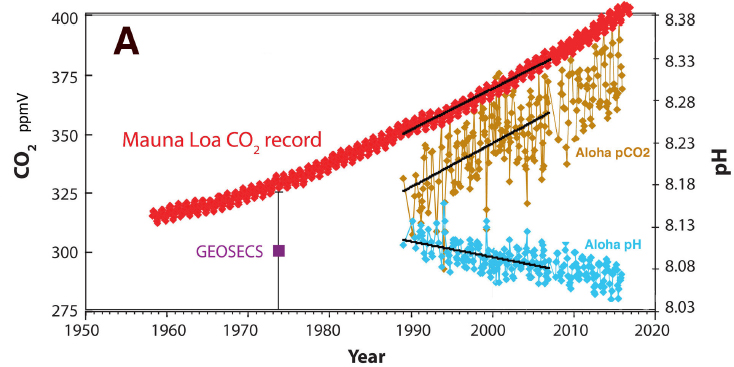
situ sampling is needed to capture this spatial variability. In contrast, atmospheric CO2 measurements have been made for decades at some locations around the globe under the World Meteorological Organization’s Global Atmospheric Watch (WMO, 2001), such as at Mauna Loa (Figure 2.2; see also Keeling, 1998); because the atmosphere is relatively well mixed, sampling at a small number of locations is representative of the full atmosphere. Ocean CO2 and pH measurements have been principally made in the historic WOCE and JGOFS and the current GO-SHIP programs, at time-series stations at single points (Station Aloha at Hawaii as seen in Figure 2.2, and Bermuda Atlantic Time-Series, both starting carbon observations in the late 1980s), and as underway surface pCO2 measurements. Although automated systems on research and merchant vessels have collected millions of surface pCO2 measurements, winter season and spatial coverage in some regions (e.g., Southern Ocean) is sparse. Depth coverage of CO2-system properties is limited to GO-SHIP (and previously WOCE) transient tracer measurements, which provide insight into ocean carbon uptake and distribution. Currently there are 32 pCO2 moorings that are deployed by the United States in the U.S. coastal oceans and in the open ocean, and earliest pCO2 data can trace back to the early 2000s in the equatorial Pacific and U.S. West Coast. The data collected from these moorings have enabled us to study the changes of surface pCO2 and CO2 fluxes on timescales ranging from daily cycles to interannual variabilities (e.g., see synthesis reports by Hales et al., 2008; Najjar et al., 2012; Benway and Coble, 2014). These data form the backbone to quantify the U.S. coastal carbon budget for the last decade, and long-term (decadal and longer) studies of changes in surface pCO2 and CO2 fluxes can be conducted as the data record expands and lengthens.
The development of moored and unattended shipboard sensors for CO2 and pH has seen great progress in recent years and now provides sufficiently frequent observations for some locations. The National Oceanic and Atmospheric Administration’s (NOAA’s) Pacific Marine Environmental Laboratory is working toward growing the OceanSITES global flux mooring network to provide widespread, global collection of ocean and atmospheric CO2 measurements (NOAA, 2017c). A global network of underway ocean surface CO2 measurements has been implemented and organized under the Surface Ocean CO2 Atlas (known as SOCAT), which specifies data quality control standards and provides data access. SOCCOM (Southern Ocean Carbon and Climate Observations and Modeling), a National Science Foundation (NSF)-funded project, is currently deploying biogeochemical-Argo (BGC-Argo) profiling floats throughout the Southern Ocean, equipped with pH sensors as well as nitrate, oxygen, and the standard temperature and salinity sensors. Recent inclusion of new sensors on profiling BGC-Argo floats and moored platforms now provides good resolution of the seasonal cycle, which had for the most part never been measured, but because these instruments are only beginning to be deployed, spatial coverage is still inadequate. Using empirical relationships between carbon parameters, alkalinity and dissolved
inorganic carbon can be computed from the observed measurements. The first full annual cycles of dissolved inorganic carbon, pCO2, and air-sea fluxes of carbon are now being collected (Williams et al., 2017). Sensor development is advanced enough to be in commercial production, and expansion to global year-round profiling is now possible. With these improved capabilities and increased deployments that expand spatial coverage to the entire globe, understanding of the carbon budget will be enhanced and better predictions of how much CO2 will be dissolved into the ocean versus remain in the atmosphere can be made. Significant international coordination and financial resources will be needed to achieve this observational network expansion.
Although the ocean carbon dataset currently available is limited relative to other ocean variables, it provides important information about human impacts on ocean carbon dynamics. Figures 2.2 and 2.3 synthesize data from Ocean Time-Series stations and WOCE and GO-SHIP research cruises that sample lines across the ocean basins approximately every 10 years. This example shows the large variations in water column CO2 in the deep sea that are driven by differences in the ventilation of the interior ocean by currents sinking from the surface. The comparison of CO2 concentrations before and after the rapid CO2 increase attributed to human activities shown in Figure 2.3 also provides important insights into where on Earth the oceans may be changing most quickly.
These relatively sparse observations do not, however, illuminate the processes that transfer CO2 between the atmosphere and ocean. For example, do short-lived events such as storms that impart energy at the surface of the ocean also contribute greatly to CO2 exchange? Do eddies in the upper ocean play a role in air-sea carbon transfer? Or are deep winter surface mixed layers the primary
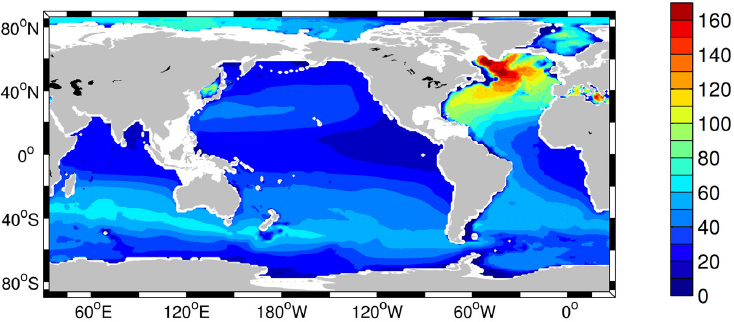
mechanism for larger absorption of CO2? If so, this may explain the high values in the North Atlantic and Antarctic Circumpolar Current region in Figure 2.3, which are areas rich in eddies and also of very deep winter surface mixed layers. Knowledge of the spatial and temporal variability of the processes at work is needed to close the budget through the development of improved models. Improved sampling and prediction of CO2 exchange and pH also have other benefits. In more acidic waters, for example, organisms that build shells and other structures from calcium carbonate will require more energy to do so and have less success (NRC, 2010). Thus, managers of shellfish hatcheries have a strong interest in the variability and change in the pH of the water drawn from the ocean for use in the hatchery. Looking ahead, a better ocean carbon observing system is necessary to sample from local (coasts) to global scales and resolve variability in much the same way that coastal observing platforms and the Argo array do today. As with the heat budget, some processes in the carbon budget that influence carbon transport, are not yet routinely observable; and ocean research and process studies are important to build the understanding and capabilities needed to enable sustained observing of these processes.
Fresh Water Budget
The ocean holds about 97 percent of the water on Earth (Gleick, 1996). The “fresh water” in the ocean refers to the amount of water (by weight) in sea water, which consists of both water and salts, with salts accounting for about 3 percent of the mass. Ocean salinity is the measure of the salt content of sea water; it is decreased by dilution (through fresh water input from precipitation, river outflows and surface runoff, or ice melt) and increased by evaporation or rejection of salts from sea water during sea ice formation. Ocean surface salinity is lower in regions of excess precipitation (P), and higher in regions of excess evaporation (E) (Figure 2.4b, d). Because of the direct linkage between salinity and fresh water content, measurements of ocean salinity provide information about how fresh water is redistributed globally (e.g., Gordon, 2016). As the climate warms, the atmosphere holds more water vapor (Figure 2.4a; see also Schneider et al., 2010) and this excess water vapor capacity is associated directly with patterns of increased evaporation from the ocean and increased precipitation (Figure 2.4b) that maintain a new equilibrium in atmospheric water vapor content.
Evaluation of the global fresh water budget requires observations of salinity, temperature, sea ice, velocity of ocean currents, diffusivity within the ocean, and the fluxes of fresh water into and out of the ocean in the form of precipitation, continental and ice sheet drainage (through runoff, melting, and calving), and evaporation. Ocean salinity measurements provide a record of changes in the hydrological cycle over the past 50 years, showing that on the whole, regions of high surface salinity have become increasingly saline, while regions of lower surface salinity have become fresher (Figure 2.4c). This has been observed through
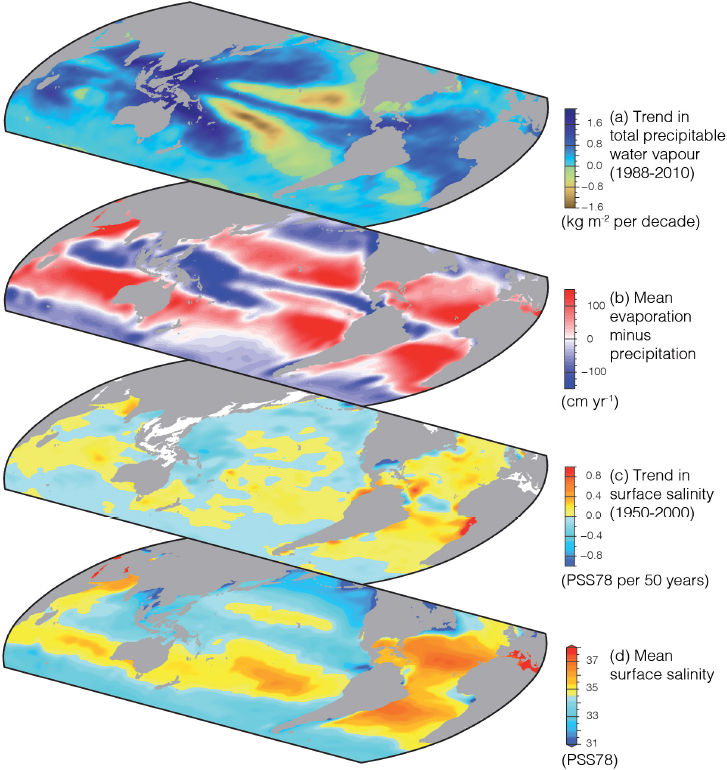
the network of opportunistic research ship expeditions over many decades, plus the much more intense observing provided by the Argo profiling float network since the early 2000s. While pre-Argo observations provided evidence of such hydrological changes only through spatially averaged trends in salinity (Boyer et al., 2005), Argo observations over the past 10 to 15 years have allowed the trends
to be mapped (Figure 2.4; Durack and Wijffels, 2010), showing that indeed, at the largest spatial scale, regions with high evaporation rates are becoming more saline and high rainfall regions are becoming fresher. Averaged over the globe, the surface salinity difference between saltier and fresher surface regions has increased by almost 0.09 parts per thousand, which is about 1 percent of the total range of salinity but as high as 5 percent when looking at the range in a given hemisphere of an ocean (see also Rhein et al., 2013). Changes in salinity also impact ocean circulation and the heat and carbon exchanges between the ocean and the atmosphere, making this a critical component of understanding Earth’s changing climate.
Observing ocean salinity on a global scale informs us about the global hydrological cycle and adds to understanding that will be used in prediction of drought and flood conditions (Durack et al., 2012). At the same time, observing ocean temperature and salinity is the primary way in which climate-related change in the ocean is tracked, including changes in ocean circulation. Combined temperature and salinity distributions reflect the large-scale circulation patterns as well as the changes caused by heating and cooling, and evaporation and precipitation. An important part of the global ocean circulation, referred to as the overturning circulation, or in earlier usage as the thermohaline circulation, is associated with density differences stemming from the differing temperature and salinity of different water masses. Higher density water created at high latitudes, especially in the Antarctic and subpolar North Atlantic, spreads through the deep oceans, returning to the sea surface through both wind-driven upwelling in the Southern Ocean and through downward mixing (diffusion) of heat in the warm low latitudes. Freshening of surface waters in some regions at high latitudes can cause even cold surface water to be more buoyant, thereby reducing the ability of surface waters to become dense enough to sink to great depth and altering the pathway of surface water into the interior of the ocean. By tracking salinity and temperature properties of water in the ocean interior, change in the overturning circulation and in how those waters are generated can be better understood. A description of the overturning current and the observations needed to understand its climate-relevant process is found in Box 2.1.
New developments in remote sensing have added the capability of measuring and mapping sea surface salinity (SSS) from satellites such as Aquarius and SMOS (Soil Moisture and Ocean Salinity) (Lagerloef et al., 2008; Reul et al., 2014). In situ sampling of SSS in field experiments is being used to calibrate and support the remote sensing effort, thereby increasing the extent of reliable measurement coverage (Lindstrom et al., 2015). Fresh water fluxes into the ocean are increasingly better observed, through improvements in satellite observations of precipitation and ocean mass, in-stream gauge networks operated by the U.S. Geological Survey, and in coupling coastal models with NOAA’s new integrated water (hydrological) model. Fresh water changes due to formation and movement of sea ice, as well as melting of glaciers, ice sheets, and ice shelves, are
increasingly better observed as a result of extensive satellite remote sensing of the cryosphere. As with the heat and carbon budgets, some processes that redistribute fresh water in the ocean are not yet routinely observable; and research and process studies are important to build the understanding and capabilities needed to enable sustained observing of these processes.
Through expansion of the existing Argo program into the deep ocean, polar waters, and coastal regions (along with GO-SHIP repeat hydrography, remote sensing of SSS, and deep moored temperature and salinity measurements) and improvements in observing ice mass balance, precipitation, land runoff, and evaporation, it should become possible to close the fresh water budget and hence improve our understanding of the global water cycle. Further, this information will help quantify change and variability in the ocean’s water masses and global overturning circulation. In addition to improving understanding of the physics of climate, this information is needed for ecosystems management and forecasting of species adapted to live in specific temperature and salinity conditions.
OBSERVATIONS OF GLOBAL AND REGIONAL SEA-LEVEL CHANGE
Knowledge of sea level has an immediacy of value for the large fraction of the population located near coasts and on low-lying islands. Sea level is impacted by—and thus integrates—a large range of geophysical processes, involving ocean and atmosphere dynamics, changing land ice, the Earth’s lithosphere and its re-
sponse to ocean mass and land-ice loading, and the Earth’s rotation characteristics (Stammer et al., 2013). Thus, discussion of sea level and the observations needed to improve our understanding and predictive capabilities for future change provides a complement to the previous discussions of heat, carbon, and fresh water budgets, particularly since ocean heat and mass changes affect sea level. Monitoring ocean heat content changes provides estimates of rates of thermosteric sea-level rise. The net fresh water input to the ocean, which increases when higher temperatures cause glaciers and land ice sheets to melt and run off (or calve) into the ocean, also contributes to sea-level rise. To assess these components of the heat and fresh water budgets, in situ measurements of temperature and salinity are needed throughout the water column to complement satellite observations. Moreover, ocean current observations are required to evaluate the transport of heat and salt and their contributions to regional sea-level change. Refining the calculations of these budgets based on a comprehensive set of in situ measurements will advance our understanding of causes of global and patterns of regional sea-level rise, as will be necessary to assess risks to coastal communities and infrastructure in the United States, and to low-lying regions worldwide. Because some measurement techniques target absolute sea level, whereas others measure relative (local) sea level, care must be taken in properly accounting for their differences in observing strategies.
Global Sea-Level Rise
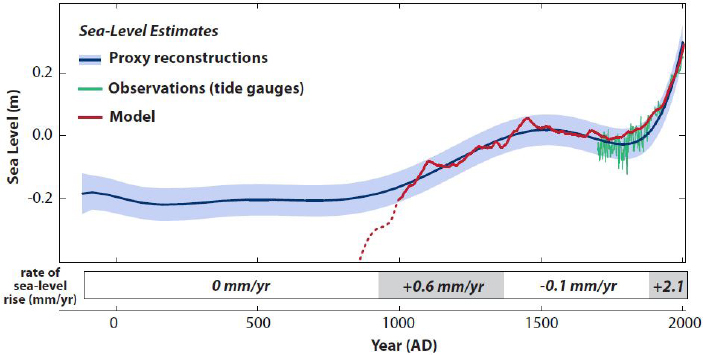
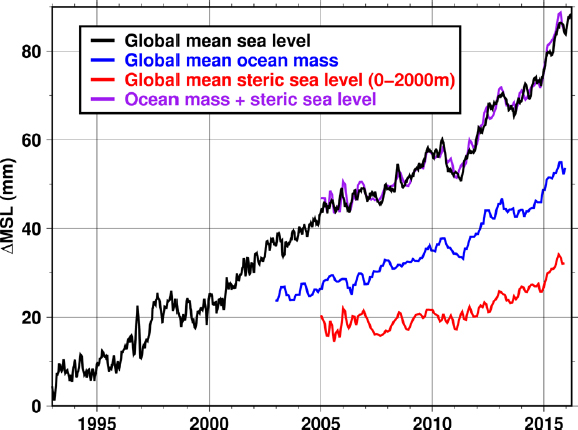
Sea-level rise is one of the leading indicators of a warming climate. The increase in global mean sea level (GMSL) over the past century has been approximately 15 cm, as estimated from tide gauges and satellite altimetry. This rise in GMSL has occurred during a dramatic increase in global average surface temperature and is nearly equal to the increase in sea level over the past millennium (Figure 2.5). Climate model projections suggest that sea-level rise will continue to accelerate dramatically over the next century and beyond (Church et al., 2013), causing profound societal impacts around the world (Wong et al., 2014). To understand the drivers of sea-level rise, both globally and on regional scales, and to validate and improve climate model projections, a sustained satellite and in situ observing effort is required. As an illustration of current capabilities, the recent trend and year-to-year variations in GMSL (measured by satellite altimeters) are well described by the combined contributions to GMSL from melting land ice (measured from satellites) and ocean warming (thermosteric sea level estimated from in situ Argo data) (Figure 2.6 and, e.g., Leuliette and Willis, 2011; Chambers et al., 2017). The agreement of these intercomparisons suggests that the attribution of sea-level rise is achievable on a global scale. An expanded heat and fresh water monitoring effort in the deep ocean and in polar regions, as discussed earlier in this chapter, will enhance our understanding of GMSL.
Regional Sea-Level Change
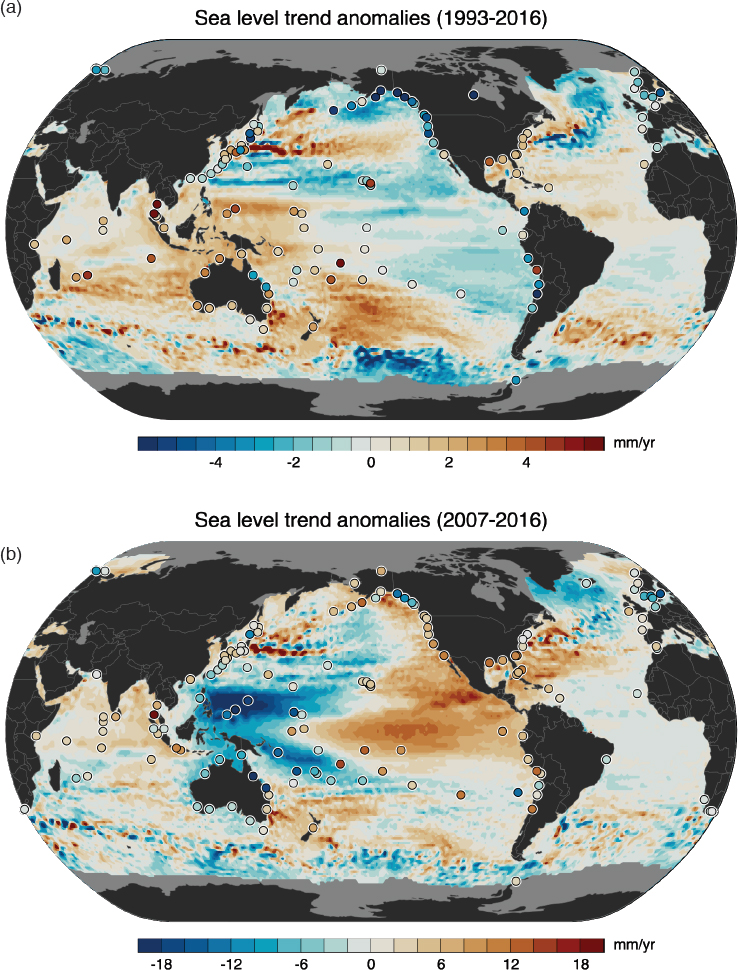
Sea-level change is not uniform across the global ocean, but instead varies in different regions. Research efforts have focused on determining this spatial variability to better explain the drivers of regional change and the impacts of sea-level rise at specific locations. The satellite and in situ observing system elements that provide the integrated measure of GMSL also monitor the rich variations in regional sea-level change. Satellite altimeters have provided near-global coverage of the oceans since the early 1990s which can be used to evaluate regional change. Tide gauges provide validation for satellite measurements and complementary information at multidecadal-to-centennial timescales, and include measurements of the coastal zone. Both systems indicate regions of the ocean that have been rising faster than the global average over the altimeter era, particularly in the Southern Hemisphere, while in other areas sea level has fallen (Figure 2.7). These patterns largely represent variations in the upper ocean circulation in response to surface winds that change on decadal and longer timescales. For example, recent changes in Pacific wind patterns associated with a shift to the Pacific Decadal Oscillation warm phase (Hamlington et al., 2016; NASEM, 2016a), have led to a sea-level increase at the eastern tropical Pacific and a decrease at the western side over the past 5 years (Figure 2.7b), which is counter to the longer term trend since 1993 (Figure 2.7a). Similarly, the observed slowdown of the North Atlantic subpolar gyre circulation since the mid-1990s has been attributed to changes in the wind field over the North Atlantic sector (Häkkinen and Rhines, 2004, 2009).
Regional sea-level patterns are also influenced by vertical land motion, with rates that are often comparable to absolute sea-level changes. Mass loss from the Antarctic and Greenland ice sheets results in distinctive regional sea-level patterns, or “fingerprints” (Mitrovica et al., 2011), the reduced weight of the ice sheet causing the land below it to uplift (or rebound) as well as other far-field solid Earth deformations. The reduction of mass concentrated in frozen form on the ice sheet leads to a change in the global gravitational field, and the global mass redistribution causes changes in the Earth’s rotation, which in turn impacts the sea level’s dynamic topography. Land can also rise or fall locally due to the loss of ice mass from the last glacial period (glacial isostatic adjustment), earthquakes, land water storage, land subsidence from groundwater withdrawal, soil compaction, variations in sedimentation rates, wetland submergence, or oil extraction (Church et al., 2013; Wöppelmann and Marcos, 2016). These processes underscore the need for sustained regional measurements to identify the contribution from vertical land motion to relative sea-level change (e.g., Khan et al., 2016). Understanding, quantifying, and distinguishing the drivers of sea-level change and the associated coastal impacts requires a continued, broad interdisciplinary monitoring approach, involving ocean, atmosphere, land ice, and land observing components. Monitoring the sea surface height, the ocean circulation, changes of land-ice masses and vertical land motion, and air-sea fluxes of heat, fresh water, and momentum all contribute to improved understanding of pro-
cesses driving sea-level change. The temperature and salinity observing efforts, with the improvements discussed earlier in this chapter, are also essential to improving knowledge of sea-level change processes.
Finding: The current ocean observing system has made significant contributions to better understanding the ocean’s role in the Earth system, including its heat, carbon, and fresh water budgets, and to better understanding global and regional sea-level change. Sustaining, optimizing, and increasing ocean observing capability will further improve understanding of the ocean’s role in climate.
INTEGRATING DATA FROM MULTIPLE OBSERVATION SYSTEMS TO UNDERSTAND CLIMATE
In situ data collected with different observing systems are commonly linked to each other and to data collected with external observing systems, such as satellites and atmospheric observations. By integrating datasets from multiple observing platforms, more detailed knowledge of specific aspects of the system can be gained, and improved understanding of the ocean and its role in the broader climate system can be achieved. Remote sensing methods provide incomparable spatial coverage that complements in situ sampling. Key ocean observations made from satellites include sea surface height, surface winds, sea surface temperature, sea surface salinity, ocean bottom pressure, sea state (surface waves and swell), and ocean color. Over polar regions, satellites measure characteristics of sea-ice extent, drift, age, and, increasingly, thickness. Often, in situ sampling also provides important means to calibrate and validate remote sensing products. Tide gauges, for example, have proven essential to identify drift in satellite altimeters (Mitchum, 2000; Chen et al., 2017). Atmospheric observations at the sea surface of surface wind, near-surface air temperature, surface rainfall, and near-surface air humidity, together with the sunlight (shortwave radiation) and infrared (longwave) radiation falling on the sea surface, are required to compute the exchange of heat, fresh water, and momentum between the ocean and atmosphere (momentum is the effect of surface wind on surface water, to accelerate water movement). Such observations are possible at a small number of in situ surface buoys (OceanSITES and DBCP) and from ships (SOT).
Combining and interpreting diverse sets of variables with heterogeneous spatial and temporal sampling patterns is challenging. This has long been recognized in numerical weather prediction, where computational frameworks, generally known as data assimilation (DA), have been developed in which numerical models are used to combine data and connect the different variables through known equations (Lahoz et al., 2010). Experience from weather forecasting shows that development of robust DA methodologies (e.g., Bauer et al., 2015) is critical for increasing the usability of ocean observing data for a broader array
of data consumers. Atmospheric observations are routinely incorporated in the large weather forecasting models, and in “reanalysis” methods used for climate purposes (defined below). Ocean observations similarly have become essential for constraining the ocean component of these forecast models, for stand-alone systems in operational oceanography (Edwards et al., 2015; Martin et al., 2015), as well as ocean observation–climate modeling systems (Stammer et al., 2016). Many of the ocean observing programs described in this report are integral to these models, and disruption or discontinuity of the observations would exact a large toll.
DA is increasingly being used in so-called coupled model “initialization” efforts, where formal methods are deployed to derive optimal initial states based on available satellite and in situ observations to improve seasonal-to-decadal Earth system predictions (Meehl et al., 2014; NASEM, 2016b). A challenge is that the observed initial state may not be the model’s preferred state, potentially leading to “initialization shocks” that may confound the forecast. One role of DA is to reduce such shocks and the dependence of the initialization technique on the (incomplete) observing system. DA also enables Observing System Experiments (OSEs) as well as Observing System Simulation Experiments (OSSEs). These frameworks are employed to assess the impact of existing observing networks on a specified climate metric, and to quantify the optimal enhancement of such networks by new observations (what observations have the most impact, where should they be placed, and at what sampling rate), thereby prioritizing or guiding the evolution of the observing system design.
The oceanographic community is gradually adopting DA frameworks; however, the sparsity of ocean observations compared to atmospheric ones presents a challenge in implementing these frameworks to reconstruct the ocean’s past climate. Multiple data assimilation methodologies have been developed, including state estimation and reanalysis, the uses of which vary depending on the data analysis needs (e.g., the need to interpolate conditions of the recent past based on limited observations or to extrapolate into the future; see Thacker and Long, 1988; Wunsch and Heimbach, 2013; Stammer et al., 2016). A state estimate represents a statistical fit of a dynamical model to the available observations and uses interpolation-based DA both forward and backward in time. Reanalysis is the collection through time of optimized initial states that have been generated for forecasting purposes. Whereas these states represent good fits to available observations and are similar to state estimates, considered as time-evolving states they do not adhere to strict conservation laws on timescales relevant to climate variability and change. State estimation is thus essential for closing the climate budgets, and is slowly becoming more commonly used in oceanography. Ocean state estimates and reanalyses are increasingly being explored to provide optimal initial conditions for seasonal-to-decadal climate prediction. Atmospheric reanalysis fields are used in ocean models to infer the ocean surface’s boundary conditions, such as the air-sea fluxes of momentum, heat, and fresh water
(“surface forcings”), essential information for driving the ocean component of the models and for estimating heat, carbon, and fresh water budgets in the ocean.
DA usually requires a (state-of-the-art) general circulation model (ocean, atmosphere, or coupled), a serious effort to collect available data streams, uncertainty estimates for observations and the background state, a comprehensive assimilation scheme, and significant computational resources to put it all together. Common, simpler approaches for merging observations than DA, which requires a full numerical model, are blended products of different in situ, remotely sensed, and model inputs of one variable to create gridded fields (three-dimensional maps of observed variables). Temperature, salinity, and biogeochemical data are routinely treated in this manner, and are at the heart of many published and ongoing budgets for heat, fresh water, and carbon, as well as other biogeochemical parameters. Ocean velocity is a critical variable for budgets derived in this manner; because the useful parts of the velocity field for climate timescales are difficult to measure directly throughout the ocean, velocities are estimated using a combination of different types of observed variables. This is one of the outputs of DA, but estimating the ocean’s velocity field is also routinely accomplished through “data integration,” in which different observed variables are combined using an assumed underlying dynamical model, such as geostrophy or Ekman balance.
From a climate perspective, the ocean currents transport heat poleward from the equator and sequester waters from high-latitude surface oceans into the interior, and are thus a key component of the processes that govern heat, carbon, and fresh water uptake, transport, and storage. At the same time, knowledge of currents supports applications including improved maritime transportation, improved search and rescue capabilities, and improved oil spill prediction. Deriving ocean current velocities via approximate methods (for instance, geostrophic balance and Ekman transport) requires information about the ocean’s density field and surface winds. Argo profiling floats measure temperature and salinity profiles, which are used to calculate sea water density. Incorporating satellite measurements of sea surface height (altimetry) improves estimation of the geostrophic flow. Finally, the wind-driven, or Ekman, component of the ocean velocity field can be added by using wind data from satellite remote sensing. Taken all together, the estimates of the sum of the wind-driven and density-driven flows are key to building basin-by-basin budgets of inflow, outflow, and storage of heat, carbon, and fresh water.
BENEFITS OF OCEAN OBSERVATIONS BEYOND CLIMATE
A sustained and integrated suite of ocean observations designed to contribute to a better understanding of future changes in Earth’s climate also benefits many other areas of science, commerce, and human safety. Among the most apparent and important benefits are daily to weekly weather forecasting and seasonal climate prediction. Modern weather forecasting relies on the same satellites and in
situ measurements used for observing the oceans. Increasingly, observations of ocean temperatures, patterns of sea surface warming and cooling, and even seaice extent are used with numerical circulation models to reliably forecast hurricane intensities and tracks as well as seasonal precipitation and storminess, which influence large portions of the United States. Seasonal prediction of Arctic Ocean ice cover will become increasingly valuable as reduction of the seasonal ice pack may open the Arctic to increased commercial activities and tourism (NRC, 2014).
The Tropical Pacific Observing System (TPOS) has been operating for decades and is a valuable part of the monitoring network for measuring long-term changes in ocean-atmosphere heat exchange and ocean heat content. This system was originally designed, in large part, to better understand and predict the occurrence and impacts of the El Niño–Southern Oscillation (ENSO) phenomenon. The system has been highly successful in achieving these goals and today’s operational ENSO forecasts, with lead times of 3 to 9 months, are highly dependent on data from the array. These forecasts impact many areas of American commerce, influencing farmer crop decisions, grain and electricity futures, and insurance rates among others, because of the profound and often predictable influence of ENSO on seasonal weather patterns in the United States and beyond (Haigh et al., 2015; Tack and Ubilava, 2015; Anderson et al., 2017; Ubilava, 2017). Specifically, agricultural enterprises use ENSO-dependent seasonal forecasts as an aid to plan the timing of planting, fertilizing, and harvest, as well as livestock grazing strategies (see Klemm and McPherson, 2017). The U.S. investment in TPOS has paid for itself many times over, and ENSO experts expect these benefits to become even more important as the climate continues to change. A redesign of the TPOS is being undertaken to modernize and improve the system with the view of extending ENSO forecast ability and broadening the TPOS objectives to include climate (Cravatte et al., 2016).
A study by Scharroo et al. (2005) provides compelling examples on how combined sea surface temperature (SST) and sea surface height observations could have significantly improved forecasting the intensification of Hurricane Katrina prior to landfall (see also Goni and Trinanes, 2003; Morrow and Le Traon, 2012). Sea surface height anomalies were measured related to anomalously thick layers of warm waters associated with warm core eddies in the hurricane’s path. Such features developing over longer timescales provide a source for prediction of hurricane intensification. Similar results were found for Northwestern Pacific typhoon intensity (Mei et al., 2015). Altimetry also measured elements of developing storm surge in the wake of the hurricane. In 2012, Superstorm Sandy caused over $65 billion dollars in damages in the United States, second only to Hurricane Katrina (NOAA, 2014). Lau et al. (2016) simulated Superstorm Sandy under warmer ocean conditions expected with a doubling of atmospheric CO2 levels and estimated that the storm’s Power Destructive Index may increase as much as 50 to 160 percent, depending on the extent of Atlantic warm pool warming and the storm’s exposure time to it. Taken together these studies reinforce the
importance of both surface and subsurface ocean observations to improve and extend forecasting of the world’s most destructive storms.
Tide gauges that provide information on sea-level rise are also used to track changes in water level resulting from storms, and the potential for coastal inundation. Tide gauges can be used to monitor changes in water height in navigable channels, information that has become more important as merchant ships have increased in size and draft. Additionally, observations of the tides and the height of the tide, as well as observations of the salinity and temperature of the water in ports are also being used to estimate the buoyancy of large vessels, to gain small advantages in bringing loaded ships directly to docks rather than unloading offshore or using smaller vessels.
Ocean observations are also important for optimizing fisheries management and promoting sustainable use of marine resources (Nicol et al., 2013; Evans et al., 2015). Ultimately, sustainable ocean harvests and aquaculture require sustained ocean observations, ranging from knowledge of changes in the location and amount of oceanic primary productivity that fuels all trophic levels including commercial species; to changing ocean currents, temperatures, and salinities that influence where and when fish breed and feed; to the locations and activities of illegal and unregulated fishing vessels. Multiple elements of the existing and future ocean observing system can provide important datasets that support the development and maintenance of sustainable fishing practices worldwide.
Ocean acidification is a natural and predictable consequence of CO2 uptake from the atmosphere and is now decreasing global ocean pH with substantial regional variability. Declining pH is already impacting marine food webs and causing negative impacts within specific sectors of U.S. shellfish aquaculture (Washington State Blue Ribbon Panel on Ocean Acidification, 2012; Cooley et al., 2015; Feely et al., 2016). Projections of future impacts include significant losses to coral reef habitats and some fish stocks (Branch et al., 2013; Speers et al., 2016). Many of the assets now being used for ocean climate observations are needed for understanding future changes in ocean acidification as discussed in the carbon budget section of this chapter. Additionally, platforms such as Argo are already being outfitted to make pH and O2 measurements through the BGC-Argo program discussed above. Attention to ocean acidification and its impacts on food security is likely to increase in the next decade. Future research depends on a healthy and sustained ocean observation system.
The data and products from the ocean climate observing system have also enabled services provided by private companies in multiple sectors such as marine forecasts for shipping, seasonal forecasts for agriculture and water resource management, and tailored services based on sea surface temperature and other factors for commercial fisheries operations. For example, multiple companies (e.g., BigOceanData, StormGeo) provide ocean climate information in their data products designed for optimal shipping safety and routing.
Finding: The ocean observing system contributes not only to our understanding of climate variability and change, but also to a wide variety of other services including weather and seasonal-to-interannual forecasting, living marine resource management, and marine navigation. This understanding of climate variability and change and other services underpins national defense, economic, and social policy decisions.
TECHNOLOGY CHALLENGES OF OCEAN CLIMATE OBSERVING
Although great progress in ocean observing has been made, many technological and computational challenges remain and new obstacles are likely to arise as systems expand and new data needs emerge. The observing system deployed to collect in situ ocean climate observations exists in the context of the Earth observing system, which is the combination of in situ and remote sensing observations, and in the context of model-based syntheses and predictions. The integration of in situ data with that from remote sensing is essential to gaining the most comprehensive understanding of the ocean and climate system, as discussed earlier in this chapter. This integration, however, presents unique challenges. Most in situ sensors sample at a point location, while satellite sensors look down and average over a spatial footprint using a property of the ocean surface, such as emissions of thermal radiation at a specific frequency. This spatial footprint is then related to the desired observed metric, such as sea surface temperature. The satellite observation needs to be calibrated, algorithms need to be developed to apply to the remote sensing observations, and platform-to-platform continuity and comparability need to be established as successive satellites are flown. Developing and sustaining formal data-model synthesis in the form of formal estimation is a complex undertaking, akin to, albeit different from, DA for the purpose of numerical weather prediction. These activities are key to integrating the disparate and heterogeneous observational data streams in a consistent manner.
Measuring environmental variables in situ in the ocean is also technologically and logistically complex. Sea water is corrosive to deployed instrumentation and it is opaque to radio frequencies, making communication of data from within the ocean by telemetry difficult. Instruments and sensors deployed in the ocean are subject to biofouling, with marine growth either interrupting sampling or affecting the calibration of the sensors. Surface waves, currents, and winds challenge structures designed to work at or near the sea surface while in the deep ocean, instrument cases must withstand cold temperatures and high pressure. Because of the cost and limited availability of ships required to deploy and maintain equipment, deployed instrumentation has to be designed robustly, using low-powered but reliable and accurate electronics. Data are often recorded internally, to be collected when instruments are recovered, or data are telemetered via satellite in the case of platforms that are not recovered. In addition, moored
and untethered platforms are subject to vandalism at sea, damage by fishing gear, or theft.
It is attractive to consider adding new sensors to existing platforms; however, this raises costs, increases power consumption, and adds to data telemetry or recording requirements. Adding sensors thus must be done with consideration of negative impacts on the data currently delivered by a platform. New technological approaches may yield more cost-effective approaches to sampling, but phasing out an existing sampling methodology to be replaced by a new approach requires a period of overlapping sampling and analyses of both datasets to document and prove the comparability that is required to preserve a continuous long-term record of a given variable.
Current and near-future technological advances have helped and will continue to help address ocean observing challenges, an important element of advancing the ability to sustain ocean observations as noted in the committee’s statement of task. Improved batteries allow greater lifetime, hosting of more sensors, and higher sampling rates. Increased power availability also allows implementation of strategies to address biofouling (e.g., opening and closing shutters, in situ generation of chlorine) and use of higher rate telemetry systems. Shifting from limited-bandwidth telemetry system to higher data rate Iridium and Inmarsat systems has increased the ability to send more data in real time and also allows two-way communication to support system maintenance and adjustment of sampling. Autonomous systems such as gliders and Saildrones allow deployment of platforms that navigate themselves to the desired site or region and are less subject to the vandalism and damage seen at fixed observing platforms in heavily fished areas. In addition to human impacts, biofouling at and near the surface continues to be a challenge, and technical improvements to mitigate biofouling impacts (e.g., sensor drift, flow, and light blockage) continue to be needed. The inherent challenges to sustaining ocean observing in the wide-ranging and physically harsh environment of the ocean can be overcome with these advances in technology, but ultimately require prioritization and sustained investments in these efforts.
FUTURE EVOLUTION OF THE OCEAN CLIMATE OBSERVING SYSTEM
Building and improving our understanding of climate requires continued and expanded observations of the ocean that are adaptable over time to address emerging opportunities and data needs. The heat budget example made clear the need for deep temperature data. The carbon budget illustrates the need for more space and time resolution in sampling. The fresh water budget shows how new remote sensing capabilities greatly augment in situ sampling, while expansion of salinity sampling in concert with temperature sampling would be extremely valuable. Shaping the evolution of the sustained observing system includes con-
siderations of global coverage of data collection, uninterrupted long time series that allow for data collection across the wide range of timescales associated with climate variability, and additional sampling to fill gaps in either the coverage in space and time or in the variables being observed. The extent of global coverage needs is increasing as ice-free summers in the Arctic Ocean add to the surface area and volume of open ocean to be sampled; additionally, sampling the ocean beneath polar ice shelves presents an even greater challenge. There are also data-sparse regions, such as the Southern Ocean and Southeastern Pacific, that play a significant role in the Earth system, where improved understanding and predictive capabilities are needed, in particular given the potential role of Southern Ocean circulation changes in future Antarctic ice-sheet mass loss (e.g., Joughin et al., 2012; Alley et al., 2015). Additionally, there are many patterns of natural variability that act on varying timescales and influence the ocean’s role in the climate system where greater information is needed. These patterns include the periodicity of ENSO, the decadal and multidecadal modes of coupled ocean-atmosphere variability, and the slow (millennial) timescale implied in the overturning of the deep ocean. These sources of natural variability are also influenced by the changes in the oceans and global climate system from anthropogenic emissions of CO2. To the extent that modes of climate variability have distinct spatial patterns and timescales, long and detailed enough observations may help disentangling their respective roles and provide robust estimates in detection and attribution studies (e.g., Hasselmann, 1993, 1997).
The ocean observing programs have evolved to address emerging questions and utilize technological advances in measurement techniques, and this will continue into the future. New programs and observing system components currently in major pilot experimental stages intended to fill existing sampling gaps include the Deep Argo and BGC-Argo programs (Zilberman and Maze, 2015; Biogeochemical-Argo Planning Group, 2016), increased observation of sea surface salinity through the SMOS and Aquarius satellite missions, and improved quality of time-varying gravity measurements over the ocean by GRACE to constrain ocean mass transport (e.g., Wouters et al., 2014; Landerer et al., 2015). There is ongoing development of new sensors. In particular, nonphysical sensors that measure nutrients, pH, biomass of oceanic organisms, dissolved oxygen, fluorescence, optical properties, and genetic material have reached or are reaching technical readiness for inclusion in the sustained ocean observing system (Riser et al., 2016). Additional types of sampling will also likely emerge through new prioritizations made within the international community framework (see Chapter 3) and in response to modeling needs as the scientific understanding of the ocean’s role in climate advances.
The broader ocean observing community will also contribute to the evolution of the system through various related efforts. Models provide the ability to examine the impacts of withdrawing or adding sampling platforms and to assess
requirements for sampling density in space and time. Oceanographic research programs carrying out regional or local field programs that find modes of ocean variability and improve understanding of and parameterization of ocean processes are important contributors to consideration of how to evolve the observing system. National and international research programs have foci on assessing the efficacy of basin-scale observing (e.g., AtlantOS in Europe) and on the ability of the observing system to quantify key processes such as basin-scale meridional overturning in the Atlantic (e.g., AMOC).
This page intentionally left blank.


