
3
The Current Landscape of Computer Science Enrollments
INTRODUCTION
As discussed in the previous chapter, the number (both relative and absolute) of bachelor’s degrees awarded in computing fields has been increasing significantly since 2008. However, data about computer science (CS) degree completions fails to tell the full story of current enrollment in computing majors and courses and the impact this demand is having on colleges and universities, their computing departments and programs, and their students.
For a deeper picture of the current undergraduate computing enrollment landscape, the committee turned to recent survey data, including the following:
- The Computing Research Association’s (CRA’s) Taulbee and non-doctoral-granting departments in computing (NDC) survey results on recent enrollments in computing major programs at a sampling of computing Ph.D.-granting universities and non-doctoral colleges, respectively;
- The Freshman Survey of the Cooperative Institutional Research Program (CIRP), provided by the Higher Education Research Institute (HERI);
- The CRA Enrollment Survey results on recent enrollments in computing courses for subsets of Ph.D.-granting universities and non-doctoral colleges, respectively;
- Aggregated student academic data from institutions participating in the Consortium for Undergraduate STEM Success (CUSTEMS), from an Academies-commissioned paper.
- Recent undergraduate CS major enrollment trends within engineering schools, from a report of the American Society for Engineering Education.1
While the corresponding data do not provide a comprehensive record for all U.S. institutions, and in general are sampled from quite different universes of U.S. institutions of higher education, they represent the best data available to the committee at present for understanding the contemporary CS enrollment environment. National data on U.S. undergraduate enrollments would enable a more comprehensive analysis and a better understanding of U.S. undergraduate enrollment trends in CS and in general. However, such data are not available at a national level.
Nonetheless, the committee believes that the characterizations in these data are reasonably accurate, and can be taken as indicative of trends at the type of institution sampled.
This chapter explores recent trends in enrollment in the CS major, interest and participation of non-CS majors in computing courses, the impact of course enrollment by non-majors on CS departments, and the changing needs of non-CS majors with respect to computing education and skills. It then discusses the current landscape of hiring of new CS faculty and the responses that institutions have considered or begun taking in response to increasing enrollments.
BACHELOR’S DEGREE ENROLLMENT IN COMPUTER SCIENCE
The data presented in the previous chapter clearly illustrate the recent boom in CS degree production through 2015, but do not provide insight into the number of majors currently in the pipeline. The CRA and CIRP survey data help to shed light on these trends. It is worth noting throughout these discussions that different institutions may have slightly different definitions of CS and somewhat different major enrollment requirements, and may require students to select majors at different points in their undergraduate career.
Recent Computer Science Major Enrollment
The CRA Taulbee Survey is administered annually to all North American Ph.D.-granting institutions that belong to the CRA, incorporated in 1990. This survey collects computing units’ (e.g., a CS department or a college of computing) self-reported bachelor’s, master’s, and Ph.D. degree trends. This annual survey has been a principal source of information about the enrollment, production, and employment of Ph.D.s in computing since it was first administered in 1974 by Professor Oren Taulbee at the University of Pittsburgh (CRA, 2015). An adaptation of this survey has also been sent to non-CS-Ph.D.-granting 4-year
___________________
1 See ASEE (2015).
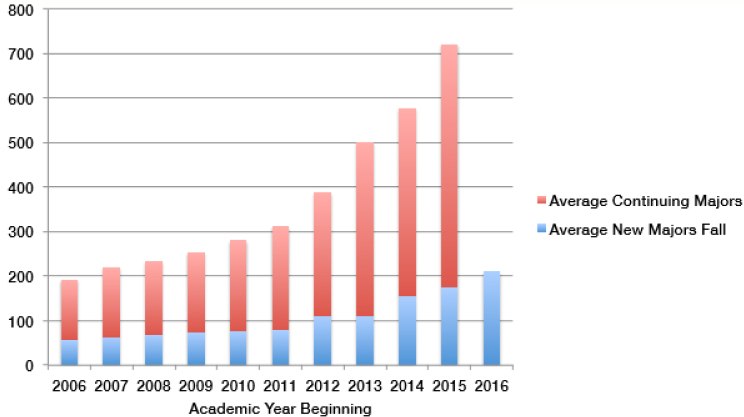
institutions’ departments in computing (known as NDCs) since 2012 via the Association for Computing Machinery (ACM), as a supplement to the Taulbee Survey. According to these results, the average number of students majoring in computer science (freshmen through seniors) at Taulbee institutions more than tripled between 2006 (192.4 per unit) and 2015 (721.4 per department), as illustrated in Figure 3.1. Since 2013, the average number of majors has significantly exceeded that experienced at the dot-com peak in 2001 (398.1 per unit); in 2016, the number of majors was nearly double that experienced at the dot-com peak. In fact, 82 percent of the 119 institutions that responded to the CRA Taulbee Survey in both 2009 and 2014 experienced an increase of 50 percent or more in the number of CS majors between 2009 and 2014 during this time frame; 63 percent of responding institutions grew by 100 percent or more. The survey data also reveal that the number of computer science majors has been increasing at similar rates between 2006 and 2015 at both “large” (from 341 to 970 majors) and “small” (from 158 to 499 majors) Taulbee institutions (institutions that grant Ph.D.s in computing and have greater or fewer than 25 tenure-track faculty in computer science, respectively) (CRA, 2017a).
A recent report from the American Society for Engineering Education also provides time series data on CS major enrollments for those CS programs housed
within engineering units, reporting growth of 136 percent among full-time CS majors and 128 percent among part-time CS majors between 2006 and 2015.2
Freshman Interest in Majoring in Computer Science
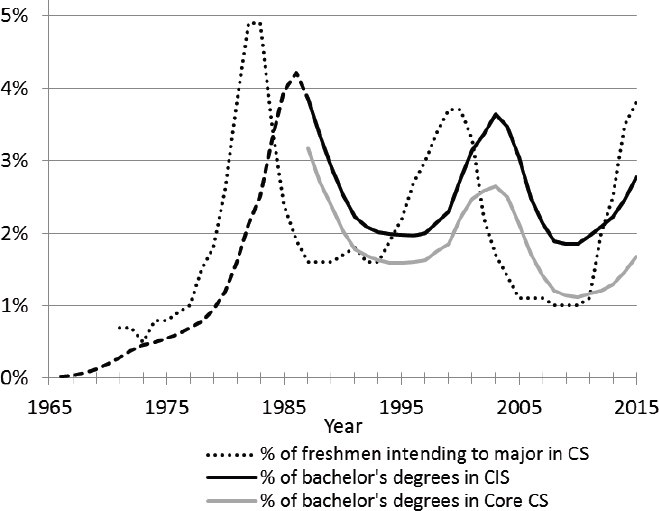
Another indicator of student demand for CS is student interest in majoring in computer science. The Freshman Survey of the Cooperative Institutional Research Program (CIRP, currently administered by the Higher Education Research Institute, or HERI) has polled the intended majors (among other data) of freshmen at a national sampling3 of institutions of higher education since 1975. This survey is administered to freshmen “during registration, freshman orientation, or the first few weeks of classes”; the results for fall 2016 reflect the responses of 137,456 students at 184 colleges and universities, weighted to reflect profiles of all new full-time students at 4-year colleges and universities nationwide (Eagan et al., 2016). Their results on the fraction of students intending to major in CS over time are plotted in Figure 3.2.
The results of this survey of student intent to major in CS display peaks and valleys quite similar to those seen in the Integrated Postsecondary Education Data System (IPEDS) degree completions data, but with peaks offset by 3 to 5 years, roughly the delay expected to correspond to completion of a bachelor’s degree, suggesting that, qualitatively, the HERI data have been a good leading indicator of CS degrees in the pipeline overall. Given that interest in CS as a major has increased steeply from 2011 to 2015, the data suggest that in 2015 CS degree production as a fraction of all degrees had just begun to increase sharply, and will continue to increase through at least the spring of 2020 in the absence of any unforeseen disruption or widespread actions taken by institutions to limit the number of majors.
HYBRID MODELS OF COMPUTER SCIENCE MAJORS
While the preceding section provides evidence that enrollments in some CS degree programs is surging, other types of degrees with significant computational components are simultaneously emerging. In particular, much interest has been generated in pilot programs offering joint degrees (1) where the degree is based in some discipline X with a significant educational component in CS (referred to as X+CS); (2) where the degree is thought to be equally shared among two disciplines, one being CS; or (3) where the degree is based in CS but has significant substance and coursework based in some other discipline (referred to as CS+X). In this report, for simplicity, any such program will be referred to as X+CS. Box 3.1 highlights a case study of such a program.
___________________
2 See ASEE (2015).
3 This universe differs from that of the CRA Taulbee Survey. For more information on HERI’s sampling methodology, see Eagan et al. (2016).
There is currently no apparent way to track such a hybrid major in the national IPEDS completion statistics; presumably, institutions must classify them as either degrees in X or degrees in CS, or as dual majors. Computer science and X+CS majors are only part of the story of growth in undergraduate computing enrollments—that is, computing departments have both a thriving major and a thriving service component.
NON-MAJORS
The needs of undergraduate students with respect to computing vary widely. It can be useful to think about all students’ relationships to computing as being on a spectrum. At one end of the spectrum are those with an overall goal of deep study of computing theory and methods, rather than their specific application in any particular domain. At the other end of the spectrum are students for whom only general knowledge of computing, necessary for non-expert use of general-purpose computing tools, is required or expected. In the middle is a group that requires some level of in-depth knowledge and understanding of the particular aspects of computing that apply to their primary domain.
Each group has the potential to affect enrollment in and demand for courses in different ways. Because the distribution of students along this spectrum at any given institution is likely unique, both the demand for computing and potential strategies for meeting this demand are likely to affect departments in different ways and therefore should engender different responses from different institutions.
Students who are avoiding all computing courses except those required for their degree may have little impact past the introductory courses; by contrast those students pursuing majors with significant computational content (including minors in computing) will need depth and coherence in their course offerings that will put resource pressure on the units offering the courses. Between these extremes students interested in “some” computing courses will have an intermediate effect. In the subsequent sections course enrollment trends of both majors and non-majors are discussed.
COURSE ENROLLMENT
In the face of increasing CS bachelor’s degree production and major enrollment, in 2016 the CRA sent out a supplemental Enrollment Survey to “units” (programs, departments, divisions, schools, and colleges) in the Taulbee (CS Ph.D.-granting) and NDC (CS master’s and/or bachelor’s degree-granting) groups responsible for serving bachelor’s-level majors in computer science. This survey collected supplemental information about undergraduate major enrollments and course enrollments. The results were recently published by CRA in a report titled “Generation CS” (CRA, 2017a).
The CRA Enrollment Survey asked responders for the numbers of students (distinguished by majors and non-majors) in four categories of courses representing different points in computer science education: (1) an introductory course for non-majors, (2) an introductory course for majors, (3) a mid-level course, and (4) an upper-level course.4 Results were obtained for three years: 2005, 2010, and 2015.5 Overall, 134 of 190 doctoral-granting institutions surveyed responded, 45 of which reported course enrollment numbers (~24 percent response rate); 93 of the 715 non-doctoral institutions surveyed responded, 20 of which provided course enrollment numbers (~2.8 percent response rate). These are the best quantitative data available; nonetheless, they are not comprehensive, and, because responses were voluntary, they may reflect self-selection bias, and so should be in general interpreted with caution. Furthermore, given the data analyzed are from 2015, it is likely that current enrollment trends and institutional actions taken have evolved in the time that has since elapsed.
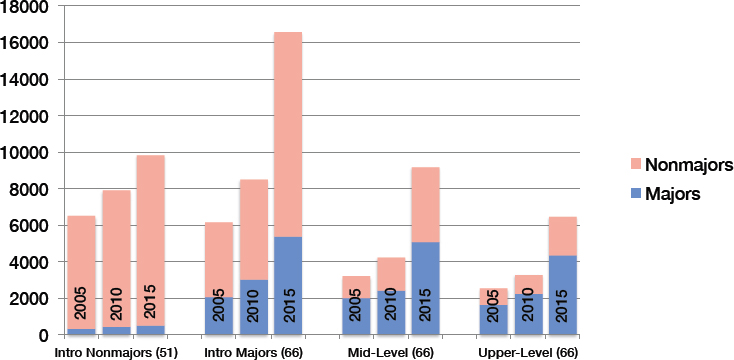
Figure 3.3 shows aggregate enrollments, separated by majors and non-majors, for these four course types for the Taulbee and NDC institutions that provided responses for all three years. The impact of non-majors is significant at these institutions: numbers of non-majors are taking courses beyond the introductory level. The data also show that the number of non-majors in courses intended for majors is increasing at a rate equal to or higher than that for majors. Between 2010 and 2015, introductory CS course enrollment increased by an average of 158 percent for majors and 169 percent for non-majors; enrollment in the mid-level course increased by 148 percent for majors and 248 percent for non-majors; and enrollment in the upper-level course increased by 135 percent for majors and 144 percent for non-majors. These data are broken down further in the following sections.
Course Enrollment by Majors at Doctoral and Non-Doctoral Institutions
Course enrollment of CS majors for 2005, 2010, and 2015 at doctoral and non-doctoral institutions responding to the CRA Enrollments Survey is illustrated in Figures 3.4 and 3.5. On average, course enrollments by majors have grown for all course levels for both categories of institution, with the largest growth experienced between 2010 and 2015.
___________________
4 Note that not all institutions reported a distinction between introductory courses for majors and non-majors.
5 The CRA Enrollment Survey surveyed only computer science units, rather than computer engineering or information science. “Non-majors” here refers to students not currently enrolled in computer science degree programs (though it is possible that they may later choose to do so, and become majors).
Course Enrollments by Non-Majors at Doctoral and Non-Doctoral Institutions
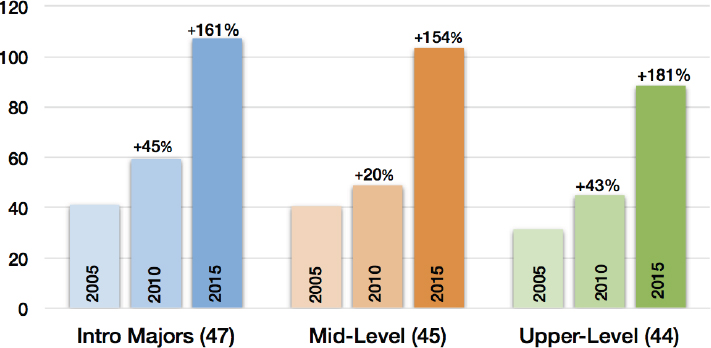
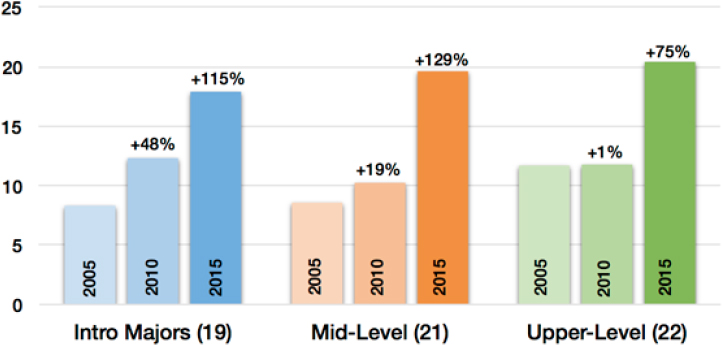
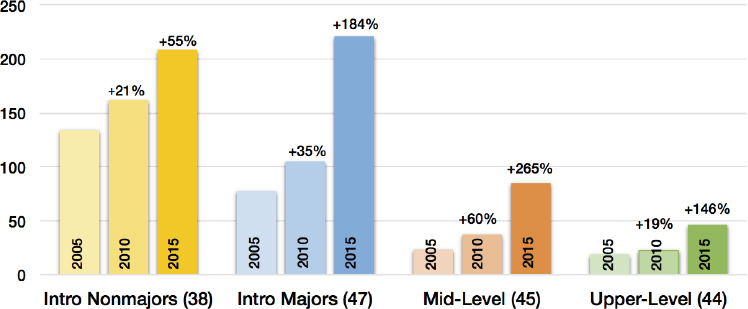
Responding doctoral institutions reported similar growth among non-majors at all course levels. The mean enrollment by non-majors in representative introductory classes not required for the major increased by an average of 55 percent from 2005 to 2015 (among the 38 respondents who reported a distinct course). Enrollment by non-majors in introductory classes required for the major increased by an average of 184 percent (among the 47 respondents). Mean enrollment by non-majors in mid-level courses grew by 265 percent (45 respondents), and the mean enrollment of non-majors in upper-level courses grew by 146 percent (44 respondents) as illustrated in Figures 3.6 and 3.7.
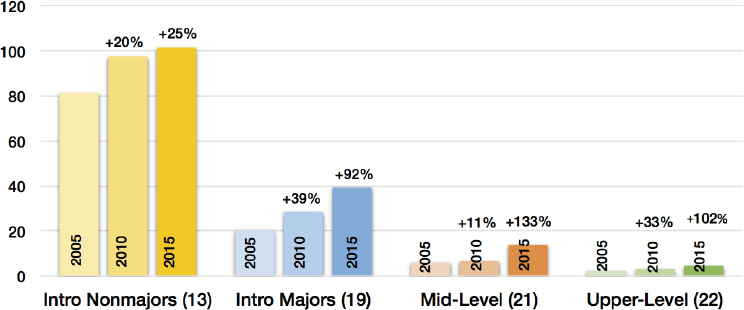
The NDC institutions also reported mean enrollment growth by non-majors in courses at all levels from 2005 to 2015, though not to the extent observed at doctoral-granting institutions: 25 percent increase in introductory courses not required by the major (13 respondents); 92 percent increase in introductory courses required by the major (19 respondents); 133 percent increase in mid-level courses (21 respondents); and 102 percent increase in upper-level courses (22 respondents). However, there is anecdotal evidence that the lack of resources is constraining growth at some non-doctoral institutions, and that interest in enrollment is actually higher than can be accommodated.
For example, at Union College, 207 students expressed interest in taking an introduction to programming course for the winter 2017 term, but only 80 seats were available; thus, 127 students were turned away. In winter 2013 (four years earlier), all 80 seats were also filled, but only 47 students were turned away. Furthermore, if Union College favors majors in filling courses, as most institutions do, the enrollment of non-majors would underestimate the demand for these courses among non-majors. Union College, which is an example of a small liberal arts college, has a “small class, high touch” pedagogy; thus, once capacity is reached, which occurred in 2013-2014, demand cannot be met unless faculty are hired and more sections are added.6 At large doctoral institutions with different pedagogies, on the other hand, computing departments can often meet increased demand by either (1) booking larger rooms to create larger sections or (2) adding more sections and hiring graduate students to teach them.
While these data suggest an “upward trend in the number of non-majors in mid-level and upper-level courses at non-doctoral institutions” (CRA, 2017a), it is important to note again the poor survey response rates, especially for the non-doctoral institutions (approximately 2.8 percent of all surveyed non-doctoral institutions provided course enrollments data, compared to approximately 24 percent for the doctoral institutions). In other words, the data in Figure 3.7 should be interpreted with particular caution.
Enrollments Across Other Institutions
Computing Alliance of Hispanic-Serving Institutions (CAHSI)
Additional evidence of recent program growth is available from the Computing Alliance of Hispanic-Serving Institutions (CAHSI) (Gates et al., 2011, 2016), a coalition of 19 Hispanic-serving not-for-profit institutions that aims “to increase the number of Hispanic students who pursue and complete” degrees in the computing disciplines (CAHSI, 2017a). In spring 2016 CAHSI evaluators convened a focus group with CAHSI leads of the charter institutions to collect data on the challenges and opportunities faced by CAHSI departments in a time of high enrollment growth in computer science departments nationally (Thiry and Hug, 2016a).
Of CAHSI’s eight “charter members,”7 five departments reported CS growth rates among majors ranging from 10 to 25 percent per year from 2013 to 2016, and two departments have experienced more modest increases.
___________________
6 Private communication with Valerie Barr.
7 CAHSI charter members include California State University, Dominguez Hills; Florida International University; New Mexico State University; Texas A&M University; University of Houston, Downtown; University of Puerto Rico, Mayaguez; University of Texas, El Paso; and Northeastern Illinois University. The first seven institutions are the founding CAHSI institutions. CAHSI today includes additional associate and adopting members.
CAHSI departments generally experienced enrollment trends similar to those seen nationwide—years of decline in degree production and enrollments followed by increases in recent years. However, the increase in degree production did not start until about 2013, compared to 2010 for institutions on average (as discussed in Chapter 2), suggesting either that growth at these institutions lags that of those with very high or high research activity, or that the growth is simply not concentrated at these institutions.
The number of students enrolling in CS and CE B.S. degree programs at the seven “founding”8 CAHSI departments from 2011 to 2016 is illustrated in Figure 3.8, including five CS departments and two computer engineering (CE) departments.
The focus group discussed increases in enrollment in courses and programs, with CAHSI leads attributing recent growth to an increase in CS/CE majors, an increase in students seeking minors in CS/CE, including both science, technology, engineering, and mathematics (STEM) and non-STEM majors, and an increase in the number of post-baccalaureates seeking to improve marketability through continuing studies at the undergraduate level. Some CAHSI institutions also reported an overflow of students from nearby universities that have enrollment caps.
They noted that departments have struggled with insufficient introductory courses/sections to meet demand and have had to increase the capacity of courses, or hire lecturers to cover courses. Almost all CAHSI departments did not have enough faculty to teach key courses, and they were unable to secure new faculty lines in their departments, jeopardizing their ability to manage enrollment growth. In addition, faculty noted that they are less able to advise and mentor graduate students. Faculty also have less time to develop curricula and carry out other essential duties, as noted by half of the focus group participants. Funding to support the additional teaching assistants (TAs) needed to provide student support was another stress point identified.
CAHSI department chairs report that institutional budget cycles and decision making also move too slowly to adapt to rapidly increasing enrollments, creating a weak link between departmental enrollments and actual resources allocated to those departments (Thiry and Hug, 2016a). Administrators and others with financial authority may also be doubtful that increasing enrollments will be sustained, making them less likely to grant extra resources to single departments.
CAHSI departments have implemented multiple strategies to address the challenges inherent in increased undergraduate enrollment, similar to those taken at other institutions (Thiry and Hug, 2016a). Some departments have added undergraduate TAs in addition to the typical graduate student TAs. Others have added more graduate teaching assistants or redirected TAs from upper-division to lower-division courses.
___________________
8 Data are available for all years only at the founding institutions, which include seven of the eight charter members.
With increasing enrollments CAHSI primary investigators reported that some students are entering the major with less preparation and prior experience in computing and advanced mathematics than students in previous cohorts. Departments have used multiple strategies to address student persistence and retention issues, especially related to students’ prior academic preparation. Several departments have changed their placement or advising practices. For instance, New Mexico State University has begun to use a placement exam to determine the most appropriate introductory course in which to place students. Some institutions, such as the University of Texas, El Paso, and California State University, Dominguez Hills, are using institutional data to examine student pathways through the major and to identify trouble spots that require interventions. Retention has always been an important focus of CAHSI departments, but increasing enrollments have placed more pressure on departments to meet the needs of students with even more varied academic backgrounds than in the past.
CUSTEMS Institutions
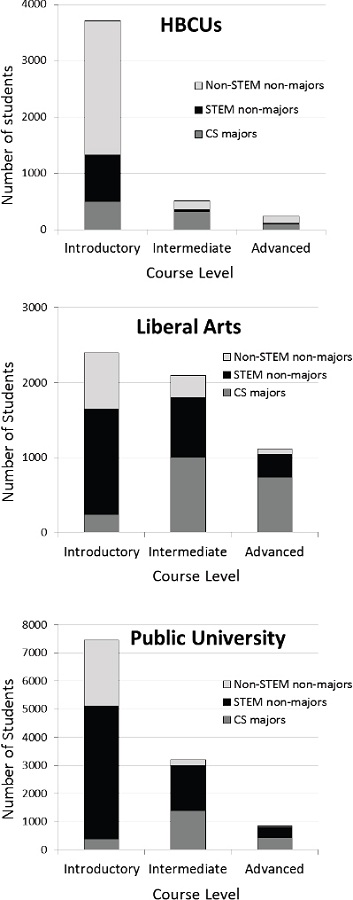
Another view of course enrollments is provided by the Consortium for Undergraduate STEM Success (CUSTEMS), a growing coalition of institutions for which course enrollment data have been collected on a voluntary basis beginning in 2008 in order to track retention of women and underrepresented minorities in STEM degree programs (CUSTEMS, 2017). The CUSTEMS data set includes course enrollment, grades, and admissions records for students at participating institutions. Upon commission from the committee, the CUSTEMS team provided information about enrollment in CS courses at eight historically black colleges and universities (HBCUs), five liberal arts colleges (LACs), and
one large public research university—all of the institutions for which the team had student-level data for the years of 2009 through 2014. The identities of the institutions remain confidential for privacy protection.9
CS course enrollment data for 2009-2014 at CUSTEMS institutions is presented in aggregate for all institutions in each category. While these plots provide a cumulative rather than time series examination of the enrollment of non-majors in CS courses, and consider only a small set of institutions, they do provide an average picture of the interest in computing classes from non-majors for a 4-year window during the recent growth in CS course enrollments.
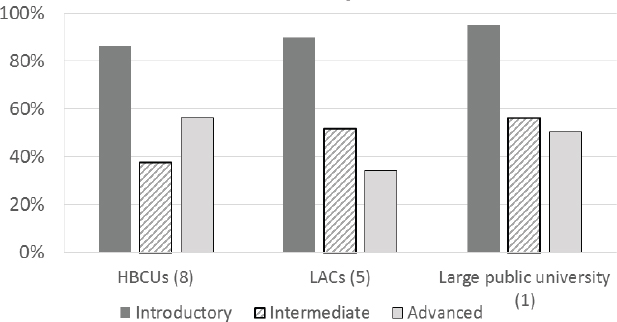
Figure 3.9 shows the total number of majors and non-majors enrolled in introductory, intermediate, and advanced CS courses for each category of institution. At the LACs in this sample the majority of non-majors are STEM non-majors (68.7 percent for introductory, 86.3 percent for intermediate, 93.7 percent for advanced CS); the same is true for the public university (68.4 percent for introductory, 93.4 percent for intermediate, 93.2 percent for advanced). At the HBCUs the percentage of STEM non-majors appears to be lower (35.6 percent for introductory, 69.9 percent for intermediate, 46.9 percent for advanced); however, this may be due to the fact that some of the HBCUs have a “tech” major that may not be counted within STEM. The percentages of non-majors (both STEM and non-STEM non-majors) in the three representative courses for the different groups of institutions are illustrated in Figure 3.10.
Minors
One important category of non-majors is minors. While the committee did not find quantitative data that illustrate current enrollment trends for computing minors, it is aware of several institutions where the number of minors has increased substantially in the recent past. For example, the number of computer science minors has more than tripled at the Colorado School of Mines in six short years (from 10 in 2011 to 37 in 2017). In addition, in the CRA Enrollment Survey, only 22 percent of the respondents stated that the number of minors at their institution has not changed in recent years and no one stated that the number of minors has decreased; the remaining 78 percent stated that the number of minors at their institution has increased (50 percent of respondents) or increased substantially (28 percent of respondents) (CRA, 2017a).
The increase in number of minors has an impact on institutions that goes beyond course enrollments; once a student becomes a minor, faculty and staff have responsibilities for that student in terms of advising and ensuring that courses are available. In the CRA Enrollment Survey, 76 percent of institutions that stated the number of minors has increased also stated that the enrollment
___________________
9 See paper appended (Appendix E).
growth is having a big impact on their unit, as did 96 percent of institutions that stated the number of minors has increased significantly (CRA, 2017a).
FINDING 2: Enrollments in CS courses and the number of CS majors have risen markedly since 2005 at many institutions, and there is no indication that enrollments will fall in the near term. Both CS majors and non-majors have contributed significantly to the recent growth in enrollment in undergraduate CS courses. Information about current program enrollment trends suggests that the boom in enrollments has only begun to register in the national data on CS degree production, and that CS bachelor’s degree completions will rise sharply for at least the next few years in the absence of institutional actions to limit or discourage participation in the major.
It is clear that enrollments in several computer science courses include a large increase in the number of non-majors taking computing courses. As previously noted these increases are occurring not just at the introductory course level but also at the mid and upper levels. The increased number of non-majors taking computer science courses is not fully explained by an increase in the number of minors. In fact, it turns out that many non-majors are required to take at least one introductory computer science course.
Students from different majors have taken introductory computing courses for some time, because programming is a skill that is increasingly required in many disciplines and sectors of the economy. In fact, as of 2016, programming jobs overall were growing 12 percent faster than the market average (Dishman, 2016), and some companies—for example, GE—have indicated that all new
employees will be required to know how to program. Accordingly, some non-computing disciplines now require an introductory programming course, creating a pipeline of non-majors into introductory computing courses.
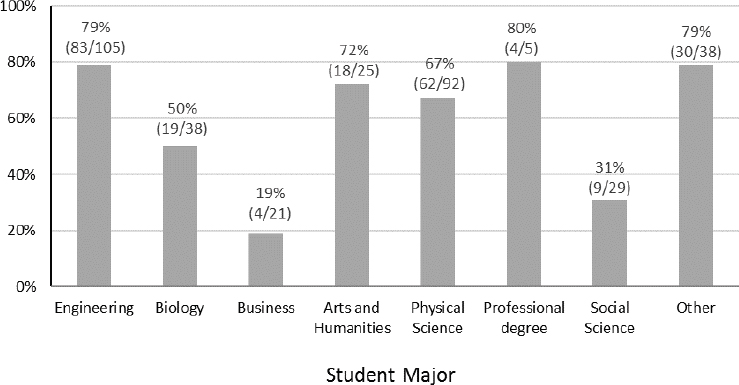
As part of the CRA Enrollments Survey, a questionnaire was administered to students in representative CS courses at some subset of the Taulbee and NDC institutions to get a better sense of their motivation for enrolling in the course. Of 9,721 students responding to the survey in total, 2,563 were in an introductory course; 405 of these were non-majors. In response to the question “Why did you enroll in an introductory CS course?” 65 percent responded that “it was required for my major/minor”; 54 percent that it was out of “curiosity/interest in computers”; 13 percent that “a teacher/mentor encouraged me”; and 6 percent that “my parents encouraged me.” The fraction of students who are neither CS majors nor CS minors who stated that an introductory CS course was required for their major is broken down by discipline in Figure 3.11 for 353 respondents.
To respond to the demand from non-majors, many institutions offer introductory computing courses specifically targeting non-majors, and the interest in these courses is increasing (as illustrated in Figure 3.3, earlier). In such a course, no programming experience is expected. In addition, some institutions (e.g., Harvey Mudd College and Colorado School of Mines) have worked to create a supportive environment for students with no prior coding experience by splitting their introductory programming course into two types of sections: those with prior
programming experience and those without. Their efforts aimed to “reduce the intimidation factor” for those without programming experience, by eliminating a “common ‘macho’ effect, where a few more experienced students intimidate others because they seem to know so much more” (Klawe, 2016). Such programs are particularly important for improving diversity in computing, as students from underrepresented groups are less likely to have prior exposure to the field.
Underlying drivers of the recent increases in interest in computing, both from majors and non-majors, are explored further in Chapter 4.
CHALLENGES WITH FACULTY HIRING
While the number of CS majors has increased dramatically since 2006 and enrollment of non-majors in CS courses has soared, the rate of faculty hiring has grown at a much slower pace, even when departments had open positions and were looking to hire.
One measure of the demand for faculty is the number of ads for open faculty positions. Craig Wills from Worcester Polytechnic Institute has analyzed tenured and tenure-track job postings for CS faculty (excluding dedicated teaching faculty) every year since 2014.10 His analyses use ads posted on CRA’s and ACM’s job listing sites, two frequently used and consulted sites for individuals seeking CS faculty positions, as well as mailing lists used frequently by 4-year colleges (e.g., the mailing list of ACM’s Special Interest Group on Computer Science Education). His reports examine hiring plans at research, master’s, and 4-year institutions and track the research areas departments seek to hire in. His November 2016 report analyzed job ads from 347 institutions seeking to fill hundreds of tenure-track faculty positions in computer science departments. Of these, 313 (90 percent) were from institutions in the United States. The number of positions open at an institution is not always clear from a job ad, as terms like “multiple” or “several” are often used. The study found that the number of open faculty positions in CS departments has increased significantly, and that many departments are looking for faculty in the same research area.
Relevant trends in the 2016 report include the following:
- Interpreting “multiple” as three faculty positions suggests that the 347 institutions posting ads planned to fill a total of 685 positions. Interpreting “multiple” as two faculty positions results in a total of 600 open faculty positions. Subtracting 10 percent of the positions to account for positions outside the United States suggests a conservative estimate of 540 open CS tenure-track faculty positions in 2016.
___________________
10 See Performance Evaluation of Distributed Systems Research Group and Worcester Polytechnic Institute; see Wills (2016).
- The number of openings corresponds to a 35 percent increase from the previous year and a 71 percent 2-year increase in the number of open positions.
- About 70 percent of the institutions listed specific research areas. The most frequently mentioned areas in 2016 were information security (21 percent) and data science (15 percent).
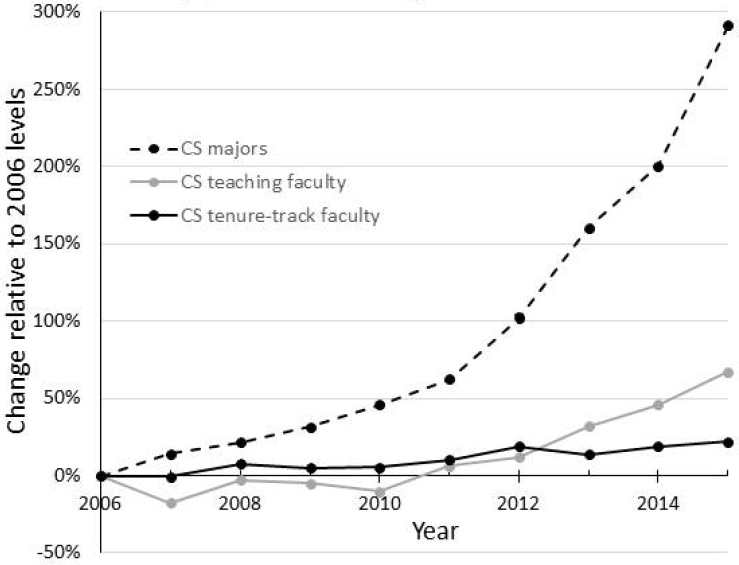
CRA’s Taulbee Survey collects data on student enrollment, degree production, employment of Ph.D. graduates, and faculty hiring (CRA, 2015). Figure 3.12 shows the relationship between CS majors and faculty growth since 2006 for the Ph.D.-granting institutions that responded to the 2016 Computing Research Association’s annual Taulbee Survey. Since faculty hiring needs and student growth trends differ by institution type and other characteristics, the trend does not necessarily reflect the situation across a broader spectrum of institutions.11
Figure 3.12 shows that the rate of growth of CS majors exceeds the rate of faculty growth by a large margin. Between 2006 and 2015 the number of computer science majors at these universities has increased by 291 percent (from an average of 192.4 to 753 students), while the growth in tenure-line faculty at those same institutions has grown by just 22 percent (from an average of 23 faculty to 28). Some fraction of the increased teaching needs is filled by teaching faculty, the number of which has grown by 67 percent over that time (from an average of approximately 4 to 6 teaching faculty/instructors).
Institutions use various strategies for growing their faculty size. Institutions typically are reluctant to add new faculty lines quickly due to the possibility that increasing student numbers reflect a temporary phenomenon. In addition, universities, particularly public institutions facing reductions in state funding, may not have had the resources or the authority to hire over this period.12 Furthermore, some institutions may be reluctant to allow rapid growth in one field, which often occurs at the expense of other academic disciplines.
CS is unique in that it produces a relatively small share of Ph.D.s compared to other disciplines, as illustrated in Figure 3.13.
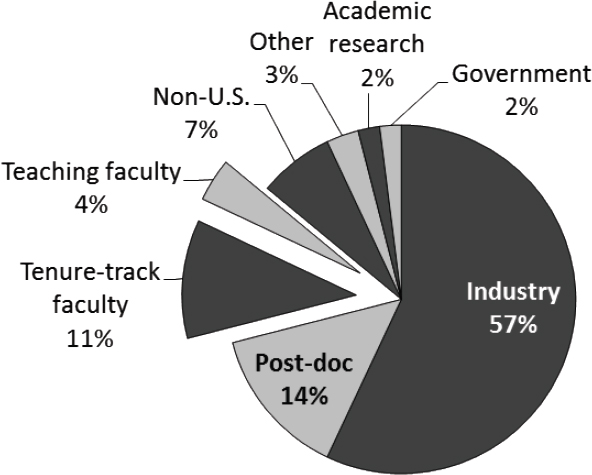
CRA’s Taulbee Survey collects data on the employment of new Ph.D.s and on actual hiring outcomes for Ph.D.-granting departments. According to the Taulbee Survey, during each of the last 3 years about 57 percent of new Ph.D.s accepted employment in industry.13 It is worth noting that in 2003, 63 percent of all new Ph.D.s accepted employment as a tenure-track faculty member in academia and only 29 percent of all new Ph.D.s accepted employment in industry. Figure 3.14 shows the employment choices made according to the 2016 Taulbee Survey, which are similar to those reported in the preceding 3 years.
___________________
11 Although the Association for Computing Machinery has undertaken a new survey of non-doctoral institutions, the response rate is not yet large enough to provide definitive results.
12 See Leonhardt (2017).
13 See Figure D6 in Zweben et al. (2017).
The following extrapolates this distribution of job choice to all Ph.D.s awarded and relates it to the number of open faculty positions (using Craig Wills’s analysis of job advertisements). According to IPEDs 1,903 CS Ph.D.s were awarded from U.S. not-for-profit institutions for 2015; 2,000 is a reasonable estimate for 2016, given the data from the 2016 Taulbee Survey. While some CS departments hire faculty with a Ph.D. in a related field (for example, computer engineering or information sciences) and some CS Ph.D.s take a faculty position in a non-CS department, it is expected that such cases are rare and infrequent compared to the total number of faculty hires.
Taulbee Survey data show that approximately 57 percent of all new Ph.D.s in North America take a position in industry, 11 percent take a tenure-track position (not including teaching positions), and 14 percent take a post-doctorate position (typically for 1 to 2 years). According to the Taulbee Survey, one-third of the new assistant professors hired at Ph.D.-granting institutions are hired immediately after receiving their Ph.D. An approximate estimate, based on the committee’s experience, of the number of post-doctorates choosing to become faculty
in any given year would be half the number of new Ph.D.s taking post-doctorate positions 2 years prior, corresponding to half of the Ph.D.s pursuing a post-doctorate position in 2014 accepting a tenure-track academic position in 2016.
Based on these percentages, we estimate that about 340 new Ph.D.s took an academic position in the United States in 2016: 11 percent of the about 2,000 new Ph.D.s in 2016 and 7 percent of the 1,884 Ph.D.s from 2014 who took a post-doctorate first.
Comparing this to the conservative estimate of 540 open computer science tenure-track positions in the United States suggests that only 63 percent of the open faculty positions could be filled from this pool. This estimation lacks common additional sources for faculty hires: individuals with a Ph.D. from outside the United States, individuals with a Ph.D. not in computer science, and individuals hired from industry or from another academic institution. At the same time, it ignores loss of CS faculty due to retirements, which are increasingly more common as the age distribution in CS departments gets closer to that of established departments.
The Taulbee Survey estimates that 4 percent of all new Ph.D.s take a teaching position (which corresponds to about 80 hires). Ph.D.-granting departments typi-
cally have separate ads for teaching positions also advertised on CRA and ACM job listing pages. As Wills’s study does not analyze job ads for teaching faculty, a similar comparison cannot be done. The Taulbee Survey asks departments how many of the open positions were filled.
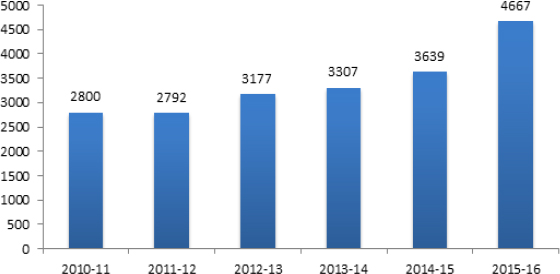
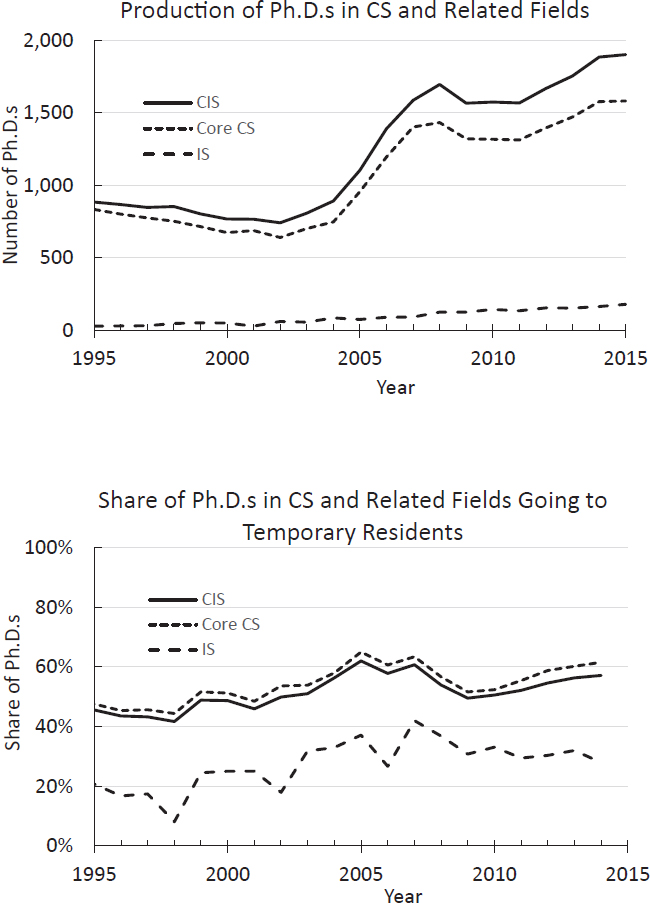
CS faculty hiring has become a significant challenge nationwide. The number of new CIS Ph.D.s has increased by 21 percent from 2009 (1,567 Ph.D.s) to 2015 (1,903 Ph.D.s), as illustrated in Figure 3.15, while CIS bachelor’s degree production has increased by 74 percent.14 During that time, the percentage of new Ph.D.s accepting jobs in industry has increased somewhat, from 45 to 57 percent according to the Taulbee Survey. Today, academia does not necessarily look attractive to new Ph.D.s: the funding situation is tight and uncertain; the funding expectation of a department may be perceived as unreasonably high; the class sizes are large and not every new hire is prepared to teach large classes and manage TAs effectively; and the balance between building a research program and meeting teaching obligations becomes more challenging. For the majority of new CS Ph.D.s the research environment in industry is currently more attractive. This also translates to challenges with hiring short-term or contract lecturers.
To navigate the difficult situation of increasing enrollments in the near term, departments will need resources other than faculty lines. They may include additional teaching positions, financial support that allows departments to scale classes and programs, and increased TA and staff support. New faculty hires are a valuable resource with a high replacement cost, and effective mentoring is crucial to their success; more emphasis on teaching and classroom management would help to make large classroom and teaching experiences positive.
As institutions assess the role of computer science and the interests and needs of students, the reality of CS faculty hiring challenges and the opportunities available to new CS Ph.D.s, especially in the areas departments want to hire in, are important to consider, as are the environment and workload for faculty in growing programs. Successful researchers may be hired away by institutions with more resources, but a supportive environment may help reduce the retention challenges departments face.
At the committee’s public workshop in August 2016, Dr. Greg Morrisett, dean of computing and information sciences at Cornell University, described the faculty hiring situation at his institution as follows:
We’re bringing in money from research, but we’re also teaching twice as many students as any other college in the university. . . . We cannot hire fast enough to meet the demand, and it’s very clear from these numbers that we should be double the size (Morrisett, 2016).
The growth in student numbers without a commensurate increase in faculty has also led some institutions to impose limits on students entering the computer
___________________
14 At not-for-profit institutions.
science major, just as in past cycles. Dr. Katherine Newman, former provost of the University of Massachusetts, reported the following situation:
The extraordinary demand for degrees in computer science, especially relative to our capacity to provide seats in the classroom, means that admission to these degree programs is hypercompetitive. UMass Amherst freshmen who pass through the eye of this needle have extensive preparation in STEM, have often completed a number of CS courses, and offer high school grade point averages in excess of 4.0. These kinds of opportunities for prior preparation are not universal and that poses a challenge to our ability to foster the kind of diversity among computer science students that we are committed to and the field (and the industry) needs.15
FINDING 3: With more than half of new CS Ph.D.s drawn to opportunities in industry, hiring and retaining CS faculty is currently an acute challenge that limits institutions’ abilities to respond to increasing CS enrollments.
ACTIONS TAKEN OR CONSIDERED IN THE FACE OF CURRENT ENROLLMENT GROWTH
Evidence from the CRA Enrollment Survey shows that many institutions have already taken actions in response to increasing enrollments in CS, and many others are beginning to consider what might be done (CRA, 2017a). The survey asked what actions computing units at the sampled institutions have considered or taken to deal with undergraduate enrollment increases. It should be reiterated that the two sample groups comprised institutions with and without CS Ph.D. programs, respectively, but are not a universal sampling. Furthermore, response was voluntary, so the data are subject to self-selection bias. Nonetheless, the results indicate that demand for CS at some institutions has evoked various reactions to relieve increasing pressure on program resources.
The survey listed the following possible restrictions, and asked respondents to indicate whether they had implemented or considered any of them:
- Tighten requirements for the major.
- Limit enrollments in high-demand classes.
- Advise weaker students to leave.
- Limit advanced courses to declared majors or minors.
- Limit access to advanced courses in another way.
This is not a comprehensive list of all possible solutions, or even all of the solutions currently being deployed; other possible practices include using desired
___________________
15 In correspondence with Katherine Newman, following Newman (2016).
choice of major as a factor in freshman admission decisions or capping the major via some other mechanism.
The responses are shown in Figures 3.16 and 3.17. Almost 50 percent of respondents reported limiting enrollments in high-demand courses at both Taulbee and NDC institutions. Nearly half (45.2 percent) of the responding doctoral institutions stated that they have restricted the enrollment in their upper-level courses to majors and minors only. Very few of the responding non-doctoral institutions
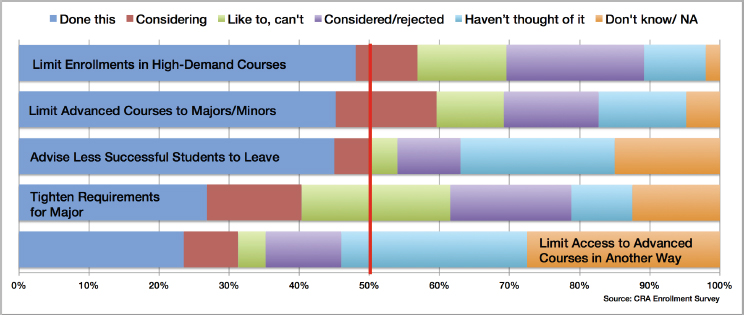
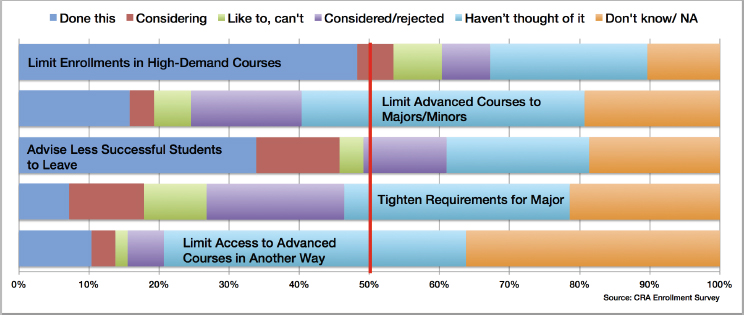
tightened their requirements for the major, while almost 30 percent of responding doctoral-granting institutions have done so.
While this survey illustrates actions that institutions are currently taking, it fails to illuminate the impacts that these actions may have on students. The potential impacts of these and other possible actions to respond to demand or mitigate the current strain on computing program resources are discussed in more detail in Chapter 6.
This page intentionally left blank.


