
4
Alcohol-Impaired Driving Interventions
INTRODUCTION
The committee’s conceptual framework for preventing alcohol-impaired driving crash fatalities was presented in Chapter 1 (see Figure 1-5). This framework illustrates the pathway from initially consuming alcohol to drinking to impairment and to driving while impaired, and shows how these actions can lead to motor vehicle crashes and the risk of serious injuries or death. Along the continuum between initial alcohol consumption and the occurrence of a fatal or serious motor vehicle crash, there are numerous opportunities for interventions that could reduce or eliminate alcohol-impaired driving incidents. This chapter examines several intervention opportunities for reducing alcohol-impaired driving, including changes in policies, laws, and enforcement; technological advances and vehicle features that could offer protections to drivers, occupants, and others; and programs or policies that could affect the sociocultural environment. These interventions offer promising approaches for improving the safety of drivers, passengers, and the public at large. A research needs section outlining gaps in the knowledge base for alcohol-impaired driving interventions is included at the end of the chapter.
POLICIES AND LAWS
A reexamination of, or modification to, existing policies and laws could provide opportunities for reducing the incidence of alcohol-impaired driving crashes. Interventions discussed in this section include
changes to blood alcohol concentration (BAC) laws, zero tolerance laws, graduated licensing laws, and child endangerment laws.
Blood Alcohol Concentration (BAC) Laws
Overview
Laws limiting permissible BAC among operators of motor vehicles are important interventions for reducing alcohol-impaired driving and related injuries and fatalities. Currently, in each state in the United States, drivers 21 years of age and older are prohibited from driving with a BAC that exceeds 0.08%, which is the limit proscribed in state per se laws for alcohol-impaired drivers (APIS, 2016).1 In December 2018, however, Utah will be the first state to lower its BAC per se law to 0.05%. Commercial drivers cannot exceed a BAC of 0.04%,2 and drivers under the age of 21 are restricted to a BAC varying from 0.00% to 0.02% (Fell et al., 2016; so-called zero tolerance laws, discussed later in this chapter), depending on the state where they are licensed to drive. Any individual, regardless of age or type of license, who drives with a BAC in excess of that proscribed by state law can be subject to punishments, including fines, license revocation, vehicle impoundment or restrictions, mandatory treatment, or arrest.
The following section provides information about how BAC affects the human body and an overview of the history and context of BAC laws in the United States and internationally. The section also reviews relevant scientific evidence, including laboratory and epidemiological studies of crash risk at measured BAC levels of less than 0.08%, to determine the point at which alcohol impairment occurs. Potential barriers to adopting laws lowering BAC limits and information on overcoming those barriers are also discussed. Based on its review of the evidence on the effectiveness of 0.05% BAC laws, the committee ends the section with a recommendation to state governments to lower the BAC limit set by state laws from 0.08% to 0.05%. Based on recent literature reviews and estimates by the committee and others, adoption of 0.05% per se laws nationally could save more than 1,500 lives annually (Fell and Scherer, 2017).
___________________
1 A per se law means that the act in question is illegal and a crime.
2 For more information, see Federal Motor Carrier Safety Administration: BAC Standards. https://www.fmcsa.dot.gov/registration/commercial-drivers-license/states (accessed December 6, 2017).
Background
Blood alcohol (i.e., ethanol) concentration is based on the number of grams of alcohol per every 100 milliliters (1 deciliter) of blood, and it is commonly used to quantify an individual’s level of alcohol impairment or intoxication for medical or legal purposes. When an individual consumes alcohol, up to 20 percent of the alcohol is absorbed into the bloodstream from the stomach, while 80 percent or more is absorbed from the small intestine (Levine, 2006). Once alcohol is absorbed, an individual’s BAC can be measured in blood, urine, saliva, breath, perspiration, and vitreous humor, or tissues of the liver and spleen. BAC testing usually takes place at a hospital or, if a driver has been fatally injured, during an autopsy. In some cases, such as during a crash investigation or after a driver fatality, an individual’s BAC will be estimated using back (or retrograde) extrapolation, which uses a driver’s physical characteristics (sex, weight, height); absorption rate, amount, and location of alcohol in bodily tissues; and the rate of elimination to help determine an individual’s BAC when he or she was driving. Back extrapolation provides an estimate of BAC, but it is not as accurate as direct measurement from biological samples since the actual conditions under which alcohol was consumed, such as the number of drinks and time span, cannot be accounted for (Kelly and Mozayani, 2012).
After consuming alcohol, the human body undergoes multiple changes that can affect an individual’s perception and performance. Such changes include a loss of inhibition or judgment and a decrease in self-awareness, emotional stability, and coordination (Kelly and Mozayani, 2012). These deficits become more evident as the amount of alcohol ingested increases and, as a result, an individual’s ability to operate a motor vehicle safely can be negatively affected (see Chapter 1 for more details on alcohol impairment). As shown in Table 4-1, each increase in BAC is accompanied by physiological effects and inherent predictable effects on an individual’s driving capability.
Alcohol tolerance decreases the sedative effects of alcohol, making the drinker feel more alert and less intoxicated (Roehrs and Roth, n.d.; Williams and Salamy, 1972); however, tolerance has been shown to have no effect on cognitive accuracy (Schweizer and Vogel-Sprott, 2008), inhibition (Fillmore et al., 2005), executive functions (Cromer et al., 2010), short-term memory (Cromer et al., 2010), or motor impairment (García Moreno et al., 2004). In addition, the effects of alcohol tolerance can cause drinkers to underestimate the dangers of driving with a high BAC, making them think that they are not as impaired as they actually are (Amlung et al., 2014; Lapham, 2010). Similarly, mixing caffeine with alcohol has been shown to decrease awareness of impairment without decreasing the actual level of impairment (Lalanne et al., 2017; Weldy, 2010), potentially keeping a person awake longer and giving them the opportunity to drink
TABLE 4-1 Blood Alcohol Concentration (BAC) Levels and Physiological Effects, Effects on Driving
| Blood Alcohol Concentration | Typical Physiological Effects | Typical Effects on Driving |
|---|---|---|
| 0.02% |
|
|
| 0.05% |
|
|
| 0.08% |
|
|
| 0.10% |
|
|
| 0.15% |
|
|
SOURCE: Adapted from NHTSA, n.d.-a.
more alcohol and/or drive (De Sanctis et al., 2017). Typically, an alcoholic drink is defined on the basis of ethanol content in a beverage. In the United States, the standard serving size for an alcoholic drink is defined as 14 grams of ethanol or 0.6 ounces of ethanol, which is equivalent to
- 12 ounces of beer (5 percent alcohol by volume [ABV]),
- 8 ounces of malt liquor (7 percent ABV),
- 5 ounces of wine (12 percent ABV), or
- 1.5 ounces or a “shot” of 80-proof (40 percent ABV) distilled spirits, such as gin, rum, vodka, or whiskey (NIAAA, 2017).
Chapter 2 provides more information on the variety of alcoholic products available on the market.
After consuming an alcoholic beverage, the absorption and elimination rates of the ethanol will determine the peak BAC. Consuming alcohol while fasting will result in a more rapid absorption of alcohol from gastric elimination, while alcohol consumed with a liquid or solid meal or while the stomach is filled will be absorbed into the body more slowly. Time to peak BAC also varies according to how much alcohol is consumed. It takes vodka (a distilled spirit) and tonic 36 minutes (±10 minutes) to reach peak BAC, wine takes 54 minutes (±14 minutes), and beer takes 62 minutes (±10 minutes) (Mitchell et al., 2014). Time to peak BAC is especially important when considering factors affecting alcohol-impaired driving since peak BAC can be reached well after a person has consumed their last alcoholic beverage but within a period of time when they may be driving a vehicle.
After ingesting alcohol, the rate of elimination from the body varies depending on the amount of alcohol and the circumstances in which it was consumed, as well as factors such as sex and weight (Wall et al., 2016) (see Figure 4-1). Approximately 90 percent of alcohol in the body is metabolized by the liver. The remaining alcohol is excreted via urine, breath, and perspiration (NHTSA, 2013a). After consuming equivalent doses of alcohol, women reach higher peak BAC levels than men (Mumenthaler et al., 1999); however, alcohol elimination per hour tends to be slightly faster among women (0.018 g/dL) than men (0.015 g/dL) (Levine, 2006; Mishra et al., 1989; NIAAA, 1999; Thomasson, 2000). One possible explanation for this disparity is that women typically have higher liver volume per unit body mass (Kwo et al., 1998; Li et al., 1998), enabling women to metabolize alcohol faster than men (Levitt et al., 1997).
Because of the relationship between BAC and impairment, law enforcement officials have used BAC measurements to estimate whether a driver’s alcohol consumption has impaired his or her capacity to drive. Of the many ways to determine an individual’s BAC, the most convenient and noninvasive—and therefore the easiest for law enforcement officials—is with a breath-testing device. The amount of alcohol (ethanol) in an individual’s breath is proportional to that in the blood; a blood alcohol reading of 0.100 g/100 mL in blood is roughly equivalent to 0.100 g/210 L in a deep-lung breath (Borkenstein et al., 1974). Police officers administer
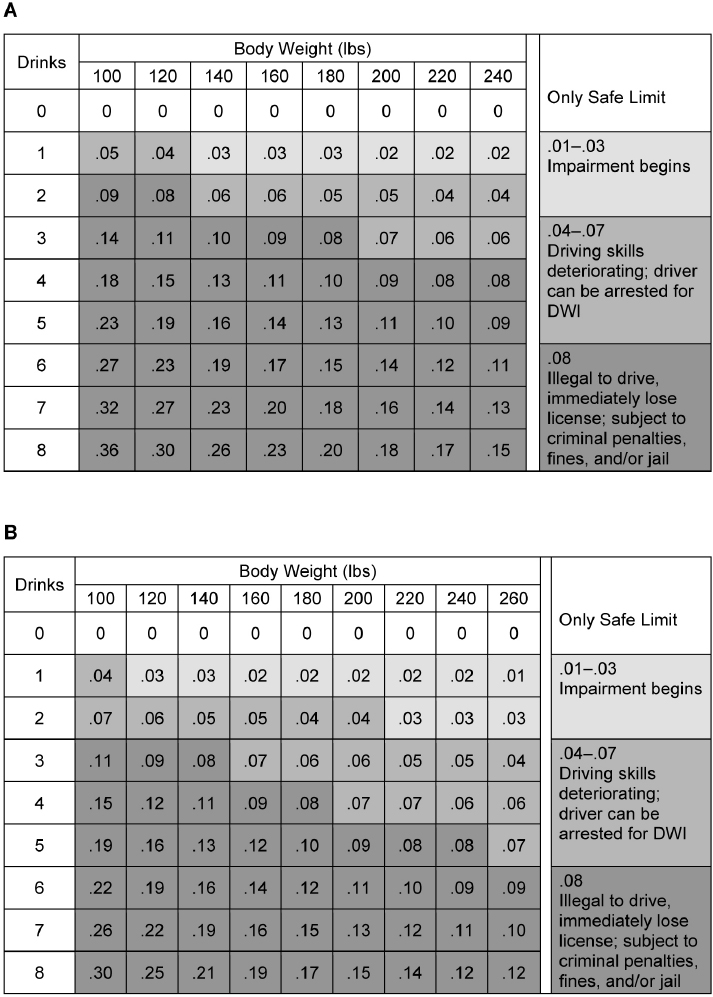
SOURCE: Moore and Pierce, 2016.
standardized field sobriety tests or a preliminary breath test using a portable device to help determine if an individual has been driving under the influence of alcohol. If warranted, additional breath tests or testing of blood samples may be conducted at a police station or a hospital by a trained professional; the results of these tests could be admissible in a court of law (Moore and Pierce, 2016). Studies have shown that urinary ethyl glucuronide (EtG) and ethyl sulfate (EtS) biomarkers can detect recent consumption of alcohol in urine samples from 24 hours and up to 5 days after ingestion, depending on the amount of alcohol consumed (Høiseth et al., 2008, 2010; Schmitt et al., 1995; Wurst et al., 2006); however, measurements of EtG or EtS biomarkers would be unlikely to be admissible in court. Securing court-admissible test results that meet the legal requirements to be used as admissible evidence in a courtroom can sometimes be challenging (see Chapter 5).
U.S. Laws Regarding BAC
A per se law means that the act in question is illegal and a crime; with regard to impaired driving, if a driver’s BAC exceeds the limit set by state law no further proof of impairment is required, regardless of other evidence of sobriety (APIS, 2016). These laws make it easier to prosecute offenders in court if these laws are violated (LII, n.d.). In the United States, the vast majority of BAC laws fall under the jurisdiction of state courts, although an existing federal BAC per se law prohibits driving at a BAC of ≥0.08% on federal land—including, for example, military bases, national parks or forests, and court houses—and some localities have enacted local traffic codes that regulate BAC limits. Administrative license suspension (ALS) and administrative license revocation (ALR) laws authorize law enforcement officials to confiscate or revoke a driver’s license from any driver who refuses or is unable to pass a sobriety test. The suspensions or revocation occur at the time of the failed test or refusal; subsequent fines or sanctions, such as mandatory educational programs or assessment/treatment, may be levied against the offender (Chamberlain and Solomon, 2002). This is consistent with the behavioral psychology theory of deterrence, which states that laws are most effective when consequences to breaking them are delivered with certainty and celerity (Nagin, 2013). ALS/ALR laws have proven to be effective for both general and specific deterrence effects, and the laws reduce alcohol-impaired driving crashes and convictions. To date, 41 states and the District of Columbia have enacted ALS/ALR laws, which are discussed in greater detail in Chapter 5.
Rogers (1997) examined recidivism and alcohol-related crashes among driving-while-impaired (DWI) offenders in California between
1989 and 1991. This time period included two legal changes related to alcohol-impaired driving. The BAC per se law was reduced to 0.08% on January 1, 1990, and administrative per se (APS) pre-conviction license suspension on arrested DWI offenders was imposed on July 1, 1990. The probability of alcohol-related crash risk as well as the probability of DWI conviction 1 year subsequent to original arrest decreased among both first and repeat DWI offenders from 1989 (pre-law changes) to 1991 (post-law changes). While the contribution of lowered BAC versus the contribution of license suspension cannot be separated in the study design, in totality these results indicated that lowering BAC in conjunction with administrative and other sanctions is an effective deterrent among high-risk drivers.
The first state law penalizing drivers for driving while “under the influence of alcohol” was passed in New York State in 1920; however, prosecution of alcohol-impaired drivers was limited because law enforcement officers used behavioral observations alone to determine impairment, resulting in convictions that could be easily challenged in court (Voas and Lacey, 1990). This began to change in the 1930s with the development of breath-testing devices that could measure an individual’s BAC and the advent of laws being passed that standardized what it meant to be “impaired” (Voas and Lacey, 1990). In 1941 New York State was the first to allow a BAC of ≥0.15% (tested by breath, blood, urine, or saliva) to stand as proof of intoxication in a court of law (King and Tipperman, 1975).
Despite these early developments, decades passed before alcohol-impaired driving began to be seen as an important public health issue (Fell and Voas, 2006). In the 1970s, the National Highway Traffic Safety Administration (NHTSA) was officially established and began advocating for stricter laws and penalties for alcohol-impaired driving; soon after, Mothers Against Drunk Driving (MADD) was founded in 1980 (Fell and Voas, 2006). The efforts of these two organizations influenced the passage of many laws, including zero tolerance laws, which prohibit underage drivers from operating a vehicle after consuming any alcohol (Fell and Voas, 2006). The minimum legal drinking age of 21, which prohibits those under 21 years of age from purchasing or publicly consuming alcohol, was adopted by all states by 1988 (APIS, n.d.). Despite these successes, enacting nationwide laws focused on lowering BAC levels has been challenging.
In 1992 NHTSA released a report recommending that Congress reduce the BAC limit to 0.08% for all drivers 21 years of age and older (Snyder, 1992). In response, Congress passed the Transportation Equity Act for the 21st Century, which included $500 million of incentive grants to states enacting and enforcing a 0.08% BAC per se law (DOT, 1998). The incentives were not effective. When the act was passed in 1998, 34 states and the District of Columbia had a BAC per se law of 0.10%, and 2 years
later only two additional states had adopted the change (APIS, 2016). In 2000 the Community Preventive Services Task Force recommended lowering the BAC limit set by state law to 0.08%, making it clear that it was an effective public health countermeasure (Community Preventive Services Task Force, 2000). That same year the Department of Transportation Appropriations Act was passed; it specified that states that failed to pass a 0.08% per se law by 2004 would begin losing federal highway construction funds.3 With the threat of losing funds looming, more states adopted lower BAC levels. By 2004, 45 states had passed BAC 0.08% per se laws, and only 5 states remained with a BAC per se law of 0.10% (APIS, 2016). Minnesota was the last state to lower its BAC per se law to 0.08% in August 2005 (APIS, 2016).
Should BAC Laws Be Lowered in the United States?
Today, although 0.08% BAC per se laws have become widely accepted in the United States, pressure is mounting in some states to further reduce the BAC allowed by law. In 1983 Utah became the first state in the nation to pass a criminal per se law lowering the BAC limit from 0.10% to 0.08% (Chamberlain and Solomon, 2002). Now Utah is set to lead the country again with new BAC legislation. On March 23, 2017, Utah became the first state to pass a BAC per se law of 0.05%, and the bill is set to take effect on December 30, 2018 (Utah State Legislature, 2017). Currently Washington State and Hawaii are also considering similar legislation (Hawaii State Legislature, 2017; Washington State Legislature, 2017).
Several prominent organizations, such as the U.S. National Transportation Safety Board and the World Health Organization (WHO), have recommended lowering the BAC limit to 0.05% (NTSB, 2013; Peden et al., 2004). Although current BAC limits allowed by different countries for drivers range from 0.0% (in Uruguay and in many Middle Eastern countries, including Afghanistan, Egypt, and Saudi Arabia) to 0.15% (in some West African countries, including Equatorial Guinea and Guinea-Bissau), most countries have a limit of 0.05% or 0.08% (WHO, 2014). As of 2015, 34 countries—representing 2.1 billion people—had laws limiting a driver’s BAC to 0.05% or less and to 0.0% to 0.02% for young or novice drivers. These BAC limits, considered to be best practice by WHO, are imposed by many industrialized, high-income countries such as Australia, France, Germany, and Italy. Approximately 57.7 percent of countries have a national BAC limit lower than 0.08% (WHO, 2014, 2015).
___________________
3 Department of Transportation and Related Agencies Appropriations Act of 2001, Public Law 106-346, 106th Cong. (October 23, 2000).
Laboratory Studies of Impairment
Researchers have used motor vehicle or motorcycle simulators in laboratory settings to measure alcohol’s effects at various BAC levels on factors such as response or reaction time, standard deviation of speed, peripheral detection, divided-attention task performance, and the ability to maintain a consistent position in a driving lane or standard deviation of lane position. Standard deviation of lane position measurements are considered one of the best indicators of impaired driving (Irwin et al., 2017). Such tests allow researchers to examine impairment and its potential effect on motor vehicle or motorcycle crashes by recreating real-world scenarios in controlled environments. Although some laboratory studies examine differences between alcohol-consuming subjects and controls, most studies examine the magnitude of impairment by measuring differences in performance measures before and after alcohol consumption in test subjects acting as their own control.
The committee reviewed a number of individual laboratory studies published since 2000 that examined alcohol consumption and subsequent driving. All of the reviewed studies were relatively small (8–40 subjects). The majority of studies used automobile simulators (Breitmeier et al., 2007; Calhoun et al., 2004; Cheng et al., 2010; Freydier et al., 2014; Friedman et al., 2011; Liu and Ho, 2010; Meskali et al., 2011; Mets et al., 2011; Parks et al., 2002; Ronen et al., 2010; Rupp et al., 2007; Tremblay et al., 2015; Verster et al., 2009); three studies were restricted to relatively inexperienced drivers and/or young adults (Freydier et al., 2014; Rudin-Brown et al., 2013; Verster et al., 2009). Examples of automobile simulator outcomes that were related to BAC levels of 0.05% or less included delayed reaction time, increased driving speed, more lane deviation, and greater inattention (Cheng et al., 2010; Freydier et al., 2014; Moskowitz et al., 2000; Parks et al., 2002). Overall the committee found consistent evidence for impairment at BAC levels of 0.05% on the basis of experimental motor vehicle driving simulator studies. Three laboratory studies used motorcycle simulator measurements for their analysis (Creaser et al., 2009; Filtness et al., 2013; Rudin-Brown et al., 2013). Outcomes adversely affected in motorcycle simulator studies at BAC levels of 0.05% or less included impaired static balance, increased standard deviation of driver position, and reduced hazard avoidance. Reaction times to visual or auditory stimuli were adversely affected in a stimuli-related study (Cheng et al., 2010).
A recent review and meta-analysis by Irwin et al. (2017) analyzed alcohol-impaired driving studies that were conducted with the use of driving simulators. After excluding studies that lacked precise performance measures, 48 different acute alcohol consumption trials—37 placebo-controlled trials and 11 trials with no control—were included in
the analysis. The studies estimated BAC levels measured at the start and finish of simulated driving tasks using breath-testing instruments. Meta-analysis results showed that acute alcohol consumption, as indicated by BAC levels ranging from 0.023% to 0.10%, significantly increased standard deviation of lane position and standard deviation of speed.
A report by NHTSA reviewed 112 studies published prior to 2000 that examined the effect of alcohol consumption on driving-related skills (Moskowitz and Fiorentino, 2000). The reviewed studies assessed the effect of alcohol consumption by measuring a range of BAC levels and performance on tasks in 13 categories of driving-related behaviors. Based on the studies reviewed, Moskowitz and Fiorentino (2000) concluded that, at a BAC of 0.05%, experimental studies reported significant impairment across a range of simulator outcomes related to vision, vigilance and drowsiness, psychomotor skills, attention, and information processing. Specifically, BAC levels in 27 percent of studies reported significant impairment by 0.039%, 47 percent of the studies by 0.049%, and 92 percent by 0.079%.
Laboratory studies allow for an assessment of the effects of various BAC levels on driving-related tasks in a controlled setting. To learn how these effects translate into real-world settings, however, reviewing the findings of epidemiological studies is imperative.
Epidemiological Studies of Crash Risk by BAC
Despite state laws mandating a limit of 0.08% BAC in the United States, evidence shows that a substantial proportion of alcohol-related crashes and fatalities occur when drivers have BAC levels below 0.08%. In 2015 there were 10,265 alcohol-impaired driving fatalities (BAC ≥0.08) in the United States and 1,808 fatalities involved a driver with a BAC between 0.01% and 0.07% (NHTSA, 2015). Because the presence of alcohol does not mean that crashes and related fatalities are necessarily attributable to alcohol consumption, in addition to reviewing the evidence from simulator studies (above), the committee also reviewed epidemiological studies that examined the risks of fatal crashes involving driver BACs below 0.08%. The best epidemiological evidence of the relationships between driver BAC levels and the risk of a crash are case-control studies in which BAC levels in drivers involved in crashes (cases) are compared with BAC levels in drivers not involved in crashes (controls). Case-control studies match controls with cases using drivers from the same geographic areas and ideally during the same day of the week and time of day. Some studies also obtain controls from cars traveling on the same roadways in the same direction in which case fatalities occurred. Studies conducted in the United States and abroad have consistently found an
increased risk of fatal crashes among drivers with BAC levels from 0.05% to 0.079% compared to having a BAC of zero (no alcohol), both overall and across a range of gender and age groups. In fact, crash risk begins to increase below 0.05%, but this chapter focuses on this range because it is a prevalent policy-related threshold in other parts of the developed world. The analyses below present a range of expected reductions in lives saved or lost at differing BAC levels owing to variations in types of implementation (i.e., sanctions, enforcement, publicity) and research methodologies.
Borkenstein et al. (1974) conducted one of the earliest case-control studies of the relationship between alcohol use and alcohol-related crashes. Crash data collected between May 1, 1959, and April 30, 1962, by the Grand Rapids (Michigan) Police Department formed the basis for the identification of control subjects who were matched to drivers involved in crashes by their proximity to the same date, time, and location of the crash. Researchers conducted four interviews with non-crash drivers at 2,000 former crash sites between July 1962 and 1963. They found that drivers with BAC levels in excess of 0.04% had an increased rate of crashes while drivers with BAC levels over 0.08% were significantly more likely to have single-vehicle crashes and crashes that were more severe and costly than those involving sober drivers. Drivers with BAC levels between 0.04% and 0.08% had a positive, steadily increasing risk of being involved in a crash.
An update to the Borkenstein et al. (1974) study was conducted by Blomberg et al. (2005). Similar in design to the study by Borkenstein et al., researchers interviewed and collected breath tests from a sample of crash and non-crash drivers from crashes of all severities that occurred in Long Beach, California, and Fort Lauderdale, Florida, during a 12-month period between June 1997 and September 1999. The final analyses of interview data collected from 4,919 crash-involved drivers (2,422 from Long Beach, 2,497 from Fort Lauderdale) and 10,066 control non-crash drivers matched to crash cases by location, day of the week, and time of day 1 week after the initial crash, found relative risks (RRs) began to increase in drivers whose BAC levels were in the range 0.05–0.06% (RR = 1.38), and those risks continued to climb with increasing BAC. The adjusted RR for drivers with a BAC of 0.06% was 1.63, 0.07% was 2.09, and 0.08% was 2.69.
Data from Blomberg et al. (2005) were reanalyzed by Peck et al. (2008) to evaluate the relationship between BAC, a driver’s age, and the risk of being in a crash. Data were evaluated according to specific age ranges—under 21, 21–24, 25–54, and 55 and older—to determine how age and a driver’s BAC affect the risk of a crash. While BAC alone was highly correlated with crash risk, Peck at al. (2008) also found that drivers under the age of 21 years had an elevated risk of being involved in a crash at all BAC levels greater than 0.0%, and those risks continued to rise with each
increase in BAC (e.g., a BAC of 0.05% yielded a RR of 2.75; 0.08% BAC, RR = 7.4; and 0.10% BAC, RR = 16.0). Drivers in this age group with BAC levels of 0.08% were 27.4 times more likely to be involved in a crash when compared to same-age drivers who had not been drinking (0.0% BAC). Elevated RRs were observed for drivers from all four age groups when BAC levels reached 0.05% or higher. Among drivers 21 and over the risk of being in a crash started increasing at a BAC of 0.05% (RR = 1.07), and those risks continued to increase at 0.08% (RR = 1.64) and 0.10% (RR = 2.43) but on a less steep curve than for drivers under 21.
A study of BAC and fatal crash risk was conducted by Zador (1991) and reanalyzed by Zador et al. (2000). In the original study, Zador (1991) used data from the Fatality Analysis Reporting System (FARS) collected in 1985 and 1986 and exposure data from the second National Roadside Breath-Testing Survey to analyze single-vehicle fatal crashes using drivers’ age, sex, and BAC. Researchers found that fatal crash risk increased with increasing BAC for all drivers, regardless of sex and age group (16–20, 21–24, and 25 and older). Risk of crash doubled with each 0.02% increase in a driver’s BAC above 0.0%. Drivers with BAC levels of 0.05–0.09%, regardless of age group, were nine times more likely to have a fatal crash than drivers who had a BAC of 0.0%. Male and female drivers with BAC levels between 0.05% and 0.09% had an increased risk of being killed in a single-car crash compared to comparable drivers with BAC levels ≤0.01% (RRs ranged from 9 to 54). When compared to drivers 25 years of age and older with similar BAC levels, female drivers between 16 and 21 years of age with BAC levels between 0.05% and 0.09% were at the greatest risk of dying in a single-vehicle crash (RR = 21.3); males in the same age range and with comparable BAC levels had a lower but still elevated risk (RR = 12.3).
Zador et al. (2000) updated the 1991 study using FARS data from 1996 and exposure data from the 1996 National Roadside Survey of Drivers to evaluate BAC levels in drivers of single-vehicle and two-vehicle fatal crashes. Age (16–20, 21–34, and 35 and older) and sex were evaluated in relation to BAC levels in drivers involved in crashes with fatalities. For both males and females, the fatal-crash risk was inversely proportional to the driver’s age, and increasing BAC levels consistently elevated the fatal crash risk. Contrary to the findings reported in Zador (1991), young males between 16 and 20 years of age with BAC levels between 0.05% and 0.079% had a higher likelihood of being involved in a single-car or two-car fatal crash (RR = 17.32 versus 9.94, respectively) than comparable females (RR = 7.04 versus 6.53). Among drivers 16 to 20 years of age, males had a consistently higher fatal-crash rate than females, regardless of BAC; however, these differences were not evident for drivers 21 years of age or older. Drivers between 21 and 34 years of age with BAC levels between
0.05% and 0.079% had a higher risk of being involved in a fatal crash than drivers 35 years of age and older. This finding was consistent for all males and females with BAC levels over 0.02%.
In 2012, Voas et al. updated the Zador et al. (2000) analysis by comparing the 1996 data to 2006 and 2007 FARS crash data (cases; n = 6,863); control blood-alcohol data were obtained from 2007 U.S. National Roadside Survey results (n = 6,823). Crash data—age, gender, type of crash (single-vehicle fatal crash versus all fatal vehicle crashes in which the driver survived), and BAC—were used to compare changes in RR between 1996 and 2007. The percentage of alcohol-impaired drivers involved in fatal crashes remained largely unchanged between 1996 and 2007 (~22 percent); assessment of gender differences indicated that underage women were increasingly at risk of alcohol-impaired driving between the two study periods, yet underage men were increasingly likely to crash even at BAC of 0.0%. Nevertheless, overall, the relative risk for being involved in a fatal crash increased steadily with increasing BAC. Among drivers 16 to 20 years of age, compared to BAC of 0.0% the relative risk of fatalities in single-vehicle crashes was 1.47, 3.84, and 12.18 at BAC levels of 0.001–0.019%, 0.02–0.049%, and 0.05–0.079%, respectively. Among all drivers, compared to BAC of 0.0%, relative risks were 1.33, 2.68, and 6.24 at BAC levels of 0.001–0.019%, 0.02–0.049%, and 0.05–0.079%, respectively. Above age 21, all age groups with a BAC of ≥0.02 were at a significantly increased risk of single-vehicle and multiple-vehicle crash fatalities. Taken together, these data indicate that BAC above 0.02%, and for underage drivers BAC above 0.001% is associated with increased crash risk in a dose-response fashion.
Lacey et al. (2016) conducted a case-control study in Virginia Beach, Virginia, that estimated how a driver’s use of alcohol, drugs, or a combination of the two contributed to crash risk. Biological samples were collected from more than 3,000 drivers from local crash scenes (cases) and 6,000 non-crash drivers (controls) matched 1 week later according to the time and location of the initial crash. Drivers were found to be 2.07 more likely to be involved in a crash if they had a BAC of 0.05% when compared to controls, and drivers who had a BAC of 0.08% were 3.93 times more likely to be involved in a crash.
More recently, Phillips and Brewer (2011) analyzed severity of crash risk by BAC among decedents in the FARS data from 1994 to 2008. The FARS codes injury severity from most to least severe as fatal injury, incapacitating injury, nonincapacitating injury, possible injury, and no injury. The ratio of serious versus nonserious driver injuries for each BAC was reported for all automobile crashes involving at least one fatality. There was a monotonic increase in the ratio of serious to nonserious injuries with increasing BAC in an involved driver. Even among those crashes with driver BAC of 0.01%, there were four times as many serious injuries
as nonserious, compared with three times as many serious as nonserious injuries when vehicle drivers had a BAC level of 0.0%. Inference is limited, however, given that to be in the FARS data, there had to be at least one fatality. Nevertheless, findings held true for the 14-year time period analyzed, for both single- and multiple-vehicle crashes, and after excluding the potentially confounding variables of inattention and fatigue, suggesting that BAC, even at low levels, increases not only the risk of being in a crash, but also the risk of serious injury for each crash that occurs.
With respect to BAC levels below 0.08% and the increased risk of a fatal crash, findings from U.S. studies are generally consistent with those from other developed countries. A case-control study conducted by Connor et al. (2004) in Auckland, New Zealand, evaluated the effect of alcohol consumption on vehicle crashes in which at least one occupant was seriously injured or killed. Researchers interviewed and collected breath or blood tests from 571 drivers involved in serious crashes (cases) and 588 representative drivers (controls). If those involved in the crash were unable to partake in the interview, their next of kin or a proxy was interviewed instead. After controlling for confounders, drivers with a BAC level of 0.03–0.05% were 10 times more likely to be involved in a fatal crash than drivers who did not drink. Furthermore, the researchers estimated from their models that 34 to 35 percent of fatal crashes could be eliminated if drivers with BAC levels of at least 0.03% could be prevented from driving.
Another international study by Krüger and Vollrath (2004) used data from the German Roadside Survey conducted from 1992 to 1994 (Krüger et al., 1995) and weighted those data according to a study of representative drivers to calculate the risk of alcohol-related crashes in Germany. For drivers with BAC levels between 0.05% and 0.079%, there was an increased risk of being in a crash (odds ratio [OR] = 3.6, 95 percent confidence interval [CI] 2.3–5.7).
A recent empirical nonrandomized study by Byrne et al. (2016) evaluated the deterrent effectiveness of countermeasures put in place in Ontario in 2009 and 2010 that included implementation of administrative sanctions for drivers with BAC levels between 0.05% and 0.08%. With the new administrative sanctions in place, alcohol-impaired drivers with BAC levels in this range were subject to immediate license suspensions and administrative fines, and repeat offenders could be required to attend alcohol educational classes or install an ignition interlock on their vehicle. To evaluate the effectiveness of these new sanctions, researchers analyzed data from the Ontario Ministry of Transportation’s Accident Data System and performed time series analyses. Between the time administrative sanctions were introduced and December 31, 2012, Byrne et al. estimated that the sanctions resulted in a 15 to 17 percent reduction in
all alcohol-related driving crashes and a 12 percent reduction in major injuries and fatalities caused by alcohol-related driving crashes.
Effect of Lowering Blood Alcohol Limits for Driving
Lowering blood alcohol limits for driving to 0.05% Although there may be increased risk of a crash at BACs above 0.05%, that does not necessarily mean that lowering the legal limit to 0.05% would reduce crashes or crash fatalities. Therefore, the committee also evaluated international studies that assessed whether or the degree to which reducing the BAC limit to 0.05% is effective in decreasing alcohol-related crashes. Overall, the majority of international evidence suggests that lowering the BAC limit to 0.05% reduces alcohol-related crashes and driving fatalities, and those effects are greatest among those groups at highest risk. An international review by Mann et al. (2001) analyzed the effect of introducing or lowering the BAC limit on traffic safety measures. A total of 27 studies conducted between 1973 and 2000 were reviewed and, of those, 13 specifically looked at countries that had reduced or introduced a BAC limit of 0.05% (Bartl and Esberger, 2000; Bernhoft and Behrensdorff, 2003; Brooks and Zaal, 1992; Desapriya and Iwase, 1996; Henstridge et al., 1997; Kloeden and McLean, 1994; McLean et al., 1995; Mercier-Guyon, 1998; Noordzij, 1977, 1994; Smith, 1986; Van Ooijen, 1977; Vingilis et al., 1988). The remainder of the studies reviewed focused on the effects of BAC levels lowered to limits other than 0.05%.
The 13 studies on the effects of introducing or reducing the BAC limit to 0.05% were epidemiological time series analyses and pre-post comparisons that examined the changes in Australia, Austria, Canada, Denmark, France, Japan, and the Netherlands. Mann and colleagues found that the studies reviewed varied in rigor and results. The pre-post comparison studies were subject to the most confounding factors, but even complex time series analyses could sometimes be influenced by confounding variables. Nevertheless, all areas that lowered the BAC limit to 0.05% or that introduced a new BAC limit of 0.05% saw reductions in alcohol-related crashes, injuries, or fatalities, although some of these effects were temporary. In South Australia decreasing the BAC limit from 0.08% to 0.05% led to a 14.1 percent reduction in the proportion of drivers with a positive BAC compared to 2 years prior (Vingilis et al., 1988). In Austria, the same reduction in the BAC limit resulted in a 0.6 percent decline in the proportion of injuries caused by alcohol-impaired driving crashes nationwide (Bartl and Esberger, 2000). The review suggests that the overall significant decreases in alcohol-impaired driving are caused by a general deterrence effect as opposed to a targeted effect on drivers with a BAC of 0.05–0.079% because reductions in crash fatalities have been observed across a range of
BAC levels, not just those from 0.05% to 0.079%. The jurisdictions that had the most success in reducing traffic crashes by lowering the BAC broadly publicized the new law (e.g., publicity and education) and conducted highly visible sobriety checkpoints, thereby increasing the perceived risk of being caught. Some of the reviewed studies found that the beneficial effects of the new law declined over time, which the authors posited may have been attributable to the public’s belief that, over time, the actual risk of apprehension was not as high as the perceived risk when the BAC limit was first lowered.
Albalate (2008) evaluated the effectiveness of lowering the BAC limit to 0.05% in eight European countries that changed their policies between 1991 and 2003 (Austria, Belgium, Denmark, France, Germany, Greece, Italy, and Spain), using a differences-in-differences estimation procedure in which the change in road traffic fatality rates in the country with the policy change was compared to the change in fatality rates of a control country that had not lowered its BAC. By using this approach the author was able to control for many possibly confounding variables, including socioeconomic factors such as unemployment and GDP growth rates, increasing use of motor vehicles in a country, the proportion of roads in the country that are highways and national roads, and the minimum legal drinking age. Albalate found that lowering the BAC limit to 0.05% was effective in reducing fatality rates by 4.3 percent and reducing fatality rates per kilometer driven by 6.1 percent. Among 20- to 40-year-olds, the BAC policy change reduced fatality rates by 10.5 percent, and among 40- to 50-year-olds, the BAC policy change led to an 8 percent reduction in fatality rates. No significant effect was found in females or in nonurban areas, although the authors suggested that this may be because the fatality rate among females was already low and other factors or road conditions may play a larger role in fatalities in rural areas. Among males the policy led to a 5.7 percent decrease in fatality rates and among urban males a 9.5 to 10.9 percent decrease. Lowering the BAC limit was only effective if paired with increased enforcement measures such as sobriety checkpoints. Positive effects of lowering the BAC limit were usually seen more than 2 years after the new policy went into effect.
Two recent studies evaluating the effect of lowering the BAC limit in Canada showed similar reductions in alcohol-related crashes and fatalities. Blais et al. (2015) studied the effectiveness of Canadian 0.05% administrative BAC laws by using data from the Traffic Injury Research Foundation and Statistics Canada to determine how newly instituted alcohol and driving measures may have affected alcohol-related crashes over a 24-year period. Blais and colleagues found that between 1987 and 2010, 0.05% administrative BAC laws were responsible for reducing the number of fatally injured drivers with BAC levels of 0.05% or higher by
4.1 percent (95 percent CI 0.8–7.5). A 3.5 percent reduction (95 percent CI 0.10–6.9) was also estimated in the number of fatally injured drivers with BAC levels exceeding 0.08%, and a 4.9 percent reduction (95 percent CI 1.35–8.51) was estimated in the number of fatally injured drivers with BAC levels exceeding 0.15%. Byrne et al. (2016) conducted a study in the province of Ontario to evaluate the deterrent effectiveness of new countermeasures, including lowering the BAC limit from 0.08% to 0.05%. The researchers found that the implementation of roadside suspensions for drivers with BAC levels between 0.05% and 0.08% resulted in a 17 percent decrease in injuries and fatalities related to alcohol-related crashes.
Recently, Fell and Scherer (2017) conducted a review and meta-analysis that included 36 empirical journal articles on international studies that analyzed the effects of lowering the BAC limit to 0.08% or lower. The authors calculated a pooled variance to standardize the changes observed in the different studies and determined an estimated effect size based on their results. They estimated that lowering the BAC limit from 0.08% to 0.05% in the United States would result in a decline in fatal alcohol-related crashes of 11.1 percent and save approximately 1,800 lives annually.
Lowering blood alcohol limits for driving to levels other than 0.05% (both lower and higher) The committee also reviewed evidence of the effect of laws lowering permissible BAC limits for driving to levels other than 0.05%. These studies find evidence of protective effects of lowering BAC limits to values higher and lower than 0.05%, which is important corroborating evidence that demonstrates consistency with studies where BAC limits are lowered to 0.05% specifically. Several studies provide a global perspective on the different levels of restriction that have been adopted throughout the past few decades—such as the 1990 BAC limit decrease in Sweden from 0.05% to 0.02% (Norstrom, 1997) and the 2002 BAC limit decrease in Japan from 0.05% to 0.03% (Desapriya et al., 2007; Nagata et al., 2006), both of which were effective in reducing alcohol-related driving fatalities. The evidence also finds that lowering the BAC limit from 0.10% to 0.08% for drivers in the United States was an effective policy for reducing alcohol-impaired traffic fatalities—particularly among young drivers, the age group at the highest risk for alcohol-related driving fatalities (Dee, 2001; Wagenaar et al., 2007). The majority of evidence on the effectiveness of lowering the BAC limit to levels other than 0.05% is based on time series studies and other pre-post designs that do not have a control population or quasi-experimental estimator. Of those that do, a meta-analysis shows a reduction in traffic fatalities (Wagenaar et al., 2007), but two other studies show limited effects (Freeman, 2007; Tippetts et al., 2005). Almost all available time series studies are suggestive of benefits
to lowering the BAC limit (Andreuccetti et al., 2011; Apsler et al., 1999; Bernat et al., 2004; Blomberg, 1992; Dee, 2001; Foss et al., 2001; Freeman, 2007; Gorman et al., 2006; Nagata et al., 2008; Norstrom, 1997; Otero and Rau, 2017; Rogers, 1995; Tippetts et al., 2005; Voas et al., 2000, 2002; Wagenaar et al., 2007). There is also variation in the size and consistency of the effect, and these variations may be related to public knowledge of the laws and enforcement (Andreuccetti et al., 2011; Bernat et al., 2004; Nakahara et al., 2013; Schwartz and Davaran, 2013; Tippetts et al., 2005).
Summary of Evidence
The available evidence can be summarized as follows. In the United States, all states currently have per se regulations that it is criminal for adults to drive with a BAC over 0.08%; lower BAC cut-points are criminal for commercial drivers and underage drivers. Yet, alcohol impairs motor vehicle operation at BACs below 0.08%, with the preponderance of experimental driving simulator evidence suggesting that BAC levels above 0.02–0.03% are associated with impairment for most people (Irwin et al., 2017; Moskowitz and Fiorentino, 2000). With regard to crash risk, the preponderance of evidence indicates that risk of crash increases monotonically with alcohol consumption, especially for underage drivers, and for all drivers at BACs beginning around 0.03% (Blomberg et al., 2005; Peck et al., 2008; Voas et al., 2012; Zador, 1991; Zador et al., 2000). Thus, the committee concludes that alcohol consumption impairs motor vehicle safety at BACs above 0.03%, and increases crash risk monotonically at this level as well.
Due to this evidence, many countries around the world have decreased the BAC limit to drive to 0.05%. This allows for an assessment of the efficacy of lowering BAC to 0.05% on driving outcomes, acknowledging that generalization from other countries to the potential experience in the United States should be done with caution. Nevertheless, the preponderance of evidence indicates that lowering the BAC limit to 0.05% significantly and substantially reduces crash and fatality risk (Albalate, 2008; Blais et al., 2015; Byrne et al., 2016; Mann et al., 2001). Importantly, crash and fatality risks are reduced not only among those drivers at or around a BAC of 0.05% or in the range 0.05–0.079%, but also at all BAC levels. This is indicative of the general deterrent effect of lowering allowable BAC to drive, or of increased awareness of impaired driving across consumption levels. The impact of lower BAC laws is observable whether enforced through administrative or criminal sanctions, and seems enhanced when introduced alongside high-visibility enforcement, sobriety checkpoints, and publicity activities (Mann et al., 2001). For the United States, Fell and Scherer (2017) estimated an 11 percent decrease in fatal alcohol-related
crashes, or approximately 1,800 fewer fatalities, if the BAC limit was lowered to 0.05%.
Based on the magnitude of effect and consistency of the evidence, the committee concludes that reducing the BAC limit to 0.05% is an effective strategy for reducing alcohol-impaired driving fatalities. The committee recommends BAC per se laws at 0.05% rather than another cutoff as it is the standard in many countries throughout the world, including most western countries, and thus has a solid evidence base for effective reductions in impaired driving.
Recommendation 4-1: State governments should enact per se laws for alcohol-impaired driving at 0.05% blood alcohol concentration (BAC). The federal government should incentivize this change, and other stakeholders should assist in this process. The enactment of 0.05% per se laws should be accompanied by media campaigns and robust and visible enforcement efforts.
The effectiveness of lowering the per se laws from 0.08% to 0.05% will be supported by legislation that currently applies to 0.08% per se laws, including, but not limited to, use of sobriety checkpoints, administrative license revocation, and penalties for refusing preliminary breath tests or blood tests that are equal to or greater than penalties for alcohol-impaired driving offenses. This means that the same laws and sanctions that currently apply to 0.08% per se laws could remain in place but would be enforceable at the 0.05% BAC limit. Effectiveness will also be enhanced by efforts to publicize 0.05% per se laws through mass media campaigns, by strong and sustained enforcement efforts, and through the implementation and enforcement of laws and policies to prevent illegal alcohol sales to underage or intoxicated persons (e.g., underage compliance checks with alcohol licensees, dram shop liability laws). Incentives from the federal government could include incentive grants to states or, if necessary, the threat of losing highway funding, as was done with the passage of the 0.08% per se laws. Countries with a 0.05% BAC limit implement the law through either administrative sanctions (a traffic citation with sanctions that may include insurance company notification, license suspension, and/or fines) or criminal offenses with various sanctions for drivers with a BAC between 0.05% and 0.079%. The committee offers this recommendation with the understanding that alcohol impairment and increased crash risk begin at BAC levels well below 0.08%. The primary intent of this recommendation is to reduce serious injuries and fatalities caused by alcohol-related crashes, as well as to align with other developed nations and their impaired-driver laws.
Potential Barriers to Adoption and Opportunities
Lowering the BAC limit in the United States from 0.08% to 0.05% will present several challenges. While many other countries have demonstrated reductions in injuries and fatalities after lowering driving BAC limits to 0.05%, variations in population characteristics, the constitutional rights of citizens, and law enforcement strategies make it difficult to draw direct correlations between experiences in those countries and potential effectiveness in the United States. There is an opportunity, however, to learn from the experiences of other countries that lowered the BAC limit and prepare for any challenges they faced. Moreover, implementation on a state-by-state basis would likely occur over time and assessments of the impacts could be conducted to inform decisions in other states.
Critics of lowering the BAC limit from 0.08% to 0.05% have argued that adoption of lower BAC limits may be onerous for police officers to enforce and could place an undue burden on the court system; however, this has not been demonstrated in studies conducted in other countries where the BAC limit has been lowered. While it is true that lowering the BAC limit to 0.05% would increase the number of drivers who fit the legal definition of being alcohol impaired, studies in other countries have shown that when the BAC limit was lowered—especially when accompanied by a well-publicized marketing campaign—there was a greater perceived risk of sanctions for drivers, which resulted in fewer alcohol-impaired drivers on the roads and a reduction in alcohol-related crashes (Albalate, 2008; Blais et al., 2015; Kloeden and McLean, 1994; Mann et al., 2001; Otero and Rau, 2017). Lowering the BAC limit also had a deterrent effect for young and new drivers, as well as drivers with no prior alcohol-related violations (Byrne et al., 2016).
Although lowering the BAC limit may result in fewer alcohol-impaired drivers on the roads, law enforcement officials would still require special training and equipment to allow them to detect impaired drivers, as is currently the case for 0.08% laws. Enforcement of a 0.05% per se law will depend on the amount of available resources for, among other things, conducting trainings, increasing police presence, and accurately conducting frequent sobriety checkpoints. It should be noted, however, that these concerns currently exist for enforcement of 0.08% laws.
Advocacy and special interest groups can have a significant effect on the public’s perception or acceptance of new public policies (Molnar et al., 2017). An example of this was seen in Utah with the passage of the first U.S. law lowering the BAC limit from 0.08% to 0.05%, which is scheduled to go into effect on December 30, 2018 (Utah State Legislature, 2017). Although a recent poll found that 51 percent of Utah residents opposed the bill, support by members of the Church of Jesus Christ of Latter-Day Saints, a group that prohibits the use of alcohol as part of their church
doctrine, has been credited with being instrumental for passage of the new state law (UtahPolicy.com, 2017). Despite the support that the new law received in Utah, other advocacy groups have been largely silent on the issue or have opposed it outright. MADD, arguably the most vocal proponent of reducing alcohol-impaired driving and a leading advocate in the fight to lower the BAC limit from 0.10% to 0.08%, has chosen to maintain their support of a BAC limit of 0.08% and did not support the new Utah legislation (MADD, 2017). The American Automobile Association (AAA) also has focused on other issues such as distracted, drowsy, aggressive, and impaired (defined broadly) driving (AAA, 2017). Garnering the support of MADD, AAA, and other safe driving advocacy groups would help to increase support for decreasing the BAC limit to 0.05%. Opposition to decreasing the BAC limit to 0.05% has come from distilled spirits lobbying groups, such as the American Beverage Institute (ABI). When the new BAC legislation was pending in Utah, ABI used aggressive marketing campaigns in Utah and neighboring states, and online petitions, to try to defeat the legislation (ABI, 2017a,b,c,d).
Collecting and marketing accurate information to the public is an important component of any plan to increase support for new laws lowering the BAC limit to 0.05%. As with any successful campaign, it is important for advocacy and research groups to work in concert to present a unified message and clearly counter any misleading or inaccurate information. Research into the best practices for launching, focusing, and running a successful campaign to increase support of new laws lowering BAC limits would advance the likelihood of passing new legislation and decreasing the number of alcohol-related crashes, injuries, and fatalities.
Despite the success in Utah of passing the first BAC 0.05% law and the submission of similar bills in Washington State (Washington State House of Representatives, 2017) and Hawaii (Hawaii State Legislature, 2017), support for changing U.S. laws more broadly has been lacking. Political leaders will typically act on behalf of constituents who cast their votes, and constituents have been largely silent on this issue. Alternatively, some individuals may oppose the legislation because of erroneous information such as that the law will unfairly target social drinkers or that having one drink will result in a BAC that exceeds the limit set by state law, neither of which are true (see Figure 4-1 for BAC calculation). To overcome misunderstandings among politicians and the general public, advocates for change will have to be clear and consistent with their message regarding exactly what the laws mean for drivers and the potential lives that could be saved by lowering the BAC limit across the country (Eby et al., 2017). To succeed with lowering the BAC would require a groundswell of support from grassroots organizations and voters to research and understand the issues, have access to the most credible data available from which to
make policy decisions, and be motivated to work on behalf of adopting strategies and legislation that can potentially save lives (see Chapter 7 on generating action for more information and a recommendation on model legislation to improve uniformity and the adoption of effective policies nationwide).
What Would It Take to Pass a 0.05% BAC Law?
The evidence reviewed by the committee suggests that lowering BAC per se laws is an effective policy in reducing alcohol-impaired driving fatalities, nonfatal injuries, and crashes. By studying the process of lowering the BAC limit from 0.10% to 0.08% in the United States, there are insights to be learned regarding what it might take to lower it further to 0.05%. Opposition against lowering the BAC per se law from 0.10% to 0.08% was strongest among the alcohol and hospitality industries and opposing legislators (Rodriguez-Iglesias et al., 2001). At that time, the main arguments in opposition to the bill were that it was unnecessary because the states already had administrative sanctions at 0.08% or that other interventions, such as increased penalties for repeat offenders, would have a greater effect on reducing alcohol-impaired driving and would not target “social” drinkers (i.e., those with BAC levels between 0.08% and 0.099%) (Rodriguez-Iglesias et al., 2001).
A study funded by NHTSA in 2001 analyzed the process of lowering the BAC per se law to 0.08% in six states, four of which had passed the law at the time of the study (Illinois, Texas, Virginia, and Washington) and two of which had not (Maryland and Minnesota) (Rodriguez-Iglesias et al., 2001). Through in-depth interviews with those involved in the process, the authors identified the following five components that were essential for getting the law passed: strong influential leadership from a key individual who is committed to the issue; the formation of strong advocacy coalitions with public and private support; bipartisan support for the bill; an effective mass media campaign; and a strong working relationship between advocates and opponents. As noted earlier, the effectiveness of lowering the per se laws to 0.05% will be supported by legislation that currently applies to 0.08% per se laws.
Laws Pertaining to Young and Inexperienced Drivers
Although motor vehicle crashes remain at the top of the list of leading causes of death for U.S. teens, the number of fatalities from crashes involving teen drivers, persons 15–20 years of age, has steadily declined from 3,490 fatalities in 2006 to 1,886 in 2015 (NHTSA, 2017a). Two laws that have been proven to be effective interventions for reducing crashes
and fatalities in drivers under the age of 21 are zero tolerance laws and graduated driver licensing (GDL) laws.
Zero Tolerance Laws
Zero tolerance laws, enacted in all 50 states and the District of Columbia, make it illegal for drivers under the age of 21 to drive with alcohol in their system (BAC levels in excess of 0.0–0.02%, to allow for variance in testing results). Studies of these laws have found them to be highly effective for reducing the number of young drivers who get behind the wheel after consuming alcohol (CDC, 2012; Fell et al., 2009, 2016; Haegerich et al., 2016; Liang and Huang, 2008; Shults et al., 2001).
Graduated Driver Licensing Laws
All 50 states and the District of Columbia have some form of GDL systems in place for teen drivers (CDC, 2016). These systems restrict driving privileges for teens depending on their age, the length of time they have been driving, or the time of day when they are allowed to drive a vehicle. Although specific regulations vary by state, different stages of licensure include:
- Teens with a learners permit can only drive with a licensed, adult driver in the vehicle, and the teens may have to meet a minimum age requirement for eligibility (McCartt et al., 2010);
- A provisional license allows a teen to drive without an adult in the vehicle, but the teen’s driving may be restricted to certain hours of the day or night or the teen may be prohibited from driving with teenage passengers in their vehicle; and
- An unrestricted license allows a driver to drive a vehicle without time or passenger restrictions (CDC, 2016).
GDL systems have been found to be effective for reducing the number of crashes involving young, inexperienced drivers (Curry et al., 2017; Fell et al., 2011, 2016; Masten et al., 2011; McCartt et al., 2010; Salam et al., 2016; Williams et al., 2016). States with GDL systems rated as “good”—based on unsupervised driving restrictions, minimum age requirements for obtaining learners permits, and driving restrictions after licensing for a period of time or until a certain age—were associated with a 30 percent reduction in fatal crashes involving 15- to 17-year-old drivers (McCartt et al., 2010), and, although findings were not uniform for all teens, stronger GDL programs were significantly associated with a decrease in fatal crash risk for 16-year-old drivers (rate ratio = 0.74; 95 percent CI 0.65–0.84)
(Masten et al., 2011). In a study looking at long-term effects of the North Carolina GDL program, 16-year-old drivers who received their license under the GDL system had a lower incidence of first crashes than pre-GDL system drivers, and 16- to 17-year-old drivers’ crash incidence was 10 percent lower than comparable drivers who received their driver’s license prior to the adoption of the GDL system (Masten and Foss, 2010). The largest reductions in fatal crashes among teen drivers were seen in states with stricter nighttime driving restrictions and states that restricted new drivers to zero or one passenger for a designated period of time after receiving their driver’s license (McCartt et al., 2010).
It should be noted that many teens opt to delay obtaining a driver’s license until the age of 18, thereby exempting themselves from GDL restrictions. Some of the primary reasons cited for delaying licensure include a lack of time, money, or interest; limited or no access to a vehicle; or choosing alternate transportation options that do not require a driver’s license such as riding with friends, biking, walking, or ridesharing options; however, gender, race, and socioeconomic status have also been shown to impact the likelihood of obtaining a driver’s license (Romano et al., 2011; Schoettle and Sivak, 2013; Tefft et al., 2013, 2014). It is possible that some teens may opt to delay obtaining a driver’s license until they are beyond the age when they would be subject to GDL restrictions, but, although this could happen, studies have not identified this as a significant concern (Shoettle and Sivak, 2013; Tefft et al., 2013).
Any alcohol use by a teen driver is a serious and dangerous offense. Of the teen drivers killed in 2015, 26 percent had BAC levels of 0.01% or higher and 80 percent of those killed had BAC levels that equaled or exceeded 0.08%, the limit set by state law for drivers over the age of 21 (NHTSA, 2017a). Drinking by novice drivers over the legal drinking age is a further concern, especially since drivers over the age of 18 are not subject to the GDL restrictions and therefore can drive at any hour, without passenger restrictions. More research is needed to investigate how to restrict teen and novice drivers from getting behind the wheel after consuming alcohol. Efforts should also be made to develop strategies for restricting passengers from riding in a vehicle driven by an impaired driver, including vehicles driven by teen or novice drivers (Li et al., 2013; Walker et al., 2003).
Summary of Zero Tolerance Laws and Graduated Licensing Laws
Studies of zero tolerance and graduated licensure laws have found that the creation of high-visibility enforcement programs targeting young drivers (Johnson, 2016), increasing or strengthening existing state licensing restrictions (Williams et al., 2016), further restricting the hours when
young drivers can operate a motor vehicle (Curry et al., 2017; Shults and Williams, 2016), or promoting awareness of license restrictions to parents of teens (Naz and Scott-Parker, 2017) could increase the effectiveness of existing laws. More research is needed to identify how new drivers over the age of 18 fare without GDL restrictions and whether driving restrictions should be compulsory for all novice drivers. Research is also needed into further limiting alcohol-impaired driving among teens and new drivers, and strategies for preventing passengers from riding with those drivers.
DWI Child Endangerment Laws
DWI child endangerment laws target alcohol-impaired drivers who are found driving with children in their vehicles. Currently in the United States, all but three states—New Mexico, South Dakota, and Vermont—have some form of DWI child endangerment law and 42 states subject alcohol-impaired drivers to additional penalties if they are caught driving with children in their vehicle at the time of their arrest (NDAA, 2015). There is a great deal of variation between states regarding the ages of drivers and/or children who are covered by these laws, and punishments can vary from fines to community service, installation of an ignition interlock device, or imprisonment depending on details of the arrest and the state where the offense took place. Despite existing DWI child endangerment laws, children continue to be killed in crashes involving alcohol-impaired drivers. Of the 1,132 children ages 14 and younger who were killed in motor vehicle traffic crashes in 2015, 16 percent, or 181 children, were killed in alcohol-impaired driving crashes. Just over half of those children killed—92 out of 181—were passengers in vehicles driven by individuals with BAC levels that met or exceeded the limit set by state law for DWI (NHTSA, 2016a).
There is limited research regarding the efficacy of child endangerment laws as they pertain to alcohol-impaired driving, and what data exist suggest that these laws have not been effective in reducing child fatalities (Kelley-Baker and Romano, 2014, 2016; Quinlan et al., 2000; Thomas et al., 2014). Researchers have suggested that examining the effectiveness and impact of current laws, collecting and studying more granular data regarding detailed crash information and the age and gender of drivers and victims, or increasing public awareness of existing DWI child endangerment laws may lead to a greater understanding of how to increase the effectiveness of DWI child endangerment laws and eventually help to reduce the likelihood of future child fatalities in alcohol-related crashes (Kelley-Baker and Romano, 2014, 2016; Thomas et al., 2014).
ENFORCEMENT AND ARREST
Interventions for reducing alcohol-impaired driving fatalities can take many forms. One intervention in the area of enforcement and arrest that shows promise is the use of sobriety checkpoints.
Sobriety Checkpoints
Background
Sobriety checkpoints are a high-visibility prevention and enforcement strategy that aims to prevent alcohol-impaired driving. Law enforcement officers can conduct breath testing at sobriety checkpoints selectively or randomly. For selective breath testing, which is used in the United States, law enforcement officers stop vehicles and conduct a breath test on the driver only when they observe and suspect impairment (Bergen et al., 2014a). For random breath testing, which is used in many European countries and Australia but illegal in the United States, officers breath test all stopped drivers (Bergen et al., 2014a). Among states in which conducting sobriety checkpoints is legal, 58 to 72 percent of law enforcement and state patrol agencies conduct sobriety checkpoints (Eichelberger and McCartt, 2016; Erickson et al., 2015).
Although the legality of sobriety checkpoints was challenged when law enforcement agencies in the United States began using them in the early 1980s, the Supreme Court ruled that they present “a minimal and acceptable intrusion given the benefit of preventing impaired driving and the small amount of time required of nonimpaired drivers” (Bergen et al., 2014a). Currently 37 states, the District of Columbia, and 2 U.S. territories (the Northern Mariana Islands and the Virgin Islands) conduct sobriety checkpoints; states that do not allow sobriety checkpoints include Idaho, Iowa, Michigan, Minnesota, Oregon, Rhode Island, Texas, Washington, Wisconsin, and Wyoming (GHSA, n.d.; IIHS and HLDI, 2017).
Evidence
The Community Preventive Services Task Force found strong evidence for the effectiveness of publicized sobriety checkpoint programs based on the results of a systematic review of studies published between 2000 and 2012 (Bergen et al., 2014a). Based on 10 studies that reported the number of alcohol-related crash fatalities, the median relative decrease in alcohol-related crash fatalities was 8.9 percent (interquartile interval: –16.5, –3.4). Fatality decreases were attributed to publicized sobriety checkpoint programs implemented at city, county, state, and national levels as well as in rural, urban, and both rural and urban areas, indicating their effectiveness
across a wide range of settings. Two considerations described by the authors are the importance of including media campaigns in sobriety checkpoint programs and of implementing multiple checkpoints over a relatively long period of time (e.g., 1 to 3 years). The findings of the review are consistent with a previous review conducted by the Task Force, which found that sobriety checkpoints decreased alcohol-related crashes by 20 percent with selective breath testing and by 18 percent with random breath testing (Shults, 2001). A meta-analysis found that sobriety checkpoints decreased alcohol-related crashes by 17 percent (14 percent when controlling for publication bias) and all-cause crashes by 10 to 15 percent (Erke et al., 2009). The effectiveness of sobriety checkpoints was also found to increase when breath testing was performed on all stopped drivers, as is standard practice in several countries, including Australia and New Zealand. More recently, Lenk et al. (2016) found that states in which conducting sobriety checkpoints is legal had an 18.2 percent lower rate of alcohol-impaired driving; of these, the states that conduct sobriety checkpoints at least monthly had a 40.6 percent lower rate of alcohol-impaired driving. Additionally, Hingson et al. (1996) found that combining the use of sobriety checkpoints with enforcement of speeding laws can be an effective strategy for enforcing DWI laws since alcohol-impaired drivers are more likely to drive at excessive speeds.
Some state and local jurisdictions employ saturation patrols either in conjunction with sobriety checkpoints or on their own. When conducting saturation patrols, law enforcement officials carry out alcohol-impaired driving enforcement efforts within specific geographic areas rather than at one specific location. In some cases these patrols may be used when state or local laws restrict the use of sobriety checkpoints. A recent study by Erickson et al. (2015) found that 95.8 percent of state patrol agencies and 62.7 percent of local law enforcement agencies used saturation patrols. Saturation patrols have been shown to be inversely associated with self-reported alcohol-impaired driving; however, they are more effective when combined with other enforcement strategies (such as sobriety checkpoints or seatbelt enforcement) and when advertised through a media campaign (Sanem et al., 2015).
NHTSA’s Countermeasures That Work rates the effectiveness of sobriety checkpoints as high and notes that implementation time can be short when law enforcement officers are appropriately trained (Goodwin et al., 2015). Costs are rated as medium,4 as checkpoints with at least 15 officers typically cost between $5,000 and $7,000 and publicity through paid media exposure can significantly increase costs (e.g., budgets for
___________________
4 Costs in the medium category (designated as $$ in the study) are defined as requiring some additional staff time, equipment, facilities, and/or publicity (Goodwin et al., 2015).
a specific sobriety checkpoint program’s media exposure ranged from $25,000 to $433,000 depending on the state). However, costs can be realistically managed with smaller numbers of staff, which can cost as little as $500 to $1,500 (Goodwin et al., 2015) (and for which NHTSA offers a planning, operation, and evaluation guidance) (NHTSA, 2006), and with earned media exposure.
State-level publicized enforcement demonstration programs in seven states realized an 11 to 20 percent decrease in alcohol-related fatalities in states where checkpoints or other highly visible impaired driving enforcement operations were carried out and where enforcement activities were covered by intensive publicity, including paid advertising (Fell et al., 2008). Evaluations of statewide campaigns in Connecticut (Zwicker et al., 2007a) and West Virginia (Zwicker et al., 2007b), which included sobriety checkpoints along with extensive paid media, realized declines in alcohol-related fatalities following the campaigns and fewer drivers who had positive BAC levels at roadside surveys. Researchers have also examined effective sobriety checkpoint programs in Georgia, Louisiana, Pennsylvania, Tennessee (Fell et al., 2005), and Maryland (Beck and Moser, 2004).
Barriers
One of the primary barriers to a more widespread use of sobriety checkpoints is a shortage of law enforcement staff and financial resources available to devote to these efforts (Bergen et al., 2014a; Fell et al., 2003; Goodwin et al., 2015). The greatest costs for sobriety checkpoint implementation are officer time and publicity (Goodwin et al., 2015). In some states law enforcement agencies also face legal obstacles that prevent sobriety checkpoints and breath testing (Voas and Fell, 2013). While some states have authorized sobriety checkpoint use through state law, state law or interpretations of federal law prohibit use of and/or funding for sobriety checkpoints in other states (GHSA, n.d.). Driver privacy is also a concern, as drivers stopped at sobriety checkpoints may find the breath-testing process to be intrusive (Bergen et al., 2014a). However, as previously mentioned, such concerns were addressed by the U.S. Supreme Court, which deemed sobriety checkpoints a minimally intrusive inconvenience to non-alcohol-impaired drivers and acceptable given their potential to detect alcohol-impaired drivers (Bergen et al., 2014a).
A strategy that may increase the effectiveness and visibility of sobriety checkpoint programs is to implement and advertise “No Refusal” nights and/or weekends, during which law enforcement officials may quickly obtain a search warrant for a blood sample from a driver suspected of alcohol-impaired driving who refuses a breath test. “No Refusal” nights and weekends are typically implemented during national holidays (such
as Fourth of July and New Year’s Eve) and on days of large events (such as St. Patrick’s Day and Super Bowl Sunday). In jurisdictions that have implemented “No Refusal” initiatives, officers may request search warrants from on-call judges by phone to obtain blood test results legally and more swiftly for conviction (NHTSA, n.d.-b). These search warrants, usually issued as electronic warrants, are discussed in more detail in Chapter 5.
The first “No Refusal” effort to be implemented was the “No Refusal Weekends” initiative that has existed in certain jurisdictions in Texas since 2005. In one county the program led to a decrease in breath test refusal rates at sobriety checkpoints from 50 percent in 2005 to 10 percent in 2010; in addition, DWI conviction rates have significantly increased and case dismissal rates have decreased (NHTSA, n.d.-b). Funding from the Texas Department of Transportation pays for additional time required of prosecutors and for nurses to obtain blood for BAC testing and has enabled an increase in the number of “No Refusal” nights each year from 16 to 56 (GHSA, 2011).
A limitation of “No Refusal” initiatives is that the additional resources and personnel needed to obtain search warrants may be burdensome for jurisdictions already working with limited resources (Winkler, 2012). In addition, the legality of “No Refusal” programs has been challenged in several states as a violation to the Fourth Amendment; however, courts have maintained that it is only unconstitutional to obtain a blood test when done so without a warrant (Solomon, 2014). Other criticisms include that “No Refusal” laws do not specify how long prosecutors may keep blood samples in their possession and that judges are quick to sign search warrants and rarely, if ever, turn them down (Winkler, 2012). Nonetheless, “No Refusal” laws in some states have successfully increased both the proportion of drivers who agree to a breath test and rates of DWI convictions (Sommer, 2016). However, stronger evidence will be needed to more accurately ascertain their effect.
A toolkit of informational and promotional materials for implementing and advertising “No Refusal” programs is available online from NHTSA (2017b). Information from the toolkit’s website states that nine states (Arizona, Florida, Idaho, Illinois, Kansas, Louisiana, Missouri, Texas, and Utah) have implemented “No Refusal” programs; of those that have not, 21 states have the “necessary legal authority” in place to do so (NHTSA, n.d.-b).
Unintended Consequences
Evidence suggests that racial profiling and targeting of undocumented immigrants are two potential unintended consequences of sobriety
checkpoint programs in the United States. In 2010 law enforcement officers in Escondido, California, enlisted the help of U.S. Immigration and Customs Enforcement to screen for immigration status at sobriety checkpoints; 10 unlicensed drivers (a majority of unlicensed drivers are undocumented immigrants) were discovered for every alcohol-impaired driver (Cavanaugh et al., 2012). The potential for law enforcement agencies and towing companies to profit financially from sobriety checkpoint programs has also contributed to racial profiling and targeting of undocumented immigrants. In 2009 sobriety checkpoints in the California cities of Oakland, San Jose, San Rafael, Hayward, and Redwood City generated about $40 million from towing and law enforcement fines; the majority of impounded motor vehicles were taken from persons of racial or ethnic minority, many of whom were undocumented immigrants (Gabrielson, 2010). In stark comparison, the California Highway Patrol does not collect revenue from motor vehicle seizures and in 2008 arrested four alcohol-impaired drivers for every vehicle seized (Gabrielson, 2010).
Racial profiling and financial profitability could undermine the success of sobriety checkpoint programs in detecting alcohol-impaired drivers and reducing resulting crashes and fatalities. To minimize the risk of racial profiling, Bergen et al. (2014a) encourage systematic selection and standardized methodology to select vehicles and drivers for breath testing so driver selection is not left to the discretion of individual law enforcement officers. See Chapter 2 for a discussion on the importance of health equity considerations specific to the implementation of interventions to reduce alcohol-impaired driving.
Cost-Effectiveness
A number of studies were identified that explicitly examined the cost-effectiveness or cost-benefit of sobriety checkpoints. Among these, results varied somewhat owing to differences between countries and/or states analyzed, measurements of costs, time periods covered and duration of follow-up periods, variation in study populations, and outcomes analyzed (fatalities only and injuries). An analysis of various studies by the Community Preventive Services Task Force found that the benefits of sobriety checkpoints outweighed the costs (Ditter et al., 2005); however, because of gaps in the literature, competing policies and perspectives, cost differences, and differences in outcome measurements, accurately measuring and comparing the cost-effectiveness of these interventions can be difficult. The same studies are also reviewed and summarized by Bergen et al. (2014a) and this review again concluded that publicized sobriety checkpoints are cost-effective and suggest that the cost-effectiveness may increase when operated at a higher scale. Of the five studies reviewed
by the Community Preventive Services Task Force (Ditter et al., 2005) and Bergen et al. (2014a), a study by Stuster and Blowers (1995) conducted in California would be most applicable to U.S. policy making. The other cost-benefit studies included in the reviews were conducted in the Netherlands (Wesemann, 1989), New Zealand (Miller et al., 2004), and South Wales (Arthurson, 1985), which makes them less instructive for the United States since the impact and cost-effectiveness is based on driving patterns, road structure, and other interventions and policies that are time and place specific. Since some of these dimensions also vary between states, the findings from the California study may not be applicable across all U.S. states. Overall, although the conclusions reached by the Community Preventive Services Task Force (Ditter et al., 2005) and Bergen et al. (2014a) suggest that sobriety checkpoints would likely be cost-effective, the reviewed studies may be outdated, and most occur in countries other than the United States and have somewhat weak methods and measures. For these reasons, confidence in these findings is not high.
Taking a different approach, Miller et al. (1998) modeled potential monetary benefits of a sobriety checkpoint in a hypothetical community. Using information from a sobriety checkpoint program in Tennessee to model outcomes, the study authors predicted that the program saved the community $6 for every $1 spent. Costs and estimated monetary benefits in the study were defined in terms of potential cost reductions or savings—measured in the categories of medical care, public programs, property damage, future earnings, and quality of life—resulting from a sobriety checkpoint program. However, the calculations may not be generalizable because of the study’s focus on one specific program, the use of a hypothetical community, and the length of time that has passed since the study was conducted.
In summary, the evidence across multiple studies weakly suggests that sobriety checkpoints could be cost-effective depending on how they are conducted (randomized or selective), how often they occur, the scale or intensity (high or low level) with which they are carried out, and whether they are accompanied by media campaigns. In order to be confident of the cost-effectiveness of sobriety checkpoints, new and more rigorous studies are needed.
International Perspective
There is strong evidence for the effectiveness of publicized sobriety checkpoint programs in other countries, including Australia, Canada, New Zealand, Spain, Taiwan, and Thailand (Alcañiz et al., 2014; Chang and Shih, 2012; Chuliá et al., 2016; Ditsuwan et al., 2015; Erke et al., 2009; Miller et al., 2004; Solomon et al., 2011).
In addition to the selective and random breath-testing methods used in these countries, Sweden has recently piloted a sobriety checkpoint program with automated breath testing. A Swedish traffic safety nonprofit, MHF, has developed and implemented an automated sobriety checkpoint that is currently in use in Stockholm. Known as Alco Gates, the checkpoint is located in Frihamnen, a harbor where large cruise ships dock to enter Stockholm. Passengers traveling with vehicles disembark by driving to the checkpoint and blowing into a noncontact breath testing device, after which a boom gate lifts if the driver is found to be sober (Ascarelli, 2014). The checkpoint is operated by a control station and traffic management center that monitors the system with 16 cameras and 30 sensors and is capable of communicating with drivers in 12 different languages. The checkpoint is compliant with Swedish law and reported 244 alcohol-impaired drivers out of 46,553 passengers over a trial interval of 12 months (Sjöström and Jonsson, n.d.). Following evaluation and reporting of results from the trial in 2015, the Swedish government implemented Alco Gates at several additional ports. Implementation of Alco Gates has been a collaborative effort between MHF and the Swedish Transport Administration, the Swedish Police Authority, the Swedish Customs Service, the Swedish Coast Guard, Ports of Stockholm, and shipping companies whose cruise services access the port (Sjöström and Jonsson, n.d.).
Special Populations
Low-staff, weekly sobriety checkpoint programs can be effective at reducing alcohol-impaired driving in small rural communities (Lacey et al., 2006) and well-publicized, highly visible sobriety checkpoints have been credited with reducing injuries from alcohol-impaired driving in American Indian/Alaska Native reservations (Piontkowski et al., 2015). Box 4-1 describes a successful motor vehicle injury prevention program implemented in a tribal community in Arizona that combined sobriety checkpoints with culturally appropriate social marketing methods, emphasizing the importance of publicity and high visibility for sobriety checkpoints to be effective. In addition to benefiting rural populations, sobriety checkpoints have also been effective at reducing alcohol-related crashes in high-risk populations including men and young people 21 to 34 years (Bergen et al., 2014a).
The University of Wisconsin Population Health Institute’s What Works for Health evidence review on strategies to improve rural health identifies sobriety checkpoints as a scientifically supported strategy (defined as having been tested in multiple robust studies with consistently positive results) (Bergum et al., 2016). Rural law enforcement agencies may be particularly lacking in personnel to staff sobriety checkpoints. However,
low-staff sobriety checkpoints do not require the amount of personnel and resources that are commonly deployed (i.e., 12 to 15 police officers on site) (IIHS, 2005; Stuster and Blowers, 1995). Lacey et al. (2006) examined the effectiveness of weekly, low-staffed sobriety checkpoints (three to five police officers) in two rural counties in West Virginia over a 1-year period and estimated a 70 percent reduction in drivers with BAC levels ≥0.05% in the experimental counties relative to the control counties. Interestingly,
the proportion of drivers who had been drinking at all (BAC ≥0.01%) only declined by 5 percent. Residents were surveyed at baseline and postintervention on whether they had seen or heard about a police checkpoint in the past 30 days and the proportion that responded yes increased significantly between baseline and postintervention periods (41 versus 62 percent).
When low-staff checkpoints were integrated into West Virginia’s statewide comprehensive program to reduce traffic crashes, the state saw a 17.3 percent reduction in alcohol-related driving fatalities the following year and an 8.1 percent decrease the year after that (Neil, 2006). West Virginia continues to conduct low-staff checkpoints as indicated by its 2017 Highway Safety Plan (Tomblin et al., 2016).
Passive alcohol sensors can be used during checkpoints to assist officers in detecting drinking drivers. The passive alcohol sensor is a device, usually integrated into an officer’s flashlight or clipboard, that measures whether alcohol is detected in the air where the driver is breathing. They can be used without notifying the driver and without probable cause because they are considered “an extension of the officer’s nose” and are nonintrusive. Detection of alcohol using a passive alcohol sensor can give the officer probable cause to request standard field sobriety tests. Passive alcohol sensors are generally reliable and effective at detecting alcohol in ambient air, especially during checkpoints, where officers have very little time to screen drivers (they can increase detection of drivers with BAC levels ≥0.10% by up to 50 percent) (Fell and Compton, 2007). A major barrier to the common use of passive alcohol sensors is the lack of acceptance among law enforcement. Some reasons include requiring the officer to be closer than they would like to the drivers; requiring a portion of the officer’s attention, which may need to be focused on more pertinent things like their personal safety; keeping them from having one of their hands free; and some officers believe they do not need the device to detect alcohol (Goodwin et al., 2005; Preusser, 2000).
Conclusion
Evidence indicates that publicized sobriety checkpoints are effective at decreasing alcohol-impaired driving and resulting crashes and fatalities. As described in this section, two systematic reviews conducted by the Community Preventive Services Task Force (Bergen et al., 2014a; Shults, 2001) and a meta-analysis conducted by Erke et al. (2009) found that publicized sobriety checkpoint programs with selective or random breath testing were effective at decreasing alcohol-impaired driving and resulting crashes and fatalities in rural and urban areas as well as at city, county, state, and national levels. More recently, Lenk et al. (2016) found
that states that conduct sobriety checkpoints at least monthly had a 40.6 percent lower rate of alcohol-impaired driving. In addition, NHTSA has supported the effectiveness of sobriety checkpoints in its Countermeasures That Work. Results from studies of sobriety checkpoint programs in several states also indicate that they are effective when paired with publicity and advertising efforts (Beck and Moser, 2004; Fell et al., 2005, 2008; Zwicker et al., 2007a,b) or enforcement of speeding laws (Hingson et al., 1996). Evidence also suggests that sobriety checkpoints are effective among specific, often high-risk, populations including small rural communities (Lacey et al., 2006), American Indian/Alaska Native reservations (Piontkowski et al., 2015), and for men and young people 21 to 34 years of age (Bergen et al., 2014a). In addition, there is some evidence to suggest that sobriety checkpoints are cost-effective; however, results from these studies indicate that the cost-effectiveness of sobriety checkpoints depends on several factors related to their implementation. Updated studies with more rigorous methods are needed to more accurately and confidently assess the cost-effectiveness of sobriety checkpoints. Based on its review of a strong body of evidence supporting the effectiveness of sobriety checkpoints at decreasing alcohol-impaired driving in a variety of geographical environments and for a range of specific populations, the committee recommends:
Recommendation 4-2: States and localities should conduct frequent sobriety checkpoints in conjunction with widespread publicity to promote awareness of these enforcement initiatives.
The ideal frequency of sobriety checkpoints requires additional research. When full-scale sobriety checkpoints are not feasible (due to staffing, cost, or other limitations), low-staff checkpoints have been shown to be an effective alternative. The committee makes this recommendation despite the fact that sobriety checkpoints are currently illegal in several states. To maximize the potential benefits of publicized sobriety checkpoints, these restrictive laws would need to be changed. Data on where and when fatal and serious physical injury crashes occur should be leveraged to ensure strategic placement of the checkpoints. (See Chapter 6 for information on using big data and predictive analytics to help determine effective interventions, including their geographic placement, to reduce alcohol-impaired driving.)
TECHNOLOGY AND VEHICLE FACTORS
In the areas of technology and vehicle factors, the committee focused on existing and emerging interventions that have reduced—or shown
promise of reducing—alcohol-impaired driving and alcohol-related crashes. Passenger restraints and existing vehicle safety technology are discussed, as well as emerging and promising interventions such as the Driver Alcohol Detection System for Safety (DADSS) program and other developing technologies, such as autonomous vehicles. Alternative transportation and ridesharing opportunities using smartphone technology have also shown promise for providing alcohol-impaired drivers with a safe transportation option. Smartphone technologies are discussed in the Alternative Transportation section located at the end of this chapter.
Passenger Restraints
Primary Seat Belt Laws
Seat belt use and infant and child restraints provide a means for drivers and passengers in cars or trucks to reduce their risk of injury or death during a crash. According to NHTSA data, drivers and front seat passengers who use seat belts (lap/shoulder) reduce their risk of fatal injury by 45 percent and are 50 percent more likely to avoid moderate to critical injury (Kahane, 2015; NCSA, 2017). In 2015 alone, seat belts were credited with saving nearly 14,000 individuals 5 years of age and older, and 266 infants and children (up to 4 years of age) were saved by child restraints (including all types of car seats). NHTSA estimates that since 1975, approximately 345,000 lives have been saved because of the use of seat belts (NCSA, 2017).
Alcohol-impaired drivers are less likely to use seat belts relative to nonimpaired drivers. A study of nighttime Minnesota drivers found that drivers with a BAC of 0.10% or higher were significantly less likely (OR = 2.17) to be using seat belts (Foss et al., 1994). Another study examining seat belt use found that relative to fatally injured teenage drivers with low or zero probability of a BAC at or greater than 0.10%, those with a high probability of a BAC at or above 0.10% were 60 percent less likely to use seat belts (McCartt and Northrup, 2004). More recently, analysis of data from the 2012 Behavioral Risk Factor Surveillance System survey found that the rate of alcohol-impaired driving among persons who reported not always wearing a seat belt (1,321) was three times higher than for those who reported always wearing a seat belt (398) (Jewett et al., 2015). Evidence also indicates that persons who consume alcohol more frequently are less likely to use seat belts (Kweon and Kockelman, 2006).
Although some form of seat belts were installed in all vehicles as early as 1964 (lap belts, shoulder belts, or a combination of the two), two decades passed before the nation’s first seat belt law was passed in New York State in 1984 (Goodwin et al., 2015). Currently 34 states and
the District of Columbia have primary seat belt laws in effect, meaning that law enforcement officials are permitted to stop vehicles if drivers or passengers are not wearing seat belts. Fifteen states have secondary laws, which prohibit law enforcement officials from stopping vehicles for seat belt violations, but allow officials to ticket drivers for noncompliance if the vehicles are first pulled over for another offense (NCSA, 2017). Occupant restraint laws, including those for infant and child restraints, vary from state to state. Some states have primary or secondary laws requiring certain vehicle occupants to wear seat belts according to their location in the vehicle (driver, or front seat or backseat passengers), while other states regulate seat belt use according to the ages of the occupants (e.g., children 18 years of age and younger).
Several different factors—primary versus secondary seat belt law, time of day, urban versus rural driving, and strength of seat belt reminder system—can affect seat belt use. In 2016, seat belt use in states with primary seat belt laws reached a compliance rate of 92.1 percent while seat belt use in states without primary laws reached 83 percent (Pickrell and Li, 2016). States that moved from secondary seat belt laws to primary laws saw an increase in seat belt use during both daytime and nighttime hours, and motorist fatality rates decreased by an estimated 7 percent (Farmer and Williams, 2005; Tison et al., 2010). A 4-year study conducted by Lange and Voas (1998) found that after California changed the state seat belt laws from secondary to primary, the rate of compliance with seatbelt laws increased from 73 to 95.6 percent. During this same period, the authors found that seat belt use increased from 53.4 to 92.1 percent among drivers with BAC levels ≥0.10%. In 2010, Tison et al. (2010) analyzed FARS data on motor vehicle fatalities (1998–2007) and found that nighttime seat belt use (between the hours of 9 p.m. and 3:59 a.m.) is approximately 18 percent lower than during daytime hours (from 4 a.m. to 8:59 p.m.). Furthermore, only 26 percent of alcohol-impaired drivers—versus 52 percent of nighttime drivers in the zero BAC group—were wearing seat belts at the time of their fatal crash. Seat belt use is lowest in the Midwest (85.5 percent) and highest in the West, and seat belt use in rural areas is slightly lower than in urban areas (89.5 versus 90.5 percent, respectively) (Pickrell and Li, 2016). As required by federal safety standards, seat belt reminder systems provide a warning light and sound lasting 4 to 8 seconds (IIHS, 2017). Enhanced belt reminder systems have been found to increase the rate of seat belt use by about 3 percent (Farmer and Wells, 2010; Freedman et al., 2007).
Seat belt laws are not without controversy. Some opponents to seat belt laws believe that they infringe upon personal choice and individual rights (Advocates for Highway and Auto Safety, 2017), while others are concerned that these laws provide a mechanism by which members of
minority populations can be unfairly targeted and subjected to harassment by law enforcement officials (ACLU, 2016; Factor et al., 2013). While the committee is cognizant that these concerns have been raised, the benefits afforded by seat belt use have been well documented. Seat belt use has been shown to be an effective intervention for saving lives and protecting individuals from harm and although the equitable implementation of seat belt laws has been a concern, the committee does not believe the controversy negates the need for, or enforcement of, these laws. Based on the evidence described in this section, the committee concludes:
Conclusion 4-1: Seat belts are highly effective in reducing serious injuries and fatalities caused by motor vehicle crashes. Given the low rates of seat belt use and high rates of crashes in rural areas, universal adoption of primary seat belt laws for all occupants and child restraints, combined with enhanced enforcement, could reduce alcohol-related crash injuries and fatalities, particularly in these high-risk areas.
Vehicle Safety Technology
Contemporary cars offer several vehicle safety features; however, the extent to which these features may prove to be especially helpful for individuals who drive under the influence of alcohol is largely unknown. Of the new technology available in vehicles—traction control, backup cameras, pedestrian detection, parking assist, and vehicle speed limiters, to name a few—the advances that may show the most promise for aiding alcohol-impaired drivers are lane departure warnings (sometimes referred to as lane keeping assist systems) and the forward collision warning. Studies have shown that an alcohol-impaired driver’s ability to maintain lane position and vehicle control is compromised, thus making these drivers a hazard to themselves and others (Irwin et al., 2017; Rakauskas et al., 2008). Although functionality of motor vehicle warning systems may vary from vehicle to vehicle, most systems use auditory alerts, vibrations of the steering wheel or driver’s seat, or visual cues on the dashboard to alert a driver to unintentional lane drift or risk of collision. Some systems also provide autonomous braking and steering to help drivers regain control of their vehicle.
To test whether these warning systems could have prevented or mitigated vehicle crashes and reduced injuries, Kusano and Gabler (2015) ran computational models using nationally representative crash data from 1,042 rear-end collisions from 1997 to 2013 to simulate crashes with and without forward collision and lane departure warning systems. Their analysis found that up to 67 percent of all crashes and between 2 and 69 percent of injuries (moderate to fatal) could have been prevented if these
warning systems had been in use at the time of the initial crashes. A study in Sweden by Sternlund (2017) had similar findings after an analysis of 104 fatal car crashes from 2010 that potentially involved lane departures (52 head-on crashes, 48 single-car crashes, and 4 crashes while passing other cars). Lane departure-related crashes were determined to be responsible for half of all head-on and single-vehicle crashes, of which 33 to 38 percent could potentially have been prevented if lane departure warning systems were used at the time of the initial crash.
The benefits that these systems may have for alcohol-impaired drivers, however, are unknown. A recent study by Cicchino and Zuby (2017) accessed data from NHTSA’s 2005–2007 National Motor Vehicle Crash Causation Survey to analyze 631 lane-drift crashes that occurred between 6 a.m. and midnight to determine the proportion of drivers who might have been able to regain control of their vehicle if a lane departure warning system had been used at the time of the crash. The study found that the full potential of lane departure warning systems may not be realized because even if the warning system had been used in the lane-drift crashes analyzed by the researchers, 34 percent of all drivers and 42 percent of drivers involved in serious or fatal injuries would have been unable to fully regain control of their vehicles because they were asleep at the wheel or otherwise incapacitated at the time of the crash. An additional 13 to 14 percent of crashes were affected by the driver experiencing a nonincapacitating medical condition, a BAC ≥0.08%, or another physical factor.
Although lane departure and forward collision warning systems seem to show promise for all drivers, research is lacking regarding how beneficial and effective these systems may prove to be for alcohol-impaired drivers. As more cars are manufactured that contain these new technology features, it would be informative to study how effective they can be for reducing the incidence of alcohol-related crashes or mitigating crash severity. If these or other new and innovative advances (such as automated braking) are shown to be effective, they may provide additional opportunities to help reduce the occurrence of alcohol-related crashes and related injuries or fatalities.
Driver Alcohol Detection System for Safety (DADSS)
The DADSS program is a public–private partnership between NHTSA and the Automotive Coalition for Traffic Safety (ACTS)5 to develop noninvasive, vehicle-integrated technology that prevents a vehicle from moving
___________________
5 ACTS represents motor vehicle manufacturers responsible for about 99 percent of light vehicle sales in the United States (Zaouk et al., 2015).
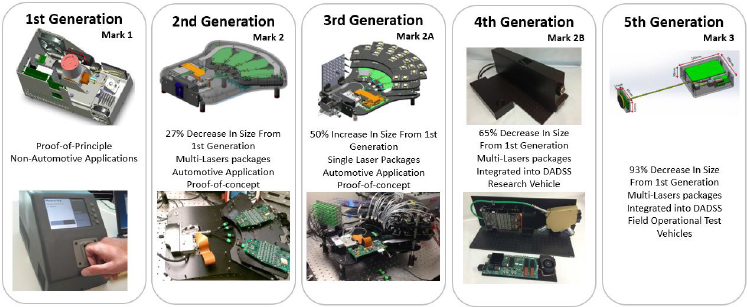
SOURCE: Zaouk et al., 2015.
when the driver’s BAC exceeds the limit of 0.08% set by state law. The program also focuses on understanding public policy challenges associated with the implementation of such technology and developing strategies to overcome these challenges. The two technologies currently in development are the TruTouch touch-based device and the SenseAir breath-based device. DADSS technologies were introduced to the general public in 2011 at a press conference held by the U.S. Secretary of Transportation and then NHTSA Administrator.6 The first two research test vehicles were created in 2013 and 2015, respectively, and the third test vehicle, which is being used for pilot field testing, was created in 2017.7 To further its mission, ACTS will license DADSS technology to any entity with the capability of manufacturing, deploying, and supporting DADSS technologies.8
Touch-Based Technology
The touch-based DADSS device uses spectrometry to measure alcohol concentration in the driver’s skin tissue (DADSS, 2016a; Zaouk et al., 2015) (see Figure 4-2). Once the driver’s finger is in contact with the device’s optical touch pad, near-infrared light propagates into the skin tissue and the touch pad collects a sample of the light reflected back to the tissue surface, from which the unique chemical and tissue structure
___________________
6 Personal communication with Robert Strassburger, Automotive Coalition for Traffic Safety. Available by request from the National Academies of Sciences, Engineering, and Medicine’s Public Access Records Office (PARO@nas.edu).
7 Ibid.
8 Ibid.
information contained in the light can be read and alcohol concentration determined (DADSS, 2016a; Zaouk et al., 2015). The device focuses on analyzing 40 discrete wavelengths that indicate alcohol presence and is expected to be capable of performing multiple BAC readings in less than 1 second (DADSS, 2016a). The technology is envisioned to be integrated into the push button of new vehicles so that a driver’s BAC will be measured when they use their fingertip to start their vehicle (DADSS, 2016a); if the driver’s BAC is at or above 0.08%, DADSS will prevent the car from moving.
Breath-Based Technology
The breath-based DADSS device uses spectrometry to measure alcohol concentration in the driver’s exhaled breath (DADSS, 2016b; Zaouk et al., 2015) (see Figure 4-3). The device transmits midinfrared light toward the driver and assesses the alcohol concentration of the driver’s exhaled breath by analyzing the reflected and absorbed spectrum (DADSS, 2016b; Zaouk et al., 2015). Blood and breath alcohol concentrations are closely correlated, but breath from around the driver’s face or within the vehicle cabin is diluted with cabin air; the degree of dilution can be calculated from measuring carbon dioxide and alcohol at the same point (the concentration of carbon dioxide in ambient air and the concentration of carbon
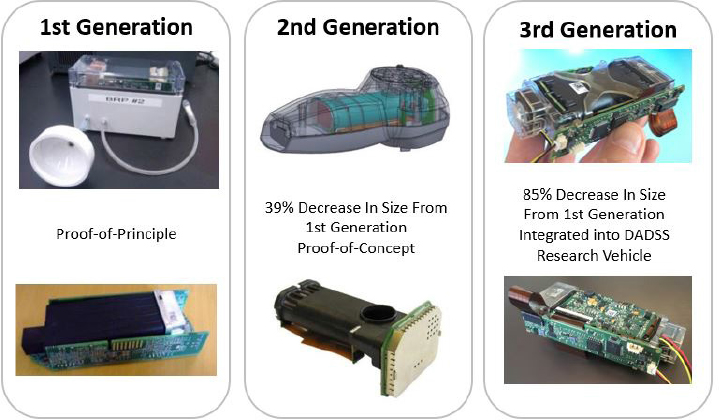
SOURCE: Zaouk et al., 2015.
dioxide in alveolar air are known and predictable), and using the ratio of measured carbon dioxide and alcohol concentrations and the known concentration of carbon dioxide in alveolar air, the alveolar air alcohol concentration can be determined (Zaouk et al., 2015). The breath-based device does not require skin contact to assess the driver’s BAC, and the vehicle will not move if the driver’s BAC is higher than the limit set by state law. Possible locations for the device that are being researched include the driver’s side door and the steering column as well as multiple other locations within the vehicle cabin (DADSS, 2016b).
Background
Funding for the DADSS program is made via annual appropriations by NHTSA and ACTS. Funding for the now-concluded cooperative agreement begun in 2008 totaled $12.3 million.9 Federal funding for the cooperative agreement begun in 2013 was authorized by the Moving Ahead for Progress in the 21st Century Act (MAP-21)10 and covered fiscal years 2013 through 2016 (NHTSA, 2013b).11 Total funding provided by NHTSA and ACTS for these fiscal years totaled $26.8 million.12 Authorization for the DADSS program was extended by the Fixing America’s Surface Transportation (FAST) Act13 to include fiscal years 2017 through 2020.14 The total amount of funding authorized is $21.2 million.15 In addition to the funding provided by NHTSA and ACTS, General Motors provided funds to be used in the Pilot Field Operational Trial of DADSS technologies that will begin in fiscal year 2018.16
Recently, NHTSA began to allow states to use certain grant funds to support some DADSS-related projects, particularly the trial deployment of DADSS technologies. Beginning in fiscal year 2017, the Commonwealth of Virginia was the first state to dedicate a portion of its federal grant
___________________
9 Ibid.
10 MAP-21 is the 2-year transportation reauthorization bill signed into law by President Obama in July 2012 (FMCSA, n.d.).
11 Personal communication with Robert Strassburger, Automotive Coalition for Traffic Safety. Available by request from the National Academies of Sciences, Engineering, and Medicine’s Public Access Records Office (PARO@nas.edu).
12 Ibid.
13 The FAST Act is the 5-year highway reauthorization bill signed into law by President Obama in December 2015 (FHWA, n.d.).
14 Personal communication with Robert Strassburger, Automotive Coalition for Traffic Safety. Available by request from the National Academies of Sciences, Engineering, and Medicine’s Public Access Records Office (PARO@nas.edu).
15 Ibid.
16 Ibid.
funds received from NHTSA to DADSS projects; such funding determinations are made annually (DADSS, 2016c; NHTSA, 2016b).
The 5-year cooperative agreement begun in 2008 consisted of two phases (Zaouk et al., 2015). During phase 1, which was completed in early 2011, two breath-based and one touch-based prototype were tested; one of the breath-based prototypes and the touch-based prototype yielded promising results and were chosen for further research and development, which began in late 2011 and finished in late 2013 (phase 2). With the cooperative agreement’s extension in 2013, phase 3 (currently ongoing) has involved further technological refinement and research to understand how the technologies might interact with humans and be integrated into and operate in vehicles. If the technologies are determined to have commercial potential, the private sector is expected to continue product development and vehicle integration efforts (Zaouk et al., 2015).
To assess reliability, accuracy, and precision, as well as speed of measurement, ACTS developed performance specifications and standard calibration devices to measure accuracy and precision of both systems and to ensure that the devices meet specified performance requirements (Zaouk et al., 2015). The accuracy and speed requirements adopted by the DADSS program are far more rigorous than current alcohol measurement devices are capable of achieving. For example, the amount of time for a DADSS device to provide a BAC reading is expected to be no longer than the current industry standard to activate a vehicle’s motive power, 325 milliseconds, while current breath-based alcohol measurement devices can take at least 30 seconds to provide a BAC estimate (Zaouk et al., 2015). Papers detailing validation studies have been presented at Enhanced Safety of Vehicles conferences. Additionally, the program has partnered with the Commonwealth of Virginia to test the technology in controlled settings, such as limited fleet testing, and refine performance specifications. The DADSS program also aims to increase awareness of the technology by having a presence at university sporting events, a NASCAR race, and festivals for wine and craft beer.17 Although still in the program’s technological research phase, DADSS technology is expected to meet “acceptable technology and manufacturing readiness levels” and be integrated into fleets and potentially privately operated vehicles within approximately 5 to 10 years (DADSS, n.d.-a).
___________________
17 Ibid.
Implementation Barriers and Considerations
Consumer education and public acceptance are the most critical elements for long-term adoption and successful commercialization of DADSS technology. Installation and use of DADSS devices is currently planned to be voluntary; widespread implementation will depend on public acceptance of addressing alcohol-impaired driving as a society (Griffin, 2017). Many people do not view themselves as part of the problem, as a small minority of drivers is responsible for producing the majority of alcohol-related traffic crashes. The DADSS technology will be made available to consumers as a driver assistance system, similar to lane departure warning systems and automatic emergency braking. Thus, to promote wide acceptance of DADDS, the technology should be seen as a safety feature to make roads safer, rather than a punitive device (Griffin, 2017).
Privacy concerns are another critical consideration for implementation of DADSS technology. The program has prioritized the issue of consumer data privacy since its initiation, with the program’s legal authorization and cooperative agreement specifically stating that “security measures and operating procedures must be put in place to protect data from the inadvertent release or disclosure to unauthorized parties” (DADSS, n.d.-a). Additionally, all vehicle manufacturing companies that fund the DADSS program, in partnership with consumer advocacy organizations, have established voluntary privacy principles, standards, and guidance for the use of all vehicle-integrated technology (DADSS, n.d.-a). The industry’s voluntary privacy principles were instated in early 2017, with full implementation to take place in early 2018.
Implementation of DADSS devices will be influenced by several technological considerations. For widespread adoption, the technology will need to be completely passive so that it does not impede normal driving activity. Researchers will also need to address the issue of false positives, which may occur in situations where, for example, the driver washed their hands with products that contain alcohol prior to driving, so alcohol is likely to remain on their hands as well as be in the ambient air when they start their vehicle. Additionally, further research is needed to determine the most effective way to convey information to the driver about their BAC (for example, displaying a numeric BAC reading, displaying a red/yellow/green light) and to ensure that the driver’s age is not under 21 years. Furthermore, the devices are being tested assuming a BAC limit of 0.08% (ACTS, 2013), so technological development may need to be expanded to account for potentially lower BAC per se laws. Similarly, researchers will need to address how the technology will operate in situations where the driver’s BAC changes (for example, a driver’s BAC could be under 0.08% when they start their vehicle but increase to
above 0.08% after a period of time driving, depending on when alcohol was consumed).
Several financial considerations are also critical for successful implementation of DADSS devices. Although an estimate of the price for the device has not been publicly released, the cost to the consumer should be in line with other electronic vehicle safety features, with the average price of typical electronic vehicle safety features being approximately $200, and that cost would be expected to decrease significantly (to around $50) if the devices became a standard vehicle amenity (Griffin, 2017). Individual automakers will determine consumer prices for DADSS technologies. Insurance discounts, already offered for most other vehicle safety features including airbags and seat belts, and state government incentives such as those already in use for electric cars will need to be considered to help deployment of DADSS. Regarding crash liability, DADSS devices are expected to be treated no differently than antilock braking systems and airbags. In addition to stringent performance specification testing, consumer education on the functions the technology can and cannot perform will be important to understanding and managing expectations of the technology’s capabilities.18
Potential Effect
The Insurance Institute for Highway Safety (IIHS) conducted a nationally representative phone survey in 2009 and found that about two-thirds of respondents, including nondrinking drivers and drinking drivers, supported DADSS technology (Cicchino, 2017); 40 percent of survey participants indicated they would want DADSS devices in their own cars if the technology was available (IIHS and HLDI, 2009). In addition to public support, the DADSS program is also endorsed by safety and child safety advocacy organizations, insurance companies, state and local government representatives, and alcohol industry stakeholders (DADSS, n.d.-b). IIHS estimates that about 7,000 lives could have been saved in 2015 if DADSS devices set at a BAC limit of 0.08% had been in every vehicle (Cicchino, 2017). Given strong public support and endorsement from various sectors as well as a significant potential reduction of alcohol-impaired driving fatalities, the committee concludes:
Conclusion 4-2: If its use becomes widespread, Driver Alcohol Detection System for Safety (DADSS) technology is a passive interlock technology that is very promising for reducing alcohol-impaired driving and related consequences. However, it will require substantial evidence of
___________________
18 Ibid.
its accuracy in order to be brought to market or become required safety equipment in all new motor vehicles.
Therefore, the committee recommends:
Recommendation 4-3: When the Driver Alcohol Detection System for Safety (DADSS) is accurate and available for public use, auto insurers should provide policy discounts to stimulate the adoption of DADSS. Once the cost is on par with other existing automobile safety features and the technology is demonstrated to be accurate and effective, the National Highway Traffic Safety Administration should make DADSS mandatory in all new vehicles.
DADSS should only be mandated by NHTSA if and when it is deemed safe and effective, in the same manner as other vehicle safety features that are already under mandate. Support from organizations like NHTSA and continued funding from Congress will be needed for DADSS technology to be fully developed, tested, and marketed to the general public. If DADSS is eventually installed in all cars, it would be as effective as having ignition interlock devices installed (see Chapter 5). DADSS as a primary prevention strategy would have the potential to be more effective at the population level than ignition interlock devices because the technology would be in the vehicle indefinitely. In theory, DADSS would also prevent the alcohol-impaired driving crashes that would be caused by drivers without a prior DWI conviction, who would not have an interlock device installed. Potential areas for future research include false positives and negatives from the use of interlock technology, time to peak of BAC from the start of the vehicle, intervention strategies for continuous monitoring systems, and the effect of vehicle interlocks on personal safety.
New Technologies on the Horizon
In-vehicle technologies that aim to improve traffic safety are rapidly being developed and tested. While evidence supporting the effectiveness of these technological interventions will remain limited until they are more widely implemented and adopted, many have the potential to decrease fatalities from alcohol-impaired driving (e.g., smartphone technologies discussed later in this chapter or autonomous vehicles).
Autonomous Vehicles
Vehicles that are autonomous have an automated driving capability that enables them to operate with limited to zero human driver involvement (Hedlund, 2017). Autonomous vehicles use multiple integrated systems, including sensors, GPS, and vehicle-to-vehicle (V2V) and vehicle-to-infrastructure (V2I) technology,19 to monitor and automatically respond to traffic, road, and weather conditions (Faulks, 2014). The Society of Automotive Engineers and NHTSA categorize autonomous vehicles into five levels ranging from no automation (i.e., the driver maintains full control of the vehicle) (level 0) to full automation (i.e., the vehicle is completely self-driving under all conditions and does not require a human driver) (level 5) (Hedlund, 2017). As of July 2017, 26 states and the District of Columbia have either passed legislation or issued executive orders promoting autonomous vehicle development (NCSL, 2017).20
Level 1 features such as cruise control, electronic stability control, and lane departure warning systems have been available since the 1960s, 1990s, and 2000s, respectively (Hedlund, 2017). In October 2015 about 60,000 Tesla cars received a software update for Autopilot, a driver assistance feature that enables the cars to control their speed, stay in and change traffic lanes, and self-park (Hedlund, 2017). Many Tesla cars are also equipped with other level 2 features including automated lane guidance, crash avoidance, and detection of driver fatigue (Litman, 2017). Google has been testing level 3 autonomous vehicles with a fleet that has completed nearly 2 million miles in controlled environments and includes autonomous vehicles without steering wheels and floor pedals (Hedlund, 2017; Litman, 2017). As of October 2016, 15 companies in California are testing autonomous vehicles (Hedlund, 2017). In September 2016 Uber began offering autonomous vehicle rides in Pittsburgh with a human driver present to intervene if needed (Hedlund, 2017). In 2016 a self-driving truck developed by Uber Advanced Technologies Group and Otto, a San Francisco–based autonomous vehicle technology company, successfully drove 120 miles on a Colorado highway carrying a trailer of Budweiser beer (Hedlund, 2017; Uber, n.d.-a).
___________________
19 V2V and V2I technologies are intelligent transportation systems that communicate data (such as infrastructure advisories and other environmental factors that may affect traffic safety) wirelessly between vehicles (V2V), which includes trucks and motorcycles, and between vehicles and infrastructure (V2I) (DOT, n.d.-a,b).
20 Alabama, Arkansas, California, Colorado, Connecticut, Florida, Georgia, Illinois, Louisiana, Michigan, Nevada, New York, North Carolina, North Dakota, Pennsylvania, South Carolina, Tennessee, Texas, Utah, Vermont, and Virginia have passed legislation. Arizona, Delaware, Massachusetts, Washington, and Wisconsin have issued executive orders (NCSL, 2017).
Internationally, Volvo has been testing autonomous vehicles in Gothenburg, Sweden, since September 2016 and plans to begin testing in London in 2017 (Hedlund, 2017). In Australia, autonomous vehicles are expected to share the roads with human-driven vehicles beginning in 2020 to 2025 (Knott, 2017). In 2021, Volvo plans to begin selling autonomous vehicles in Australia, and Ford expects to introduce autonomous vehicles for commercial ridesharing (Knott, 2017). As of August 2016, 33 companies worldwide are involved in autonomous vehicle development (Hedlund, 2017).
Based on the timelines and vehicle fleet turnover rates from implementation of previous vehicle technologies, Litman (2017) predicts that autonomous vehicle capability will not be a standard feature of most new vehicles until the 2050s (see Table 4-2). Litman also estimates that autonomous vehicle use will not improve traffic safety until the 2040s to 2060s, once the majority of vehicle travel is autonomous (Litman, 2017) (see Table 4-3).
Although the research and development of autonomous vehicles shows great promise, the solutions they might provide in the future are not yet feasible. It is important that efforts continue to be made to reduce alcohol-impaired driving and related injuries and fatalities using technological resources. There may come a day when vehicle occupants no longer have to be mindful of their alcohol consumption as it relates to driving and their BAC, but that day is a long time from now and may, in fact, not ever be a reality.
TABLE 4-2 Autonomous Vehicle Implementation Projections
| Stage | Decade | Vehicle Sales | Vehicle Fleet | Vehicle Travel |
|---|---|---|---|---|
| Available with large price premium | 2020s | 2−5% | 1−2% | 1−4% |
| Available with moderate price premium | 2030s | 20−40% | 10−20% | 10−30% |
| Available with minimal price permium | 2040s | 40−60% | 20−40% | 30−50% |
| Standard feature included on most new vehicles | 2050s | 80−100% | 40−60% | 50−80% |
| Saturation (everyone who wants it has it) | 2060s | ? | ? | ? |
| Required for all new and operating vehicles | ? | 100% | 100% | 100% |
SOURCE: Litman, 2017.
TABLE 4-3 Autonomous Vehicle Planning Impacts by Time Period
| Impact | Functional Requirements | Planning Impacts | Time Period |
|---|---|---|---|
| Become legal | Demonstrated functionality and safety | Define performance, testing, and data collection requirements for automated driving on public roads | 2015−2025 |
| Increase traffic density by vehicle coordination | Road lanes dedicated to vehicles with coordinated platooning capability | Evaluate impacts; define requirements; identify lanes to be dedicated to vehicles capable of coordinated operation | 2020−2040 |
| Independent mobility for nondrivers | Fully autonomous vehicles available for sale | Allows affluent nondrivers to enjoy independent mobility | 2020−2030s |
| Automated car sharing/taxis | Moderate price premium; successful business model | May provide demand and response services in affluent areas; supports car sharing | 2030s−2040s |
| Independent mobility for lower-income driver | Affordable autonomous vehicles for sale | Reduced need for conventional public transit services in some areas | 2040−2050s |
| Reduced parking demand | Major share of vehicles are autonomous | Reduced parking requirements | 2040−2050s |
| Reduced traffic congestion | Major share of urban peak vehicle travel is autonomous | Reduced road supply | 2050−2060s |
| Increased safety | Major share of vehicle travel is autonomous | Reduced traffic risk; possibly increased walking and cycling activity | 2040−2060s |
| Energy conservation and emission reductions | Major share of vehicle travel is autonomous; walking and cycling become safer | Supports energy conservation and emission reduction efforts | 2040−2060s |
| Impact | Functional Requirements | Planning Impacts | Time Period |
|---|---|---|---|
| Improved vehicle control | Most or all vehicles are autonomous | Allows narrower lanes and interactive traffic controls | 2050−2070s |
| Need to plan for mixed traffic | Major share of vehicles are autonomous | More complex traffic; may justify restrictions on human-driven vehicles | 2040−2060s |
| Mandated autonomous vehicles | Most vehicles are autonomous and large benefits are proven | Allows advanced traffic management | 2060−2080s |
SOURCE: Litman, 2017.
PHYSICAL ENVIRONMENT AND TRANSPORTATION
Interventions related to the physical environment and transportation are included in the committee’s conceptual framework for preventing alcohol-related crash fatalities that was presented in Chapter 1 (see Figure 1-5). This section discusses several interventions—designated drivers, smartphone-enabled transportation network ridesharing, and alternative transportation such as safe ride programs and public transportation.
Designated Driver
Background
A designated driver is commonly understood to be a nondrinking member of a social group who agrees before drinking begins to be the driver for the rest of the group. Definitions for the term vary according to expectations about whether the designated driver should remain abstinent from drinking (or how many drinks are acceptable if abstinence is not required) and whether the designation of the driver should take place prior to drinking.
The designated driver concept originated in Scandinavia (Lange et al., 1998) and was popularized in the United States in the late 1980s and early 1990s by a national media campaign launched by the Harvard Alcohol Project. Begun at the Center for Health Communication at the Harvard T.H. Chan School of Public Health, the project partnered with broadcast
television networks and Hollywood studios to produce and air prime time public service announcements that encouraged the use of designated drivers. The announcement featured popular characters from top-rated shows that scripted the designated driver concept into prime time television episodes (Harvard School of Public Health, n.d.; Winsten, 1994, 2017).
The two most common approaches to promoting designated driver use are population-based campaigns and programs that incentivize patrons at drinking establishments to act as designated drivers. Incentives offered to patrons for refraining from drinking alcoholic beverages can include free soft drinks, food, beer or other beverages that do not contain alcohol, or admission to a venue (Ditter et al., 2005). Most research shows that both types of programs have increased awareness and use of the concept (Ditter et al., 2005; Lange et al., 1998; Nielson and Watson, 2009); however, the evidence is insufficient to conclude the effectiveness of either type of program on alcohol-impaired driving (Anderson et al., 2009a,b; Burton et al., 2017; Ditter et al., 2005; Esser et al., 2016; Nielson and Watson, 2009; WHO Regional Office for Europe, 2009).
Evidence
NHTSA’s Countermeasures That Work rates the effectiveness of designated driver interventions as low (Goodwin et al., 2015). The authors note that although costs are low and implementation time is short, few studies have evaluated the effect of designated driver use on traffic injuries owing to variation in the definition and selection of a designated driver. One relevant study was identified in a systematic review conducted by the Community Preventive Services Task Force (Ditter et al., 2005); the systematic review covered population-based campaigns and incentive programs at drinking establishments and is described below.
Population-based campaigns At the time of the Task Force’s review (Ditter et al., 2005), only one study evaluating a population-based campaign was identified. The campaign, known as “Pick-a-Skipper” and targeted at 18- to 35-year-olds in a Western Australian city with a population of about 25,000, consisted of public service announcements and newspaper coverage encouraging drinkers to choose a designated driver before consuming alcohol (Boots and Midford, 1999). Although survey results showed a nearly 13 percent increase in selecting a driver prior to alcohol consumption, the results did not indicate a change in self-reported alcohol-impaired driving or riding with an alcohol-impaired driver. The Task Force concluded that the study did not provide sufficient evidence to determine the effectiveness of population-based designated driver campaigns.
Incentive programs at drinking establishments The task force reviewed eight studies (seven in the United States, one in Australia) evaluating incentive programs at establishments serving alcohol. In the American studies, free nonalcoholic drinks, food, and drink discounts were offered to abstinent designated drivers, with incentives promoted through newspaper advertisements, cable television advertisements, and in-establishment advertising on posters, coasters, and so on. The number of designated drivers each night increased by a median of 0.9, and in two studies the number of designated drivers returned to baseline once the incentives were removed. In the Australian study, three nightclubs in Melbourne suburbs offered free admission and nonalcoholic drinks to designated drivers (who were not required to remain abstinent) of two or more drinkers. Despite contradicting increases in self-reports of both always and never selecting a designated driver before drinking, a 6.5 percent decrease was recorded in the number of drivers or passengers who traveled in a vehicle with a driver whose BAC was estimated to be over the limit set by law. The task force concluded that owing to the small magnitude of observed changes and limitations of measured outcomes, the studies did not provide sufficient evidence to determine whether incentive programs promoting the use of designated drivers were effective.
Evidence regarding the effectiveness of designated driver programs is sparse. The systematic review by Ditter et al. (2005) found inconsistent and insufficient evidence to determine whether designated driver programs are an effective intervention for reducing alcohol-impaired driving or reducing alcohol-impaired driving fatalities. Small increases in the number of designated drivers were seen in studies reviewed by Ditter et al. (2005); however, study participants’ responses both for drinking alcoholic versus nonalcoholic drinks during the night and for reports of driving or being a passenger in a vehicle with a driver who had been drinking were collected via self-report. Information was also lacking on prior drinking and driving histories prior to the designated driving incentive programs.
Barriers and Strategies for Improvement
Although the designated driver concept is generally well known, studies have shown that expectations about whether the designated driver should remain abstinent from consuming alcohol differ (Lange et al., 1998). In fact, results from the 1996 National Roadside Survey showed that designated drivers were more likely to have a positive BAC than non-designated drivers when the origin of travel was not limited to drinking establishments (Fell et al., 1997).
In a survey of 937 adults in California, 64.2 percent of respondents indicated that a designated driver should not drink any alcohol within 4 hours of driving; 19.5, 9.6, and 1.7 percent responded that one drink, two drinks, and three or more drinks, respectively, were acceptable within 4 hours of driving (Lange et al., 1998). Notably, 41.3 percent of heavy drinkers (defined as those who consumed four or more drinks on at least 1 day in the past 28 days) found two or more drinks acceptable for a designated driver; men were also more likely to be accepting of this standard than women. In practice, although 80.7 percent of survey respondents who had acted as a designated driver reported that they had abstained from drinking within 4 hours of driving, 12.1 percent reported that they had drank within 4 hours every time they had acted as a designated driver (Lange et al., 1998). More recently, a study of 165 designated drivers found that only 65 percent had remained abstinent while 17 percent had BAC levels between 0.02% and 0.049%, and 18 percent had BAC levels at or greater than 0.05% (Barry et al., 2013).
Expectations of whether the designation of the driver should take place prior to alcohol consumption also vary. In the survey of California adults previously discussed, 55.7 percent of respondents expected a designated driver to be selected prior to drinking and 20.5 percent were ambiguous about when they thought the decision should be made (Lange et al., 1998). In its originally intended and safest version of implementation, a designated driver should be chosen prior to alcohol consumption and remain abstinent; only 39.3 percent of respondents fulfilled both of these criteria (Lange et al., 1998). Ongoing and future efforts to promote designated driver use may be more effective if focused on encouraging designated drivers to remain abstinent and to be selected prior to drinking (Lange et al., 1998). However, as noted in a NHTSA report, prior designation of a driver is often not feasible owing to cultural drinking behavior in the United States where social groups typically change during travel to, between, and from drinking establishments (Decina et al., 2009).
Unintended Consequences and Spillover Effects
Favorable public opinion of the designated driver concept may have helped to reinforce societal norms against alcohol-impaired driving (Ditter et al., 2005). However, the concept may also have contributed to greater alcohol consumption by passengers, as availability of a designated driver may encourage drinking passengers to consume more (DeJong and Wallack, 1992; Ditter et al., 2005; Esser et al., 2016; Harding et al.,
2001; Rivara et al., 2007). A study analyzing data from the 2007 National Roadside Survey found that one-fifth of drinking passengers in vehicles operated by designated drivers reported having consumed five or more drinks (Bergen et al., 2014b). The authors note that the behavior of these intoxicated passengers could distract the driver. Results from a study of 146 drivers ages 18 to 29 in Alberta, Canada, support this concern, as intoxicated passengers driven by peer designated drivers were likely to behave in ways that were distracting to the driver and unsafe to both the driver and passengers (Rothe and Carroll, 2009).
Special Populations
Young and high-risk drinkers, such as college students, may be especially vulnerable to binge drinking or drinking more excessively than they would have in the absence of a designated driver (DeJong and Wallack, 1992; Ditter et al., 2005; Esser et al., 2016; Rivara et al., 2007; Wolburg, 2005). Young drinkers may also be more likely to accept even higher BAC levels for designated drivers. A study of 480 college students found that although BAC levels of designated drivers were lower than for nondesignated drivers, the average BAC of designated drivers was 0.074% for men and 0.022% for women, averaging 0.060% (Timmerman et al., 2003). The authors note that use of male designated drivers may be ineffective at preventing alcohol-impaired driving.
Conclusion
In its finding below, the committee is echoing the conclusion of the Community Preventive Services Task Force by Ditter et al. (2005). At the time of the review, the Task Force found only one study on the effectiveness of designated driver programs (which found no significant change in self-reported alcohol-impaired driving as a result of the program) and eight studies of incentive programs. The Task Force concluded there was insufficient evidence to draw conclusions about the effectiveness of such programs. An evaluation of an Australian program in 2014, and thus after the systematic review was completed, again concluded it was not clear whether the program affected alcohol-impaired driving or involvement in alcohol-related crashes.
Finding 4-1: The available evidence on designated driver programs is insufficient to determine whether they are effective in reducing alcohol-impaired driving or crashes.
Alternative Transportation
Smartphone-Enabled Transportation Network Ridesharing
Since 2010, smartphone-enabled network ridesharing companies (e.g., Uber, Lyft) have led to a major innovation in on-demand public transportation. For example, in its first 5 years of operation, Uber has provided more than 1 billion rides (Uber, n.d.-b). Because of the added convenience relative to existing public transportation options and often lower costs than traditional taxis, using network ridesharing companies has been widely promoted as an alternative to driving after consuming alcohol.
Empirical evidence is beginning to emerge regarding the association between the uptake of network ridesharing and alcohol-impaired driving crashes, alcohol-related driving fatalities, and potential unintended consequences. The current literature is limited to evaluating data available after the publicly reported start date of Uber’s launch in a given local market, given that Uber has had the largest market share to date. There are no publicly available data across jurisdictions regarding rideshare volume in those jurisdictions.
As of September 2017, there had been six independent analyses published, with three of these published in the peer-reviewed literature and three published as online economics working papers. While the study methodologies and specific findings are somewhat heterogeneous, the main findings generally demonstrate either a net positive benefit on addressing alcohol-impaired driving or no difference.
With regard to the primary outcome of alcohol-related fatalities, two of the four papers showed reductions associated with Uber entry (Greenwood and Wattal, 2017; Martin-Buck, 2016) and the other two showed no difference (Brazil and Kirk, 2016; Dills and Mulholland, 2016). The two papers using alcohol-related crashes as the primary outcome measured a reduction in these crashes associated with Uber (Morrison et al., 2017; Peck, 2017). The effects tended to be stronger in the year after the Uber launch (Greenwood and Wattal, 2017; Martin-Buck, 2016). It appears that some of the heterogeneity in effects may be attributable to differences in public transportation availability and usage and other local geographic and market factors (Martin-Buck, 2016; Morrison et al., 2017; Peck, 2017). For example, in a study that explicitly adjusted for public transportation usage, there was a reduction in DWI arrests in cities with low public transportation usage, but no reduction in cities with high public transportation usage (Martin-Buck, 2016). Other reasons for mixed evidence include heterogeneity in methodological risk adjustment approaches and model specifications.
Given the concern of potential unintended consequences, several studies also analyzed the effects of the Uber rideshare launch on other
crimes that could theoretically occur if increased ridesharing led to increased alcohol consumption, such as disorderly conduct and sexual assaults. Two studies examined the association with other arrests and found that crimes that could be associated with alcohol consumption actually decreased with Uber entry, with no increase in other “control” crimes (Dills and Mulholland, 2016; Martin-Buck, 2016). However, one study found a marked increase in motor vehicle thefts after Uber entry, theorizing this could be caused by leaving cars behind overnight at drinking establishments (Dills and Mulholland, 2016).
In addition to empirical evaluations on the general effect of rideshare entry on alcohol-impaired driving crashes, there are also emerging news reports on municipal police-reported outcomes after the implementation of public–private partnerships to sponsor free rides home from designated drinking establishment locations during peak drinking times (e.g., 9 p.m. to 2 a.m.). For example, based on 2,000 rides provided in Evesham, New Jersey, the mayor reported a 15 percent decline in DWIs and a 16 percent decline in alcohol-related crashes (New Jersey Opinion, 2016). Costs for this program were supported initially by a U.S. Department of Transportation grant to the state followed by private donations.
While network ridesharing services are operating in most cities in the United States, there are still several cities that have barred these services from operating because of concerns ranging from safety, effect on the taxi industry, and increased congestion (NASEM, 2016). Additional concerns about ridesharing services include questions about the training and screening of drivers and the adequacy of insurance coverage. From the perspective of a broadly scalable, cost-effective intervention to reduce alcohol-impaired driving crash fatalities, it appears that the launch of ridesharing network companies has led to a reduction of these crashes in some cities without documented increases in negative public health consequences.
In this section, the committee reviews the emerging evidence base on the effect of the market entry of smartphone-enabled transportation network ridesharing (e.g., Uber, Lyft) on motor vehicle crashes. The evidence is limited to three peer-reviewed papers and three working papers. The evidence is mixed overall, showing either a positive safety benefit or no effect on crashes, but importantly, no increase in unintended crimes that could be attributed to potentially higher alcohol consumption from forgoing driving. There is some evidence that the effect on reducing alcohol-involved crashes is heterogeneous by geography and that the effect may be strongest in geographies with poor public transportation usage. While the evidence of this novel transportation alternative is still emerging, the committee has recommended that transportation network ridesharing be permitted to operate due to the potential to reduce alcohol-impaired
driving crashes as one of many transportation alternatives to driving after drinking (see Recommendation 4-4 in this report).
Safe Ride Programs and Public Transportation
Beyond designated drivers (or letting someone else drive) and smartphone-enabled ridesharing, alternative transportation includes safe ride programs and public transportation. These services provide intoxicated people with additional ways to avoid driving while impaired. Alternative transportation varies considerably in consumer population use, funding sources, modes of transportation, geographical range of service, fee and reservation requirements, and service frequency (e.g., times of day, days of the week, and holidays). Despite these differences, these programs are designed to transport people from residences or other locations to, from, and between drinking establishments. Safe ride programs can include taxis, private cars, limousines, trolleys, tow trucks, and scooters, and these programs usually supplement available public transportation options. Specific college-based programs that commonly use taxi services or shuttles on either a fixed or point-to-point route are also available in many cases. Shuttle buses provide transportation between points on campus, off-campus residences, and sometimes into cities.
Evidence for safe ride programs NHTSA’s Countermeasures That Work concluded that the effectiveness of safe ride programs has not yet been determined and that different study methods produce different results (Goodwin et al., 2015). Furthermore, most programs have not been studied. Those safe ride programs that have been studied lack robust outcomes, making it difficult to make conclusions regarding the effectiveness of alternative transportation options on reducing alcohol-related driving fatalities (Decina et al., 2009; Huseth, 2012). Two college programs that have been evaluated focused on student attitudes toward drinking and perceptions of the college’s alternative transportation option, not on outcomes such as crash reductions (Decina et al., 2009). For example, one assessment of a college late-night bus service found a generally positive view of the program, but the study did not directly survey bus users (Elam et al., 2006).
Two safe ride programs have shown positive outcomes. Tipsy Taxi is a free, year-round service available all day in Pitken County and Aspen, Colorado. It is administered through the sheriff’s office with support from the restaurant association; funding for the program, which also covers clients’ monetary penalties for leaving vehicles overnight, is mainly provided by grants and fundraising events. Tipsy Taxi provided 20,000 rides between 1984 and 1999 (Decina et al., 2009; Lacey et al., 2000). An
interrupted time series analysis found injury crashes reduced significantly, by 15 percent, after the taxi service’s implementation (Lacey et al., 2000); however, given the small community, not enough data were available to evaluate changes in fatal crashes (Decina et al., 2009). The atypical resort community may also limit generalizability. Another program with favorable results is the Road Crew safe ride program. Road Crew is based on a social marketing model and was originally aimed at young, primarily blue collar men ages 21 to 34 years. Focus group research found young men wanted to be able to drink while riding and did not want to leave their cars behind at the end of the evening (Rothschild et al., 2006). To that end, Road Crew uses older luxury vehicles and limousines in three rural areas to provide rides from residences to and from bars. The limousine/luxury car is socially acceptable and provides a fun, social environment. Self-reported alcohol consumption did not change after Road Crew’s introduction. In an analysis of data from 2002 to 2003, 70 percent of people surveyed were aware of Road Crew, and the program provided almost 20,000 rides (Decina et al., 2009; Rothschild et al., 2006). There was also a 17 percent decline in alcohol-related crashes (Decina et al., 2009; Rothschild et al., 2006).
There are additional benefits of safe ride options. Programs generally do not lead to increased alcohol consumption, and they attract people at higher risk of driving impaired (Huseth, 2012; Rothschild et al., 2006; Sarkar et al., 2005; Sprattler, 2010). The services can be inexpensive and easy for communities to implement. For example, a short-term program offered through existing transportation options and centered on holidays or major sporting events could be implemented in a few weeks and operated by donated rides. Furthermore, community organizations, including restaurants and drinking establishments, as well as the alcohol industry, usually support safe ride programs (Huseth, 2012). For instance, the founders of Road Crew attribute part of the program’s success to the variety of partners engaged throughout the service’s stages of development and implementation. These groups included groups of bar owners and patrons, law enforcement, Miller Brewing Company, and an advertising agency (Rothschild et al., 2006).
Although safe ride programs can be modified to specific community needs and can play a role in a community’s broader strategy to reduce alcohol-impaired driving (Decina et al., 2009; Goodwin et al., 2015), there are several shortcomings to these programs. Some programs can only service people in a limited area (e.g., scooter-based programs or rural versus urban programs) or may not be very discreet (e.g., programs that tow a person’s car to their home if they are inebriated). Other safe ride programs require that an individual find their own transportation the following day to reclaim their cars. Depending on the location and target population,
some safe ride programs suffer from low ridership when people opt for other methods of transportation, such as using a designated driver, riding with a family member or friend, taking a taxi or other form of alternative transportation, or opting to drive home on their own (Decina et al., 2009; Lavoie et al., 1999; Molof et al., 1995). For example, 44 percent of participants in a program primarily aimed at men ages 21 to 29 years in Sacramento, California, reported they would have driven themselves home if the safe ride service was not available when they were ready to go home (Sarkar et al., 2005). Successful marketing of programs can be problematic; a study of a program in central New York found half of the people surveyed knew about the program but only 15 percent used it (Molof et al., 1995). Similarly, an evaluation of a free holiday ride service in Canada surveyed 544 young drivers and found that while almost everyone was aware of the program, only 17 percent of those who reported drinking to impairment used the service (compared to 63 percent who said they found another way home and 20 percent who drove impaired) (Lavoie et al., 1999).
Evidence for public transportation Mass transit is generally easy to use and can be less expensive than driving.21 However, there are some disadvantages such as short hours of service, infrequent pickup and drop-off locations, and lack of flexibility that prevent people from using public transportation. Taxis can offer more flexibility when mass transit options are limited, although taxi availability varies considerably in rural areas and may be costly. People may be unfamiliar with mass transit options and may not understand subway or bus systems.
There is a lack of evidence regarding public transportation and impaired driving as it can be difficult to obtain appropriate data and to assess causality. One study of the Phoenix, Arizona, light rail found more frequent light rail use by college students was associated with significantly decreased odds of driving impaired (Broyles, 2014). Additionally, a 2011 study evaluated changes in Washington, DC, metro schedules from 1999 to 2003 that resulted in the system staying open until 3 a.m. on Fridays and Saturdays (Jackson and Owens, 2011). When metro operated until 3 a.m., ridership increased 7 percent per hour. DWIs declined 7 percent per hour of additional service, and alcohol-related arrests increased 8 percent in areas close to a metro station. However, while alcohol-related fatal crashes decreased in areas of DC serviced by metro (including a small
___________________
21 The American Public Transportation Association reports an annual savings of $9,797 if a commuter switches from a car to public transportation (http://www.apta.com/mediacenter/pressreleases/2017/Pages/June-Transit-Savings.aspx) (accessed January 9, 2018).
decrease in Maryland suburbs), there was a small increase in Virginia suburbs not covered by metro (Jackson and Owens, 2011).
Moving Forward
For the reasons above, a NHTSA report on alternative transportation concluded that
At best, [alternative transportation] programs should be viewed as an adjunct to existing transportation programs and ride services…. But there is hope, and these [alternative transportation] programs can complement other programs and services to offer a range of options for all drinkers in a wide variety of circumstances to enhance opportunities for a safe ride home. (Decina et al., 2009, p. 19)
An ideal alternative transportation program aiming to reduce alcohol-impaired driving fatalities would be consistently available, reliable, accessible and easy to use, and free to users.
There is a need for improved studies of alternative and public transportation options and research into how these forms of transportation can best work in concert (complementarity, substitutability, and synergies). Because it can be difficult to obtain the data necessary to conduct a robust study, many studies of safe ride programs rely on crash data, which can be limited because crashes are rare and data from nonfatal crashes are often subjective (Decina et al., 2009). Ideally studies would develop and use relevant outcome measures and aim to assess how alcohol-impaired driving incidence is affected by the availability and use of alternative transportation (Decina et al., 2009). Studies should also evaluate the effect of ridesharing networks on other alcohol-related consequences (e.g., suicides, assault, and injuries).
Although the limited research into alternative transportation options is mixed, the committee believes that this an area that shows great promise. As technology gains in popularity and becomes accessible and available to more individuals and communities, there is an opportunity to use the alternative transportation options previously discussed—smartphone-enabled network ridesharing, safe ride programs, and public transportation (mass transit, taxis, subways, buses, metro)—more broadly to provide options for drivers who have been drinking. Because the committee sees this as a promising strategy for reducing alcohol-related crashes and alcohol-impaired driving injuries and fatalities, the committee recommends the following:
Recommendation 4-4: Municipalities should support policies and programs that increase the availability, convenience,
affordability, and safety of transportation alternatives for drinkers who might otherwise drive. This includes permitting transportation network company ridesharing, enhancing public transportation options (especially during nighttime and weekend hours), and boosting or incentivizing transportation alternatives in rural areas.
RESEARCH NEEDS
To address the research gaps relevant to alcohol-impaired driving interventions, the committee identified the following research needs:
Policies and laws:
- Research into the effectiveness of BAC criminal sanctions versus administrative laws.
- Monitoring and evaluation of the implementation, compliance, and impact of the Utah 0.05% BAC per se law.
- Research on interventions to stop teen and novice drivers from driving after consuming alcohol.
- Development of strategies to prevent passengers from riding in a vehicle driven by an impaired driver, including vehicles driven by teens or novice drivers.
- Research to identify how new drivers ≥18 years of age fare without GDL restrictions and whether driving restrictions should be compulsory for all novice drivers.
Enforcement and arrest:
- Research examining the effectiveness and impact of child endangerment laws to improve their effectiveness and how to increase public awareness of these laws to reduce child fatalities.
- Research to identify ideal frequency of sobriety checkpoints.
- Update current research on the cost-effectiveness of sobriety checkpoints with studies that have rigorous methods and measurements.
- Research to determine how lowering the BAC limit from 0.08% to 0.05% will affect enforcement of BAC per se laws.
Technology and vehicle factors:
- As more cars are manufactured that contain new technology features, studies to determine their effectiveness for reducing the
- incidence of alcohol-related crashes or mitigating crash severity will be needed.
- Future DADSS research could include how to address false positives and negatives from the use of interlock technology, BAC time to peak issues after starting of the vehicle, intervention strategies for continuous monitoring systems, and the effect of vehicle interlocks on personal safety.
Physical environment and transportation:
- Research into the effectiveness of designated driver programs and how they could be utilized to reduce the number of alcohol-impaired drivers.
- Further research into the effectiveness and usefulness of alternative rideshare options, including smartphone-enabled network ridesharing, safe ride programs, and public transportation.
REFERENCES
AAA (American Automobile Association). 2017. Distracted driver and teen driver safety top AAA’s state advocacy agenda for 2013. http://newsroom.aaa.com/tag/aaa-advocacy/ (accessed December 12, 2017).
ABI (American Beverage Institute). 2017a. American Beverage Institute likens Utah’s .05 DUI arrest level to equally silly DWO (driving while older) in full-page ad. https://abionline.org/press_release/american-beverage-institute-likens-utahs-05-dui-arrest-level-to-equally-silly-dwo-driving-while-older-in-full-page-ad (accessed August 7, 2017).
ABI. 2017b. American Beverage Institute warns Idaho vacationers of Utah’s .05 law in full-page Idaho Statesman ad. https://abionline.org/press_release/american-beverage-institute-warns-idaho-vacationers-of-utahs-05-law-in-full-page-idaho-statesman-ad (accessed August 7, 2017).
ABI. 2017c. American Beverage Institute cautions Nevada vacationers of Utah’s .05 law in full-page Las Vegas Review-Journal ad and launches petition opposing .05. https://abionline.org/press_release/american-beverage-institute-cautions-nevada-vacationers-of-utahs-05-law-in-full-page-las-vegas-review-journal-ad-and-launches-petition-opposing-05 (accessed August 7, 2017).
ABI. 2017d. American Beverage Institute petition to “Urge the Utah legislature to repeal the .05 BAC legislation.” http://www.responsiblelimits.com/05-petition (accessed August 10, 2017).
ACLU (American Civil Liberties Union). 2016. Racial disparities in Florida safety belt law enforcement. New York: American Civil Liberties Union.
ACTS (Automotive Coalition for Traffic Safety). 2013. Statement of the Automotive Coalition for Traffic Safety on the National Transportation Safety Board’s (NTSB’s) recommendation regarding a 0.05 blood alcohol concentration (BAC) per se limit. PR Newswire. http://www.prnewswire.com/news-releases/statement-of-the-automotive-coalition-for-traffic-safety-on-the-national-transportation-safety-boards-ntsbs-recommendation-regarding-a-005-blood-alcohol-concentration-bac-per-se-limit-207398711.html (accessed August 18, 2017).
Advocates for Highway and Auto Safety. 2017. Have we forgotten what saves lives?: 2017 roadmap of state highway safety laws. Washington, DC: Advocates for Highway and Auto Safety.
Albalate, D. 2008. Lowering blood alcohol content levels to save lives: The European experience. Journal of Policy Analysis and Management 27(1):20–39.
Alcañiz, M., M. Guillén, M. Santolino, D. Sánchez-Moscona, O. Llatje, and L. Ramon. 2014. Prevalence of alcohol-impaired drivers based on random breath tests in a roadside survey in Catalonia (Spain). Accident Analysis & Prevention 65:131–141.
Amlung, M. T., D. H. Morris, and D. M. McCarthy. 2014. Effects of acute alcohol tolerance on perceptions of danger and willingness to drive after drinking. Psychopharmacology 231(22):4271–4279.
Anderson, P., D. Chisholm, and D. C. Fuhr. 2009a. Effectiveness and cost-effectiveness of policies and programmes to reduce the harm caused by alcohol. The Lancet 373(9682): 2234–2246.
Anderson, P., A. de Bruijn, K. Angus, R. Gordon, and G. Hastings. 2009b. Impact of alcohol advertising and media exposure on adolescent alcohol use: A systematic review of longitudinal studies. Alcohol & Alcoholism 44(3):229–243.
Andreuccetti, G., H. B. Carvalho, C. J. Cherpitel, Y. Ye, J. C. Ponce, T. Kahn, and V. Leyton. 2011. Reducing the legal blood alcohol concentration limit for driving in developing countries: A time for change? Results and implications derived from a time-series analysis (2001–10) conducted in Brazil. Addiction 106(12):2124–2131.
APIS (Alcohol Policy Information System). 2016. Blood alcohol concentration (BAC) limits: Adult operators of noncommercial motor vehicles. https://alcoholpolicy.niaaa.nih.gov/Blood_Alcohol_Concentration_Limits_Adult_Operators_of_Noncommercial_Motor_Vehicles.html (accessed March 30, 2017).
APIS. n.d. Highlight on underage drinking. https://alcoholpolicy.niaaa.nih.gov/Underage-Drinking.html (accessed March 30, 2017).
Apsler, R., T. M. Klein, W. M. Harding, and A. Char. 1999. The effects of 0.08 BAC laws. Washington, DC: National Highway Traffic Safety Administration.
Arthurson, R. M. 1985. Evaluation of random breath testing. Sidney, Australia: Traffic Authority of New South Wales.
Ascarelli, B. 2014. Automatic sobriety checkpoints aim to bar drunk drivers. http://sverigesradio.se/sida/artikel.aspx?programid=2054&artikel=5963580 (accessed August 18, 2017).
Barry, A. E., B. H. Chaney, and M. L. Stellefson. 2013. Breath alcohol concentrations of designated drivers. Journal of Studies on Alcohol and Drugs 74(4):509–513.
Bartl, G., and R. Esberger. 2000. Effects of lowering the legal BAC limit in Austria. Paper read at Proceedings of the 15th International Conference on Alcohol, Drugs and Traffic Safety, Stockholm, Sweden.
Beck, K. H., and M. L. Moser. 2004. Exposure to the sobriety “checkpoint strikeforce” campaign in Maryland: Impact on driver perceptions of vulnerability and behavior. Traffic Injury Prevention 5(2):101–106.
Bergen, G., A. Pitan, S. Qu, R. A. Shults, S. K. Chattopadhyay, R. W. Elder, D. A. Sleet, H. L. Coleman, R. P. Compton, and J. L. Nichols. 2014a. Publicized sobriety checkpoint programs: A community guide systematic review. American Journal of Preventive Medicine 46(5):529–539.
Bergen, G., J. Yao, R. A. Shults, E. Romano, and J. H. Lacey. 2014b. Characteristics of designated drivers and their passengers from the 2007 National Roadside Survey in the United States. Traffic Injury Prevention 15(3):273–277.
Bergum, A., B. Catlin, J. Willems Van Dijk, and K. Timberlake. 2016. What works? Strategies to improve rural health. Madison, WI: University of Wisconsin Population Health Institute.
Bernat, D. H., W. T. Dunsmuir, and A. C. Wagenaar. 2004. Effects of lowering the legal BAC to 0.08 on single-vehicle-nighttime fatal traffic crashes in 19 jurisdictions. Accident Analysis & Prevention 36(6):1089–1097.
Bernhoft, I. M., and I. Behrensdorff. 2003. Effect of lowering the alcohol limit in Denmark. Accident Analysis & Prevention 35(4):515–525.
Blais, É., F. Bellavance, A. Marcil, and L. Carnis. 2015. Effects of introducing an administrative .05% blood alcohol concentration limit on law enforcement patterns and alcohol-related collisions in Canada. Accident Analysis & Prevention 82:101–111.
Blomberg, R. D. 1992. Lower BAC limits for youth: Evaluation of the Maryland .02 law. Washington, DC: National Highway Traffic Safety Administration.
Blomberg, R. D., R. C. Peck, H. Moskowitz, M. Burns, and D. Fiorentino. 2005. Crash risk of alcohol involved driving: A case-control study. Stamford, CT: Dunlap and Associates, Inc.
Boots, K., and R. Midford. 1999. “Pick-a-skipper”: An evaluation of a designated driver program to prevent alcohol-related injury in a regional Australian city. Health Promotion International 14(4):337–345.
Borkenstein, R. F., R. Crowther, R. Shumate, W. B. Ziel, and R. Zylman. 1974. The role of the drinking driver in traffic accidents (the Grand Rapids Study). Blutalkohol 11(Suppl): 1–131.
Brazil, N., and D. S. Kirk. 2016. Uber and metropolitan traffic fatalities in the United States. American Journal of Epidemiology 184(3):192–198.
Breitmeier, D., I. Seeland-Schulze, H. Hecker, and U. Schneider. 2007. The influence of blood alcohol concentrations of around 0.03% on neuropsychological functions—a double-blind, placebo-controlled investigation. Addiction Biology 12(2):183–189.
Brooks, C., and D. Zaal. 1992. Effects of a reduced alcohol limit for driving. Paper read at Proceedings International Council on Alcohol, Drugs and Traffic Safety Conference, Cologne, Germany.
Broyles, J. 2014. Drinking and driving and public transportation: A test of the routine activity framework. Thesis. Tempe: Arizona State University.
Burton, R., C. Henn, D. Lavoie, R. O’Connor, C. Perkins, K. Sweeney, F. Greaves, B. Ferguson, C. Beynon, A. Belloni, V. Musto, J. Marsden, and N. Sheron. 2017. A rapid evidence review of the effectiveness and cost-effectiveness of alcohol control policies: An English perspective. The Lancet 389(10078):1558–1580.
Byrne, P. A., T. Ma, R. E. Mann, and Y. Elzohairy. 2016. Evaluation of the general deterrence capacity of recently implemented (2009–2010) low and zero BAC requirements for drivers in Ontario. Accident Analysis & Prevention 88(5):56–67.
Calhoun, V. D., J. J. Pekar, and G. D. Pearlson. 2004. Alcohol intoxication effects on simulated driving: Exploring alcohol-dose effects on brain activation using functional MRI. Neuropsychopharmacology 29(11):2097–2107.
Cavanaugh, M., P. Lane, and J. C. Frey. 2012. Escondido police under fire: Many more undocumented Latinos nabbed than drunks at DUI checkpoint. http://www.kpbs.org/news/2012/mar/12/escondido-police-under-fire (accessed August 18, 2017).
CDC (Centers for Disease Control and Prevention). 2012. Vital signs: Drinking and driving among high school students aged ≥16 years—United States, 1991–2011. Morbidity and Mortality Weekly Report 61(39):796–800.
CDC. 2016. Graduated driver licensing system, planning guide. https://www.cdc.gov/motorvehiclesafety/pdf/teen/gdl_planning_guide-a.pdf (accessed August 11, 2017).
Chamberlain, E., and R. Solomon. 2002. The case for a 0.05% criminal law blood alcohol concentration limit for driving. Injury Prevention 8(Suppl 3):iii–1.
Chang, H. L., and C. K. Shih. 2012. Using a multidimensional Rasch model approach to measure the police’s perceived ability to detect, detain and intercept DWI vehicles when conducting sobriety checkpoints. Accident Analysis & Prevention 48:505–517.
Cheng, S.-Y., J.-C. Lee, H.-Y. Lee, and S.-Y. Tsai. 2010. Comparing the effects of light alcohol consumption on human response to auditory and visual stimuli. Perceptual and Motor Skills 111(2):589–607.
Chuliá, H., M. Guillen, and O. Llatje. 2016. Seasonal and time-trend variation by gender of alcohol-impaired drivers at preventive sobriety checkpoints. Journal of Studies on Alcohol and Drugs 77(3):413–420.
Cicchino, J. B. 2017. Insurance Institute for Highway Safety activities on alcohol-impaired driving. PowerPoint presentation to the Committee on Accelerating Progress to Reduce Alcohol-Impaired Driving Fatalities in Washington DC, March 22, 2017. http://nationalacademies.org/hmd/~/media/Files/Activity%20Files/AcceleratingProgresstoReduceAlcoholImpairedDrivingFatalities/22%20March%202017/9%20Jessica%20Cicchino.pdf (accessed September 7, 2017).
Cicchino, J. B., and D. S. Zuby. 2017. Prevalence of driver physical factors leading to unintentional lane departure crashes. Traffic Injury Prevention 18(5):481–487.
Community Preventive Services Task Force. 2000. Motor vehicle injury—Alcohol-impaired driving: 0.08% blood alcohol concentration (BAC) laws. https://www.thecommunityguide.org/findings/motor-vehicle-injury-alcohol-impaired-driving-008-blood-alcohol-concentration-bac-laws (accessed August 7, 2017).
Connor, J., R. Norton, S. Ameratunga, and R. Jackson. 2004. The contribution of alcohol to serious car crash injuries. Epidemiology 15(3):337–344.
Creaser, J. I., N. J. Ward, M. E. Rakauskas, C. Shankwitz, and E. R. Boer. 2009. Effects of alcohol impairment on motorcycle riding skills. Accident Analysis & Prevention 41(5): 906–913.
Cromer, J. R., J. A. Cromer, P. Maruff, and P. J. Snyder. 2010. Perception of alcohol intoxication shows acute tolerance while executive functions remain impaired. Experimental and Clinical Psychopharmacology 18(4):329–339.
Curry, A. E., K. B. Metzger, A. F. Williams, and B. C. Tefft. 2017. Comparison of older and younger novice driver crash rates: Informing the need for extended graduated driver licensing restrictions. Accident Analysis & Prevention 108:66–73.
DADSS (Driver Alcohol Detection System for Safety). 2016a. Touch-based technology. http://www.dadss.org/wp-content/uploads/2015/10/DADSSTouchBasedTechnology.pdf (accessed March 16, 2017).
DADSS. 2016b. Breath-based technology. http://www.dadss.org/wp-content/uploads/2015/10/DADSSBreathBasedTechnology.pdf (accessed March 16, 2017).
DADSS. 2016c. DADSS partners with state of Virginia. http://www.dadss.org/dadss-program-partners-with-state-of-virginia (accessed May 18, 2017).
DADSS. n.d.-a. Frequently asked questions. http://www.dadss.org/faq (accessed July 3, 2017).
DADSS. n.d.-b. Our supporters. http://www.dadss.org/our-supporters (accessed July 3, 2017).
De Sanctis, V., N. Soliman, A. T. Soliman, H. Elsedfy, S. Di Maio, M. El Kholy, and B. Fiscina. 2017. Caffeinated energy drink consumption among adolescents and potential health consequences associated with their use: A significant public health hazard. Acta Biomedica 88(2):222–231.
Decina, L. E., R. Foss, M. E. Tucker, A. Goodwin, and J. Sohn. 2009. Alternative transportation programs: A countermeasure for reducing impaired driving. Washington, DC: National Highway Traffic Safety Administration.
Dee, T. S. 2001. Does setting limits save lives? The case of 0.08 BAC laws. Journal of Policy Analysis and Management 20(1):111–128.
DeJong, W., and L. Wallack. 1992. The role of designated driver programs in the prevention of alcohol-impaired driving: A critical reassessment. Health Education Quarterly 19(4):429–442.
Desapriya, E., and N. Iwase. 1996. Are lower legal blood alcohol limits and a combination of sanctions desirable in reducing drunken driver-involved traffic fatalities and traffic accidents? Accident Analysis & Prevention 28(6):721–731.
Desapriya, E., I. Pike, S. Subzwari, G. Scime, and S. Shimizu. 2007. Impact of lowering the legal blood alcohol concentration limit to 0.03 on male, female and teenage drivers involved in alcohol-related crashes in Japan. International Journal of Injury Control and Safety Promotion 14(3):181–187.
Dills, A. K., and S. E. Mulholland. 2016. Ride-sharing, fatal crashes, and crime. https://ssrn.com/abstract=2783797 (accessed September 5, 2017).
Ditsuwan, V., J. L. Veerman, M. Bertram, and T. Vos. 2015. Sobriety checkpoints in Thailand: A review of effectiveness and developments over time. Asia-Pacific Journal of Public Health 27(2):NP2177–NP2187.
Ditter, S. M., R. W. Elder, R. A. Shults, D. A. Sleet, R. Compton, and J. L. Nichols. 2005. Effectiveness of designated driver programs for reducing alcohol-impaired driving: A systematic review. American Journal of Preventive Medicine 28(5S):280–287.
DOT (U.S. Department of Transportation). 1998. TEA-21: Moving Americans into the 21st century. https://www.fhwa.dot.gov/tea21 (accessed May 23, 2017).
DOT. n.d.-a. Vehicle-to-infrastructure (v2i) resources. https://www.its.dot.gov/v2i (accessed August 21, 2017).
DOT. n.d.-b. Vehicle-to-vehicle (v2v) communications for safety. https://www.its.dot.gov/research_archives/safety/v2v_comm_safety.htm (accessed August 21, 2017).
Eby, D. W., L. J. Molnar, L. P. Kostyniuk, R. M. St. Louis, N. Zanier, J. M. Lepkowski, and G. Bergen. 2017. Perceptions of alcohol-impaired driving and the blood alcohol concentration standard in the United States. Journal of Safety Research 63:73–81.
Eichelberger, A. H., and A. T. McCartt. 2016. Impaired driving enforcement practices among state and local law enforcement agencies in the United States. Journal of Safety Research 58:41–47.
Elam, C., R. N. McKaig, B. Jacobs, M. Whitlow, and K. R. Gros Louis. 2006. Examining a safe ride program: An assessment of the midnight special late night bus service. NASPA Journal 43(2):358–376.
Erickson, D. J., K. Farbakhsh, T. L. Toomey, K. M. Lenk, R. Jones-Webb, and T. F. Nelson. 2015. Enforcement of alcohol-impaired driving laws in the United States: A national survey of state and local agencies. Traffic Injury Prevention 16(6):533–539.
Erke, A., C. Goldenbeld, and T. Vaa. 2009. The effects of drink-driving checkpoints on crashes—A meta-analysis. Accident Analysis & Prevention 41(5):914–923.
Esser, M. B., J. Bao, D. H. Jernigan, and A. A. Hyder. 2016. Evaluation of the evidence base for the alcohol industry’s actions to reduce drink driving globally. American Journal of Public Health 106(4):707–713.
Factor, R., D. R. Williams, and I. Kawachi. 2013. Social resistance framework for understanding high-risk behavior among nondominant minorities: Preliminary evidence. American Journal of Public Health 103(12):2245–2251.
Farmer, C. M., and J. K. Wells. 2010. Effect of enhanced seat belt reminders on driver fatality risk. Journal of Safety Research 41(1):53–57.
Farmer, C. M., and A. F. Williams. 2005. Effect on fatality risk of changing from secondary to primary seatbelt enforcement. Journal of Safety Research 36(2):189–194.
Faulks, I. J. 2014. Self-driving cars will not help the drinking driver. The conversation. http://theconversation.com/self-driving-cars-will-not-help-the-drinking-driver-31747 (accessed August 21, 2017).
Fell, J. C., and C. Compton. 2007. Evaulation of the use and benefit of passive alcohol sensors during routine traffic stops. Annual Proceedings for the Association for the Advancement of Automotive Research 51:437–448.
Fell, J. C., and M. Scherer. 2017. Estimation of the potential effectiveness of lowering the blood alcohol concentration (BAC) limit for driving from 0.08 to 0.05 grams per deciliter in the United States. Alcoholism, Clinical and Experimental Research. doi: 10.1111/acer.13501. [Epub ahead of print.]
Fell, J. C., and R. B. Voas. 2006. Mothers Against Drunk Driving (MADD): The first 25 years. Traffic Injury Prevention 7(3):195–212.
Fell, J. C., R. B. Voas, and J. E. Lange. 1997. Designated driver concept: Extent of use in the USA. Journal of Traffic Medicine 25(3-4):109–114.
Fell, J. C., S. A. Ferguson, A. F. Williams, and M. Fields. 2003. Why are sobriety checkpoints not widely adopted as an enforcement strategy in the United States? Accident Analysis & Prevention 35(6):897–902.
Fell, J. C., E. A. Langston, and A. S. Tippetts. 2005. Evaluation of four state impaired driving enforcement demonstration programs: Georgia, Tennessee, Pennsylvania and Louisiana. Annual Proceedings of the Association for the Advancement of Automotive Medicine 49:311–326.
Fell, J. C., A. S. Tippetts, and M. Levy. 2008. Evaluation of seven publicized enforcement demonstration programs to reduce impaired driving: Georgia, Louisiana, Pennsylvania, Tennessee, Texas, Indiana, and Michigan. Annals in Advances of Automotive Medicine 52:23–38.
Fell, J. C., D. A. Fisher, R. B. Voas, K. Blackman, and A. S. Tippetts. 2009. The impact of underage drinking laws on alcohol-related fatal crashes of young drivers. Alcoholism, Clinical and Experimental Research 33(7):1208–1219.
Fell, J. C., K. Jones, E. Romano, and R. Voas. 2011. An evaluation of graduated driver licensing effects on fatal crash involvements of young drivers in the United States. Traffic Injury Prevention 12(5):423–431.
Fell, J. C., M. Scherer, S. Thomas, and R. B. Voas. 2016. Assessing the impact of twenty underage drinking laws. Journal of Studies on Alcohol and Drugs 77(2):249–260.
FHWA (Federal Highway Administration). n.d. Fixing America’s Surface Transportation Act or “Fast Act”. https://www.fhwa.dot.gov/fastact (accessed July 3, 2017).
Fillmore, M. T., C. A. Marczinski, and A. M. Bowman. 2005. Acute tolerance to alcohol effects on inhibitory and activational mechanisms of behavioral control. Journal of Studies on Alcohol 66(5):663–672.
Filtness, A. J., C. M. Rudin-Brown, C. Mulvihill, and M. G. Lenné. 2013. Impairment of simulated motorcycle riding performance under low dose alcohol. Accident Analysis & Prevention 50:608–615.
FMCSA (Federal Motor Carrier Safety Administration). n.d. MAP-21—Moving Ahead for Progress in the 21st Century Act. https://www.fmcsa.dot.gov/mission/policy/map-21-moving-ahead-progress-21st-century-act (accessed July 3, 2017).
Foss, R. D., D. J. Beirness, and K. Sprattler. 1994. Seat belt use among drinking drivers in Minnesota. American Journal of Public Health 84(11):1732–1737.
Foss, R. D., J. R. Stewart, and D. W. Reinfurt. 2001. Evaluation of the effects of North Carolina’s 0.08% AC law. Accident Analysis & Prevention 33(4):507–517.
Freedman, M., S. Lavi, P. Zador, and J. Lopdell. 2007. The effectiveness of enhanced seat belt reminder systems: Observational field data collection methodology and findings. DOT HS 810 844. Washington, DC: National Highway Traffic Safety Administration.
Freeman, D. G. 2007. Drunk driving legislation and traffic fatalities: New evidence on BAC 08 laws. Contemporary Economic Policy 25(3):293–308.
Freydier, C., C. Berthelon, M. Bastien-Toniazzo, and G. Gineyt. 2014. Divided attention in young drivers under the influence of alcohol. Journal of Safety Research 49(13):e11–e18.
Friedman, T. W., S. R. Robinson, and G. W. Yelland. 2011. Impaired perceptual judgment at low blood alcohol concentrations. Alcohol 45(7):711–718.
Gabrielson, R. 2010. Car seizures at DUI checkpoints prove profitable for cities, raise legal questions. California Watch. https://alethonews.wordpress.com/2010/02/16/car-seizures-at-dui-checkpoints-prove-profitable-for-cities-raise-legal-questions (accessed September 7, 2017).
García Moreno, L. M., A. Capilla, O. García Sánchez, J. Luque, K. Senderek, N. M. Conejo, and J. L. Arias. 2004. Alcohol tolerance in rats submitted to different periods of chronic and acute ethanol intake. Psicothema 16(2):211–216.
GHSA (Governors Highway Safety Association). 2011. 2011 winner: No Refusal program. http://www.ghsa.org/about/safety-awards/2011-winner-no-refusal-program (accessed December 2, 2017).
GHSA. n.d. Sobriety checkpoints. http://www.ghsa.org/state-laws/issues/Sobriety-Checkpoints (accessed August 14, 2017).
Goodwin, A., R. Foss, J. Hedlund, J. Sohn, R. Pfefer, T. R. Neuman, K. L. Slack, and K. K. Hardy. 2005. Guidance for implementation of the AASHTO strategic highway safety plan volume 16: A guide for reducing alcohol-related collisions. Washington, DC: Transportation Research Board.
Goodwin, A., L. Thomas, B. Kirley, W. Hall, N. O’Brien, and K. Hill. 2015. Countermeasures that work: A highway safety countermeasure guide for state highway safety offices, eighth edition. DOT HS 812 202. Washington, DC: National Highway Traffic Safety Administration.
Gorman, D. M., J. C. Huber, and S. E. Carozza. 2006. Evaluation of the Texas 0.08 BAC law. Alcohol and Alcoholism 41(2):193–199.
Greenwood, B. N., and S. Wattal. 2017. Show me the way to go home: An empirical investigation of ride-sharing and alcohol related motor vehicle fatalities. Management Information Systems Quarterly 41(1):163–187.
Griffin, J. T. 2017. MADD. Campaign to eliminate drunk driving: Update. PowerPoint presentation to the Committee on Accelerating Progress to Reduce Alcohol-Impaired Driving Fatalities in Washington DC, March 22, 2017. http://www.nationalacademies.org/hmd/~/media/Files/Activity%20Files/AcceleratingProgresstoReduceAlcoholImpairedDrivingFatalities/22%20March%202017/8%20JT%20Griffin.pdf (accessed July 3, 2017).
Haegerich, T. M., R. A. Shults, R. F. Oman, and S. K. Vesely. 2016. The predictive influence of youth assets on drinking and driving behaviors in adolescence and young adulthood. Journal of Primary Prevention 37(3):231–245.
Harding, W. M., B. D. Caudill, and B. A. Moore. 2001. Do companions of designated drivers drink excessively? Journal of Substance Abuse 13(4):505–514.
Harvard School of Public Health. n.d. Harvard alcohol project. https://www.hsph.harvard.edu/chc/harvard-alcohol-project (accessed June 7, 2017).
Hawaii State Legislature. 2017. SB18: Relating to the use of intoxicants while operating a vehicle. https://www.capitol.hawaii.gov/Archives/measure_indiv_Archives.aspx?billtype=SB&billnumber=18&year=2017 (accessed December 12, 2017).
Hedlund, J. 2017. Autonomous vehicles meet human drivers: Traffic safety issues for states. Washington, DC: Governors Highway Safety Association.
Henstridge, J., R. Homel, and P. M. Mackay. 1997. The long-term effects of random breath testing in four Australian states: A time series analysis. Canberra, Australia: Federal Office of Road Safety.
Hingson, R., T. Heeren, and M. Winter. 1996. Lowering state legal blood alcohol limits to 0.08%: The effect on fatal motor vehicle crashes. American Journal of Public Health 86(9):1297−1299.
Høiseth, G., J. P. Bernard, N. Stephanson, P. T. Normann, A. S. Christophersen, J. Mørland, and A. Helander. 2008. Comparison between the urinary alcohol markers EtG, EtS, and GTOL/5-HIAA in a controlled drinking experiment. Alcohol & Alcoholism 43(2):187–191.
Høiseth, G., B. Yttredal, R. Karinen, H. Gjerde, J. Mørland, and A. Christophersen. 2010. Ethyl glucuronide concentrations in oral fluid, blood, and urine after volunteers drank 0.5 and 1.0 g/kg doses of ethanol. Journal of Analytical Toxicology 34(6):319–324.
Huseth, A. 2012. Alcohol-impaired driving: Common practices and performance. Fargo: Rural Transportation Safety and Security Center, Upper Great Plains Transportation Institute, North Dakota State University.
IIHS (Insurance Institute for Highway Safety). 2005. Sobriety checkpoints deter impaired drivers. Status Report 40(4). http://www.iihs.org/iihs/sr/statusreport/article/40/4/2 (accessed July 3, 2017).
IIHS. 2017. Safety belts. http://www.iihs.org/iihs/topics/t/safety-belts/qanda (accessed December 3, 2017).
IIHS and HLDI (Highway Loss Data Institute). 2009. Alcohol detection devices for all drivers garner widespread support. Status Report 44(8). http://www.iihs.org/iihs/sr/statusreport/article/44/8/1 (accessed July 3, 2017).
IIHS and HLDI. 2017. Impaired driving: Deterrence and enforcement. http://www.iihs.org/iihs/topics/t/impaired-driving/qanda#alcohol--deterrence-and-enforcement (accessed December 5, 2017).
Irwin, C., E. Iudakhina, B. Desbrow, and D. McCartney. 2017. Effects of acute alcohol consumption on measures of simulated driving: A systematic review and meta-analysis. Accident Analysis & Prevention 102:248–266.
Jackson, C. K., and E. G. Owens. 2011. One for the road: Public transportation, alcohol consumption, and intoxicated driving. Journal of Public Economics 95(1):106–121.
Jewett, A., R. A. Shults, T. Banerjee, and G. Bergen. 2015. Alcohol-impaired driving among adults—United States, 2012. Morbidity and Mortality Weekly Report 64(30):814–817.
Johnson, M. B. 2016. A successful high-visibility enforcement intervention targeting underage drinking drivers. Addiction 111(7):1196–1202.
Kahane, C. J. 2015. Lives saved by vehicle safety technologies and associated federal motor vehicle safety standards, 1960 to 2012-passenger cars and LTVs. DOT HS 812 069. Washington, DC: U.S. Department of Transportation.
Kelley-Baker, T., and E. Romano. 2014. Child passengers killed in reckless and alcohol-related motor vehicle crashes. Journal of Safety Research 48:103–110.
Kelley-Baker, T., and E. Romano. 2016. An examination of the effectiveness of child endangerment laws in preventing child fatalities in alcohol-involved motor vehicle crashes. Journal of Studies on Alcohol and Drugs 77(5):828–833.
Kelly, A. T., and A. Mozayani. 2012. An overview of alcohol testing and interpretation in the 21st century. Journal of Pharmacy Practice 25(1):30–36.
King, J. Y., and M. Tipperman. 1975. The offense of driving while intoxicated: The development of statutory and case law in New York. Hofstra Law Review 3(3):541–604.
Kloeden, C., and A. J. McLean. 1994. Late night drink driving in Adelaide two years after the introduction of the 0.05 limit. Walkerville, South Australia: Department of Road Transport, Office of Road Safety.
Knott, M. 2017. “Drunk robots”: How driverless cars could leave humans behind within five years. The Sydney Morning Herald. http://www.smh.com.au/federal-politics/political-news/drunk-robots-how-driverless-cars-could-leave-humans-behind-within-five-years-20170222-guir7t.html (accessed August 22).
Krüger, H.-P., and M. Vollrath. 2004. The alcohol-related accident risk in Germany: Procedure, methods and results. Accident Analysis & Prevention 36(1):125–133.
Krüger, H.-P., E. Schulz, and H. Magerl. 1995. The German Roadside Survey 1992–1994. Saliva analyses from an unselected driver population: Licit and illicit drugs. Paper read at T’95 Proceedings of the 13th International Conference on Alcohol, Drugs and Traffic Safety, Adelaide, Australia.
Kusano, K. D., and H. C. Gabler. 2015. Comparison of expected crash and injury reduction from production forward collision and lane departure warning systems. Traffic Injury Prevention 16(Suppl 2):S109–S114.
Kweon, Y.-J., and K. M. Kockelman. 2006. Driver attitudes and choices: Speed limits, seat belt use, and drinking-and-driving. Journal of the Transportation Research Forum 45(3):39–56.
Kwo, P. Y., V. A. Ramchandani, S. O’Connor, D. Amann, L. G. Carr, K. Sandrasegaran, K. K. Kopecky, and T.-K. Li. 1998. Gender differences in alcohol metabolism: Relationship to liver volume and effect of adjusting for body mass. Gastroenterology 115(6):1552–1557.
Lacey, J. H., R. K. Jones, and E. Anderson. 2000. Evaluation of a full-time ride service program: Aspen, Colorado’s tipsy taxi service. Washington, DC: National Highway Traffic Safety Administration.
Lacey, J. H., S. A. Ferguson, T. Kelley-Baker, and R. P. Rider. 2006. Low-manpower checkpoints: Can they provide effective DUI enforcement in small communities? Traffic Injury Prevention 7(3):213–218.
Lacey, J. H., T. Kelley-Baker, A. Berning, E. Romano, A. Ramirez, J. Yao, C. Moore, K. Brainard, K. Carr, K. Pell, and R. Compton. 2016. Drug and alcohol crash risk: A case-control study. Washington, DC: National Highway Traffic Safety Administration.
Lalanne, L., P. E. Lutz, and F. Paille. 2017. Acute impact of caffeinated alcoholic beverages on cognition: A systematic review. Progress in Neuropsychopharmacology and Biological Psychiatry 76:188–194.
Lange, J. E., and R. B. Voas. 1998. Nighttime observations of safety belt use: An evaluation of California’s primary law. American Journal of Public Health 88(11):1718–1720.
Lange, J. E., R. B. Voas, and P. O’Rourke. 1998. What is designated driver anyway?: Results of a California survey on definitions and use of designated drivers. Journal of Traffic Medicine 26(3–4):101–108.
Lapham, S. C. 2010. The limits of tolerance: Convicted alcohol-impaired drivers share experiences driving under the influence. Permanente Journal 14(2):26.
Lavoie, M., G. Godin, and P. Valois. 1999. Understanding the use of a community-based drive-home service after alcohol consumption among young adults. Journal of Community Health 24(3):171–186.
Lenk, K. M., T. F. Nelson, T. L. Toomey, R. Jones-Webb, and D. J. Erickson. 2016. Sobriety checkpoint and open container laws in the United States: Associations with reported drinking-driving. Traffic Injury Prevention 17(8):782–787.
Levine, B. 2006. Central nervous system depressants: Miscellaneous. In Principles of forensic toxicology. 2nd ed. Washington, DC: American Association for Clinical Psychology. P. 216.
Levitt, M. D., R. Li, E. G. Demaster, M. Elson, J. Furne, and D. G. Levitt. 1997. Use of measurements of ethanol absorption from stomach and intestine to assess human ethanol metabolism. American Journal of Physiology-Gastrointestinal and Liver Physiology 273(4):G951–G957.
Li, K., B. G. Simons-Morton, and R. Hingson. 2013. Impaired-driving prevalence among US high school students: Associations with substance use and risky driving behaviors. American Journal of Public Health 103(11):e71−e77.
Li, T. K., J. D. Beard, W. E. Orr, P. Y. Kwo, and V. A. Ramchandani. 1998. Gender and ethnic differences in alcohol metabolism. Alcoholism: Clinical and Experimental Research 22(3):771–772.
Liang, L., and J. Huang. 2008. Go out or stay in? The effects of zero tolerance laws on alcohol use and drinking and driving patterns among college students. Health Economics 17(11):1261–1275.
LII (Legal Information Institute). n.d. Per se. https://www.law.cornell.edu/wex/per_se (accessed August 21, 2017).
Litman, T. A. 2017. Autonomous vehicle implementation predictions: Implications for transport planning. Paper presented at 2015 Transportation Research Board Annual Meeting, Washington, DC.
Liu, Y.-C., and C. H. Ho. 2010. Effects of different blood alcohol concentrations and post-alcohol impairment on driving behavior and task performance. Traffic Injury Prevention 11(4):334–341.
MADD (Mothers Against Drunk Driving). 2017. MADD website: The Path to 0. https://www.madd.org/the-solution/drunk-driving/ (accessed December 12, 2017).
Mann, R. E., S. Macdonald, G. Stoduto, S. Bondy, B. Jonah, and A. Shaikh. 2001. The effects of introducing or lowering legal per se blood alcohol limits for driving: An international review. Accident Analysis & Prevention 33(5):569–583.
Martin-Buck, F. 2016. Driving safety: An empirical analysis of ridesharing’s impact on drunk driving and alcohol-related crime. http://www.frankmartinbuck.com/Ridesharing%20and%20Alcohol-Related%20Crime%20by%20Frank%20Martin-Buck.pdf (accessed September 11, 2017).
Masten, S. V., and R. D. Foss. 2010. Long-term effect of the North Carolina graduated driver licensing system on licensed driver crash incidence: A 5-year survival analysis. Accident Analysis and Prevention 42(6):1647–1652.
Masten, S. V., R. D. Foss, and S. W. Marshall. 2011. Graduated driver licensing and fatal crashes incolving 16- to 19-year old drivers. JAMA 306(10):1098–1103.
McCartt, A. T., and V. S. Northrup. 2004. Factors related to seat belt use among fatally injured teenage drivers. Journal of Safety Research 35(1):29–38.
McCartt, A. T., E. R. Teoh, M. Fields, K. A. Braitman, and L. A. Hellinga. 2010. Graduated licensing laws and fatal crashes of teenage drivers: A national study. Traffic Injury Prevention 11(3):240–248.
McLean, A., C. N. Kloeden, R. McColl, and R. Laslett. 1995. Reduction in the legal blood alcohol limit from 0.08 to 0.05: Effects on drink driving and alcohol-related crashes in Adelaide. Alcohol, Drugs and Traffic Safety 1:373–377.
Mercier-Guyon, C. 1998. Lowering the BAC limit to 0.05: Results of the French experience. Paper read at Transportation Research Board 77th Annual Meeting, Washington, DC.
Meskali, M., S. Hirt, I. Aillerie, G. Gineyt, N. Louveton, and C. Berthelon. 2011. Effect of moderated doses of alcohol on behavior of drivers confronted to simulated scenarios of accident. Advances in Transportation Studies (25):91–96.
Mets, M. A., E. Kuipers, L. M. Senerpont Domis, M. Leenders, B. Olivier, and J. C. Verster. 2011. Effects of alcohol on highway driving in the STI Sim driving simulator. Human Psychopharmacology: Clinical and Experimental 26(6):434–439.
Miller, T. R., M. S. Galbraith, and B. A. Lawrence. 1998. Costs and benefits of a community sobriety checkpoint program. Journal of Studies on Alcohol 59(4):462–468.
Miller, T., M. Blewden, and J.-F. Zhang. 2004. Cost savings from a sustained compulsory breath testing and media campaign in New Zealand. Accident Analysis & Prevention 36(5):783–794.
Mishra, L., S. Sharma, J. J. Potter, and E. Mezey. 1989. More rapid elimination of alcohol in women as compared to their male siblings. Alcoholism: Clinical and Experimental Research 13(6):752–754.
Mitchell, Jr., M. C., E. L. Teigen, and V. A. Ramchandani. 2014. Absorption and peak blood alcohol concentration after drinking beer, wine, or spirits. Alcoholism: Clinical and Experimental Research 38(5):1200−1204.
Molnar, L. J., D. W. Eby, L. P. Kostyniuk, R. M. St. Louis, and N. Zanier. 2017. Stakeholder perceptions of lowering the blood alcohol concentration standard in the United States. Annals of Epidemiology 27(12):757–762.
Molof, M. J., J. Dresser, S. Ungerleider, C. Kimball, and J. Schaefer. 1995. Assessment of year-round and holiday ride service programs. DOT HS 808 203. Washington, DC: National Highway Traffic Safety Administration.
Moore, C., and L. Pierce. 2016. Reactance to transgressors: Why authorities deliver harsher penalties when the social context elicits expectations of leniency. Frontiers in Psychology 7(550):1–17.
Morrison, C. N., S. F. Jacoby, B. Dong, M. Delgado, and D. J. Wiebe. 2017. Ridesharing and motor vehicle crashes in four US cities: An interrupted time series analysis. American Journal of Epidemiology, June 14.
Moskowitz, H., and D. Fiorentino. 2000. A review of the literature on the effects of low doses of alcohol on driving-related skills. Washington, DC: National Highway Traffic Safety Administration.
Moskowitz, H., P. Zador, A. Smiley, D. Fiorentino, and M. Burns. 2000. Driver characteristics and impairment at various BACs. Washington, DC: National Highway Traffic Safety Administration.
Mumenthaler, M. S., J. L. Taylor, R. O’Hara, and J. A. Yesavage. 1999. Gender differences in moderate drinking effects. Alcohol Research and Health 23(1):55–64.
Nagata, T., D. Hemenway, and M. J. Perry. 2006. The effectiveness of a new law to reduce alcohol-impaired driving in Japan. Japan Medical Association Journal 49(11):365–369.
Nagata, T., S. Setoguchi, D. Hemenway, and M. J. Perry. 2008. Effectiveness of a law to reduce alcohol-impaired driving in Japan. Injury Prevention 14(1):19–23.
Nagin, D. S. 2013. Deterrence in the 21st century: A review of the evidence. Crime and Justice: An Annual Review of Research 42:199–263.
Nakahara, S., K. Katanoda, and M. Ichikawa. 2013. Onset of a declining trend in fatal motor vehicle crashes involving drunk-driving in Japan. Journal of Epidemiology 23(3):195–204.
NASEM (National Academies of Sciences, Engineering, and Medicine). 2016. Between public and private mobility: Examining the rise of technology-enabled transportation services. Washington, DC: The National Academies Press. https://doi.org/10.17226/21875.
Naz, S., and B. Scott-Parker. 2017. Obstacles to engaging in young driver licensing: Perspectives of parents. Accident Analysis & Prevention 99(Pt A):312–320.
NCSA (National Center for Statistical Analysis). 2017. Occupant protection in passenger vehicles: 2015 data. DOT HS 812 374. Washington, DC: National Highway Traffic Safety Administration.
NCSL (National Conference of State Legislatures). 2017. Autonomous vehicles. http://www.ncsl.org/research/transportation/autonomous-vehicles-self-driving-vehicles-enacted-legislation.aspx (accessed August 21, 2017).
NDAA (National District Attorneys Association). 2015. Child endangerment statutes and penalties. Alexandria, VA: Author.
Neil, M. 2006. Low manpower sobriety checkpoints in rural and small communities. Between the Lines 15(1):1–2.
New Jersey Opinion. 2016. Editorial: This town’s free ride program to fight DUI should be tested all over N.J. http://www.nj.com/opinion/index.ssf/2016/09/test_drive_eveshams_dui-fighting_program_all_over.html (accessed January 5, 2018).
NHTSA (National Highway Traffic Safety Administration). 2006. Low-staffing sobriety checkpoints. DOT HS 810 590. Washington, DC: U.S. Department of Transportation.
NHTSA. 2013a. Safety in numbers. 1(9):1–4. https://www.nhtsa.gov/es/staticfiles/numbers/Safety_In_Numbers_Drive_Sober_811871.pdf (accessed August 24, 2017).
NHTSA. 2013b. U.S. Department of transportation extends cooperative research program with automotive industry to cut drunk driving on U.S. Roads. https://www.nhtsa.gov/press-releases/us-department-transportation-extends-cooperative-research-program-automotive-industry (accessed May 19, 2017).
NHTSA. 2015. Traffic safety facts 2015: A compilation of motor vehicle crash data from the Fatality Analysis Reporting System and the General Estimates System. DOT HS 812 384. Washington, DC: U.S. Department of Transportation.
NHTSA. 2016a. Traffic safety facts: Alcohol-impaired driving. https://crashstats.nhtsa.dot.gov/Api/Public/Publication/812350 (accessed August 28, 2017).
NHTSA. 2016b. U.S. DOT urges public to “drive sober or get pulled over” and announces funding for innovative technology to end drunk driving. https://www.nhtsa.gov/press-releases/us-dot-urges-public-%E2%80%98drive-sober-or-get-pulled-over%E2%80%99-and-announces-funding-innovative (accessed May 18, 2017).
NHTSA. 2017a. Traffic safety facts: Young drivers. https://crashstats.nhtsa.dot.gov/Api/Public/ViewPublication/812278 (accessed August 28, 2017).
NHTSA. 2017b. NHTSA’s No Refusal toolkit. https://www.nhtsa.gov/staticfiles/planners/NoRefusalWeekend/index.htm (accessed December 2, 2017).
NHTSA. n.d.-a. Drunk driving. https://www.nhtsa.gov/risky-driving/drunk-driving (accessed May 16, 2017).
NHTSA. n.d.-b. NHTSA No Refusal Weekend toolkit. https://www.nhtsa.gov/staticfiles/planners/NoRefusalWeekend/index.htm (accessed December 2, 2017).
NIAAA (National Institute on Alcohol Abuse and Alcoholism). 1999. Alcohol alert: Are women more vulnerable to alcohol’s effects? https://pubs.niaaa.nih.gov/publications/aa46.htm (accessed January 9, 2018).
NIAAA. 2017. What is a standard drink? https://www.niaaa.nih.gov/alcohol-health/overview-alcohol-consumption/what-standard-drink (accessed December 6, 2017).
Nielson, A. L., and B. Watson. 2009. The effectiveness of designated driver programs. Journal of the Australasian College of Road Safety 20(2):32–37.
Noordzij, P. 1977. The introduction of a statutory BAC limit of 50 mg/100 ml and its effect on drinking and driving habits and traffic accidents. Paper read at Seventh International Conference on Alcohol, Drugs and Traffic Safety, Melbourne, Australia.
Noordzij, P. 1994. Decline in drinking and driving in the Netherlands. Washington, DC: Transportation Research Board.
Norstrom, T. 1997. Assessment of the impact of the 0.02 percent BAC-limit in Sweden. Studies on Crime and Crime Prevention 6(2):245–258.
NTSB (National Transportation Safety Board). 2013. Reaching zero: Actions to eliminate alcohol-impaired driving. https://www.ntsb.gov/safety/safety-studies/Documents/SR1301.pdf (accessed January 9, 2018).
Otero, S., and T. Rau. 2017. The effects of drinking and driving laws on car crashes, injuries, and deaths: Evidence from Chile. Accident Analysis & Prevention 106:262–274.
Parks, V., C. Leister, A. Patat, S. Troy, A. Vermeeren, E. Volkerts, and J. Verster. 2002. Effects of ethanol at a blood alcohol concentration of 0.4 g/l on actual driving and memory. European Neuropsychopharmacology 12(Suppl 3):432–433.
Peck, J. 2017. New York City drunk driving after Uber. New York: City University of New York Graduate Center, Ph.D. Program in Economics.
Peck, R. C., M. A. Gebers, R. B. Voas, and E. Romano. 2008. The relationship between blood alcohol concentration (BAC), age, and crash risk. Journal of Safety Research 39(3):311–319.
Peden, M., R. Scurfield, D. Sleet, D. Mohan, A. A. Hyder, E. Jarawan, and C. D. Mathers. 2004. World report on road traffic injury prevention. Geneva, Switzerland: World Health Organization.
Phillips, D. P., and K. M. Brewer. 2011. The relationship between serious injury and blood alcohol concentration (BAC) in fatal motor vehicle accidents: BAC = 0.01% is associated with significantly more dangerous accidents than BAC = 0.00%. Addiction 106(9):1614–1622.
Pickrell, T. M., and R. Li. 2016. Seat belt use in 2016—Overall results. DOT HS 812351. Washington, DC: National Highway Traffic Safety Administration.
Piontkowski, S. R., J. S. Peabody, C. Reede, J. Velascosoltero, G. Tsatoke, T. Shelhamer, and K. R. Hicks. 2015. Reducing motor vehicle-related injuries at an Arizona Indian reservation: Ten years of application of evidence-based strategies. Global Health: Science and Practice 3(4):619–629.
Preusser, D. F. 2000. Identification of alcohol-impairment on initial interview. Transportation Research E-Circular E1–E7.
Quinlan, K. P., R. D. Brewer, D. A. Sleet, and A. M. Dellinger. 2000. Characteristics of child passenger deaths and injuries involving drunk drivers. JAMA 283(17):2249–2252.
Rakauskas, M. E., N. J. Ward, E. R. Boer, E. M. Bernat, M. Cadwallader, and C. J. Patrick. 2008. Combined effects of alcohol and distraction on driving performance. Accident Analysis & Prevention 40(5):1742–1749.
Rivara, F. P., A. Relyea-Chew, J. Wang, S. Riley, D. Boisvert, and T. Gomez. 2007. Drinking behaviors in young adults: The potential role of designated driver and safe ride home programs. Injury Prevention 13(3):168–172.
Rodriguez-Iglesias, C., C. Wiliszowski, and J. H. Lacey. 2001. Legislative history of .08 per se laws. Washington, DC: National Highway Traffic Safety Administration.
Roehrs, T., and T. Roth. n.d. Sleep, sleepiness, and alcohol use. https://pubs.niaaa.nih.gov/publications/arh25-2/101-109.htm?utm_source=io9+Newsletter&utm_campaign=6d29bbd775-UA-142218-29&utm_medium=email (accessed August 21, 2017).
Rogers, P. N. 1995. The general deterrent impact of California’s 0.08% blood alcohol concentration limit and administrative per se license suspension laws volume 1 of: An evaluation of the effectiveness of California’s 0.08% blood alcohol concentration limit and administrative per se license suspension laws. Sacramento: California Department of Motor Vehicles.
Rogers, P. N. 1997. Specific deterrent impact of California’s 0.08% blood alcohol concentration limit and administrative per se license suspension laws volume 2 of: An evaluation of the effectiveness of California’s 0.08% blood alcohol concentration limit and administrative per se license suspension laws. Sacramento, CA: Office of Traffic Safety.
Romano E., J. Fell, and R. Voas. 2011. The role of race and ethnicity on the effect of graduated driver licensing laws in the United States. Annals of Advances in Automotive Medicine 55:51−61.
Ronen, A., H. S. Chassidim, P. Gershon, Y. Parmet, A. Rabinovich, R. Bar-Hamburger, Y. Cassuto, and D. Shinar. 2010. The effect of alcohol, THC and their combination on perceived effects, willingness to drive and performance of driving and non-driving tasks. Accident Analysis & Prevention 42(6):1855–1865.
Rothe, P. J., and L. J. Carroll. 2009. Hazards faced by young designated drivers: In-car risks of driving drunken passengers. International Journal of Environmental Research and Public Health 6(6):1760–1777.
Rothschild, M. L., B. Mastin, and T. W. Miller. 2006. Reducing alcohol-impaired driving crashes through the use of social marketing. Accident Analysis & Prevention 38(6):1218–1230.
Rudin-Brown, C. M., A. J. Filtness, A. R. Allen, and C. M. Mulvihill. 2013. Performance of a cognitive, but not visual, secondary task interacts with alcohol-induced balance impairment in novice and experienced motorcycle riders. Accident Analysis & Prevention 50:895–904.
Rupp, T. L., C. Acebo, R. Seifer, and M. A. Carskadon. 2007. Effects of a moderate evening alcohol dose. II: Performance. Alcoholism: Clinical and Experimental Research 31(8): 1365–1371.
Salam, R. A., A. Arshad, J. K. Das, M. N. Khan, W. Mahmood, S. B. Freedman, and Z. A. Bhutta. 2016. Interventions to prevent unintentional injuries among adolescents: A systematic review and meta-analysis. Journal of Adolescent Health 59(4 Suppl):S76–S87.
Sanem, J. R., D. J. Erickson, P. C. Rutledge, K. M. Lenk, T. F. Nelson, R. Jones-Webb, and T. L. Toomey. 2015. Association between alcohol-impaired driving enforcement-related strategies and alcohol-impaired driving. Accident Analysis and Prevention 78:104–109.
Sarkar, S., M. Andreas, and F. De Faria. 2005. Who uses safe ride programs: An examination of the dynamics of individuals who use a safe ride program instead of driving home while drunk. American Journal of Drug and Alcohol Abuse 31(2):305–325.
Schmitt, G., R. Aderjan, T. Keller, and M. Wu. 1995. Ethyl glucuronide: An unusual ethanol metabolite in humans. Synthesis, analytical data, and determination in serum and urine. Journal of Analytical Toxicology 19(2):91–94.
Schoettle, B., and M. Sivak. 2013. The reasons for the recent decline in young driver licensing in the U.S. 2013. University of Michigan, Transportation Research Institute, Ann Arbor, Michigan.
Schwartz, J., and A. Davaran. 2013. Enforcement following 0.08% BAC law change: Sex-specific consequences of changing arrest practices? Addictive Behaviors 38(10):2506–2512.
Schweizer, T. A., and M. Vogel-Sprott. 2008. Alcohol-impaired speed and accuracy of cognitive functions: A review of acute tolerance and recovery of cognitive performance. Experimental and Clinical Psychopharmacology 16(3):240.
Shults, R. A., and A. F. Williams. 2016. Graduated driver licensing night driving restrictions and drivers aged 16 or 17 years involved in fatal night crashes—United States, 2009–2014. Morbidity and Mortality Weekly Report 65(29):725–730.
Shults, R. A., R. W. Elder, D. A. Sleet, J. L. Nichols, M. O. Alao, V. G. Carande-Kulis, S. Zaza, D. M. Sosin, R. S. Thompson, and Task Force on Community Preventive Services. 2001. Reviews of evidence regarding interventions to reduce alcohol-impaired driving. American Journal of Preventive Medicine 21(4):66–88.
Sjöström, L. O., and T. Jonsson. n.d. Experiences from the trial with automatic sobriety checkpoints (“alco gates”) in Frihamnen, Stockholm. https://auli-yhdistysavain-fi-bin.directo.fi/@Bin/5a556fb5e12fb85959ef290a89d3671f/1503074707/application/pdf/204163/Jonsson_Sjostrom.pdf (accessed August 18, 2017).
Smith, D. I. 1986. Effect of low proscribed blood alcohol levels (BALs) on traffic accidents among newly-licensed drivers. Medicine, Science and the Law 26(2):144–148.
Snyder, M. 1992. Driving under the influence: A report to Congress on alcohol limits. Washington, DC: National Highway Traffic Safety Administration.
Solomon, D. 2014. The Court of Criminal Appeals ruled that police can’t take blood from DWI suspects without a warrant. https://www.texasmonthly.com/the-daily-post/the-court-of-criminal-appeals-ruled-that-police-cant-take-blood-from-dwi-suspects-without-a-warrant (accessed December 2, 2017).
Solomon, R., E. Chamberlain, M. Abdoullaeva, and B. Tinholt. 2011. Random breath testing: A Canadian perspective. Traffic Injury Prevention 12(2):111–119.
Sommer, K. 2016. DWI Summit shows “No Refusal” program a success. http://www.valleymorningstar.com/news/local_news/dwi-summit-shows-no-refusal-program-a-success/article_1678b094-3f05-11e6-88b3-2b11e8c368c5.html (accessed December 2, 2017).
Sprattler, K. 2010. Minnesota safe ride program report. Minneapolis: Center for Transportation Studies, University of Minnesota.
Sternlund, S. 2017. The safety potential of lane departure warning systems—A descriptive real-world study of fatal lane departure passenger car crashes in Sweden. Traffic Injury Prevention 18(Suppl 1):S18–S23.
Stuster, J. W., and P. A. Blowers. 1995. Experimental evaluation of sobriety checkpoint programs. Final report. Washington, DC: National Highway Traffic Safety Administration.
Tefft, B. C., A. F. Williams, and J. G. Grabowski. 2013. Timing of driver’s license acquisition and reasons for delay among young people in the United States, 2012. AAA Foundation for Traffic Safety, Washington, DC.
Tefft, B. C., A. F. Williams, and J. G. Grabowski. 2014. Driver licensing and reasons for delaying licensure among young adults ages 18−20, United States, 2012. Injury Epidemiology 1:4.
Thomas, S., T. Kelley-Baker, E. Romano, R. Treffers, and C. L. Cannon. 2014. Transporting young passengers while impaired: The state of the law. Health Behavior and Policy Review 1(4):265–277.
Thomasson, H. 2000. Alcohol elimination: Faster in women? Alcoholism: Clinical and Experimental Research 24(4):419–420.
Timmerman, M. A., E. S. Geller, K. E. Glindemann, and A. K. Fournier. 2003. Do the designated drivers of college students stay sober? Journal of Safety Research 34(2):127–133.
Tippetts, A. S., R. B. Voas, J. C. Fell, and J. L. Nichols. 2005. A meta-analysis of .08 BAC laws in 19 jurisdictions in the United States. Accident Analysis & Prevention 37(1):149–161.
Tison, J., A. F. Williams, and N. K. Chaudhary. 2010. Daytime and nighttime seat belt use by fatally injured passenger vehicle occupants. Washington, DC: National Highway Traffic Safety Administration.
Tomblin, E. R., P. Reed, and B. Tipton. 2016. West Virginia highway safety plan: Federal fiscal year 2017. Charleston, WV: West Virginia’s Governor’s Highway Safety Program.
Tremblay, M., F. Gallant, M. Lavallière, M. Chiasson, D. Silvey, D. Behm, W. J. Albert, and M. J. Johnson. 2015. Driving performance on the descending limb of blood alcohol concentration (BAC) in undergraduate students: A pilot study. PLoS ONE 10(2):e0118348.
Uber. n.d.-a. The future of trucking. https://www.uber.com/info/atg/truck (accessed August 21, 2017).
Uber. n.d.-b. Uber hits five billion rides milestone. https://www.uber.com/en-SG/blog/uber-hits-5-billion-rides-milestone (accessed December 4, 2017).
Utah State Legislature. 2017. H.B. 155 Driving under the influence and public safety revisions. http://le.utah.gov/~2017/bills/static/HB0155.html (accessed March 30, 2017).
UtahPolicy.com. 2017. Poll: A majority of Utahns oppose lowering DUI limit. http://utahpolicy.com/index.php/features/today-at-utah-policy/12806-poll-a-majority-of-utahns-oppose-lowering-dui-limit (accessed August 21, 2017).
Van Ooijen, D. 1977. The effects of a new DWI law. Paper read at Seventh International Conference on Alcohol, Drugs and Traffic Safety, Melbourne, Australia.
Verster, J. C., A. E. Wester, M. Goorden, J.-P. Van Wieringen, B. Olivier, and E. R. Volkerts. 2009. Novice drivers’ performance after different alcohol dosages and placebo in the divided-attention steering simulator (DASS). Psychopharmacology 204(1):127–133.
Vingilis, E., H. Blefgen, H. Lei, K. Sykora, and R. Mann. 1988. An evaluation of the deterrent effects of Ontario BAC law. Accident Analysis & Prevention 20:917.
Voas, R. B., and J. C. Fell. 2013. Strengthening impaired-driving enforcement in the United States. Traffic Injury Prevention 14(7):661–670.
Voas, R. B., and J. H. Lacey. 1990. Drunk driving enforcement, adjudication, and sanctions in the United States. In Drinking and driving: Advances in research and prevention, edited by R. J. Wilson and R. E. Mann. New York: Guilford Press. Pp. 116–158.
Voas, R. B., A. S. Tippetts, and J. Fell. 2000. The relationship of alcohol safety laws to drinking drivers in fatal crashes. Accident Analysis & Prevention 32(4):483–492.
Voas, R. B., A. S. Tippetts, and E. P. Taylor. 2002. The Illinois .08 law: An evaluation. Journal of Safety Research 33(1):73–80.
Voas, R. B., P. Torres, E. Romano, and J. H. Lacey. 2012. Alcohol-related risk of driver fatalities: An update using 2007 data. Journal of Studies on Alcohol and Drugs 73:341–350.
Wagenaar, A. C., M. M. Maldonado-Molina, L. Ma, A. L. Tobler, and K. A. Komro. 2007. Effects of legal BAC limits on fatal crash involvement: Analyses of 28 states from 1976 through 2002. Journal of Safety Research 38(5):493–499.
Walker, S., A. J. Treno, J. W. Grube, and J. M. Light. 2003. Ethnic differences in driving after drinking and riding with drinking drivers among adolescents. Alcoholism: Clinical and Experimental Research 27(8):1299−1304.
Wall, T. L., S. E. Luczak, and S. Hiller-Sturmhofel. 2016. Biology, genetics, and environment: Underlying factors influencing alcohol metabolism. Alcohol Research 38(1):59–68.
Washington State House of Representatives. 2017. HB1874: Bill analysis. http://lawfilesext.leg.wa.gov/biennium/2017-18/Pdf/Bill%20Reports/House/1874%20HBA%20PS%2017.pdf (accessed December 6, 2017).
Washington State Legislature. 2017. HB 1874–201–18: Addressing the blood and breath alcohol concentration of persons operating or in physical control of a vehicle, vessel, or aircraft. http://app.leg.wa.gov/billsummary?BillNumber=1874&Year=2017 (accessed December 12, 2017).
Weldy, D. L. 2010. Risks of alcoholic energy drinks for youth. Journal of the American Board of Family Medicine 23(4):555–558.
Wesemann, P. 1989. Costs and benefits of police enforcement in the Netherlands. Paper read at Alcohol, Drugs, & Traffic Safety: Proceedings of the 11th International Conference on Alcohol, Drugs & Traffic Safety, Chicago, IL.
WHO (World Health Organization). 2014. Legal BAC limits data by country. http://apps.who.int/gho/data/node.main.A1147?lang=en (accessed December 21, 2017).
WHO. 2015. Global status report on road safety 2015. Geneza, Switzerland: WHO.
WHO Regional Office for Europe. 2009. Evidence for the effectiveness and cost-effectiveness of interventions to reduce alcohol-related harm. Copenhagen, Denmark: WHO Regional Office for Europe.
Williams, A. F., A. T. McCartt, and L. B. Sims. 2016. History and current status of state graduated driver licensing (GDL) laws in the United States. Journal of Safety Research 56:9–15.
Williams, H., and A. Salamy. 1972. Alcohol and sleep. In The biology of alcoholism, edited by B. Kissin and H. Begleiter. New York: Plenum Press. Pp. 435–483.
Winkler, J. 2012. A DWI offer you can’t refuse. https://www.thefix.com/content/no-refusal-night-austin (accessed December 2, 2017).
Winsten, J. A. 1994. Promoting designated drivers: The Harvard alcohol project. American Journal of Preventive Medicine 10(3 Suppl):11–14.
Winsten, J. A. 2017. Developing media messages that save lives. Stanford Social Innovation Review. https://ssir.org/transformative_scale/entry/developing_media_messages_that_save_lives (accessed June 26, 2017).
Wolburg, J. M. 2005. How responsible are “responsible” drinking campaigns for preventing alcohol abuse? Journal of Consumer Marketing 22(4):176–177.
Wurst, F. M., S. Dresen, J. P. Allen, G. Wiesbeck, M. Graf, and W. Weinmann. 2006. Ethyl sulphate: A direct ethanol metabolite reflecting recent alcohol consumption. Addiction 101(2):204–211.
Zador, P. L. 1991. Alcohol-related relative risk of fatal driver injuries in relation to driver age and sex. Journal of Studies on Alcohol 52(4):302–310.
Zador, P. L., S. A. Krawchuk, and R. B. Voas. 2000. Alcohol-related relative risk of driver fatalities and driver involvement in fatal crashes in relation to driver age and gender: An update using 1996 data. Journal of Studies on Alcohol 61(3):387–395.
Zaouk, A. K., M. Wills, E. Traube, and R. Strassburger. 2015. Driver alcohol detection system for safety (DADSS)—A status update. Paper presented at 24th International Technical Conference on the Enhanced Safety of Vehicles, Gothenburg, Sweden.
Zwicker, T., N. K. Chaudhary, S. Maloney, and R. Squeglia. 2007a. Connecticut’s 2003 impaired-driving high-visibility enforcement campaign. Washington, DC: National Highway Traffic Safety Administration.
Zwicker, T., N. Chaudhary, M. G. Solomon, J. Siegler, and J. Meadows. 2007b. West Virginia’s impaired driving high-visibility enforcement campaign, 2003–2005. Washington, DC: National Highway and Traffic Safety Administration.


