
6
Data and Surveillance Needs and Opportunities
INTRODUCTION
There are a variety of datasets and surveillance systems that provide information on alcohol-impaired driving in the United States. Surveys conducted through the mail, over the phone, and at schools provide self-reported behavioral data; on-road data are also collected through passive methods. Information on crash data is available through police reports as well as hospital and emergency medical services (EMS) records. Other related datasets track fatal and nonfatal injuries and road usage. These data systems each have their respective strengths and limitations (see Table 6-2 at the end of the overview section for available data sources on alcohol-impaired driving), but examining them together allows a picture of the state of alcohol-impaired driving in the United States to emerge. Systematic data collection can help to understand causes, determine long-term trends, and identify subpopulations at greater risk; big data and data collected from epidemiological investigations can also improve real-time response rates. Having a comprehensive understanding of alcohol-impaired driving, both in regard to the rates of occurrence, traffic crashes, injuries, fatalities, arrests, and convictions, as well as qualitative data on when and why people drive while impaired, is vital to create targeted interventions to reduce it.
From a public health perspective, understanding the scope and burden of alcohol-impaired driving requires triangulation across multiple sources of data to identify primary, secondary, and tertiary interventions as well as interventions that can be used prior to alcohol consumption,
once alcohol has been consumed and driving is likely, and once alcohol-impaired driving has occurred. These interventions may involve policy, vehicle, and road design, as well as human factors.
In the committee’s conceptual model (see Figure 1-5) the pathway to an alcohol-related driving fatality includes drinking, driving, crashing, and death. As such, a public health approach to surveillance data includes assessment of burden and trends across all four stages. Public health approaches routinely use collected survey data with reliable and well-validated reports of consumption and high-risk drinking to assess alcohol use. These data sources also provide national and local information on driving after drinking and other driving-related risks. Finally, administrative and hospital records allow for assessment information about crashes and fatalities (for more on public health data sources, see the section in this chapter titled Public Health and Hospital Datasets). No data source is without error and no data source has complete information on all aspects of the impaired driving landscape. As such, harnessing the available resources while being explicit about strengths and limitations enables researchers to sketch the best possible picture of the scope of the problem, risk factors, and potential points of intervention and prevention.
This chapter begins with a short description of relevant datasets; for a more detailed description, see Appendix A. This is followed by sections that summarize the gaps in the data, the barriers to collecting more comprehensive data, and opportunities for enhanced data collection and surveillance. The chapter concludes with a description of the importance of transparency and access in data and the roles that various stakeholders can play in collecting and maintaining data.
OVERVIEW OF AVAILABLE DATA SOURCES ON ALCOHOL-IMPAIRED DRIVING
The datasets described in this section provide behavioral, crash, fatal injury, nonfatal injury, and denominator data related to alcohol-impaired driving and alcohol-related fatalities. They are summarized in Table 6-2 and grouped by the stages of the drinking-to-crash processes in the conceptual framework (see Figure 1-5). This chapter focuses on datasets that specifically track alcohol-impaired driving trends, but other data sources that provide relevant, related data (e.g., Monitoring the Future, a longitudinal survey that collects behavioral information on secondary school and college students as well as young adults) are also available and an opportunity exists for data integration and research expansion.
Alcohol Consumption and Drinking and Driving Data
The Behavioral Risk Factor Surveillance System (BRFSS) is composed of answers from telephone surveys conducted by the Centers for Disease Control and Prevention (CDC) in all 50 states, the District of Columbia, and 3 U.S. territories (CDC, 2017a). It is the largest continuously conducted health survey in the world and includes information from interviews with more than 400,000 adults (age ≥18 years) annually (CDC, 2017a). The data collected cover chronic health conditions, the use of preventive services, and health-related risk behaviors, including a question pertaining to alcohol-impaired driving that has been asked biennially since 2006 (CDC, 2017a; DiMaggio et al., 2018).1 The core questionnaire has included this alcohol-impaired driving question as an optional module since the survey’s inception in 1984 and has included the question every other year (in even years) since 2002. The survey also asks respondents how many alcoholic beverages they consume in a day and how often they wear a seat belt when driving or riding as a passenger (see Appendix A for more information) (DiMaggio et al., 2018). Some limitations of the BRFSS are that it is conducted on the telephone and therefore excludes some populations from participating, it relies on self-reported data that may contain biases, and its results are only valid on national, state, county, and metropolitan and micropolitan statistical area levels (not local) (CDC, 2016; DiMaggio et al., 2018).
The Youth Risk Behavior Surveillance System (YRBSS) is similar to the BRFSS in that it is a health behaviors survey conducted by CDC (CDC, 2017c). Unlike the BRFSS, however, the YRBSS collects information from middle and high school students biennially and is administered in schools (CDC, 2017c). The YRBSS includes a national school-based Youth Risk Behavior Survey (YRBS) conducted by CDC, and state and large urban school district school-based YRBSs conducted by state and local education and health agencies. The YRBSS includes national, state, territorial, tribal government, and local school-based surveys of representative samples of 9th through 12th grade students that are conducted biennially. Questions on the YRBS cover the following topics: behaviors that contribute to unintentional injuries and violence, sexual behaviors related to unintended pregnancy and sexually transmitted infections, diet and exercise, and drug use (including alcohol and tobacco, with two questions that explicitly address behaviors related to alcohol-impaired driving) (CDC, 2017c; DiMaggio et al., 2018). Beginning in 2013, the YRBS alcohol-impaired driving question response categories were modified to include the option
___________________
1 The BRFSS includes the following question that explicitly pertains to alcohol-impaired driving: “During the past 30 days, how many times have you driven when you’ve had perhaps too much to drink?” Survey respondents may answer with 0 to 76 times.
“I did not drive a car or other vehicle during the past 30 days.” Because of this change, the YRBS alcohol-impaired driving estimates now represent prevalence of the behavior among students who drive, and the long-term temporal trend of alcohol-impaired driving among all students is no longer available. Like the BRFSS, the YRBS is limited by self-reported data that may be subject to under- or overreporting biases (Kann et al., 2016). It is also administered in schools, and therefore does not capture the behaviors of youth who do not attend school (Kann et al., 2016). The YRBS is not conducted in every state; in 2015 Minnesota, Oregon, and Washington did not participate (CDC, 2017d). Lastly, there are missing data from states and school districts that do not include all of the standard YRBS questions on their questionnaires (Kann et al., 2016). The National Health Interview Survey (NHIS), conducted by CDC, also collects information on alcohol consumption and injuries from motor vehicle crashes (NCHS, 2015, 2017a). Specifically, the alcohol consumption data collected by the survey include the percentage of adults 18 years and older who had at least one heavy drinking day2 in the past year, adjusted by age and sex (NCHS, 2017b).
The National Survey on Drug Use and Health (NSDUH)3 is conducted annually by the Substance Abuse and Mental Health Services Administration (SAMHSA) in the United States and provides prevalence patterns and other information on the consequences of alcohol use (including one question about arrests for alcohol-impaired driving), tobacco, illegal drug use, and mental disorders among noninstitutionalized populations ages 12 years and over (DiMaggio et al., 2018; SAMHSA, 2016). The survey has been in use since 1971 and reaches about 70,000 respondents each year, making it an effective tool for tracking trends over time (DiMaggio et al., 2018). The NSDUH collects information from residents of homes, military bases, and noninstitutional living spaces such as shelters, rooming houses, and dormitories, but excludes homeless individuals who do not use shelters, institutionalized populations, and active duty military personnel (Batts et al., 2014). Other limitations are that the survey relies on self-reported information and does not assess outcomes at a local level (Batts et al., 2014; DiMaggio et al., 2018).
The National Roadside Survey of Alcohol and Drug Use by Drivers was first conducted by the National Highway Traffic Safety Administration (NHTSA) in 1973 and has been repeated four times since (1986, 1996, 2007, and 2013–2014) (NHTSA, n.d.-c). The survey is voluntary and paid, the two most recent surveys recruiting more than 10,000 drivers each at
___________________
2 The NHIS defines a heavy drinking day as an occasion on which men consume five or more drinks and women consume four or more drinks (NCHS, 2017a).
3 The NSDUH was formerly known as the National Household Survey on Drug Abuse.
roadside stops to complete questionnaires and collect breath, oral fluid, and blood samples (Berning et al., 2015; Lacey et al., 2011). Survey data are based on a combination of physical tests and self-reporting, reducing measurement error compared to surveys relying on only self-report (DiMaggio et al., 2018; Lacey et al., 2011). Survey findings have historically been used to estimate the prevalence of alcohol-impaired driving on U.S. roads and can be used to assess injury and fatality risk in relative risk studies (Kelley-Baker, 2017). One limitation to this survey, however, is that participation is voluntary, so those who think or know they are impaired may choose not to participate (Lacey et al., 2011). The use of appropriated funds for NHTSA to conduct roadside surveys was prohibited by Congress (U.S. House of Representatives, 2015),4 due to the perception that constituents are being unduly coerced to participate (Kelley-Baker, 2017).
The Alcohol Research Group and its National Alcohol Research Center have conducted the National Alcohol Surveys approximately every 5 years since the 1960s. The survey collects detailed information on alcohol use and alcohol-related problems for adults ages 18 years and older and provides information on alcohol-related patterns and trends over the course of eight surveys spanning more than 35 years (ARG, n.d.).
The Alcohol Policy Information System (APIS) collects information on state- and federal-level policies related to alcohol, including detailed information by state on 35 specific policies related to taxation, underage drinking, alcohol beverage pricing, blood alcohol concentration (BAC) limits, transportation, retail sales, alcohol control systems, pregnancy and alcohol, and health care services and financing (APIS, n.d.-b). In addition, the APIS also includes information on regulations related to legalization of recreational cannabis and drug-impaired driving. The APIS is developed and supported by the CDM Group, Inc., the National Institute on Alcohol Abuse and Alcoholism (NIAAA), and the Pacific Institute for Research and Evaluation (APIS, n.d.-a). Many of the NIAAA’s recent alcohol policy research program announcements include calls for research on alcohol and drug use and the effect of alcohol and drug policies on outcomes related to alcohol and drug impairment (NIAAA, 2017).
Motor Vehicle Crash Data
NHTSA has been collecting data from police accident reports (PARs) in its State Data System (SDS) since the early 1980s (NHTSA, n.d.-d). The data include information from 34 participating states, and although the information reported in PARs varies by state, the reports usually include information on crashes resulting in injury, death, or vehicle damage
___________________
4 See Section 143.
(DiMaggio et al., 2018; NHTSA, n.d.-d). Most states report if the driver had been drinking alcohol in proximity to the time of the crash, but information about the passengers’ alcohol use is usually not included (DiMaggio et al., 2018). Similar to data on arrests for driving while intoxicated (DWI), data from the SDS on property damage only crashes may be useful in determining opportunities for intervention and prevention of more serious crashes. The biggest limitations of the SDS are the variability in data collected by each state and that much of the data are not readily available to the public—access to state data requires permissions from that specific state (DiMaggio et al., 2018). Researchers or others interested in using the data for a specific purpose may apply for access to the data.
From 1992 to 2013, NHTSA oversaw the Crash Outcome Data Evaluation System (CODES), an autonomous system that creates probabilistic data linkages between crash report data, hospital data, and EMS data—some states have opted to also include data from death certificates, trauma registries, driver citations, and motor vehicle licensing (Cook et al., 2015; Kindelberger and Milani, 2015; NHTSA, n.d.-d). The CODES provides a more comprehensive understanding of the medical and financial consequences of a crash and allows for a more accurate analysis of injury diagnosis and crash severity (NHTSA, n.d.-d). There are cases of missing data, data that the CODES cannot access, and instances in which the data that are available fail to link (Kim et al., 2001).
The National Incident-Based Reporting System (NIBRS) is managed by the Federal Bureau of Investigation (FBI) and provides detailed information on crime incidents (including DWI), such as information about location, time of day, the victim, known offenders, arrestees, the relationships between those involved, and any property involved in the crime (DiMaggio et al., 2018; FBI, n.d.-a). The biggest limitation of the NIBRS is that it is only used by about one-third of all U.S. law enforcement agencies. Deterrents to switching to the NIBRS include preliminary startup costs and concerns that initial results can make it appear that the agency has had a spike in crime incidents (FBI, n.d.-a). The Uniform Crime Reporting program is another data reporting system managed by the FBI, but it provides much less qualitative and contextual detail for crimes than the NIBRS (FBI, n.d.-b). The program collects data on violent crime (murder and nonnegligent manslaughter, rape, robbery, and aggravated assault) and property crime (burglary, larceny, theft, and motor vehicle theft) (FBI, n.d.-c).
The National Academies of Sciences, Engineering, and Medicine’s (the National Academies’) Transportation Research Board manages the second Strategic Highway Research Program (SHRP 2), which collects important information on driver behavior and performance, identifies variables needed to study naturalistic driving behavior, and provides
linkages between multiple datasets (TRB, n.d.). One of the research program’s primary applied research focus areas is to better understand driver behavior to improve motor vehicle and highway safety (NASEM, 2015). Specifically, the program analyzes how drivers interact with and adapt to vehicles, roadway design and characteristics, and traffic control devices; the program also analyzes changes in crash risk attributed to these variables (TRB, n.d.). The program conducted a naturalistic driving study by collecting data from more than 3,500 volunteer drivers over a 3-year time period, producing a large database that contains important information on driver behavior and interactions (TRB, n.d.).5 As the drivers self-selected to participate, the study does not claim to be a random sample of drivers in the United States, nor was it designed to study alcohol use. Another limitation relating to the alcohol sensors installed in study participants’ vehicles is that they may record false positives from other sources of alcohol; however, data on impairment were also collected through other indicators, including kinematics, driver behavior, and video (NASEM, 2015). The SHRP 2 database provides the largest naturalistic driving study dataset to date; if analyzed appropriately and with data limitations taken into consideration, it offers useful data for examining alcohol use and alcohol-impaired driving issues in new ways. Although alcohol use has not emerged as one of the program’s primary research themes, the SHRP 2 provides a promising area of research expansion to gain behavioral insights of alcohol-impaired drivers and their interactions with vehicles and the traffic environment.
Fatal Motor Vehicle Injury Data
The Fatality Analysis Reporting System (FARS) is a census of fatal crashes that occur on public roadways in the United States and Puerto Rico that has been conducted by NHTSA since 1975 (NHTSA, 2014). FARS data are abstracted by trained FARS analysts in each state, and the annually reported dataset provides information on the characteristics of fatal crashes (e.g., location, alcohol involvement, and roadway and atmospheric conditions), the vehicles, and the people involved by collecting data from PARs, state vehicle registration files, state driver licensing files, state highway department data, vital records department data, death certificates, coroner/medical examiner reports, and EMS reports (DiMaggio et al., 2018; NHTSA, 2014).
The FARS dataset has a number of strengths, including a uniform set of data definitions that are used for data submissions. The dataset characterizes the crash, the vehicles, and the people involved, with the
___________________
5 Available at https://insight.shrp2nds.us (accessed October 10, 2017).
primary data source being the PAR. For alcohol-related crashes, when the information is available, the FARS includes data from breath, blood, and urine BAC tests as well as police behavioral assessments, although both types of data are often missing as these tests are not always done (DiMaggio et al., 2018). BAC test results can be submitted to the FARS and are in the dataset, whereas BAC results that are missing from individual records are imputed using a multiple imputation method that has been tested and evaluated. While the imputations may provide estimates that are close to the actual BAC results that fatally injured drivers and pedestrians have, it is not possible to be certain of their accuracy. There is also variability among states with respect to the proportion of fatally injured persons whose BAC results are obtained. The FARS could be improved through more consistent reporting of BAC results across states, which would require increased testing of persons who are suspected of alcohol-impaired driving (see Appendix A for additional discussion of multiple imputation and addressing missing data).
Demographic data are included in the FARS, as is information on survival time from crash to death, but survival data are limited to deaths occurring within 30 days of the crash (i.e., anyone who dies more than 30 days after the crash is not in the dataset as a crash fatality). Injury severity is not scored in a way that is clinically relevant, so it is not possible to determine whether a death is due to a uniformly fatal injury or to factors that are unrelated to the crash itself. Detailed data on injuries that would allow the calculation of an Injury Severity Score, and would also provide information on potential vehicle design modifications to prevent fatal injuries, are not included, as death certificates do not generally contain detailed injury descriptions. Review of autopsy reports as well as details in hospital records would be necessary to obtain this information. In addition, there is not a 100 percent autopsy rate for fatally injured persons, but a death certificate must be completed for each fatality. The FARS collects race and ethnicity information from death certificates, so these data are only known for the fatally injured, with this information missing 14 percent of the time (DiMaggio et al., 2018; NHTSA, 2009).
Drug data are also collected in the FARS, an important inclusion as the scope of the problems of drug-impaired driving as well as drug- and alcohol-impaired driving are not well understood. The percentage of fatally injured drivers tested for drugs is considerably lower than the percentage tested for alcohol, and drug data that are collected by the FARS have several substantial limitations. Although NHTSA has developed an imputation method to predict BACs of fatally injured drivers of alcohol-related crashes, it has not developed a method for impairment
from specific drugs such as cannabis,6 which will likely require greater rates of drug testing of fatally injured drivers. The FARS drug data provide information on if a drug was present in a driver’s system but do not differentiate whether the person was impaired by that drug at the time of the crash or the amount of the drug present, although how much of specific drugs, including cannabis, cause impairment is not well understood. This can be an important distinction because some drugs can remain in a person’s system weeks after ingestion (Berning and Smither, 2014). In addition, the degree and type of testing, as well as the proportion of tests that are reported to the FARS, vary by state. In addition to reporting variation, states also vary in testing protocols and positive test thresholds. Drivers who die at the scene of a crash are the most likely to be tested, while drivers who survive, regardless of whether they are considered to be responsible for the crash, are least frequently tested. As might be expected, states that have higher BAC testing rates also have higher drug testing rates (Slater et al., 2016).
In some states, hospitals test any drivers who are brought to the emergency department (ED) after a crash, although law enforcement does not uniformly have access to the hospital tests that are performed. There are states that allow law enforcement to obtain a search warrant to search the hospital record to obtain alcohol test results for tests that were obtained for medical purposes. There are various costs that would result from increased testing and reporting, including the costs of the tests and the personnel costs to law enforcement for the time involved in both performing and reporting the tests. In addition, there are multiple challenges to broadening testing for alcohol and other drugs, including resistance on the part of some practitioners and institutions to perform the tests for various reasons. The benefits of testing can be addressed in educational strategies for the range of practitioners and workers who are involved in the testing and reporting process. Enacting and implementing laws that require alcohol and drug testing in serious and fatal crashes, while costly, would aid in understanding alcohol and drug involvement in these crashes. However, testing only in serious and fatal crashes results in missed opportunities to identify alcohol and drug use that contributes to less severe injury, vehicular damage only, and noninjury crashes and decreases the opportunities to intervene when a minor crash that involves alcohol and/or drugs occurs.
Data on driver’s license status, i.e., the validity of the driver’s license for operating the particular type of vehicle involved in the crash, are reported. Driving record information for the 3 years prior to the fatal
___________________
6 The AAA Foundation for Traffic Safety has developed an imputation method for cannabis (AAA Foundation for Traffic Safety, 2016).
crash is included, but data from the driving record for more than 3 years prior to the crash are not.
Another strength of the FARS is that its data can be downloaded for analysis; there are also options for online queries. The FARS also contains a geographic information system (GIS) mapping system that can be useful for examining data from a particular state or comparing data across states. As with many other datasets that provide a picture of a problem or set of problems at a national level, the FARS has various strengths and weaknesses. Strengths and limitations of the FARS are summarized in Table 6-1. Working to improve the FARS can be a challenge, but there would be benefits to doing so, including a unique opportunity to explore the utility of using the FARS along with other datasets to address specific issues related to alcohol-impaired driving.
Another source of data for fatal motor vehicle crashes is the Web-based Injury Statistics Query and Reporting System (WISQARS), an interactive, electronic database maintained by CDC that provides statistics on all fatal and nonfatal injuries; it is not limited to those resulting from traffic
TABLE 6-1 Strengths and Limitations of the Fatality Analysis Reporting System
| Characteristic | Strength | Limitation |
|---|---|---|
| BAC imputation |
|
|
| Information on crash, vehicle(s), and persons involved in crash |
|
|
| Information on driver’s license status and driving record |
|
|
| Public availability of data |
|
|
incidents (CDC, 2017b). Cost data are available based on 2010 economic data from CDC reports, but the WISQARS itself does not contain current cost data. The information on fatal injuries reported in the WISQARS is taken from the International Classification of Diseases (ICD)-10 codes on death certificates (DiMaggio et al., 2018). There is underreporting of alcohol involvement in injuries and deaths from various causes, including traffic fatalities (Castle et al., 2014). Although a number of efforts have been made to improve the accuracy and completion of death certificates (Dean et al., 2012; Degani et al., 2009; Myers and Farquhar, 1998), the role of the decedent is also routinely left blank on death certificates (Poe et al., 1993), so it can be impossible to determine if the fatality was that of the driver or a passenger.
State-Level Driving and Crash Data
Driving and crash records are available at the state level. Procedures to request them and the variables they contain vary by jurisdiction. Driving records generally consist of identifying and demographic information, current driving status, recorded offenses in the previous 3 to 10 years (depending on state law and the type of offense), and information on all crashes in which the driver was involved. The data elements included in a driving record vary by state but fall under the general domains of court or administrative actions, reports of crashes, moving violations, drug- and alcohol-related offenses, licensure information and issues, and, in some cases, child support and child endangerment violations.
State-level crash data are based primarily on police investigation reports. State law for investigating and reporting traffic crashes differs across states. For example, in New York, police investigate all crashes involving “death, personal injury, or property damage to any one person in excess of $1,000.”7 In Colorado, crashes involving “injury to, serious bodily injury to, or death of any person or any property damage” are investigated.8 While this kind of heterogeneity introduces difficulties in combining data across jurisdictions, there are similarities that make such analyses possible.
Crash data can be grouped into two general domains: crash characteristics and vehicle/individual characteristics. Crash-level data consist of police-reported data elements related to the environment and circumstances involving the crash. These variables include crash date and time, crash location (sometimes geocoded), and apparent contributing factors such as roadway and weather conditions, apparent involvement
___________________
7 New York State Vehicle and Traffic Law, Sections 600 to 604.
8 Colorado Uniform Motor Vehicle Law 42-4-1601 to 42-4-1605.
of alcohol, number of lanes, driver actions such as turning, and presence of traffic controls such as stopping signals. In general, police reports of contributing factors, particularly alcohol involvement, are poorly documented for all but the most serious injuries. Additional vehicle/individual-related variables are routinely collected as part of police investigations, including vehicle classifications (e.g., sedan, taxi, light truck, or van), whether pedestrians were involved, degree and type of vehicle damage, and injury severity (often limited to killed or seriously injured [KSI] versus all others).
Nonfatal Motor Vehicle Injury Data
Nonfatal injuries fall into several categories—those that require hospitalization; those that are treated in the ED without hospitalization; those that are treated in a physician’s office or clinic; and those that do not require treatment. The range of severity and short-term, long-term, or permanent disability can vary greatly, particularly in the hospitalization group. There are challenges in measuring severity of injury. The Abbreviated Injury Scale (AIS) provides an anatomic severity measurement, and the Injury Severity Score, which is derived from the AIS, is used to classify severity from single or multiple injuries, and has been described as a component of combined measures that can be used to predict likelihood of survival or potentially preventable deaths. Other datasets that can be used to assess injury severity are data from the Healthcare Cost and Utilization Project (HCUP), maintained by the Agency for Healthcare Research and Quality (AHRQ), and the National Hospital Discharge Dataset, which CDC also maintains. The ICD-9 codes can be translated to AIS codes using available software, and, if desired, Injury Severity Score can be calculated. One of the challenges for all of the datasets is that the quality of the coded data is dependent on the data that are recorded in the medical record, as well as the interpretation of the data at the time of coding.
The WISQARS nonfatal injury data are obtained from ED data from the National Electronic Injury Surveillance System (NEISS), which is operated by CDC’s National Center for Injury Prevention and Control in collaboration with the Consumer Product Safety Commission (CDC, n.d.-a). The NEISS All Injury Program collects information from a statistical sample of U.S. EDs and provides data on the injured person’s characteristics as well as the intent of injury, the principle diagnoses, the body part(s) affected, where the injury occurred, and whether it was an occupational injury (CDC, n.d.-a). A limitation of the nonfatal WISQARS data is that there are large confidence intervals around the estimates they provide, suggesting that they are not a reliable source for tracking trends over a short period of time (SPRC, 2012).
The optimal method of studying nonfatal and fatal crashes requires a combination of clinical (EMS, ED, hospital, and medical examiner/coroner) and law enforcement datasets to obtain a complete picture of the events and their outcomes. For some studies, a single dataset, such as the FARS, may be useful, but it depends on the focus of the report or research question. For example, the FARS data alone may be helpful if one wants to examine which locations (urban versus rural) have the highest incidence of fatal crashes. The discharge dataset alone may be helpful if one is studying a particular type of injury resulting from motor vehicle crashes; however, this is dependent on how the incidents are coded.
Maintained by the American College of Surgeons, the National Trauma Data Bank (NTDB) is the largest aggregation of U.S. trauma registry data, containing nearly 7.5 million records of all types of injuries, including records of injuries specifically related to motor vehicle injury and alcohol use (American College of Surgeons, n.d.). The NTDB data may be used to study particular types of injuries, and while the NTDB is a national dataset, it is not a statistical sample, nor do all hospitals contribute data. Because it is a dataset that is focused on trauma, it does include a great deal of data regarding injury severity and injury treatment. Trauma registry data are submitted by hospitals throughout the country and include injury event information, detailed diagnoses, information on hospital stay, and outcomes.
Developed as part of AHRQ’s HCUP, the Nationwide Emergency Department Sample (NEDS) is the largest U.S. database on all-payer ED visits at the national level that includes detailed information on visits related to injury from alcohol misuse and alcohol-impaired driving (DiMaggio et al., 2018; HCUP, n.d.). Among more than 100 variables for which information on each ED visit is collected, patient demographic and payment information is obtained (HCUP, n.d.). The NEDS data, particularly in conjunction with other datasets, can be used to examine trends in underage alcohol misuse and other alcohol-related problems (Naeger, 2017; NIAAA, 2013).
Driver Denominator Data
To determine rates of alcohol-impaired driving and alcohol-related fatalities, absolute numbers of crashes and fatalities need appropriate denominators to calculate and compare rates across time and location (DiMaggio et al., 2018). The following overview describes data sources that provide information for such purposes.
The National Household Travel Survey sponsored by the Federal Highway Administration (FHWA) asks respondents questions about their transportation habits, including the purpose of their trips, how long the
trips take, when the trips take place, means of transportation and, if in a private vehicle, the number of vehicle occupants, the driver’s characteristics, and the vehicle’s attributes (FHWA, n.d.-a). In 2017, more than 129,000 households completed the survey, but the data are limited by low response rates, difficulty reaching demographic subgroups, and because the race and ethnicity of the survey respondent is also applied to the rest of their household (DiMaggio et al., 2018; FHWA, 2015, n.d.-b). The survey is conducted infrequently and irregularly (Garrett, 2014).
The FHWA has also compiled state data on highway vehicle miles traveled (HVMT) since 1945, providing an annual summary of national and state statistics on motor fuel, motor vehicle registration, drivers’ licenses, highway miles traveled, highway user taxation, and highway finance (FHWA, 2016). A major limitation of these data is that they are based on vehicle counts, and therefore the demographics of miles traveled are unavailable (DiMaggio et al., 2018). Another limitation is that data are only collected on 4,000 automatic traffic recorders throughout the country, and there are limited corresponding data available on local traffic (DOT, 2016).
Drivers’ licensure data are another source of denominator data that may be especially useful at the state level. Public availability of licensure data is governed by the Driver’s Privacy Protection Act (DPPA),9 which mandates all states to protect the privacy of individuals’ personal information in their motor vehicle records (Walsh et al., 2011). The DPPA allows the release of licensure data when requests are in compliance with permissible public health research uses (Walsh et al., 2011). In a study conducted in 2009 and 2010 requesting access to licensure data for a hypothetical public health research project, 32 percent of states (16 out of 50) allowed access and 44 percent (22 out of 50) denied access (Walsh et al., 2011). Although accessibility is limited, in some states licensure data can provide information on prior DWI arrests.
In addition to data availability and quality limitations of HVMT for use as a denominator in assessing crash risk, normalizing data across HVMT may obscure the contribution of salient risk factors including, but not limited, to alcohol. There are multiple options for assessing crash risk; measures such as the crash incidence ratio (CIR), for example, provide estimates of the relative risk of crash at various levels of BAC compared with the risk at referent levels of BAC (most commonly, BAC = 0.0%). The addition of such metrics provides an assessment of the contribution of alcohol to crash risk net of other risk factors. Thus, whereas use of HVMT as a denominator provides assessment of absolute alcohol-related crash risk, CIR measures provide assessment of
___________________
9 18 U.S.C. 2721–2725.
relative alcohol-related crash risk. Voas et al. (2007) demonstrated that underage drivers have a high absolute risk of alcohol-related crash risk compared with older drivers, but a lower relative alcohol-related crash risk. This seeming incongruence is due to the fact that underage drivers who crash do so based on many factors (e.g., inexperience, distraction), including, but not limited to, alcohol, whereas older drivers who crash are more likely to have alcohol involved in the crash. As such, providing evidence across multiple indicators of crash risk is necessary to fully contextualize risk across the myriad of factors that vary across age, other demographics, and the environment (e.g., road conditions). Table 6-2 summarizes the strengths, weaknesses, and biases of the datasets discussed in this section.
GAPS AND BARRIERS
Many data and surveillance needs have been identified throughout Chapters 2–5 regarding alcohol-impaired driving. Below is a discussion of these data gaps and barriers that, if addressed, would help provide a fuller picture of who, where, and when alcohol-impaired fatalities and injuries are taking place to better inform comprehensive interventions at the local, state, and federal levels.
Vehicle miles traveled (VMT) can serve as a meaningful denominator for assessing the effect of interventions to prevent alcohol-impaired driving, as the use of VMT can allow tracking of trends over time, as well as the true proportion of events in specific populations. For example, it is difficult to assess whether the higher proportion of alcohol-impaired driving fatalities in rural areas is related to a higher number of miles traveled in rural areas as compared to urban areas, or some other factors. However, VMTs are not routinely measured, so this method of analysis cannot be used readily.
The lack of availability of data with respect to enforcement of traffic laws makes it difficult to assess the effect of enforcement. There is limited information on the number of people who are arrested for DWI, the outcomes of the arrests, and the long-term effect of arrest on recidivism. In addition, data that are collected and reported are not necessarily collected using standardized or uniform definitions, which is a challenge for traffic safety in general, not just alcohol-impaired driving. One example of the difficulty related to alcohol-impaired driving is the lack of information on drivers convicted of a DWI charge whose licenses are suspended or revoked, but who continue to drive during the suspension or revocation periods. As penalties tend to differ depending upon state policies, as well as the judicial process, data on penalties and how often specific penalties are imposed are lacking. The penalties may be affected by various
TABLE 6-2 Strengths, Weaknesses, and Biases of Datasets That Include Information on Alcohol-Impaired Driving
| Conceptual Framework Phase | Data Source | Conducted/Managed by | Data Collection Method and Data Collected | Important Characteristics (Strengths, Weaknesses, Biases, and Limitations) |
|---|---|---|---|---|
| Alcohol Consumption; Drink to Impairment; Drive Impaired | Behavioral Risk Factor Surveillance System | Centers for Disease Control and Prevention |
|
|
| Youth Risk Behavior Surveillance System | Centers for Disease Control and Prevention |
|
|
| National Survey on Drug Use and Health | Substance Abuse and Mental Health Services Administration |
|
|
|
| National Roadside Survey of Alcohol and Drug Use by Drivers | National Highway Traffic Safety Administration |
|
|
|
| National Alcohol Surveys | Alcohol Research Group and National Alcohol Research Center |
|
|
|
| Alcohol Policy Information System | CDM Group, Inc.; National Institute on Alcohol Abuse and Alcoholism; Pacific Institute for Research and Evaluation |
|
|
| Conceptual Framework Phase | Data Source | Conducted/Managed by | Data Collection Method and Data Collected | Important Characteristics (Strengths, Weaknesses, Biases, and Limitations) |
|---|---|---|---|---|
| Motor Vehicle Crash | State Data System | National Highway Traffic Safety Administration |
|
|
| Crash Outcome Data Evaluation System | National Highway Traffic Safety Administration |
|
|
| National Incident-Based Reporting System | Federal Bureau of Investigation |
|
|
|
| Uniform Crime Reporting | Federal Bureau of Investigation |
|
|
| Conceptual Framework Phase | Data Source | Conducted/Managed by | Data Collection Method and Data Collected | Important Characteristics (Strengths, Weaknesses, Biases, and Limitations) |
|---|---|---|---|---|
| Serious Injuries and Fatalities | Fatality Analysis Reporting System | National Highway Traffic Safety Administration |
|
|
| Web-based Injury Statistics Query and Reporting System | Centers for Disease Control and Prevention |
|
|
|
| National Trauma Data Bank | American College of Surgeons |
|
|
| Conceptual Framework Phase | Data Source | Conducted/Managed by | Data Collection Method and Data Collected | Important Characteristics (Strengths, Weaknesses, Biases, and Limitations) |
|---|---|---|---|---|
| Nationwide Emergency Department Sample | Agency for Healthcare Research and Quality’s Healthcare Cost and Utilization Project |
|
|
|
| Denominator Data | National Household Travel Survey | Federal Highway Administration |
|
|
| Highway Vehicle Miles Travel | Federal Highway Administration |
|
|
factors in addition to the specific charge, including legal defense strategies, courtroom advocates, local standards, and biases. One of the difficulties across the data collection spectrum is the time and financial burden of data collection and submission. Incentives can be used to increase the reliability of and routine approach to data collection. Another limitation is that for all but serious injuries, law enforcement reporting of contributing factors (such as alcohol) is often poorly documented (DiMaggio et al., 2018). Apparent alcohol involvement does not necessarily involve the results of testing for alcohol or obtaining a BAC result and may be based on the judgment of the officer at the scene, which is a subjective rather than objective assessment. Data collected on injury severity may suffer from similar limitations, as injury severity in many cases is a subjective measure with broad categories of severity and differs from anatomic and physiological measures of severity. For crash report documentation, injury severity may be limited to KSI or killed, severe injury, minor injury, no injury (KABCO).
An additional gap is data on the involvement of alcohol in motor vehicle crashes resulting in hospital admissions, as BAC testing is not always performed for fatally injured drivers and infrequently performed for hospitalized persons. The NTDB contains information on alcohol involvement but lacks data from many hospitals with low rates of BAC testing, particularly as state laws vary on whether law enforcement has access to the results of BAC tests that are obtained for clinical purposes (Meisel, 2006). In addition, drawing a patient’s blood without a medical reason to do so may be interpreted as a violation of the Hippocratic oath and presents a bioethical dilemma for physicians (Meisel, 2006). This may be an issue with respect to expecting practitioners to obtain a BAC result purely for legal reasons, although in some EDs, there are existing policies that allow practitioners to obtain a serum BAC from noninjured drivers suspected of DWI for legal evidence with the consent of the person from whom the BAC is being drawn (once drawn, the serum is placed in an evidence container and given to law enforcement to submit to a laboratory for testing). However, there are clinical reasons why BAC testing may be helpful, including the potential effect of alcohol consumption on treatment as well as the potential for alcohol withdrawal that may occur during hospitalization of a person who is alcohol dependent. The BAC itself may provide some indication of alcohol dependence, as tolerance to higher BACs may be a sign of chronic alcohol use and tolerance (Lapham, 2010). In addition, knowledge of a patient’s BAC at the time of a crash or shortly thereafter can provide an indication of the need for intervention or treatment for alcohol use disorders. Although there are several clinical reasons for BAC testing, evidence that mandatory BAC testing in hospitals decreases reported rates of alcohol-impaired driving does not
currently exist (Meisel, 2006). However, uniform BAC testing in hospitals could provide stronger evidence for law enforcement officials to pursue legal sanctions and/or prosecution more swiftly and is an increasingly important data need as greater numbers of drivers survive serious crashes due to improved motor vehicle safety features.
While alternative transportation options are growing across the country, data on the options, their availability, and the challenges in implementing and maintaining these options are not readily available. This is particularly true in rural areas, which may have more limited access to transportation options, including public transportation, than urban and suburban areas.
There are numerous data gaps related to the alcohol industry and policy. While proprietary data may exist on consumption patterns and sales of alcohol in both on-premise and off-premise environments, public access to these data is limited. Data on marketing and marketing policy are not readily available and could affect regulatory approaches to marketing and advertising. The APIS has detailed data on some major policies at the state and federal level based on information provided by NHTSA, but it lacks data on other policies that may be influential in decreasing alcohol-impaired driving, including data on administrative license revocation (detailed data for each state are not available), sobriety checkpoints, saturation patrols, and ignition interlock devices. In addition, the APIS does not provide data on laws that might affect alcohol-impaired driving or be affected by it, such as laws on speeding, occupant restraints, distracted driving, and impairment due to drugs other than cannabis. On the policy level, data on innovative policies that are in place in some states to increase the availability of evidence of DWI, such as allowing the use of hospital-obtained BAC levels that are part of routine ED/trauma care, are not readily available. Other policy information such as medical examiner/coroner standards for testing for BAC in a person who dies as a result of a traffic crash, even if an autopsy is not performed, is limited. More information on the impact and effectiveness of reporting of at-risk drivers to the DMV is needed, as is detailed information about the effectiveness of various methods of reviewing the reports and acting on them.
There are examples of data collection methods and datasets that might be helpful in designing optimal data collection methods (CDC, n.d.-b). The National Violent Death Reporting System (NVDRS), which exists in the majority of states, may have some lessons to be learned about standardized data collection, as well as data linkages, as the lack of standardized and coordinated data jeopardizes public health activities in addition to law enforcement and policy development. One of the potential difficulties with NVDRS is that the same data elements may be entered from multiple sources (Crosby et al., 2016) and may differ among the sources. A system
has been set up within NVDRS to select the most authoritative source for specific data elements. While NVDRS has some potential issues with data quality, timeliness, and consistency, it does provide a comprehensive picture of violent deaths. However, there is difficulty in agreement on data definitions, legal access to data, data system gaps, and data quality concerns. The accuracy and completeness of NVDRS data depend on coding, completeness, and accuracy in the data systems that contribute to it. One issue is the number of deaths for which an intent is listed as “undetermined;” this means that it is not possible to determine whether these deaths are due to suicide or some other factor (Breiding and Wiersema, 2006; Rockett et al., 2014). Much like the FARS, NVDRS has a bias in that it only focuses on fatalities and does not provide a comprehensive picture of violence, just as the FARS does not provide a comprehensive picture of motor vehicle crash-related injuries and vehicular damage.
There are a number of issues with documenting the presence of alcohol in crash injuries or fatalities. When BAC and/or field sobriety testing are not performed, the assessment of whether alcohol was a factor in a crash is far less reliable, as studies have shown. Use of law enforcement estimates of severity are less specific than identifying the actual severity of injury using diagnoses made in a health care setting. Limiting attribution of a death that occurs later than 30 days after a crash may result in an underestimate of the number of fatalities caused by alcohol-impaired driving crashes. While a late death may be affected by other factors, a review of late deaths would be critical to determining this.
PUBLIC HEALTH AND HOSPITAL DATASETS
While public health datasets may not contain all of the traffic information that is present in a dataset focused on transportation, they often include information on the use of occupant restraints, motorcycle or bicycle helmets, and sometimes the circumstances of a crash. In hospital and ED datasets, coding is performed based on documentation in the medical record about the event that led to injury. This may also include the type of crash (head-on, rear-end, side impact, pedestrian struck by a car, bus, or other vehicle). In addition, clinical datasets that are used by public health researchers have more sensitive measures of injury severity, such as the Injury Severity Score, primarily on a continuous numeric scale using a standardized scoring system that accounts for injuries to various organ systems.
Data on BAC alone may be helpful in estimating degree of alcohol consumption by persons who have been injured or killed in a traffic-related event. BAC information that is obtained as part of routine trauma care in an ED may be used as the basis for providing an
intervention to decrease the risk of future events in a person who exhibits at-risk drinking. In other words, the knowledge of how frequently an opportunity to intervene in order to prevent future alcohol-impaired driving events exists in the ED, or in a hospital ward, and can aid in decreasing future events. In health care settings, practitioners can use the window of opportunity provided by detecting an elevated BAC to address problematic alcohol consumption and its potential consequences (see Chapter 5 for more information). BAC information that may be available in a hospital setting may also affect the care that is provided as well as survival of the person who is injured.
Information obtained from various datasets that have different data points can aid researchers and evaluators in identifying unique risk factors that are associated with the consequences of alcohol impairment. A dataset that focuses on reported alcohol consumption across various age groups in a population provides the patterns of alcohol use that are most common in various age groups. For example, it could be found that young adults are more likely to have a higher rate of binge drinking than older adults, or that college students are more likely to engage in the practice of “pre-gaming” (consuming alcohol prior to going out to a party or social event). The data may also provide researchers with information about where alcohol is obtained, as well as what type of alcohol is consumed by various age, sex, and racial and ethnic groups. These data can then be used to identify and evaluate interventions targeted at the provision of alcohol to youth under the minimum legal drinking age or to promoting sales of excessive numbers of drinks in on-premise settings. Combining various datasets can give a comprehensive picture of risks for, and associated with, alcohol consumption and subsequent alcohol-impaired driving. Researchers may find that there are differing risks for older adults due to the combination of alcohol with medications for chronic conditions, that there are differences in consumption patterns in different communities, and/or that states differ in the proportions of various groups reporting driving after drinking. When combined with data on DWI arrests and prosecutions, these data can provide a more comprehensive picture of how enforcement affects drinking practices or the use of alternative transportation. Leveraging and, when possible, combining available datasets with awareness of their strengths and limitations enables researchers to obtain a more comprehensive understanding of alcohol-impaired driving and determine more effective intervention and prevention strategies.
OPPORTUNITIES FOR DATA COLLECTION AND SURVEILLANCE
Applying an Epidemiological Investigation Approach
There are strategies and insights that could be extracted from epidemiological approaches and translated to efforts to prevent alcohol-impaired driving fatalities by identifying high-impact targets (e.g., bars that overserve patrons or specific locations where a high proportion of crashes occur). These kinds of investigative approaches have been highly effective for public health agencies that are facing an infectious disease outbreak or that want to identify populations at high risk of specific diseases or conditions. Epidemic-assistance investigations (Epi-Aids) conducted by CDC are one example of public health data-driven approaches that have provided rapid and pertinent information to guide targeted interventions for over 70 years (Brachman and Thacker, 2011). The Crash Injury Research and Engineering Network (CIREN) project provides multisector data that can be used to research alcohol-related crashes and fatalities (NHTSA, n.d.-a).10 The CIREN process combines prospective data collection with professional multidisciplinary analysis of medical and engineering evidence to determine injury causation in every crash investigation conducted. Analyses might involve multiple agencies, and might use an approach similar to the CIREN strategy.
The Epi-Aid strategy is often used when there are a number of illnesses or deaths occurring in a particular state or region and the investigative team is sent out to explore the incidents and gather data, then document findings. It is labor intensive, and there are limitations on the number of teams potentially available at any given time and costs incurred to send them to a location. Ideally public health, law enforcement, health care, traffic safety engineers, and researchers would all be involved in such an approach for studying alcohol-impaired driving. Departments of transportation also need to be engaged in funding an organization to serve as a repository for the reports.
One related strategy that is already being implemented among certain law enforcement agencies is source investigations following an alcohol-related crash. Source investigations use criminal and administrative techniques to determine where alcohol was purchased and/or consumed (Ramirez, 2017). These investigations have been identified as promising strategies for holding irresponsible licensed entities and sellers accountable for selling to intoxicated or underage persons (Curtis and Ramirez,
___________________
10 CIREN was established as a result of a recommendation in the report Injury in America: A Continuing Public Health Problem that injury should be studied with a multidisciplinary approach involving experts from engineering, medicine, and other relevant fields (NHTSA, n.d.-a; NRC and IOM, 1985).
2011). The information could also be used to better target education efforts on overserving. However, the investigations can be very resource intensive. Curtis and Ramirez (2011) offer recommendations to improve source investigations through interagency collaboration, training for enforcement officials, and media coverage of the investigations. To enhance the implementation of source investigations, the National Liquor Law Enforcement Association created a toolkit as an online resource for local enforcement agencies.11
Another approach that could effectively identify areas in need of intervention is the spatial mapping of motor vehicle crashes. This allows for the visual identification of high-impact locations, trends (e.g., times, days, traffic flow), and outliers. For example, Schneider et al. (2017) conducted a spatiotemporal analysis of alcohol-related crashes in Cuyahoga County, Ohio, which enabled the authors to identify the movement of hotspots through the time of day and day of the week. This kind of data would be valuable to a local law enforcement agency as it could, for example, help identify optimal times and locations for deploying resources for publicized sobriety checkpoints. Researchers have already begun to use spatial analyses to assess the relationships between alcohol-related crashes and specific environmental factors, such as retail alcohol density (see Li et al., 2013, and Morrison et al., 2016), but more small-area analyses are needed. Finally, this tactic would align well with the NHTSA’s Data-Driven Approaches to Crime and Traffic Safety framework (NHTSA, n.d.-b). The following section on big data opportunities expands this discussion to include the role of geographic information systems in tracking motor vehicle crashes.
Big Data Opportunities
Modern technological advances have enabled passive collection of enormous quantities of “big data” and created an increasingly data-driven society. Big data, as described by IBM, is characterized by four attributes: volume (increasingly large quantities of data), velocity (increasingly more capabilities to generate data), variety (increasingly diverse sources of data), and veracity (increasingly greater chances of inaccurate and/or poor quality data) (IBM, n.d.-a). Big data collection has had significant implications for the health and transportation sectors, and data collected on drinking and driving are important for determining effective interventions and strategies to reduce alcohol-related driving fatalities. As noted earlier, data related to drinking and driving have the potential to inform
___________________
11 For more information, see http://www.nllea.org/SIT/sit.asp (accessed September 6, 2017).
place-based interventions, improve enforcement efforts, and guide more efficient allocation of resources. The following section describes sources, uses, and limitations of big data and ways in which various public- and private-sector stakeholders have leveraged big data to improve traffic safety. Barriers and challenges to using big data, such as difficulty merging different sources, privacy concerns, and lack of state-level resources for data dissemination, are important considerations as potential sources and uses of big data continue to grow.
Big Data from Smartphone Apps
New generations of smartphones are equipped with increasingly sophisticated sensors that have the ability to passively collect data relevant to alcohol-impaired driving. Mobile phone apps have been developed to estimate an individual’s alcohol consumption level by their gait; these apps also record geographical location and time to help identify patterns of unsafe drinking (Arnold et al., 2015; Kao et al., 2012).
Smartphone sensors can also be used to detect unsafe driving behavior, including unsafe behavior specifically related to alcohol impairment. Uber, for example, has begun using GPS and gyroscopes on both driver and passenger smartphones to identify and track unsafe drivers (Brian, 2016). Mobile apps have been developed to detect alcohol-impaired driving behavior through data collected from built-in sensors that are compared with data collected from alcohol-impaired driving tests (Dai et al., 2010). More recently, researchers in China developed and tested a smartphone autocalibration algorithm that uses a smartphone’s accelerometer, gyroscope, GPS, and microphone to collect and process data related to unsafe driving behavior (Ma et al., 2017). Known as DrivingSense, the algorithm is designed to specifically identify speeding, unusual changes in direction, and abnormal control of speed. If unsafe driving behavior is detected, the tool can alert the driver to potentially decrease the risk of crash. Published results indicate that the algorithm detects unusual changes in direction and abnormal control of speed with about 94 percent precision and 91 percent recall; the tool also estimated speed with less than 2 meters per second of error (Ma et al., 2017).
Big Data from the Private Sector
The beverage, health care, and insurance industries routinely collect massive quantities of data related to alcohol-impaired driving. Such data may have the potential to be immensely useful for identifying patterns of beverage service and alcohol consumption and pinpointing locations at which these behaviors take place. The alcohol industry would have
consumption data, including data, for example, on how frequently laws that allow restaurant patrons to have an unfinished bottle of wine resealed for them to take home are used, and whether these laws have resulted in increased sales. It is likely that the alcohol industry would also have data on the time of day and day of the week for both on-premise and off-premise sales.
Auto insurance companies have collected vast amounts of data related to their customers’ driving behavior. Progressive Corporation began offering devices that track driving behavior in 1998, becoming the first auto insurance company to offer telematics devices (for more information on telematics, see the Telematics and Usage-Based Insurance section in this chapter) (Rainie and Duggan, 2016; Threewitt, 2016). Since 2008 the company has used an optional tracking device known as Snapshot (used to track driving behavior to more accurately assess risk and price premiums) to collect 10 billion miles of time, speed, and GPS data (Gagliordi, 2014).
Sources and Opportunities for Big Data Linkages
The Crash Injury Research and Engineering Network As mentioned earlier in this chapter, CIREN, which began in 1996, is a research program that links level I trauma centers through a computer network, enabling each center to add discrete crash and medical data on motor vehicle crashes to a single database (NHTSA, n.d.-a). CIREN’s data collection process includes initial detection of environmental, technical, or human factors related to injury causation; routine collection of more than 1,000 data points on each crash; and detailed information on occupant injury, vehicle damage, restraint technology, and crash environment. Each case is reviewed by a team of medical and engineering professionals (such as trauma surgeons, emergency physicians, mechanical engineers trained in biomechanics, epidemiologists, and nurses), as well as a crash investigator.
Crash Outcome Data Evaluation System As discussed earlier in the chapter, CODES is a state-based program that links motor vehicle crash report data and hospital record data using probabilistic linkage methodology designed to combine information from different databases into a single dataset for analysis (Kindelberger and Milani, 2015). Initially, CODES consisted of cooperative agreements between NHTSA and participating states that allowed NHTSA to provide technical assistance and funding. After NHTSA transitioned the program to the state level in 2013, many states ceased to continue the program (Kindelberger and Milani, 2015; Milani et al., 2015).
While neither CIREN nor CODES were specifically designed to study alcohol-impaired driving, both programs can add to the information on
the effects of alcohol-impaired driving. For example, injury data are helpful in understanding how many people are seriously injured by an impaired driver. CIREN in particular may not be intended for the study of alcohol-impaired driving, but nonetheless provides valuable information about vehicles and crash circumstances that can help to understand vehicular protective factors that help prevent injuries and fatalities when a driver is alcohol impaired.
Predictive Crash Analytics
Many new approaches and software to leverage big data (e.g., machine learning) are emerging. In the past few years several states have begun initiatives to leverage big data to predict high-risk crash areas and more effectively and efficiently allocate resources to improve traffic safety. Recently, the Tennessee Highway Patrol partnered with IBM to create predictive crash software that the agency began using in late 2013 (Bergal, 2017; IBM, 2015). In 2016, Indiana’s state police agency and Management Performance Hub (a state office tasked with improving government operations via enterprise-wide data sharing and transparency efforts) developed an interactive daily crash prediction map that is not only used by law enforcement but is also accessible to the public (Carmen, 2016).12Boxes 6-1 and 6-2 provide more information on the funding, implementation, and available outcomes of these two states’ efforts.
The initial success of Tennessee and Indiana’s efforts has prompted other states to invest in predictive crash analytics initiatives as well. The Missouri State Highway Patrol received a 3-year $148,000 federal grant to collect data, purchase software, and run computer model testing (Bergal, 2017). The agency plans for the tool to be implemented in early 2018. The Wisconsin State Patrol and University of Wisconsin are collecting the time, day, and location of crashes in Wisconsin and factors that contributed to the crashes to develop a program that will assist in dispatching law enforcement personnel to areas where crashes with fatalities or serious injuries have occurred (Bergal, 2017). The program is expected to launch in late 2017.
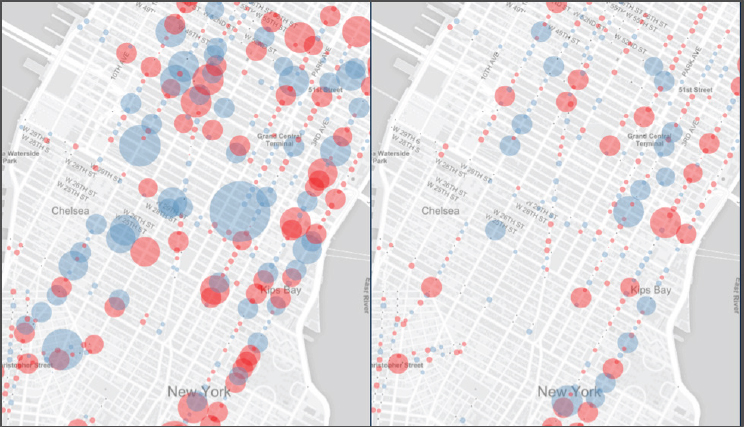
Some cities are also using predictive crash analytics to improve traffic and road safety. DataKind and Microsoft began a partnership in 2015 to support Vision Zero efforts in New York (expanding to New Orleans, San Jose, and Seattle in 2016) by using public and private data to better understand the most effective engineering and enforcement interventions to improve traffic safety and inform local policy making (DataKind,
___________________
12 See https://in.gov/isp/ispCrashApp/main.html (accessed July 17, 2017). See also Box 6-2 and Figure 6-1.
2016). Each municipality began by sharing a traffic safety challenge specific to their city, around which city-specific data were used to build and train machine learning models to assess effects of and potential sites for local interventions (Grossman, 2017). Figure 6-2 shows locations of street improvement projects in New York and subsequent changes in crashes. Researchers have built models using open data and internal data (used by government departments) that have enabled estimates of the citywide number of motor vehicles on individual streets, which street and signal designs at intersections contribute to bicycle and pedestrian collisions and their severity (i.e., high-risk areas between intersections), and so on (Shueh, 2017).
Predictive analytics may also be an important data source. Milliman, an actuarial and consulting firm, used crash descriptions from NHTSA data on 7,000 automobile crashes to collect narrative data on the involvement of medications, prescriptions, drugs, and illegal narcotics in automobile crashes (Borba, 2013). Narrative descriptions were broken into
SOURCE: DataKind, 2017.
phrases, with more than 13 million unique phrases generated. A statistically significant relationship was found between drug-impaired driving descriptions and crash severity (i.e., whether an injury occurred), indicating that narrative data obtained from crash descriptions, claim adjuster notes, and so on can be beneficial for increasing the accuracy of risk calculation (Borba, 2013).
Government, nonprofit, and private-sector (e.g., IBM and Microsoft) collaboration has enabled state and municipal agencies to leverage various public and private data sources to locate traffic crash hotspots and implement proven and promising safety interventions in these areas with consideration of local circumstances.
Telematics and Usage-Based Insurance
Usage-based insurance involves real-time monitoring of driver behavior (vehicle miles driven, time of day, location of driving activity, speed and acceleration, and braking) to assess and price auto insurance premiums (National Association of Insurance Commissioners, 2017). Driver behavior, including behaviors related to alcohol-impaired driving, can be monitored through GPS sensors, odometers, and in-vehicle telecommunication devices (telematics) that can be self-installed or installed by car manufacturers, subscription-based car connectivity services, and mobile
apps (Marquand, 2016; National Association of Insurance Commissioners, 2017). In addition, many cars have internal real-time communication devices that relate crash information, including vehicle condition and crash location, to call centers (e.g., GM’s OnStar) and/or that transmit warnings for lane deviation, excessive braking, and other driving-related behaviors (e.g., Toyota’s Safety Sense), many of which may indicate and can be used to detect alcohol impairment on the part of the driver (OnStar, n.d.; Toyota, n.d.).
Soleymanian et al. (2016) examined the effect of usage-based insurance on changing customers’ driving behavior and found improvements in driving behavior after adoption of usage-based insurance. Daily average frequency of hard braking decreased 21 percent after adopting usage-based insurance for 6 months; however, no significant effect on mileage driven was found. Relative to older drivers, younger drivers adopted usage-based insurance at higher rates and improved their driving scores more quickly. Significant differences were recorded in individual driving scores, suggesting that auto insurance companies can benefit with more accurate risk assessment calculated from usage-based insurance. Soleymanian et al. (2016) concluded that usage-based insurance can be beneficial for both drivers and insurance companies.
Using GIS to Study Motor Vehicle Crashes
Evidence suggests that GIS can be an effective tool for collecting geolocation data to analyze motor vehicle crashes. GIS data can be used to identify and examine a range of factors that contribute to alcohol-impaired driving fatalities, including spatial relationships between motor vehicle crashes and alcohol outlets as well as areas with high risk for crashes owing to poor roadway design and adverse weather conditions.
Stevenson et al. (1998) analyzed whether alcohol-related crashes occur more frequently and/or cluster near on-premises drinking establishments. GIS was used to determine distances between crash locations and on-premises drinking establishments. The authors did not find a statistically significant correlation but concluded that “GIS technology can be useful for assessing potential environmental risk factors for alcohol-related motor vehicle crashes, such as retail alcohol outlets, and for planning public health interventions that promote traffic safety” (Stevenson et al., 1998, p. 197). Similarly, Meliker et al. (2004) conducted a cross-sectional study to examine geographic patterns between alcohol-impaired driving crashes and retail alcohol outlet locations. Using spatial analysis, distance analysis (using ArcGIS), and other statistical methods to analyze BAC levels, traffic and roadway information, census data, and distribution of retail alcohol outlets, the authors found that areas with low population density
had more alcohol-impaired driving crashes; no significant relationship between retail alcohol outlets and alcohol-impaired driving crashes was found (Meliker et al., 2004).
Li et al. (2007) analyzed motor vehicle crashes in Harris County (primarily Houston), Texas, to identify roadway segments with potentially high crash risk. Using a GIS-based mapping approach, the authors identified spatial-temporal patterns of relative crash risks and used these data to rank risky roadway segments. Similarly, Saha et al. (2016) analyzed spatial relationships between driving fatalities by state and adverse weather conditions. ArcGIS was used to create state-level maps for total fatality rates by state and fatality rates by vehicle miles traveled related to adverse weather conditions.
Data Integration
The opportunities for short- and long-term data integration continue to increase as new technologies emerge and information systems become more powerful and accessible. There are opportunities for exploring the options of connecting and linking existing data systems to obtain a more complete picture of alcohol-related crashes, as projects such as the CODES project have demonstrated.
A current injury-related project that is linking health care, law enforcement, and medical examiner/coroner data is the NVDRS, which is overseen by CDC (CDC, n.d.-b). As with the CODES project, the NVDRS provides a more detailed picture of an event, and the factors possibly leading up to it, as well as circumstances surrounding the event (Crosby et al., 2016). NVDRS requires no additional data collection; all data are collected by other existing data systems. NVDRS can provide information on linked homicide/suicide, details about types of homicides and suicides, and information that might highlight risk factors for violent death. As data are obtained from medical examiner/coroner offices, there may be both primary and secondary data sources that contribute information to NVDRS. In addition, data are obtained from hospital records, as well as law enforcement. Because NVDRS is based on state-based data systems, each state’s violent death reporting system may look different as states may decide to collect data in addition to the data that are submitted to NVDRS.
Data from technologies such as ignition interlock devices, smartphones, and vehicle telematics can contribute to an understanding of crash-related factors and can be combined with EMS, law enforcement, hospital, and medical examiner/coroner data to add to the information about a crash. Drivers’ license data can be added to provide a perspective on prior DWI arrests. These various existing datasets could be used
in conjunction with one another, even if not linked, to provide a more complete picture of alcohol-impaired driving and related fatalities.
With any data, there is a concern about confidentiality and protection of an individual’s protected information. Aggregate data reporting can aid in addressing this, but individual data are clearly needed for enforcement and prosecution in an alcohol-impaired driving crash. Data that are used for public health purposes have protections and exemptions in place, but other data sources may not have these protections. However, research projects generally require review by an institutional review board to ensure compliance with privacy protections and access to identifiable data.
DATA TRANSPARENCY, ACCESS, AND STAKEHOLDERS
Data transparency and access are crucial in understanding the context and patterns of alcohol purchase and consumption, risks and factors associated with alcohol-impaired driving and its consequences, and the effect of policies in place to prevent alcohol-impaired driving crashes. Data are the building blocks of interventions that are effective and lasting.
There are challenges to data access, cost of data access, and transparency, but these barriers can be mitigated and overcome through thoughtful and collaborative initiatives to provide access to the data that are needed. One of the keys to developing these strategies is the identification of the desired outcomes of data collection and analysis. For some outcomes studied, data on individual cases may not be needed, while aggregate data can be helpful. For example, in looking at alternative transportation as a prevention method, aggregate data on the numbers and locations of alternative transportation options, combined with information on the trends in alcohol-impaired driving crashes in the areas where alternative transportation options are available as compared to areas with limited alternative transportation options, may provide valuable information on the effect of such transports on decreasing alcohol-impaired driving crashes. This is an example of combining information from multiple datasets that illustrates the potential for combining publicly available data with private or proprietary data in a way that allows for the use of summary data rather than detailed data that a private entity might be reluctant to release. A similar kind of strategy might examine the relationship between alcohol advertising and alcohol-impaired driving crashes in a specific locale, particularly after an event at which alcohol is heavily marketed and/or consumed. Monitoring of new product development and marketing and the effect on alcohol-related crashes is also needed so when such products as premixed alcoholic energy drinks come on the market, there is some early assessment of their effect on public safety and
welfare. Such data collection could be done, for instance, in the ED if persons admitted for injury who had been drinking prior to that injury were asked what alcoholic beverage they drank prior to injury (Jernigan et al., 2013). Looking at the effect of the transport use on insurance companies may highlight a benefit to health insurance companies and auto insurance companies, which could also be studied using aggregate data.
There are multiple stakeholders for the data initiatives, even if the stakeholder groups are not necessarily aware of their stake in having accurate data. Consumers, who may not necessarily use the data or access it, can benefit from policies and practices that are based on data and decrease their risk of injury and death caused by alcohol-impaired driving. Health care systems benefit from decreased needs for treatment of critical and life-threatening injuries, as this care places financial, personnel, and facility/space burdens on a system. The beverage and hospitality industries can benefit from consumers remaining active and healthy and able to consume their products and services. Public health benefits from the contribution of decreased alcohol-impaired driving fatality deaths, which affect community and family health.
FUTURE DATA AND SURVEILLANCE NEEDS
Efforts toward surveillance of alcohol-impaired driving, crashes, fatalities, arrests, and outcomes are hampered by the lack of available, high-quality, consistent data across states and local jurisdictions. To accelerate progress toward the goal of achieving zero motor vehicle fatalities, strong data collection and analysis of transportation safety and hospital data are critically important (Shahum and Vanderkooy, 2017). Current data collection and surveillance systems need to be strengthened, and harmonization of existing sources and definitions are needed to perform more targeted analyses of the data and to get interpretation to those who can take action, such as law enforcement, policy makers, auto makers, and public health agencies. Ultimately this will result in a better use of resources and provide more targeted and effective solutions. Data from multiple sources (insurers, transportation sector, law enforcement, automobiles, payment systems, and so on) can be combined and used in real time for research. Public–private partnerships exist for data mining and analysis to identify high-risk areas and populations, and can be useful for alcohol-impaired driving research.
Having a comprehensive understanding of alcohol-impaired driving, both in regard to the rates of occurrence, traffic crashes, injuries, fatalities, arrests, and convictions, as well as qualitative data on when and why people drive impaired, is vital to creating specific and targeted interventions to reduce it. However, there are several barriers to gaining
a comprehensive picture and identifying needs at the federal, state, and local levels. There are data gaps (such as lack of data on place of last drink), methodological issues (such as inconsistent data collection), and a lack of integration of datasets (e.g., how many people are arrested, outcomes of arrest, and long-term outcomes in terms of recidivism). Therefore, the committee concludes:
Conclusion 6-1: Data collection and reporting of high-risk intersections, outlets, drinking behaviors before driving, risk factors, and demographic trends are needed to measure, evaluate, and accelerate progress in reducing risk of fatalities. This evaluation would be facilitated by regular, systematic data collection on geocoded crash locations linked to data systems that monitor injury and fatality information, as well as criminal justice outcomes.
While data quality, timeliness, completeness, and data element definitions and coding can be challenging with respect to the development and maintenance of datasets that provide information on alcohol-impaired driving, advances in technology and means of accessing data can aid in improving datasets so that they are more readily accessible and useful. There is a range of stakeholders who are interested in the data for various uses, including tracking changes in crash rates, injury rates and fatality rates, and identifying risks for crashing. Data are also used to inform the development of new interventions and policies and need to be accessible and usable for evaluating the impact of interventions of various types. While data may come from multiple sources, methods of data linkages have been tested in other datasets and the success of the linkages has been demonstrated. Strategies that involve migrating and transforming variables have been used in large datasets. Standardizing data definitions so that the data can be used to answer the questions posed by stakeholders may involve bringing together stakeholders, agencies, and organizations that collect the data to develop consensus on critical variables. This is not to say that all variables in every dataset will need to be brought into a larger dataset, as various agencies may have needs for specific variables that other agencies do not. Critical issues include timeliness as well as some degree of uniformity in the reporting of variables. The committee recommends:
Recommendation 6-1: The National Highway Traffic Safety Administration should ensure that timely standardized data on alcohol-impaired driving, crashes, serious injuries, and fatalities are collected and accessible for evaluation, research, and strategic public dissemination; should ensure that data
from other government agencies and private organizations are included as needed; and should explore the usefulness of big data for inclusion in alcohol-impaired driving information strategies.
Reducing alcohol-impaired driving requires diligent and accurate collection of surveillance data. Examples of improvements necessary for advancing the science include
- Standardized data definitions across multiple sectors regarding assessment of crash occurrence, severity, and alcohol involvement;
- Harmonization of reported data regarding assessment of alcohol involvement, including use of imputation models for assessment of alcohol-related crashes;
- Universal assessment of drug involvement among fatally injured drivers across states; and
- Increased capacity and resources for data linkages (e.g., state data systems that feed into national databanks) for research purposes across multiple systems including EMS, hospital and other care facilities, law enforcement, and medical examiners/coroners.
While it can be difficult to develop a consensus on data definitions, reporting strategies, and dataset linkages, bringing stakeholders together to resolve the issues that exist due to a lack of data and/or difficulties with access to datasets is a method that has been used successfully in developing datasets that can be used by multiple stakeholders. CODES projects highlight the impact of combined datasets that provide information that multiple stakeholders use for their own, as well as combined, purposes. Another example of a dataset that has been developed and is used by a large group of stakeholders, who sometimes have different needs for the data, is the NTDB, which has been implemented in trauma centers across the United States and whose design and data definitions have formed the basis for discussion of trauma datasets on an international level. While it may seem as though the stakeholders who are engaged in the care and treatment of trauma patients lack diverse needs for data, the stakeholders include trauma surgeons, emergency physicians, hospital administrators, public health practitioners, epidemiologists, and emergency medical services (American College of Surgeons, n.d.).
Another example of a multistakeholder group that has successfully formulated action plans and strategies is the Interagency Coordinating Committee on the Prevention of Underage Drinking (ICCPUD), which was mandated by the Sober Truth on Preventing Underage Drinking (STOP) Act passed by Congress in 2006 (SAMHSA, 2017b). ICCPUD
members are representatives from 15 federal agencies, with SAMHSA taking on the role of lead agency, tasked with coordinating federal efforts to address underage drinking issues. ICCPUD’s formation carried out a recommendation from the 2004 National Research Council and Institute of Medicine report Reducing Underage Drinking: A Collective Responsibility, namely the establishment of “a federal interagency coordinating committee on prevention of underage drinking” (Dowdall, 2013; NRC and IOM, 2004). ICCPUD continues to be active in efforts to reduce and prevent underage drinking by producing mandated annual reports to Congress and generating other initiatives involving all member federal agencies (SAMHSA, 2017a,b). Efforts to reduce alcohol-impaired driving through improved surveillance and data have potential to benefit by following a similar model of streamlining federal efforts with a multistakeholder coordinating entity. The committee recommends:
Recommendation 6-2: To facilitate surveillance of alcohol-impaired driving that is timely, ongoing, concise, and actionable, the National Highway Traffic Safety Administration should convene a diverse group of stakeholders that includes academic researchers, law enforcement, city and state public health, transportation sector, and other federal agency representation to create and maintain a metrics dashboard, and publish brief, visually appealing quarterly and annual national and state-by-state reports that analyze and interpret progress in reducing alcohol-impaired driving.
This recommendation entails identifying the data elements and data sources that are needed to monitor changes in rates of alcohol-impaired driving risk factors (including place of last drink), arrests, crashes, injuries, and fatalities, as well as data elements needed to inform quarterly metrics and reports designed for dissemination to the public, public and private stakeholders, and local, state, and national policy makers through various communication strategies. In addition, it involves ensuring that data for research on the effect of interventions to reduce alcohol-impaired driving are accessible and available using techniques that reflect contemporary standards for data acquisition and downloading. To be impactful and to raise awareness of the problem of alcohol-impaired driving, the data should be strategically released to inculcate action. The dashboard (a user-friendly interface) should contain analyzed data, including longitudinal data linking crash data with licensing data, hospital data that includes costs for care, arrest data, and the results of arrest.
REFERENCES
AAA (American Automobile Association) Foundation for Traffic Safety. 2016. Prevalence of marijuana involvement in fatal crashes: Washington, 2010-2014. Washington, DC: AAA Foundation for Traffic Safety.
American College of Surgeons. n.d. National Trauma Data Bank. https://www.facs.org/quality-programs/trauma/ntdb (accessed August 7, 2017).
APIS (Alcohol Policy Information System). n.d.-a. About the Alcohol Policy Information System (APIS). https://alcoholpolicy.niaaa.nih.gov/About_APIS.html (accessed November 7, 2017).
APIS. n.d.-b. Welcome to the Alcohol Policy Information System. https://alcoholpolicy.niaaa.nih.gov (accessed October 10, 2017).
ARG (Alcohol Research Group). n.d. National Alcohol Surveys. http://arg.org/center/national-alcohol-surveys (accessed October 10, 2017).
Arnold, Z., D. Larose, and E. Agu. 2015. Smartphone inference of alcohol consumption levels from gait. Paper presented at 2015 International Conference on Healthcare Informatics, Dallas, TX.
Batts, K., M. Pemberton, J. Bose, B. Weimer, L. Henderson, M. Penne, J. Gfoerer, D. Trunzo, and A. Strashny. 2014. Comparing and evaluating substance use treatment utilization estimates from the National Survey on Drug Use and Health and other data sources. Rockville, MD: Center for Behavioral Health Statistics and Quality.
Bergal, J. 2017. Troopers use “big data” to predict crash sites. http://www.pewtrusts.org/en/research-and-analysis/blogs/stateline/2017/02/09/troopers-use-big-data-to-predict-crash-sites (accessed July 17, 2017).
Berning, A., and D. D. Smither. 2014. Understanding the limitations of drug test information, reporting, and testing practices in fatal crashes. Washington, DC: National Highway Traffic Safety Administration.
Berning, A., R. Compton, and K. Wochinger. 2015. Results of the 2013-2014 National Roadside Survey of alcohol and drug use by drivers. DOT HS 812 118. Washington, DC: National Highway Traffic Safety Administration.
Borba, P. S. 2013. Predictive analytics, text mining, and drug-impaired driving in automobile accidents. http://www.milliman.com/insight/pc/Predictive-analytics--text-mining--and-drug-impaired-driving-in-automobile-accidents/ (accessed August 1, 2017).
Brachman, P. S., and S. B. Thacker. 2011. Evolution of epidemic investigations and field epidemiology during the MMWR era at CDC—1961–2011. Morbidity and Mortality Weekly Report 60(4):22–26.
Breiding, M. J., and B. Wiersema. 2006. Variability of undetermined manner of death classification in the US. Injury Prevention 12(Suppl 2):ii49–ii54.
Brian, M. 2016. Uber is using smartphone data to alert it to bad drivers. https://www.engadget.com/2016/01/26/uber-gyroscopes-data-bad-driving-safety (accessed September 6, 2017).
Buckley, J. 2017. Preventing car crashes with big data analytics. https://datafloq.com/read/preventing-car-crashes-with-big-data-analytics/1117 (accessed July 17, 2017).
Carmen, M. 2016. Indiana state police unveil daily crash prediction map. http://statescoop.com/indiana-state-police-unveil-car-crash-forecast-map-to-help-reduce-traffic-accidents-in-indiana (accessed July 17, 2017).
Castle, I. J., H. Y. Yi, R. W. Hingson, and A. M. White. 2014. State variation in underreporting of alcohol involvement on death certificates: Motor vehicle traffic crash fatalities as an example. Journal of Studies on Alcohol and Drugs 75(2):299–312.
CDC (Centers for Disease Control and Prevention). 2016. Behavioral Risk Factor Surveillance System: Comparability of data BRFSS 2015. Version 1—Revised: June 2016. https://www.cdc.gov/brfss/annual_data/2015/pdf/compare_2015.pdf (accessed December 12, 2017).
CDC. 2017a. Behavioral Risk Factor Surveillance System. https://www.cdc.gov/brfss/index.html (accessed August 31, 2017).
CDC. 2017b. Welcome to WISQARS. https://www.cdc.gov/injury/wisqars/index.html (accessed September 1, 2017).
CDC. 2017c. Youth Risk Behavior Surveillance System (YRBSS) overview. https://www.cdc.gov/healthyyouth/data/yrbs/overview.htm (accessed August 31, 2017).
CDC. 2017d. YRBSS participation maps and history. https://www.cdc.gov/healthyyouth/data/yrbs/participation.htm (accessed October 4, 2017).
CDC. n.d.-a. 5.0 Data sources for WISQARS nonfatal. https://www.cdc.gov/ncipc/wisqars/nonfatal/datasources.htm (accessed September 1, 2017).
CDC. n.d.-b. National Violent Death Reporting System. https://www.cdc.gov/injury/wisqars/nvdrs.html (accessed November 15, 2017).
Cook, L. J., A. Thomas, C. Olson, T. Funai, and T. Simmons. 2015. Crash Outcome Data Evaluation System (CODES): An examination of methodologies and multi-state traffic safety applications. DOT HS 812 179. Washington, DC: National Highway Traffic Safety Administration.
Crosby, A. E., J. A. Mercy, and D. Houry. 2016. The National Violent Death Reporting System: Past, present, and future. American Journal of Preventive Medicine 51(5 Suppl 3):S169–S172.
Curtis, S. C., and R. L. Ramirez. 2011. Source investigations: A tool to combat impaired driving. DOT HS 811 519. Washington, DC: National Highway Traffic Safety Administration.
Dai, J., J. Teng, X. Bai, Z. Shen, and D. Xuan. 2010. Mobile phone based drunk driving detection. Paper read at 2010 4th International Conference on Pervasive Computing Technologies for Healthcare, March 22–25, 2010.
DataKind. 2016. Data science supporting Vision Zero in three new cities. http://www.datakind.org/blog/data-science-supporting-vision-zero-in-three-new-cities (accessed August 3, 2017).
DataKind. 2017. Creating safer streets through data science. http://www.datakind.org/projects/creating-safer-streets-through-data-science (accessed August 4, 2017).
Dean, S., L. Litzky, B. Fuchs, and C. Cambor. 2012. Assessing the accuracy of death certificate completion by physicians using the “Death Module”: An academic institution’s experience with an electronic death registration program. American Journal of Clinical Pathology 138(Suppl 2):A130.
Degani, A. T., R. M. Patel, B. E. Smith, and E. Grimsley. 2009. The effect of student training on accuracy of completion of death certificates. Medical Education Online 14:17.
DiMaggio, C., K. Wheeler-Martin, and J. Oliver. 2018. Alcohol-impaired driving in the United States: Overview, review of data sources and analyses. Paper commissioned by the Committee on Accelerating Progress to Reduce Alcohol-Impaired Driving Fatalities (see Appendix A).
DOT (U.S. Department of Transportation). 2016. VMT per capita. https://www.transportation.gov/mission/health/vmt-capita (accessed September 1, 2017).
Dowdall, G. W. 2013. College drinking: Reframing a social problem/changing the culture. Sterling, VA: Stylus Pub.
FBI (Federal Bureau of Investigation). n.d.-a. NIBRS overview. https://ucr.fbi.gov/nibrs-overview (accessed August 31, 2017).
FBI. n.d.-b. Uniform Crime Reporting. https://ucr.fbi.gov/crime-in-the-u.s (accessed August 4, 2017).
FBI. n.d.-c. Welcome to a new way to access UCR statistics. https://www.ucrdatatool.gov (accessed October 5, 2017).
FHWA (Federal Highway Administration). 2015. Expert panel review of the 2016 National Household Travel Survey—April 28, 2015. Washington, DC: U.S. Department of Transportation.
FHWA. 2016. Highway statistics series. https://www.fhwa.dot.gov/policyinformation/statistics.cfm (accessed September 1, 2017).
FHWA. n.d.-a. Introduction to the 2009 NHTS. http://nhts.ornl.gov/introduction.shtml (accessed September 1, 2017).
FHWA. n.d.-b. National Household Travel Survey. http://nhts.ornl.gov (accessed September 1, 2017).
Freeze, B. n.d. Traffic Incident Management Decision Support System Project. https://www.pcb.its.dot.gov/t3/s170607/s170607_Traffic_Incident_Management_Whats_New_presentation_Freeze.ppt (accessed October 9, 2017).
Gagliordi, N. 2014. How auto insurer Progressive collected 10 billion miles of driving data from its customers. http://www.zdnet.com/article/how-auto-insurer-progressive-collected-10-billion-miles-of-driving-data-from-its-customers (accessed September 6, 2017).
Garrett, M. E. 2014. Encyclopedia of transportation: Social science and policy. Thousand Oaks, CA: SAGE Publications, Inc.
Grossman, E. L. 2017. A street-level look at an innovative data-driven partnership. https://blogs.microsoft.com/on-the-issues/2017/04/19/street-level-look-innovative-data-driven-partnership (accessed August 4, 2017).
HCUP (Healthcare Cost and Utilization Project). n.d. Overview of the National Emergency Department Sample (NEDS). https://www.hcup-us.ahrq.gov/nedsoverview.jsp#about (accessed October 10, 2017).
IBM (International Business Machines). 2015. Tennessee Highway Patrol. http://www-03.ibm.com/software/businesscasestudies/nz/en/corp?synkey=G711453G16461R35 (accessed July 14, 2017).
IBM. n.d.-a. Ingographics & animations. The four v’s of big data. http://www.ibmbigdatahub.com/infographic/four-vs-big-data (accessed December 6, 2017).
IBM. n.d.-b. Tennessee Highway Patrol. https://www-01.ibm.com/common/ssi/cgi-bin/ssialias?subtype=ST&infotype=SA&htmlfid=GVJ03030USEN&attachment=GVJ03030USEN.PDF (accessed July 14, 2017).
Indiana State Police and Indiana Management Performance Hub. 2017. Indiana crash risk map. https://in.gov/isp/3268.htm (accessed Decemeber 11, 2017).
Jernigan, D. H., S. Cukier, C. Ross, S. R. Ahmed, and A. Stolbach. 2013. Alcohol brand use and injury in the emergency department: A pilot study. Substance Use & Misuse 49(1–2):59–65.
Kann, L., T. McManus, W. A. Harris, S. L. Shanklin, K. H. Flint, J. Hawkins, B. Queen, R. Lowry, E. O. M. Olsen, D. Chyen, L. Whittle, J. Thornton, C. Lim, Y. Yamakawa, N. Brener, and S. Zaza. 2016. Youth risk behavior surveillance—United States, 2015. Morbidity and Mortality Weekly 65(6):1–174.
Kao, H.-L., B.-J. Ho, A. C. Lin, and H.-H. Chu. 2012. Phone-based gait analysis to detect alcohol usage. Paper presented at 2012 ACM Conference on Ubiquitous Computing, Pittsburgh, PA.
Kelley-Baker, T. 2017. PowerPoint presentation to the Committee on Accelerating Progress to Reduce Alcohol-Impaired Driving Fatalities, Washington, DC, March 22, 2017. http://nationalacademies.org/hmd/~/media/Files/Activity%20Files/AcceleratingProgresstoReduceAlcoholImpairedDrivingFatalities/22%20March%202017/11%20Tara%20KelleyBaker.pdf (accessed September 7, 2017).
Kim, K., D. Harmon, M. Singleton, K. Finison, T. Kerns, M. Qu, G. Thaxton, T. Hettinger, S. Brynildsen, A. Lunde, R. Clarke, M. Allen, M. Pease, K. Dougherty, M. Dean, and W. Bigelow. 2001. Problems, solutions and recommendations for implementing CODES (Crash Outcome Data Evaluation System). Washington, DC: National Highway Traffic Safety Administration.
Kindelberger, J., and J. A. Milani. 2015. Crash Outcome Data Evaluation System (CODES): Program transition and promising practices. Washington, DC: National Highway Traffic Safety Administration.
Lacey, J. H., T. Kelley-Baker, R. B. Voas, E. Romano, C. D. Furr-Holden, P. Torres, and A. Berning. 2011. Alcohol- and drug-involved driving in the United States: Methodology for the 2007 National Roadside Survey. Evaluation Review 35(4):319–353.
Lapham, S. C. 2010. The limits of tolerance: Convicted alcohol-impaired drivers share experiences driving under the influence. The Permanente Journal 14(2):26–30.
Li, L., L. Zhu, and D. Z. Sui. 2007. A GIS-based Bayesian approach for analyzing spatial-temporal patterns of intra-city motor vehicle crashes. Journal of Transport Geography 15(4):274–285.
Li, Y., N.-N. Sze, and S. Wong. 2013. Spatial–temporal analysis of drink-driving patterns in Hong Kong. Accident Analysis & Prevention 59:415–424.
Ma, C., X. Dai, J. Zhu, N. Liu, H. Sun, and M. Liu. 2017. DrivingSense: Dangerous driving behavior identification based on smartphone autocalibration. Mobile Information Systems 2017:1–15.
Marquand, B. 2016. Comparing Drivewise, Snapshot and other usage-based insurance plans. https://www.nerdwallet.com/blog/insurance/comparing-drivewise-snapshot-usage-based-insurance (accessed July 14, 2017).
Meisel, Z. 2006. Spare the needle. Doctors shouldn’t have to draw blood on behalf of cops. http://www.slate.com/articles/health_and_science/medical_examiner/2006/09/spare_the_needle.html (accessed November 27, 2017).
Meliker, J. R., R. F. Maio, M. A. Zimmerman, H. M. Kim, S. C. Smith, and M. L. Wilson. 2004. Spatial analysis of alcohol-related motor vehicle crash injuries in southeastern Michigan. Accident Analysis & Prevention 36(6):1129–1135.
Milani, J., J. Kindelberger, G. Bergen, E. J. Novicki, C. Burch, S. M. Ho, and B. A. West. 2015. Assessment of characteristics of state data linkage systems. DOT HS 812 180. Washington, DC and Atlanta, GA: National Highway Traffic Safety Administration and Centers for Disease Control and Prevention.
Morrison, C., W. R. Ponicki, P. J. Gruenewald, D. J. Wiebe, and K. Smith. 2016. Spatial relationships between alcohol-related road crashes and retail alcohol availability. Drug and Alcohol Dependence 162:241–244.
Myers, K. A., and D. R. Farquhar. 1998. Improving the accuracy of death certification. Canadian Medical Association Journal 158(10):1317–1323.
Naeger, S. 2017. Emergency department visits involving underage alcohol misuse: 2010 to 2013. https://www.samhsa.gov/data/sites/default/files/report_3061/ShortReport-3061.html (accessed October 10, 2017).
NASEM (National Academies of Sciences, Engineering, and Medicine). 2015. Naturalistic driving study: Alcohol sensor performance. Washington, DC: The National Academies Press.
National Association of Insurance Commissioners. 2017. Usage-based insurance and telematics. http://www.naic.org/cipr_topics/topic_usage_based_insurance.htm (accessed July 31, 2017).
NCHS (National Center for Health Statistics). 2015. Injury and poisoning questions on the National Health Interview survey: 1997–present. https://www.cdc.gov/nchs/nhis/injury_poisoning/ip_questions_1997_present.htm (accessed December 6, 2017).
NCHS. 2017a. Alcohol use. https://www.cdc.gov/nchs/fastats/alcohol.htm (accessed December 6, 2017).
NCHS. 2017b. Early release of selected estimates based on data from the 2016 National Health Interview Survey. Washington, DC: National Center for Health Statistics.
NHTSA (National Highway Traffic Safety Administration). 2009. Race and ethnicity: 2006 data. Traffic Safety Facts. DOT HS 810 995. Washington, DC: National Highway Traffic Safety Administration.
NHTSA. 2014. Fatality Analysis Reporting System. Washington, DC: U.S. Department of Transportation.
NHTSA. n.d.-a. Crash Injury Research (CIREN). https://one.nhtsa.gov/Research/Crash-Injury-Research-(CIREN) (accessed October 5, 2017).
NHTSA. n.d.-b. Data-Driven Approaches to Crime and Traffic Safety (DDACTS). https://one.nhtsa.gov/Driving-Safety/Enforcement-&-Justice-Services/Data%E2%80%93Driven-Approaches-to-Crime-and-Traffic-Safety-(DDACTS) (accessed December 13, 2017).
NHTSA. n.d.-c. Fact sheet: National Roadside Survey of Alcohol and Drug Use by Drivers. Washington, DC: U.S. Department of Transportation.
NHTSA. n.d.-d. State data programs. https://www.nhtsa.gov/research-data/state-data-programs (accessed October 5, 2017).
NIAAA (National Institute on Alcohol Abuse and Alcoholism). 2013. Alcohol-related emergency department visits and hospitalizations and their co-occurring drug-related, mental health, and injury conditions in the United States: Findings from the 2006-2010 Natiowide Emergency Department Sample (NEDS) and Nationwide Inpatient sample (NIS). NIH Publication No. 13-8000. Bethesda, MD: National Institute on Alcohol Abuse and Alcoholism.
NIAAA. 2017. Division of Epidemiology and Prevention Research (DEPR). Funding opportunities. https://www.niaaa.nih.gov/research/extramural-research/depr#FOA (accessed December 6, 2017).
NRC and IOM (National Research Council and Institute of Medicine). 1985. Injury in America: A continuing public health problem. Washington, DC: National Academy Press.
NRC and IOM. 2004. Reducing underage drinking: A collective responsibility. Washington, DC: The National Academies Press.
OnStar. n.d. OnStar. https://www.onstar.com/us/en/home.html (accessed December 21, 2017).
Poe, G. S., E. Powell-Griner, and J. K. McLaughlin. 1993. Comparability of the death certificate and the 1986 National Mortality Followback Survey. Vital and Health Statistics. DHHS Publication No. (PHS) 94-1392. Hyattsville, MD: National Center for Health Statistics.
Rainie, L., and M. Duggan. 2016. 5. Scenario: Auto insurance discounts and monitoring. http://www.pewinternet.org/2016/01/14/scenario-auto-insurance-discounts-and-monitoring (accessed December 20, 2017).
Ramirez, R. 2017. PowerPoint presentation to the Committee on Accelerating Progress to Reduce Alcohol-Impaired Driving Fatalities, Washington, DC, February 16, 2017. http://nationalacademies.org/hmd/~/media/Files/Activity%20Files/AcceleratingProgresstoReduceAlcoholImpairedDrivingFatalities/16%20FEB%202017/5%20Ramirez.pdf (accessed April 24, 2017).
Rockett, I. R., N. D. Kapusta, and J. H. Coben. 2014. Beyond suicide: Action needed to improve self-injury mortality accounting. JAMA Psychiatry 71(3):231–232.
Saha, S., P. Schramm, A. Nolan, and J. Hess. 2016. Adverse weather conditions and fatal motor vehicle crashes in the United States, 1994-2012. Environmental Health 15(1):104.
SAMHSA (Substance Abuse and Mental Health Services Administration). 2016. Population data/NSDUH. https://www.samhsa.gov/data/population-data-nsduh (accessed August 31, 2017).
SAMHSA. 2017a. SAMHSA’s efforts related to prevention and early intervention. https://www.samhsa.gov/prevention/samhsas-efforts (accessed November 30, 2017).
SAMHSA. 2017b. STOP Act legislation. https://www.samhsa.gov/underage-drinking-topic/stop-act-legislation (accessed November 30, 2017).
Schneider, W. H., B. Stakleff, and L. Buser. 2017. Alcohol-related hot-spot analysis and prediction. Minneapolis, MN: Center for Transportation Studies, University of Minnesota.
Shahum, L., and Z. Vanderkooy. 2017. Moving from vision to action: Fundamental principles, policies & practices to advance Vision Zero in the U.S. Vision Zero Network.
Shueh, J. 2017. Mapping collision-prone intersections in Seattle, New York and New Orleans. http://statescoop.com/mapping-collision-prone-intersections-in-seattle-new-york-and-new-orleans (accessed August 3, 2017).
Slater, M. E., I. J. Castle, B. K. Logan, and R. W. Hingson. 2016. Differences in state drug testing and reporting by driver type in U.S. fatal traffic crashes. Accident Analysis & Prevention 92:122–129.
Soleymanian, M., C. Weinberg, and T. Zhu. 2016. The value of usage-based insurance beyond better targeting: Better driving. https://research.chicagobooth.edu/~/media/8aeee2a8af83412c954d331dc412cc55.pdf (accessed July 31, 2017).
SPRC (Suicide Prevention Resource Center). 2012. Data source: WISQARS nonfatal injury data. Waltham, MA: SPRC.
Stevenson, M., R. D. Brewer, and V. Lee. 1998. The spatial relationship between licensed alcohol outlets and alcohol-related motor vehicle crashes in Gwinnett County, Georgia. Journal of Safety Research 29(3):197–203.
Threewitt, C. 2016. How do those car insurance tracking devices work? https://cars.usnews.com/cars-trucks/best-cars-blog/2016/10/how-do-those-car-insurance-tracking-devices-work (accessed December 20, 2017).
Toyota. n.d. Safety Sense™. https://www.toyota.com/safety-sense (accessed December 21, 2017).
TRB (Transportation Research Board). n.d. What is the SHRP 2 safety data? http://www.trb.org/StrategicHighwayResearchProgram2SHRP2/SHRP2DataSafetyAbout.aspx (accessed October 10, 2017).
U.S. House of Representatives. 2015. Departments of Transportation, and Housing and Urban Development, and related agencies appropriations bill, 2016. Report 114–129. https://www.congress.gov/114/crpt/hrpt129/CRPT-114hrpt129.pdf (accessed December 6, 2017).
Voas, R. B., A. S. Tippetts, E. Romano, D. A. Fisher, and T. Kelley-Baker. 2007. Alcohol involvement in fatal crashes under three crash exposure measures. Traffic Injury Prevention 8(2):107–114.
Walsh, M. C., A. Trentham-Dietz, and M. Palta. 2011. Availability of driver’s license master lists for use in government-sponsored public health research. American Journal of Epidemiology 173(12):1414–1418.
This page intentionally left blank.


