
2
Current Environment: Alcohol, Driving, and Drinking and Driving
INTRODUCTION
To accelerate progress to reduce alcohol-impaired driving fatalities, it is important to understand the context in which these fatalities occur, as noted in the committee’s conceptual framework (see Figure 1-5). This includes the trends and patterns of alcohol-impaired driving and the impacts and costs borne by society. For alcohol-impaired driving, there are two contexts that are especially salient and worth examining: the alcohol environment (e.g., social and cultural drinking norms, availability, pricing, and regulation) and the driving environment (e.g., road safety infrastructure, public transportation, and driving patterns). In this chapter, data on alcohol-impaired driving are discussed in depth, as well as the impacts and costs of crashes, injuries, and fatalities. The current alcohol and driving landscapes are discussed as the backdrop for alcohol-impaired driving. The chapter concludes with a high-level overview of the existing drinking- and driving-specific interventions in place for addressing alcohol-impaired driving.1
___________________
1 The 2016 fatal traffic crash data became available late in the study process (October 2017); however, in-depth analyses had not yet been completed during the writing of this report. When 2016 analyses were not available, 2015 (or most recent) data were used.
THE ALCOHOL ENVIRONMENT
The alcohol environment today can be understood by examining drinking trends, social and cultural drinking norms, alcohol availability, promotion, pricing, regulation, and the policies and laws that shape these factors. The nature of this environment has important implications for drinking and driving behaviors (Bond et al., 2008; Huckle et al., 2006), as well as the relative success of interventions designed to reduce alcohol-impaired driving (Xuan et al., 2015a).
Drinking Behaviors and Trends
Alcohol consumption, while intertwined with many social and cultural norms in the United States, is not uniform across all populations (Babor, 2010a) and the overall prevalence of alcohol consumption varies. The 2015 National Survey on Drug Use and Health reported that of people 18 years or older, 86.4 percent have drunk alcohol at some time in their lives, 70.1 percent drank in the past year, and 56.0 percent drank in the past month (SAMHSA, 2016). These data run counter to the misperception that drinking is more widespread than it actually is, particularly among college-aged students, for whom drinking prevalence is commonly overestimated (Baer et al., 1991; Martens et al., 2006; Perkins et al., 2005). Research suggests that for those who do consume alcohol, drinking varies with respect to frequency, quantity, the rate at which people drink, and preferred alcoholic beverage and/or combination.
Despite standard drink sizes for beer, wine, and distilled spirits (see Chapter 1 for more information on standard drinks), it is often difficult for individuals to determine the amount of alcohol they have consumed because of variations in alcohol content per drink. While very little research has been done on the mean, distribution, and sources of variation in the alcohol content of drinks, some information is available. In regards to beer, draught beers tend to have higher alcohol by volume (ABV) than a standard drink (Kerr et al., 2008). Newer craft beers, typically with 7 to 9 percent ABV (compared to 5 percent ABV for a standard 12-ounce drink of beer), have also entered the market in recent years. Drinkers and bartenders may not be aware of these differences or pay much attention to them when serving and consuming alcohol, leading to greater levels of intoxication than intended. This is true for wine and distilled spirits as well. A Northern California focus group found that an average glass of wine and an average mixed drink served at a bar had 43 and 42 percent, respectively, more alcohol than a standard drink (Kerr et al., 2008). Not only is there wide variability in the alcohol content of drinks served in bars and restaurants, but there is also significant variability in the drinks
served in people’s homes (Kerr et al., 2005). A study conducted by Kerr and Stockwell (2012) found that drinkers have difficulty identifying and pouring standard drinks, with a propensity to overpour. As a result, it can be difficult to determine how much alcohol one has consumed based on the number of “drinks” they have had. Standard drink size also varies from country to country. The United Kingdom has a standard drink size of 8 grams of pure alcohol; in Australia a standard drink is 10 grams, in the United States it is 14 grams, and in Japan it is 19.75 grams (WHO, 2014).
Data from the 1975–2016 Monitoring the Future survey suggest that 32 percent of college students binge drink (Schulenberg et al., 2017).2 Similarly, a review of studies on drinking among college students found a consistent national rate of binge drinking of about 40 percent (Wechsler and Nelson, 2008). In college settings, rates of drinking are highest among first-year students, athletes, and members of fraternities and sororities (Wechsler and Nelson, 2008). Additionally, almost one-quarter of college students who self-identify as current drinkers consume alcohol with energy drinks, putting themselves at a higher risk of serious consequences, as caffeine affects a drinker’s ability to judge their level of impairment (O’Brien et al., 2008). Data from the 2005–2011 Monitoring the Future study also show that about one-fifth of high school seniors binge drink, and intensity of binge drinking is higher for students in rural areas (Patrick et al., 2013).
Recently published analyses from the National Epidemiologic Survey on Alcohol-Related Conditions (NESARC) found that alcohol consumption among U.S. adults rose substantially between 2001–2002 and 2012–2013, with annual use increasing by 11.2 percent (from 65.4 percent of the population 18 years or older in 2001–2002 to 72.7 percent in 2012–2013), and high-risk drinking increasing by 29.9 percent (from 9.7 in 2001–2002 to 12.6 percent in 2012–2013) (Grant et al., 2017).3 The NESARC study also found the largest increases in alcohol consumption, alcohol-impaired driving, and alcohol use disorder in women, older adults, individuals of racial or ethnic minority, and individuals with lower income and educational attainment (Grant et al., 2017).4
Social and cultural norms of alcohol use vary by gender and among ethnic groups in the United States (Galvan and Caetano, 2003). For
___________________
2 Binge drinking is defined in this study as consuming five or more drinks in a row on at least one occasion (i.e., typically over a period of 2 hours) in the past 2 weeks (Schulenberg et al., 2017).
3 High-risk drinking is defined in this study as four or more drinks on any day among women and five or more drinks on any day among men (Grant et al., 2017).
4 “Alcohol use disorder” as defined in the Diagnostic and Statistical Manual of Mental Disorders (DSM-IV).
example, men drink alcohol more often than women, including heavier drinking, and are more likely to experience drinking-related consequences (Rahav et al., 2006; Wilsnack et al., 2000, 2009). Furthermore, drinking alcohol has been linked with perceptions of masculinity (De Visser and Smith, 2007) and is strongly associated with the social aspect of sports and sporting events (Collins and Vamplew, 2011). In recent years, however, differences in patterns of drinking by gender have narrowed, particularly among adolescents and young adults (Jang et al., 2017). For example, research suggests an increase in binge drinking among younger and older women (Breslow et al., 2017; Dwyer-Lindgren et al., 2015). Drinking patterns across racial and ethnic groups are complex. In general, alcohol consumption is most common among non-Hispanic whites and people who report two or more races, and lowest among Asians (SAMHSA, 2014). Recent data from the National Longitudinal Survey of Youth reveal racial and ethnic differences in “aging out” of heavy drinking behaviors. African American and Hispanic men and women exhibited slower declines in heavy drinking frequency during their 20s than white men and women (Mulia et al., 2017). While life course trajectories of heavy drinking may show one pattern, age- and sex-adjusted estimates from the 2016 National Health Interview Survey demonstrate another. These findings showed that non-Hispanic white adults (31.2 percent) were more likely to have at least one heavy drinking day in the past year when compared to Hispanic and non-Hispanic Black adults (22.1 and 15.4 percent, respectively) (Clarke et al., 2017).
Beyond the physiological effects of alcohol, an individual’s perceptions of his or her level of impairment can also affect his or her behavior. Alcohol metabolism facilitates the perception of impairment, and an individual is made aware of the effects of alcohol by biological cues or changes in his or her behavior (Laude and Fillmore, 2016). In studying the subjective view of impairment, researchers have found that the number of beverages a person thinks they can consume in 2 hours before their driving becomes impaired is 30 percent higher for African Americans and 26 percent higher for Hispanics compared to whites, indicating cultural disparities in drink preference (and therefore alcohol content) or subjective conception of impairment (Kerr and Greenfield, 2015; Kerr et al., 2006).
Generally, people are often not aware of how impaired they are because they misjudge the rates of alcohol absorption and elimination, or because they may not understand the relationship between the quantity of alcohol consumed and the resulting blood alcohol concentration (BAC) (Aston and Liguori, 2013).5 This could lead drinkers to think they
___________________
5 Some existing tools for understanding BAC include the National Highway Traffic Safety Administration’s (NHTSA’s) “ABCs of BAC.”
are recovering from alcohol more quickly than they actually are. Drivers who underestimate their BAC are more willing to drive while above the limit set by state law compared to drivers who more correctly assess their BAC, and drivers who incorrectly estimate low BAC levels exhibit riskier driving (Laude and Fillmore, 2016). Furthermore, some impaired drivers exhibit riskier behaviors even while their psychomotor skills are not demonstrably compromised. Conversely, other drivers’ risky behavior may not change but their psychomotor skills could be significantly impaired (Laude and Fillmore, 2016). A 2013 review noted nonalcoholic social drinkers were more capable than alcoholic drinkers at assessing changes in their BAC levels;6 this population was also able to learn to estimate their BAC levels more accurately after training, while training was less effective in alcoholic drinkers (Aston and Liguori, 2013). Finally, stimulant drugs such as energy drinks and 3,4-Methylenedioxymetham-phetamine (MDMA or Ecstasy) may reduce subjective views of intoxication and lead drinkers to think they are not impaired, but the effects of those drugs are not sufficient to overcome objectively measured alcohol impairment (Martin et al., 2013).
General Regulatory Framework for Alcohol
Historically, beer was the beverage of choice of the drinking driver (Berger and Snortum, 1985); more recent data are not available about which kinds of alcohol are most common among alcohol-impaired drivers today, but beer continues to claim the most consumer dollars of the three main types of alcohol beverages (beer, wine, and distilled spirits) (Impact Databank, 2017a,b). The Gallup poll also reports that beer is the most commonly consumed of the three beverage types (Beer Marketer’s Insights, 2017). In the United States, 82 percent of the volume of beer sales are made for off-premise consumption (e.g., supermarkets, convenience stores, and stores selling distilled spirits),7 while 53.7 percent of the dollar value of sales occur in on-premise establishments (e.g., bars and restaurants) (Beer Marketer’s Insights, 2017). Prices of alcoholic beverages sold for off-premises consumption have become significantly more affordable
___________________
6 Nonalcoholic social drinkers were defined in the study described by Aston and Liguori (2013) as moderate drinkers who (1) consumed 1 to 4 alcoholic beverages at least twice per week, with each drink containing the equivalent of 1 oz. of 80-proof (40 percent) alcohol; (2) consumed an average of 4 to 10 drinks at a party; (3) were able to consume at least 6 to 7 drinks on a single occasion (as required for the experimental procedure); and (4) had been intoxicated 2 to 12 times during the past year (Huber et al., 1976; Lansky et al., 1978).
7 Off-premise outlets are establishments where alcohol can be sold, but not consumed (e.g., package stores and supermarkets), and on-premise outlets are establishments where alcohol can be sold and consumed (e.g., bars and restaurants).
from 1950 to 2011. One drink per day of the cheapest brand of spirits required 0.29 percent of U.S. mean per capita disposable income in 2011 versus 1.02 percent in 1980 and 4.46 percent in 1950 (Kerr et al., 2013a). This increase in affordability over this time period is reflected in beer and wine prices as well (Kerr et al., 2013a) (see Chapter 3 for more information on alcohol pricing and taxation).
Because of commercial speech protection afforded by judicial interpretations of the First Amendment, alcohol advertising is primarily self-regulated by the alcohol industry. One provision specifies that advertisements should not be directed at audiences in which 28.4 percent or more of the audience is under 21 years of age (FTC, 2013). Although the Federal Trade Commission has published occasional reports monitoring the effectiveness of the industry’s self-regulatory codes and has generally been approving of them (FTC, 2013), independent researchers have found that violations of these codes in the media are frequent and that exposure of alcohol marketing to youth and other vulnerable populations is especially pervasive and often disproportionately large compared to adult populations (King et al., 2017).
Alcohol Industry
A crucial force in shaping the environments in which people make their decisions about drinking, which in turn affect their likelihood of drinking and driving, is the alcohol industry itself. By dint of its size and structure, it is a formidable political force. Its practices and innovations in product development, pricing, promotion, and making its products physically available essentially structure the context of drinking for Americans.
The U.S. alcohol industry is dominated by a small number of companies. Beer is the most concentrated segment in terms of ownership: As of 2016, two companies, Anheuser-Busch and MillerCoors, account for 67.3 percent of the market in terms of volume, while the top five companies sell 79.8 percent of beer (Advocates for Highway and Auto Safety, 2017). For both distilled spirits and wine, the top five producers account for more than half the volume of sales (Impact Databank, 2017a,b). While craft brewing and distilling have been increasingly visible, and the number of craft brewers and distillers has grown substantially in recent years, the largest “craft” segment, brewing, still only comprises a small percentage of the total beer market—less than 12 percent as of 2016. The craft brewing market itself is becoming more concentrated—the top ten craft brewers sold nearly 60 percent of craft beers in 2016, as opposed to 53 percent in 2011. Furthermore, craft beer brands that have been acquired by the largest beer companies are showing the strongest growth trends (Beer Marketer’s Insights, 2017).
The oligopolistic structure of the alcohol industry creates the conditions for oligopolic profit-taking and the creation of high barriers to entry in the form of heavy spending on marketing. In 2016 alcohol producers spent approximately $2.2 billion on measured marketing (television, magazines, outdoor, radio, Internet, and newspapers). Unmeasured marketing activities include sports and other sponsorships, special events, discounting, and corporate “stakeholder” marketing. The latter category includes lobbying: in 2015 alcohol companies spent $13.2 million on lobbying in state legislatures (FollowTheMoney.org, n.d.); in 2016 they donated almost $27 million to members of Congress and reported 295 lobbyists working for them at the federal level (OpenSecrets.org, n.d.).
Stakeholder marketing also encompasses corporate social responsibility (CSR) activities such as efforts to prevent alcohol-impaired driving. However, global analyses of alcohol industry CSR activities have consistently found that the alcohol industry pursues and supports the least effective strategies and actively opposes the most effective (Babor et al., 2015, 2018; Esser et al., 2016; Pantani et al., 2017). Esser et al. (2016) performed a content analysis of 266 randomly sampled alcohol industry initiatives to decrease alcohol-impaired driving and found that insufficient evidence or no scientific evidence exists for 56.0 percent of these initiatives. Furthermore, two-thirds of the initiatives were rated as potentially harmful based on conflict with public health evidence (e.g., promoting the use of designated drivers, for which evidence of effectiveness is insufficient and suggests negative unintended consequences—see Chapter 4 and Finding 4-1 for more information), and 87.6 percent were found to be potential brand or company marketing activities (Esser et al., 2016). See Appendix C for more information on the alcohol industry’s role in promoting alcohol-impaired driving interventions.
It is also important to recognize that there may be a basic conflict of interest for the alcohol industry between the need to maintain profitability and growth and efforts to reduce the prevalence of underage drinking and intoxication, both of which can lead to alcohol-impaired driving. Researchers estimated that in 2001 (the most recent year for which these estimates are available), underage and pathological drinking accounted for between 37.5 and 48.8 percent of consumer expenditures on alcohol (Foster et al., 2006). Thus, were the population to drink in a fully legal and nonpathological fashion, the industry could lose nearly half of its revenues, and the government would lose a large amount of its tax revenues as well.
Alcohol industry activities in product development, pricing, promotions and sponsorships, and physical availability of alcoholic beverages are briefly described below.
Product Development
Recent trends in alcoholic beverage development have presented particular risks for alcohol-impaired driving. Alcohol content in almost all types of alcoholic beverages has been steadily increasing, especially with the growing popularity of craft beverages (Kerr et al., 2013b; Mintel, 2015). In addition, the practice of mixing alcohol and caffeine, while effectively banned at the point of production at least for malt beverages (Babor et al., 2017), continues to be common, particularly among young binge drinkers (CDC, 2017a). Systematic reviews have found that young drinkers who consume mixtures of alcohol and energy drinks are at higher risk for binge drinking and driving, riding as a passenger in a vehicle with an intoxicated driver, and being arrested for driving while impaired (Babor et al., 2018; McKetin et al., 2015; Striley and Khan, 2014). Findings from a review of randomized controlled studies suggest that although energy drink consumption may deter small declines in cognitive function that result from alcohol consumption, such counteracting effects are not observed when driving (Babor et al., 2018; Lalanne et al., 2017). In addition, evidence suggests that consumption of drinks combining alcohol and energy drinks hinders a person’s ability to estimate their level of impairment (Forward et al., 2017).
In 2015 Anheuser-Busch InBev (AB InBev) launched its Global Smart Drinking Goals, which include reducing harmful drinking by at least 10 percent in six pilot cities by 2020; implementing the best practices from pilot cities globally by 2025; influencing social norms and behaviors to reduce harmful drinking by investing in social marketing campaigns and programs by 2025; ensuring that no- or lower-alcohol beer products comprise at least 20 percent of all beer volume produced by the company; placing a guidance label on all beer products by 2020; and increasing alcohol health literacy by 2025 (AB InBev, n.d.). It is important to note that the AB InBev smart drinking goals have not yet been evaluated. Rehm et al. (2016) attempted to assess the potential effects of reducing alcoholic strength of available products on reducing harmful drinking. While the study authors cite one mechanism that may potentially reduce harmful drinking, they note there is not yet evidence to substantiate this. The smart drinking goals require rigorous evaluation and investigation into their potential for positive or negative impacts (Anderson and Rehm, 2016).
Pricing
Alcohol purchased at off-premises establishments is more affordable now than it has been in 60 years (Kerr et al., 2013a). Significant decreases in alcohol prices have resulted in large part from decreases in federal
and state tax rates, particularly in the 1960s and 1970s (see Chapter 3 for more information on alcohol pricing and taxation) (Kerr et al., 2013a). More recently, product developments from the alcohol industry have led to lower priced options for consumers. Alcoholic energy drinks and premixed, ready-to-drink products, often with high alcohol and sugar contents, have been developed with younger and more cost-conscious populations (e.g., college students) in mind (Babor et al., 2018).
Promotions and Sponsorships
Alcohol industry marketing strategies have become increasingly more sophisticated and pervasive in media outlets, including television and print media. Exposure of youth to alcohol marketing is well documented in both traditional and digital media (Lobstein et al., 2017), and at least 25 longitudinal studies have found associations between youth exposure to alcohol marketing in various forms and subsequent youth drinking behavior (Jernigan et al., 2017). Evidence also suggests that alcohol marketing to youth is more likely to contain riskier content related to sexism and sexual activity; in one advertising study, advertisements with such content increased as the percentage of the advertisement audience that was under 21 increased (Rhoades and Jernigan, 2013).
The alcohol industry also promotes its products through sponsorships of sports events, music festivals, and other public events, many of which are likely to be more appealing to younger audiences (Babor et al., 2018). Alcohol industry promotion can be found in major U.S. professional sports leagues (all of which have at least one alcohol industry sponsor), particularly at professional motorsport racing events such as those held by NASCAR (Babor et al., 2018). In addition to encouraging greater alcohol consumption among younger audiences, the alcohol industry’s marketing promotions and sponsorships may also target women and other high-risk and/or vulnerable populations (Babor et al., 2018).
Physical Availability
Alcohol as a retail product is widely available in the United States. There is strong evidence for the correlation between increased availability of alcohol and increased consumption and, as a result, increased alcohol-related problems (Ames and Grube, 1999; Babor, 2010b). Availability of alcohol to younger, often underage, populations is also widespread (Forster et al., 1995). The expansion of the alcohol beverage market by transnational producers is likely to result in increased and more widespread availability, sales, and consumption (Babor et al., 2018). Working alongside the aforementioned promotional and sponsorship activities,
such market expansion has the potential to increase rates of alcohol-related problems including crashes and fatalities (Babor et al., 2018).
Conclusion 2-1: Alcoholic beverages as a commodity have changed significantly in the past 25 years. They are more affordable, of far greater variety, and more widely advertised and promoted than in earlier periods. In addition, inconsistent serving sizes and the combination of alcohol with caffeine and energy drinks undermine individuals’ ability to estimate their level of impairment.
Shifts in Resources Allocated to Reducing Alcohol-Related Harm
Funding for federal programs aimed at reducing alcohol-related harm, particularly to minors, has significantly dwindled in recent years. The U.S. Department of Justice’s Enforcing Underage Drinking Laws program is the sole federal initiative that exclusively addresses underage drinking and availability of alcohol to minors (DOJ, 2009). The program has provided funding in the form of block grants and discretionary awards as well as training and technical assistance to states to support local law enforcement agencies and community organizations in their efforts to decrease availability of alcohol to minors (DOJ, 2009). From its initiation in fiscal year (FY) 1998 through FY 2008, the program received $25 million in annual appropriations from Congress (NASADAD, 2016). Appropriation amounts decreased each year thereafter, with $2.5 million appropriated in FY 2014; in FYs 2015 and 2016 the program was not funded at all (NASADAD, 2016). Similarly, funding for the U.S. Department of Education’s Safe and Drug-Free Families and Communities program was substantially decreased in FY 2011 and has remained completely unfunded since FY 2012 (HHS and SAMHSA, 2016). See Table 7-1 for funding of federal substance abuse prevention programs from 2009 to 2014.
ALCOHOL-IMPAIRED DRIVING TRENDS
In the United States an adult driver is considered to be alcohol impaired by state law when his or her BAC is 0.08 grams per deciliter (g/dL) or higher.8 The term driver can refer to the operator of any motor vehicle, including motorcycles, passenger cars, light trucks, and large trucks. As discussed in Chapter 1, over the past four decades there have been significant reductions in alcohol-impaired driving, particularly from
___________________
8 On March 23, 2017, Utah became the first state in the United States to pass a BAC law of 0.05% in the state (Utah State Legislature, 2017); however, the 0.05% limit set by state law will not take effect until December 30, 2018.
the 1980s to the early 2000s (Voas and Lacey, 2011). From 1973 to 2014, there was an 80 percent reduction in the proportion of drivers who were alcohol impaired during weekend nights (7.5 to 1.5 percent), a high-risk period for driving while impaired (Berning et al., 2015). Fatalities attributable to alcohol-impaired driving crashes also saw dramatic decreases over this period of time. Alcohol-impaired driving crash fatalities decreased by almost 40 percent from 1982 to 2015 (NCSA, 2016a; Voas and Lacey, 2011). As a function of vehicle miles traveled, the alcohol-related driving fatality rate per 100 million vehicle miles traveled declined by 63 percent compared to a 25 percent decline in non-alcohol-related fatalities from 1982 to 2003 (Voas and Lacey, 2011).9 This reduction is noteworthy because during this time period, vehicle miles traveled increased substantially, indicating significant progress in past efforts to reduce alcohol-impaired driving fatalities.
Despite this progress, alcohol-impaired driving persists today, and alcohol-impaired driving fatalities have constituted almost 31 percent of overall motor vehicle crash fatalities in the last 10 years from 2006 to 2016 (Michael, 2017; NCSA, 2016a, 2017a). This fatality rate has held steady, with very little change, for more than 7 years (NCSA, 2016a, 2017a). Moreover, recent data reveal an increase in overall traffic fatalities from 2014 to 2016, including a rise in fatalities caused by alcohol-impaired driving crashes. NHTSA’s National Center for Statistics and Analysis reported a 5.6 percent increase in motor vehicle crash fatalities in 2016 (37,461 deaths over the period of 1 year) and a 7.2 percent increase in 2015 (35,092 deaths in 2015 compared to 32,744 deaths in 2014), the largest percentage increase in nearly 50 years (NCSA, 2016b, 2017a). Among these fatalities in 2016, 10,497 were caused by alcohol-impaired driving crashes, a 1.7 percent increase from 2015 (NCSA, 2017a). The rate of alcohol-impaired driving fatalities in motor vehicle crashes per 100 million vehicle miles traveled, however, remained the same from 2014 to 2016 at a rate of 0.33 percent (NCSA, 2016a, 2017b). While alcohol-impaired driving fatalities decreased the most for crashes involving pickup truck drivers from 2007 to 2016 (5 percent decrease), the percentage increased by 1 percent for large trucks (NCSA, 2017b). Alcohol-related motorcyclist fatalities have also increased significantly, particularly for those ages 55 to 64 years old (DiMaggio et al., 2018).
Relative to other developed, high-income countries, the United States lags behind in terms of preventing alcohol-impaired driving fatalities (Sauber-Schatz et al., 2016). In an analysis of data from 2000 to 2013 collected by the World Health Organization and the Organisation for
___________________
9 This rate includes alcohol-related crashes involving a driver with a BAC of 0.01% or greater.
Economic Co-operation and Development (OECD), the Centers for Disease Control and Prevention (CDC) found that the percentage of motor vehicle crash deaths involving alcohol-impaired driving in the United States, 31 percent, was the second highest among 19 OECD countries (Sauber-Schatz et al., 2016). Redelmeier and Detsky analyzed data from the OECD Road Safety 2015 Annual Report and found that alcohol-related traffic deaths per million population annually in the United States exceed those in Australia, Austria, Canada, France, Germany, Italy, the Netherlands, Spain, and the United Kingdom (Redelmeier and Detsky, 2017). CDC found that the United States consistently ranks poorly in rates of total crash fatalities compared to other high-income countries, even when taking into account population size (CDC, 2016). In a 2013 comparison of 10 high-income countries,10 the United States had the most motor vehicle crash deaths per 100,000 people at 10.6 percent, while New Zealand and Canada11 in second and third place trailed far behind at 6 percent (WHO, 2015a). This equaled about 90 people dying every day on U.S. roads (CDC, 2016). In the same report the United States came in second in percentage of crash deaths involving alcohol at 31 percent (WHO, 2015a). Canada ranked number one with 34 percent and New Zealand ranked third (WHO, 2015a). In 2016, 29 people died on U.S. roads every day from crashes involving alcohol-impaired drivers (NCSA, 2017b). While international comparisons may help to draw attention to progress made in reducing alcohol-impaired driving in similarly developed and motorized countries, there are many limitations for such comparisons (O’Neill and Kyrychenko, 2006).
While nationwide the number of alcohol-impaired driving fatalities increased from 2015 to 2016, a closer examination at the state level paints a more complex picture. Seventeen states and Puerto Rico saw reductions in alcohol-impaired driving fatalities, with Wyoming experiencing the largest decrease (40.7 percent). However, 29 states and the District of Columbia observed increases in fatalities, with the largest increase being in Vermont (80.0 percent) (NCSA, 2017a). In absolute terms, Mississippi saw the largest decrease in the number of alcohol-impaired driving fatalities (49 fewer deaths) and California experienced the largest increase (148 more deaths).
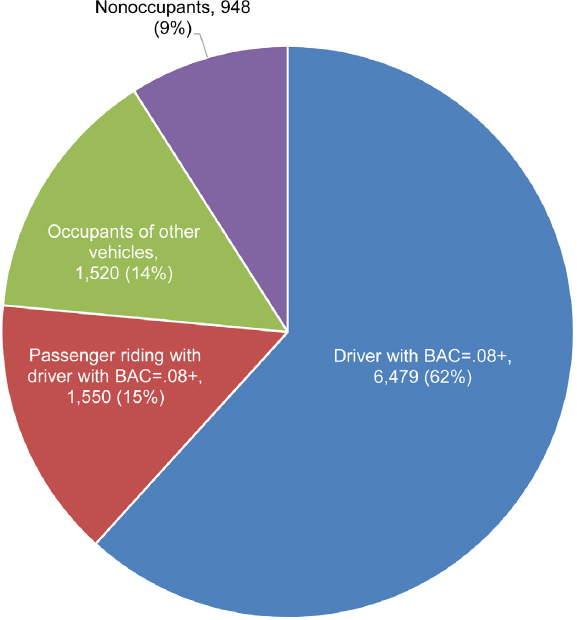
In 2016, among all alcohol-impaired driving crash fatalities,12 6,479 deaths (62 percent) were drivers who had BAC levels of 0.08% or higher,
___________________
10 The 10 countries compared were Canada, France, Germany, Japan, New Zealand, Spain Sweden, Switzerland, the United Kingdom, and the United States.
11 Based on 2012 motor vehicle crash death data.
12 The Fatal Analysis Reporting System (FARS) defines an alcohol-impaired driving crash to be one that involves a driver with a BAC of 0.08 g/dL or higher. Estimates of alcohol-impaired driving are generated using BAC values reported to the FARS, and BAC values are estimated when not available.
SOURCE: Data from NCSA, 2017b.
3,070 (29 percent) were motor vehicle occupants, and 948 (9 percent) were nonoccupants (NCSA, 2017b). See Figure 2-1 for more details on fatalities by role in alcohol-impaired driving crashes. Children are particularly vulnerable to alcohol-impaired driving crash fatalities. Among children ages 14 and younger who were killed in motor vehicle crashes in 2016, 17 percent died in alcohol-impaired driving crashes, 54 percent of whom were occupants of vehicles with drivers who had BAC levels of 0.08% or higher, 29 percent of whom were occupants in other vehicles, and 17 percent of whom were nonoccupants (pedestrians, cyclists, or others) (NCSA, 2017b). Most child passengers (61 percent) who were involved in
an alcohol-impaired driving crash from 2001 to 2010 were unrestrained at the time of the collision (Quinlan et al., 2014). Data on pedestrian traffic fatalities in 2016 indicate that these are on the rise, and 15 percent of drivers involved in these crashes had a BAC of 0.08% or greater (Retting, 2017). In summary, alcohol-impaired driving fatalities are not limited to the drivers themselves; other vehicle occupants including children and nonoccupants such as cyclists and pedestrians are also victims of crashes caused by alcohol-impaired driving.
Alcohol-impaired drivers are more likely to drive at higher speeds and to be involved in motor vehicle crashes at excessive speeds, as impairment diminishes sensory motor function and increases (i.e., delays) reaction time. Evidence suggests that driving while impaired (DWI) enforcement, such as sobriety checkpoints and saturation patrols, in combination with enforcement of speeding laws is effective at decreasing alcohol-related driving crashes and resulting injuries and fatalities (Sanem et al., 2015). See Chapters 4 and 5 for information on these and other DWI enforcement efforts.
First-time DWI offenders comprise the majority of DWI convictions, and only a small number of fatally injured drivers have prior convictions on their driving records (Williams et al., 2007). Nonetheless, efforts to draw attention to “hardcore DWI offenders” (i.e. repeat offenders or those with excessively high BAC levels), as well as stricter sanctions for such persons, are common, particularly from the alcohol industry (Williams et al., 2007). Evidence suggests that interventions aimed at repeat offenders, such as ignition interlocks, may also be beneficial to first-time offenders by decreasing their likelihood of recidivism (Williams et al., 2007) (see Chapter 5 for information on ignition interlocks). Interventions to decrease alcohol-impaired driving are likely to be most effective when aimed at all groups of drivers (Williams et al., 2007).
Luoma and Sivak (2014) examined the differences in road safety among the Netherlands, Sweden, the United Kingdom, and the United States. The authors found that while the United States had the lowest average alcohol consumption per capita, it also reported the highest number of alcohol-related driving fatalities. These findings do not account for the differences in limits set by laws between countries and the underreporting of alcohol-related crashes, yet they highlight an important disparity in alcohol-related crash fatalities. Lower fatality rates in other high-income countries suggest that the United States needs to make significantly more progress in reducing motor vehicle crash deaths to catch up to its peer nations. Between 2000 and 2013 the United States reduced overall crash deaths by 31 percent, while the average reduction among comparable high-income countries was 56 percent (CDC, 2016).
Other Adverse Driving Behaviors
Alcohol-impaired driving exists among other forms of dangerous driving behaviors such as distracted driving, drowsy driving, and driving under the influence of other drugs (e.g., cannabis or prescription drugs). The increasing prevalence of these forms of risky driving and their associated consequences has drawn a considerable amount of attention in the news and public agenda (Fisher, 2018). These are dangerous driving behaviors that pose health and safety risks to the public, and they warrant systematic investigation and the implementation of tailored, evidence-based solutions. This is particularly relevant for states that are navigating the recent legalization of cannabis and how that change may affect their current systems to address problems related to driving while impaired (NHTSA et al., 2017), as the scope of the problems of drug-impaired driving as well as concurrent drug- and alcohol-impaired driving are not well understood. Increases in the use of cannabis and prescription drugs are necessitating current research efforts to examine crash risk associated with drug use (Gjerde et al., 2015; Strand et al., 2016), methods for identification of drug-impaired drivers, and countermeasures to reduce crashes and fatalities from drug-impaired driving. However, it is important to note that while these types of driving have garnered much of the public’s attention, alcohol-impaired driving remains the most dangerous form of risky driving and constitutes the highest proportion of motor vehicle crash fatalities owing to human choices among distracted driving, restraint use, speeding, and drowsy driving (Compton and Berning, 2015; NCSA, 2016b). In addition, emerging evidence indicates that crash risk is highest for drivers impaired by both alcohol and drugs (AAA Foundation for Traffic Safety, 2016; WHO, 2015b, 2016). However, available data on driving fatalities due to impairment from drug use and impairment from co-use of drugs and alcohol is limited (see Chapter 6 for information on limitations in drug data collected by the FARS). Additional research will be needed to more fully understand the scope and extent of these problems.
Distracted driving occurs when drivers divert their attention from the driving task to another activity (e.g., texting, eating, talking to other passengers, or adjusting radio or climate controls). Talking and texting on cell phones are not only a distraction as manual tasks but also a cognitive distraction, and the combination of cognitive distraction with alcohol impairment increases the already heightened crash risk of either impairment alone. Distracted driving has increased over time and contributes to an increasing amount of motor vehicle crash fatalities per year (Wilson and Stimpson, 2010). In 2016, crash fatalities that involved distracted driving made up 9 percent of total crash fatalities (NCSA, 2017a). This is equivalent to almost one-third of the number of alcohol-impaired driving crash
fatalities during that year. Furthermore, research suggests that alcohol is an increasingly significant factor to account for in the growing number of fatalities involving distracted driving. From 1999 to 2008 the proportion of distracted drivers involved in a fatal crash who were also drinking alcohol while driving increased from 26 to 30.8 percent (Wilson et al., 2013). The FARS collection of data on distracted driving has several gaps and weaknesses; see Chapter 6 for a detailed discussion of these limitations.
A similar pattern emerges when comparing alcohol- and drug-impaired driving. Data from the National Survey on Drug Use and Health show that in 2014 the prevalence of driving under the influence of alcohol was higher than the prevalence of driving under the influence of illicit drugs by twofold, and a high proportion of those driving under the influence of drugs were concurrently under the influence of alcohol (Lipari et al., 2016; SAMHSA, 2015) (see Figure 2-2). Drivers who test positive for drugs and have a BAC at or above 0.05% have 5.34 times the adjusted odds of crashing when compared to someone without any drugs or alcohol in their system (Compton and Berning, 2015). In addition, crash risk for drivers with a BAC at or above 0.05% without a drug presence was higher than for drivers with a BAC at or above 0.05% with a drug presence, although the difference was not significant. After controlling for demographic variables and alcohol presence, no significant risk associated with the presence of cannabis or other specific drugs was found, although sample sizes were small. A 2011 case-control study that assessed the risk
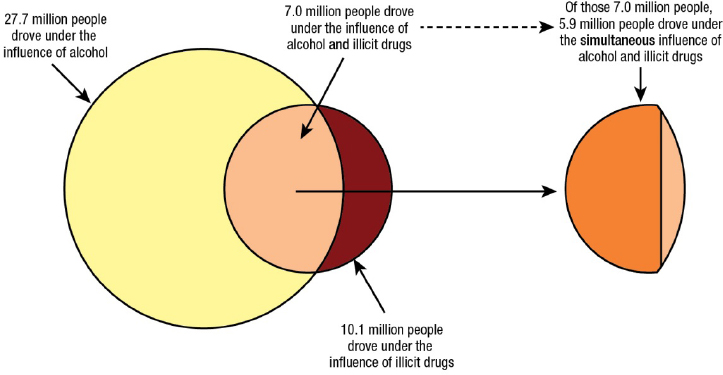
SOURCE: Lipari et al., 2016.
of driving under the influence of alcohol, illicit drugs, and medicines in European countries reported that the highest risk of serious injury or fatality was associated with driving with high BAC levels (above 0.12%) and driving with alcohol combined with other psychoactive substances (Hels et al., 2011). While the focus of this report is alcohol-impaired driving, targeting of both alcohol- and drug-related driving is needed.
PATTERNS OF ALCOHOL USE AND DEMOGRAPHICS
This section provides an overview of important demographics that need to be considered when approaching the problem of alcohol-impaired driving. First, based on the public health perspective outlined in Chapter 1, the importance of considering health equity and the social determinants of health is discussed. Relevant alcohol-related demographics are then provided.
The Importance of Applying a Health Equity Lens to the Issue
Because alcohol use and associated harms are unevenly distributed across populations, it is important to consider alcohol-related policies and interventions from an equity perspective (Roche et al., 2015a). While benefit to less advantaged populations is not a negative outcome, at times interventions may not benefit the population to which the intervention was intended to help or may disproportionately affect populations that were not the focus of the intervention. Researchers looking at public health strategies in general have found that some interventions may increase inequalities by disproportionately benefiting more advantaged groups (intervention-generated inequalities). Their findings are consistent with the idea that “downstream” preventive interventions are more likely to increase health inequities than “upstream” interventions (Lorenc et al., 2013). Unless consciously designed to avoid disparities, policies and actions that work for populations as a whole can inadvertently exacerbate inequalities (Smith and Foster, 2014).
The relationship between alcohol-related harm and social determinants may be bidirectional. For example, alcohol-related harms can contribute to loss of earnings, family disruption, interpersonal violence, mental health issues, and stigmatization, thus shaping social determinants (such as socioeconomic status) and exacerbating inequities. The resultant disadvantage may in turn compromise access to treatment (e.g., owing to cost or availability), heighten risk of co-occurring health problems, and perpetuate cycles of disadvantage (Schmidt et al., 2010). All alcohol-attributable mortality is in principle avoidable and future alcohol policies
are likely to be most effective if they take into consideration any differential effect on socioeconomic groups (Probst et al., 2014).
It is important to consider multiple levels of the social and physical environment in order to design multicomponent strategies that can be successful and change behavior. An important initial consideration is to understand the complexity of many interrelated influences on behavior to create policies and practices that are effective, while not increasing disparities among different populations. Important factors may include social norms and attitudes, social marginalization, education levels, socioeconomic status, geographic location, availability and cost of alcohol, and access to treatment resources.
Policy makers developing intervention strategies need to consider the local context in terms of knowledge, beliefs, and resources available to residents. For example, calls for enhanced enforcement, such as additional sobriety checkpoints, are unlikely to be effective without added financial resources or personnel and, more importantly, compassion for and cultural sensitivity toward populations of racial or ethnic minorities. Furthermore, a media campaign that urges impaired drivers to take a taxi or another form of public transportation home would be ineffective in rural areas where these resources are not available. Messaging composed in English in communities where a large number of residents do not speak English would be equally ineffective for that population. Public health campaigns that leverage local cultural beliefs and values to develop meaningful and relevant motivators to engage in certain behaviors may also be more effective. See Chapters 3 and 7 for more information on communication and messaging.
Social Determinants and Alcohol Use
Increasingly, health care policy makers and the public are understanding the link between social factors and health. There are many social factors that influence alcohol use patterns, including religious and cultural practices, peer groups, community and family relationships, social capital, poverty, education, advertising, economic conditions, the availability of alcohol, and the enforcement of alcohol laws (Dixon and Chartier, 2016; Roche et al., 2015b; Schor, 1996; Sudhinaraset et al., 2016). These factors are dynamic and intersect in myriad ways that are important to understand in a local context. They can contribute to differences in the burden of crashes, fatalities, injuries, and chronic health conditions that result from alcohol abuse and impaired driving among populations based on education, race and ethnicity, socioeconomic status, geography, and so on. In an effort to address alcohol use/abuse and impaired driving, it is important to move beyond the individual level and consider the social
determinants of these behaviors to develop effective population-level strategies to mitigate the negative health consequences of these issues and to provide insight into interventions that are most likely to be effective and have the greatest reach.
Alcohol-Impaired Driver Demographics
Age
CDC reports that at all levels of BAC, the risk of being involved in a crash is greater for younger than for older people (CDC, 2017b). The prevalence of driving under the influence of alcohol increases with age through the young adult years and then generally declines thereafter. In 2014 self-reported driving under the influence of alcohol was highest among drivers ages 21 to 29 (Lipari et al., 2016). FARS estimates show that drivers ages 21 to 34 made up 55 percent of drivers with BAC levels of 0.08% or higher who were involved in fatal crashes in 2015 (NCSA, 2016a).
Sex
Among those aged 16 or older in 2014, with the exception of drivers ages 16–20,13 men were more likely than women to have driven under the influence of alcohol in the past year; in addition, men aged 16 or older were more likely to drive under the influence of both alcohol and illicit drugs (Lipari et al., 2016). Of all drivers involved in fatal crashes in 2015, 21 percent of men and 14 percent of women had a BAC of 0.08% or higher (NCSA, 2016a). While this disparity has held constant for decades, there is limited research suggesting that female drivers are becoming increasingly involved in alcohol-impaired driving crashes (Vaca et al., 2014).
Race and Ethnicity
With respect to race and ethnicity, the groups that are consistently reported as having the highest risk of alcohol-impaired driving are American Indian or Alaska Native (AI/AN) and white drivers (Romano et al., 2010). For fatal crashes among AI/AN persons in 2012, 42 percent were alcohol related, while only 31 percent were alcohol related for other races overall (Letourneau and Crump, 2016). AI/AN persons had a substantially higher rate of alcohol-attributable deaths than whites from 2005
___________________
13 The difference in percentages of men and women ages 16–20 who drove impaired was not found to be statistically significant (Lipari et al., 2016).
to 2009. In 2005 the age-adjusted motor vehicle-related death rate among AI/AN persons was twice as high as among all other races (Piontkowski et al., 2015). Cultural, socioeconomic, and alcohol availability differences between AI/AN groups have contributed to disparities in overall alcohol-related mortality (Landen et al., 2014).
Findings from the 2007 National Roadside Survey show that Asian and Hispanic or Latino drivers are less likely than white drivers to be drinking (Kelley-Baker et al., 2013). According to FARS data from 2000 to 2013, the majority of people (51.2 percent) who died in alcohol-impaired driving crashes were non-Hispanic whites (Hadland et al., 2017). However, there are inconsistencies across studies with respect to the disparities in alcohol-attributable injury mortality among black or African American and Hispanic or Latino groups that might be partially explained by methodological issues of the studies and/or other social determinants that affect the relationship between race and ethnicity and injury outcomes (Keyes et al., 2012).
Socioeconomic Status (SES)
Unlike many other behaviors that pose serious risks to health and safety (e.g., smoking and violence), alcohol consumption has a more complex relationship with SES (Jones et al., 2015). People with higher incomes and levels of education are more likely to drink alcohol and to drive while impaired when compared to lower income and less educated populations. However, alcohol consumption has a disproportionate effect on people with lower SES in terms of alcohol-attributable harm such as morbidity (e.g., cancer, stroke, hypertension, and liver disease) (Jones et al., 2015; Katikireddi et al., 2017; Scaglione et al., 2015) and mortality (Probst et al., 2014). Thus, a paradox exists between patterns of behavior and attributable harm when examining these through the lens of SES. Further research is needed to more critically assess the relationship among SES, alcohol consumption, and alcohol-attributable harms (Jones et al., 2015).
Patterns of drinking behavior are a significant factor with respect to alcohol-impaired driving. Esser et al. (2016) analyzed data from the National Survey on Drug Use and Health (2009–2011) and found that binge drinking was most common among those with household incomes of $75,000 or more, whereas alcohol dependence (DSM-IV) was more common among those with annual household incomes of less than $25,000. Findings from the 2006 Behavioral Risk Factor Surveillance System (BRFSS) showed that the prevalence of alcohol-impaired driving
was high for binge drinkers across educational and income categories,14 including those who had attended college and had high annual incomes (Flowers et al., 2008). More recent data from the 2012 BRFSS suggest that the likelihood of driving while alcohol impaired increases with income (Jewett et al., 2015). This is consistent with findings from the 2001–2002 National Epidemiologic Survey on Alcohol and Related Conditions, which indicated that hazardous use of alcohol (i.e., driving after drinking, drinking while driving, and other non-driving-related behaviors) was the only alcohol abuse criterion to have a significant positive relationship with income. More specifically, adjusted odds ratios showed that those in the highest income category ($70,000 or more past-year personal income) were about two times as likely to drive after drinking compared to those in the lowest income category (less than $20,000) and 2.46 times as likely to drink while driving compared to those in the lowest income group (Keyes and Hasin, 2008).
Urban and Rural Populations
Rural populations also suffer a much higher fatality rate from motor vehicle crashes (alcohol related and non-alcohol related) than urban residents. While 19 percent of the U.S. population lives in rural areas and rural areas account for 30 percent of total vehicle miles traveled, more than half of crash deaths occur there (FHWA, 2015; IIHS, 2016; U.S. Census Bureau, 2010). Crashes in rural areas tend to occur at higher speeds, head-on collisions are more common owing to the prevalence of two-lane roads with no median, and guardrails are less common. There are often fewer witnesses to call for help in rural locations, and help is often farther away. Rural hospitals often have less capacity to handle severe trauma. Fewer police officers covering larger areas are less likely to arrest alcohol-impaired drivers (Vock, 2013). Additionally, alternative and public transportation options are far fewer in rural areas (Mattson, 2016; TRB, 2016) (see Chapter 4 for information on alternative and public transportation). Safety and upkeep of rural transportation infrastructure is similarly lacking (TRIP, 2017).
Per Capita Alcohol Consumption
At the population level, alcohol consumption has historically been associated with the incidence of alcohol-related traffic fatalities (Voas and
___________________
14 Binge drinking was defined in this study as five or more drinks for men and four or more drinks for women during one or more occasions (i.e., typically over a period of 2 hours) in the previous month (Flowers et al., 2008).
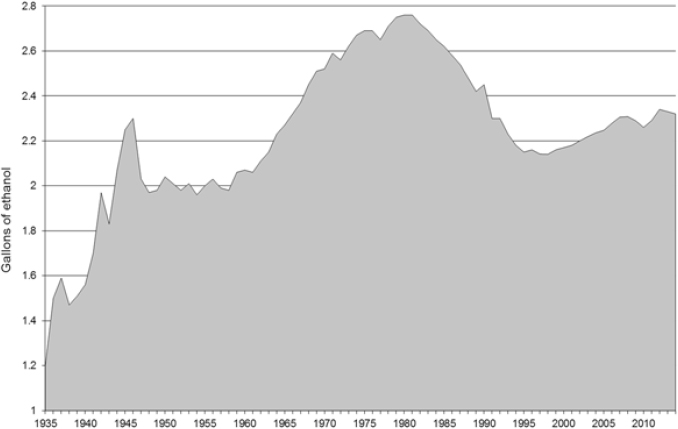
SOURCE: Haughwout et al., 2016.
Lacey, 2011). From 2011 to 2015, per capita alcohol consumption in the United States increased from 2.28 to 2.33 gallons (LaVallee et al., 2014). See Figure 2-3 for per capita alcohol consumption from 1935 to 2014. To meet the national goal set by Healthy People 2020 for per capita alcohol consumption to be no more than 2.1 gallons, a per capita decrease of 2.0 percent each year would need to take place for the next 5 years (Haughwout and Slater, 2017).
Patterns of Drinking
How people consume alcohol matters when it comes to consequences of alcohol-impaired driving. A substantial body of evidence indicates that binge drinking is strongly associated with alcohol-impaired driving (Flowers et al., 2008; Hingson et al., 2017; Naimi et al., 2009; Quinlan et al., 2005).15 The 2012 BRFSS findings revealed that respondents who reported binge drinking accounted for 85 percent of alcohol-impaired
___________________
15 The BRFSS definition for binge drinking was changed in 2006 from five or more drinks on one or more occasions (i.e., typically over a period of 2 hours) in the past month to sex-specific definitions of five or more drinks on one or more occasions in the past month for men and four or more drinks on one or more occasions in the past month for women (Chavez et al., 2011). Analysis by Naimi et al. (2009) and Quinlan et al. (2005) was based on
driving episodes, and the 4 percent who reported binge drinking at least four times per month accounted for 61 percent of all alcohol-impaired driving episodes (Jewett et al., 2015). In addition, early onset of drinking has been shown to be correlated with early onset of alcohol-impaired driving among young men (Zhang et al., 2014). Data on the prevalence of alcohol use disorders (AUDs) among DWI offenders are not consistently collected or reported (see Chapter 5 for information on screening for AUD among DWI offenders) (Lapham et al., 2004). From the data that are available, estimates suggest that alcohol use disorders are associated with having multiple DWI offenses (Lapham et al., 2011).
However, it is important to note that there is a large discrepancy between the amount of people who drink excessively but do not meet the diagnostic criteria for alcohol dependence and those who do. For example, national estimates of self-reported drinking behaviors from 138,100 adults who completed the National Survey on Drug Use and Health in 2009 to 2011 show that most people who drink excessively (90 percent) do not meet the criteria for alcohol dependence (Esser et al., 2014).16Flowers et al. (2008) analyzed data from the 2006 BRFSS and reported that binge drinking (i.e., high per occasion consumption) was more strongly associated with alcohol-impaired driving than heavy drinking (i.e., high average consumption).17 Specifically, binge drinkers accounted for 84 percent of impaired drivers and 89 percent of impaired driving episodes, while heavy drinkers only accounted for 35 percent of impaired drivers and 52 percent of impaired driving episodes.
Furthermore, more than half of alcohol-impaired drivers who reported binge drinking were not classified as heavy drinkers based on their average daily consumption, yet they had more than twice the odds of driving impaired than those who were not binge drinkers or heavy drinkers, when adjusting for age, sex, marital status, education, and income (Flowers et al., 2008). In another study that examined BRFSS data from 2003 and 2004, drinking drivers who drank most of their alcohol in licensed establishments consumed an average of 8.1 alcoholic beverages
___________________
the non-sex-specific definition for binge drinking; analysis by Flowers et al. (2008) was based on the sex-specific definition for binge drinking.
16 The study authors used the diagnostic criteria for alcohol dependence based on the DSM-IV, which has since changed in the DSM-5 to reflect varying degrees of severity of alcohol use disorder (e.g., mild, moderate, severe).
17 At the time of the study, the BRFSS defined binge drinking as consumption of five or more drinks for men and four or more drinks for women on one or more occasions (i.e., typically over a period of two hours) in the past 30 days; the BRFSS defined heavy drinking as consumption in the past 30 days of an average of more than two drinks per day for men (i.e., greater than 60 drinks per month) and more than one drink per day for women (i.e., greater than 30 drinks per month) (Flowers et al., 2008).
on one occasion, and about one-fourth of this group consumed 10 or more drinks (Naimi et al., 2009). Cumulatively, these findings suggest that the risk of driving subsequent to binge drinking is substantial on a per-binge-drinking episode basis across the population.
The problem of alcohol-impaired driving fatalities is related to both excessive drinking and to driving after one is impaired. Given the hand-in-glove relationship between binge drinking and alcohol-impaired driving, it is easy to overlook the importance of interventions to reduce alcohol consumption, and binge drinking in particular, among the general population. Previous studies demonstrate that policies to reduce binge drinking are independently protective against alcohol-impaired driving and the odds of alcohol involvement in crash fatalities, even after accounting for policies designed to prevent driving after one is impaired (Naimi et al., 2009, 2017; Wagenaar et al., 2010). During the past 15 years, however, while states have adopted strategies to reduce alcohol-impaired driving, the adoption and implementation of population-based strategies to reduce binge drinking and related harms has not changed (Nelson et al., 2013). This may partly explain why the proportion of crash fatalities that are alcohol related has not declined during that period. Given the finding that alcohol-impaired driving is a binge drinking problem as well as a driving problem, the committee concludes:
Conclusion 2-2: Policies to reduce binge drinking are also protective against alcohol-impaired driving, and the adoption of a comprehensive set of effective interventions and population-based strategies that take advantage of synergies across interventions would further help to reduce binge drinking and related harms.
Interventions and population-based strategies to reduce binge drinking and alcohol-impaired driving could include raising alcohol taxes, implementing policies to limit the physical availability of alcohol, and implementing policies to reduce the harmful effects of alcohol marketing (see Chapter 3 for more in-depth discussion of these policies).
SITUATIONAL FACTORS FOR ALCOHOL-IMPAIRED DRIVING
Day, Time, Distance, and Place of Last Drink
The findings of the 2013–2014 National Roadside Survey revealed substantial differences by day of the week and time of the day in the likelihood of drivers being alcohol impaired or having a BAC above the limit set by state law (Berning et al., 2015). Table 2-1 shows these differences. NHTSA’s National Center for Statistics and Analysis reported that
TABLE 2-1 Alcohol Prevalence by Data Collection Period and BAC in the 2013 to 2014 National Roadside Survey
| Time Period | % BAC >0.005% | % BAC >0.08% |
|---|---|---|
| Weekday daytime | 1.1% | 0.4% |
| Weekend nighttime | 8.3% | 1.5% |
SOURCE: Berning et al., 2015.
in 2014 the rate of alcohol impairment among drivers involved in fatal crashes was almost four times higher at night than during the day (34 versus 9 percent).
The 2007 National Roadside Survey results revealed that drivers with positive BAC levels were most likely to be driving short distances (5 miles or less) and coming from a restaurant, club, tavern, or bar (Kelley-Baker et al., 2013). This is consistent with other research findings, which suggest that almost half of people arrested for alcohol-impaired driving are coming from a licensed establishment (Fell et al., 2010; Gallup, 2000; O’Donnell, 1985). See Chapter 6 for information on the importance of data on place of last drink.
Geographic Location
In 2012 the BRFSS results showed that the Midwest U.S. Census region had the highest annual alcohol-impaired driving rate at 573 per 1,000 people (Jewett et al., 2015). A recent analysis of FARS data showed that the majority of deaths from alcohol-impaired driving crashes from 2000 to 2013 occurred in the South (45.6 percent), followed by the West (21.9 percent) and the Midwest (21.0 percent) (Hadland et al., 2017). In 2014 the proportion of alcohol-impaired driving fatalities (caused by drivers with a BAC ≥0.08%) among total traffic fatalities in states ranged from a high of 41 percent (Massachusetts, North Dakota, and Texas) to a low of 20 percent (Vermont), compared to a national average of 31 percent (NCSA, 2015).
Rural and Urban Regions18
NHTSA reported that from 2005 to 2014, rural alcohol-impaired driving fatalities decreased by 34 percent (7,721 to 5,134) and urban
___________________
18 Unless otherwise noted, the committee defines urban and rural areas using the 2010 Census Urban and Rural Classification: an urban area comprises a densely settled core of census tracts and/or census blocks that meet minimum population density requirements.
alcohol-impaired driving fatalities decreased by 19 percent (5,791 to 4,701) (NCSA, 2016c). In 2014, the relative proportions of alcohol-impaired driving fatalities were similar between rural and urban areas at 31 and 30 percent, respectively. However, among all alcohol-impaired driving fatalities in 2014, 52 percent occurred in rural areas and 47 percent occurred in urban areas. Vehicle miles traveled (VMT) per capita differ greatly in rural versus urban areas, with rural areas having far greater VMT per capita (Mattson, 2016). The most frequently recorded BAC among alcohol-impaired drivers in fatal crashes in rural areas was 0.19% and 0.14% for urban areas (NCSA, 2016c). DWI arrest rates also vary according to rural and urban composition, with arrests in nonmetropolitan areas outnumbering metropolitan arrests since the early 2000s (Huseth, 2012).
There are a number of important behavioral and environmental factors that contribute to higher fatality rates in rural areas. Some of these include differences in travel speed and speed limits; long distances between point of origin and destination, resulting in greater vehicle miles traveled (per capita); use of seatbelts; road conditions and aspects of road design; vehicle types; distance between point of sale or service of alcohol and place of residence; and delayed medical response and proximity of emergency care (Huseth, 2012; TRB, 2013). Decreasing use of seat belts, for example, has been found in rural areas (Beck et al., 2017). The unique challenges and characteristics of the rural environment will be discussed as important considerations in the design and implementation of interventions throughout the report.
Beverage of Choice of Alcohol-Impaired Drivers
The association of beer with alcohol-impaired driving is expected to be greater than for wine and distilled spirits, as there is greater general consumption of beer in the United States (WHO, 2011). However, research suggests that drinking beer also has a greater correlation than drinking wine or distilled spirits to alcohol-impaired driving because drivers underestimate intoxication from beer and perceive less risk from beer consumption (Greenfield and Rogers, 1999; Gruenewald and Ponicki, 1995; Walker et al., 2016). Beer consumption has also been shown to be correlated with higher rates of traffic fatalities (Rickard et al., 2013). Additional analyses would be needed to more critically analyze the higher
___________________
To qualify as an urban area, the territory identified must encompass at least 2,500 people, at least 1,500 of which reside outside institutional group quarters. The U.S. Census Bureau identifies two types of urban areas: (1) urbanized areas of 50,000 or more people and (2) urban clusters of at least 2,500 and less than 50,000 people. Rural areas are defined as all population, housing, and territory not included within an urban area (U.S. Census Bureau, 2010).
association of beer with alcohol-impaired driving, such as analysis evaluating whether persons who exclusively drink beer (compared to those who exclusively drink wine and those who exclusively drink distilled spirits) are more likely drive impaired. Other variables to examine regarding the association with alcohol-impaired driving of beer versus wine versus distilled spirits include age, place of consumption, and quantity of alcohol consumed per drinking occasion. Additionally, differential beverage availability at drinking establishments has been shown to affect alcohol-impaired driving likelihood. A study in Western Australia19 found that more alcohol-impaired drivers originated from drinking establishments selling more beer, including high alcohol content beer, and distilled spirits (Gruenewald et al., 1999). Beverage availability in on- and off-premises drinking establishments is an important consideration for alcohol pricing and taxation, which is discussed in Chapter 3. Box 2-1 summarizes some key findings presented in this chapter thus far.
THE DRIVING ENVIRONMENT
In addition to the alcohol environment, the driving environment includes equally important considerations for changing drinking and driving behaviors and for increasing the effectiveness of policies and interventions to reduce alcohol-impaired driving.
___________________
19 A standard drink in Australia is 10 grams of pure alcohol, while in the United States it is 14 grams.
Driving Trends
As the size of the U.S. population increases, the number of drivers has also increased. With the exception of a brief leveling off beginning in 2009, the number of drivers and number of vehicles has generally followed the same trend as population growth (FHWA, 2017) (see Figure 2-4). In 2015 the total number of drivers was 218 million, an increase from 191 million in 2000; 49.4 percent of drivers were men and 50.6 percent of drivers were women (FHWA, 2017). Table 2-2 provides a distribution of drivers by age in 2015.
Vehicle miles traveled experienced a downturn in 2009—most likely from the financial crisis; it has since increased and is now at the highest level in U.S. history (FHWA, 2017). A recent study by the University of Michigan Transportation Research Institute found that from 2000 to 2016,
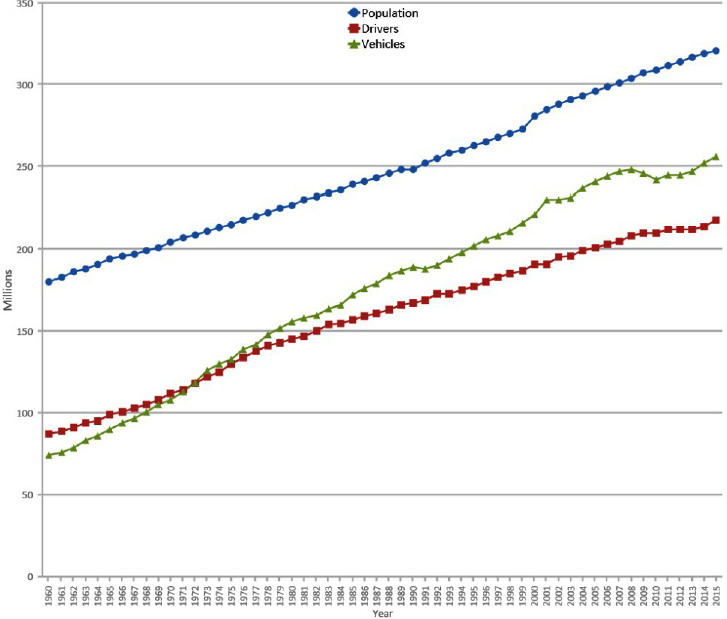
SOURCE: FHWA, 2017.
TABLE 2-2 Distribution of Licensed Drivers in 2015
| Age | Percent |
|---|---|
| 19 and under | 3.9 |
| 20–24 | 8.1 |
| 25–34 | 17.6 |
| 35–44 | 16.6 |
| 45–54 | 18.1 |
| 55–64 | 17.3 |
| 65+ | 18.4 |
SOURCE: FHWA, 2016.
total vehicle miles traveled increased by 15 percent, an increase accounted for by the increase in the U.S. population in the same time period (Sivak and Schoettle, 2017). However, the same study found that while urban vehicle miles traveled increased by 33 percent, rural vehicle miles traveled decreased by 12 percent; changes in urban and rural populations did not account for changes in urban and rural vehicle miles traveled (Sivak and Schoettle, 2017).
Changes to the Physical Driving Environment
As urban and rural areas differ significantly by roadway environment, implementation of road safety countermeasures varies accordingly. Vehicle usage also varies; 4 percent of rural households do not have access to a vehicle compared to 10 percent of urban households (Mattson, 2016). Distinction between urban and rural areas can be problematic, however, as classification definitions often vary and roadway classifications may not reflect important differences. Traditionally, urban and rural roadways have been classified by roadway speeds and conditions.
Additionally, significant growth of suburban areas in recent years has contributed to several changes in the physical driving environment. Findings from a U.S. Department of Transportation study showed that 73 percent of overall motor vehicle crash fatalities took place in urban fringe areas—about 5 miles out from an urban boundary—suggesting that such “urban edge” transition zones are an important consideration for effective points for intervention (Subramanian, 2009). A possible explanation is that as residents of suburban areas are more dependent on automobiles to travel, more driving is necessary for suburban residents. As such,
alternative modes of transportation, including taxis, public transportation, and smartphone-enabled transportation network ridesharing (see Chapter 4 for information), may be an important consideration to reduce crash fatalities in suburban and rural areas where greater distances of travel are necessary.
However, public transportation services in rural areas are particularly difficult to describe and catalogue, as availability changes significantly over time and can be difficult to track. Additionally, the existence of a transportation provider does not necessarily reflect access and ability to use it. Varying arrangements of public and private subsidies introduce additional complications.
Trends in traffic fatalities suggest that maintenance of transportation infrastructure is crucially important for safety. A general downward trend in traffic fatalities has taken place over the past decade; however, a slight increase occurred in 2012, and in 2016 there were 37,461 fatalities, the highest since 2008 (NCSA, 2017a), as well as an estimated 2.44 million injuries in 2015 (NCSA, 2016b).
Car Safety Features
Innovation in vehicle safety technology is rapidly expanding, with a range of technologies recently emerging that provide lane departure warnings, forward collision warnings, side view assists, adaptive cruise control, and many other features. Many hold promise to improve vehicle and road safety, although most are currently marketed not as safety features but as driver-assistance systems. Advanced vehicle technology in the form of the Driver Alcohol Detection System for Safety and autonomous vehicles are also in development (see Chapter 4 for more information). In addition to technological developments, recent efforts have focused on informing consumers about car safety features that are available and their capabilities.20 Research will be needed to determine how drivers will interact with these technological systems and the effectiveness of these systems in reducing crash and fatality rates in real-world settings (effectiveness to date has mostly been defined as a function of crash types the systems are designed to avoid).
___________________
20 For example, https://mycardoeswhat.org (accessed October 12, 2017).
IMPACTS OF ALCOHOL-IMPAIRED DRIVING
Impact on Health
As discussed in previous sections, alcohol-impaired driving crashes claim more than 10,000 lives per year. Driver and nondriver victims are among these deaths. Victims, including occupants of the same vehicle as the impaired driver, occupants of other vehicles, pedestrians, cyclists, and others on the road, make up 38 percent of alcohol-impaired driving crash fatalities (NCSA, 2017b). In addition to the loss of life as a result of alcohol-related crashes, victims often suffer from other consequences including pain, injury, and disability. Victims of alcohol-related crashes can also be subjected to emotional, psychological, and financial consequences that have the potential to greatly reduce their quality of life (Blincoe et al., 2015). The toll associated with injury, disability, and death that can affect victims of alcohol-related driving crashes can extend to their friends and family as well. These in part make up the secondhand effects of alcohol-impaired driving that are highlighted in Chapter 1.
Financial and Societal Costs
Driving under the influence of alcohol costs the nation significantly in financial and societal terms. Blincoe et al. (2015) estimate that the economic costs of alcohol-related crashes amounted to $52 billion in 2010. This estimate includes medical costs; emergency services, market productivity, household productivity, insurance administration, workplace costs, legal costs, congestion costs, and property damage (Blincoe et al., 2015). Their findings also indicated that in 2010 alcohol-related crashes accounted for 22 percent of all motor vehicle crash costs and that crashes involving drivers with a BAC of 0.08% or higher accounted for more than 90 percent of the economic costs and societal harm associated with alcohol-related crashes (Blincoe et al., 2015).
Taking overall societal costs into account, the effect of alcohol-related crashes is even greater. Zaloshnja et al. (2013) estimated that the total societal costs of alcohol-related crashes (where the driver’s BAC was >0.05%) in 2010 amounted to $121.5 billion, including $113 billion for crashes where the driver had a BAC of 0.08% or higher (Zaloshnja et al., 2013). This estimate includes societal costs due to medical costs; earnings losses; household productivity losses; insurance administration costs; legal costs; traffic congestion; vehicle damage; roadside equipment costs; incident management; vocational rehabilitation; workplace costs; fire department services; police services; monetized quality-adjusted life years lost; victim mental health treatment; adjudication, sanctioning, and legal defense fees; and perpetrator productivity loss (Zaloshnja et al., 2013).
The costs of alcohol-impaired driving listed above affect many individuals beyond the victims. Productivity loss can be associated with lost work time or DWI conviction costs (e.g., fines, loss of driving privileges, difficulty securing or maintaining employment, and increased insurance costs) (Bouchery et al., 2011). The burden of alcohol-impaired driving crashes can affect employers as well. Zaloshnja et al. (2007) estimated employer costs attributable to all alcohol-involved injuries, including health fringe benefit costs, nonfringe costs (e.g., disruption costs preventing employees from working at full capacity), and wage premiums using data from FARS, the Crashworthiness Data System, and the General Estimate System (Zaloshnja et al., 2007). Annual employer costs of alcohol-impaired driving crashes from 1998 to 2000 were estimated to be $9.2 billion (Zaloshnja et al., 2007). Finally, the substantial time, personnel, and resources expended on the arrest and adjudication process for DWI offenders can be costly for local law enforcement and the court system (Goodwin et al., 2015). This can be especially problematic for law enforcement agencies that have many other competing priorities in the interest of public safety and health. The consequences of alcohol-impaired driving can be far reaching and have implications for costs across various actors and sectors.
Conclusion 2-3: The costs and consequences of alcohol-impaired driving extend beyond the driver to include health, economic, social, and emotional costs borne by other road users, their families and friends, social and medical institutions, and society at large.
ALCOHOL-IMPAIRED DRIVING INTERVENTIONS
Policies and interventions to reduce alcohol-impaired driving, crashes, and fatalities are discussed in detail in Chapters 3, 4, and 5. In examining different interventions and their effectiveness in different environments, an important consideration in reducing alcohol-impaired driving fatalities nationwide is the substantial variation in the types of policies and laws that exist in each state.21 Below is a high-level overview.
___________________
21 A table by the Governors Highway Safety Administration (last updated June 2017) with state laws on high BAC, administrative license suspension, limited driving privileges, ignition interlocks, vehicle and license plate sanctions, open container laws, repeat offender laws, and alcohol exclusion laws limiting treatment is available at http://www.ghsa.org/sites/default/files/2017-06/DrunkDrivingLaws_062617.pdf (accessed October 12, 2017).
State Variation in Laws and Policies
With the exceptions of 0.08% per se laws, zero tolerance laws for underage persons, and a minimum drinking age set by state law of 21, there is little uniformity in the policies that address alcohol-impaired driving across state lines; considerable intrastate variation in policies and regulations exists as well. Furthermore, how these policies are implemented (e.g., target population, penalties, and mandatory versus discretionary) and enforced are critical factors in determining their effectiveness for specific areas and at the national level. Such policies can be alcohol specific, driving specific, or alcohol-impaired driving specific, and they can affect any point of intervention illustrated in the committee’s conceptual framework (see Figure 1-5) (e.g., alcohol consumption, drinking to impairment, and driving while impaired).
With respect to drinking-related policies, the variation in state regulation is a direct outcome of the Twenty-First Amendment. After the repeal of Prohibition, it was concluded that a uniform, nationwide alcohol control policy would not suit the heterogeneous makeup of the country (Fosdick and Scott, 1933). Moving forward, each state adopted the alcohol control policies and regulations most suitable for its respective local population. This is the underpinning of the patchwork of policies and regulation that is visible across the nation today (Schmidt, 2017). For example, after the repeal of Prohibition, the Illinois Control Act of 1934 gave voters in Chicago the right to vote specific precincts as “dry” (i.e., prohibiting liquor licenses within the precinct) through a local option referendum (Chicago Board of Election Commissioners, 2009). Other states, however, may completely preempt local control over alcohol availability.22 Another alcohol-specific policy that varies from state to state is responsible beverage service and server training. As of 2016, 12 states plus the District of Columbia had mandatory service training laws, 20 had voluntary laws, 6 had a combination of mandatory and voluntary policies, and 12 had neither (APIS, 2016).
Other policies and laws related to alcohol-impaired driving also vary from state to state. Sobriety checkpoints, an effective countermeasure when conducted properly (Bergen et al., 2014), are not implemented uniformly from state to state. While some states authorize the use of sobriety checkpoints, others prohibit them or do not have any explicit statutory authority on checkpoints. For example, Texas bans checkpoints based on its interpretation of the Constitution, and Missouri state law authorizes checkpoints but prohibits funds from being spent on checkpoint programs
___________________
22 See levels of preemption classified by state at http://www.camy.org/research-to-practice/place/alcohol-outlet-density/preemption-data-tool.html (accessed October 12, 2017).
(GHSA, 2016). Provisions of minimum drinking age laws also vary by state. One such provision concerns dram shop liability, which permits legal action against commercial establishments serving alcohol when illegal beverage service (i.e., to already-intoxicated adults or underage patrons) results in injury, death, or damages from alcohol-related vehicle crashes. Dram shop liability is enacted through statute in most states and through case law in others (Rammohan et al., 2011). The seven states that have neither dram shop liability laws nor statutes are Delaware, Kansas, Louisiana, Maryland, Nevada, South Dakota, and Virginia (Rammohan et al., 2011). In states in which dram shop liability is established through statute, additional legal hurdles, including limits to damages sought and strict requirements for evidence, may exist and create additional barriers that do not exist in states where liability is established through law (Rammohan et al., 2011).
There are inherent differences in how specific jurisdictions govern that shape the alcohol and driving policy environment. AI/AN territories, for example, have unique complexities of tribal sovereignty that have implications for how crimes such as alcohol-impaired driving are handled. Jurisdiction is complicated by “competing claims of federal, tribal, and state sovereignty manifested in a complex array of laws that create a system of jurisdiction based on location, type of crime, race of the perpetrator, and race of the victim” (Harvard Law Review, 2016, p. 1687).
In fact, in many states with AI/AN reservations, tribal law enforcement officers do not have the authority to stop a driver suspected of being impaired once the suspect crosses the border, leaving their jurisdiction. Such limitations are especially problematic for this population, since AI/ANs are at high risk for driving while impaired and sustaining injuries or fatalities from an alcohol-related crash (Letourneau and Crump, 2016). Additional differences in policies and laws will be discussed throughout the report as they apply to various interventions for alcohol-impaired driving.
Advocates for Highway and Auto Safety rates each state according to the implementation of what they deem as three optimal impaired driving laws: ignition interlock laws for all offenders, child endangerment laws, and open container laws (Advocates for Highway and Auto Safety, 2017) (see Figure 2-5). As of August 2017, 20 states and the District of Columbia have all three optimal laws enacted (good rating), 10 states have ignition interlocks for all offenders and one other optimal law enacted (caution rating), and 20 states had zero or one optimal impaired driving law (danger rating).
In addition to state-by-state variation in individual alcohol, driving, and alcohol-impaired driving policies, states’ overall policy environments are also an important consideration for reducing alcohol-impaired driving
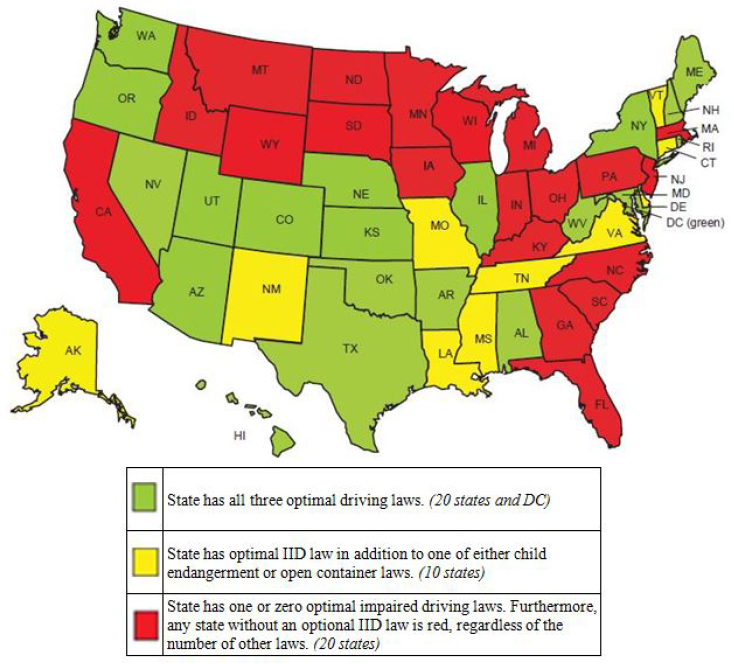
NOTES: No credit is given for laws that are subject to secondary enforcement. This map reflects state impaired driving laws as of August 2017. IID = ignition interlock device.
SOURCES: Advocates for Highway and Auto Safety, 2017; Kennedy, 2017. Personal communication with Allison Kennedy, Advocates for Highway and Auto Safety on August 31, 2017. Available by request from the National Academies of Sciences, Engineering, and Medicine’s Public Access Records Office (PARO@nas.edu).
fatalities. Studies have found that rates of binge drinking and self-reported alcohol-impaired driving are lower in states with more restrictive alcohol policy environments (Naimi et al., 2014; Xuan et al., 2015a,b). Furthermore, for those under 21 years of age, a 10 percent increase in the strength of a state’s alcohol policy environment was found to be correlated with
a 9 percent decrease in the risk of alcohol-impaired motor vehicle crash fatalities across age and sex for both drivers and passengers (Hadland et al., 2017). Although evidence on the effectiveness of states’ overall policy environments to reduce alcohol-impaired driving fatalities among the general population is limited, implementation and enforcement of “a strong collection of alcohol control policies acting in concert in a state” is a promising strategy to accelerate progress (Hadland et al., 2017, p. 2). The lack of a comprehensive population-based strategy may partly explain why the proportion of crash fatalities that are alcohol impaired has not declined in the last decade and has plateaued and has begun to increase.
REFERENCES
AAA (American Automobile Association) Foundation for Traffic Safety. 2016. Prevalence of marijuana involvement in fatal crashes: Washington, 2010–2014. Washington, DC: AAA Foundation for Traffic Safety.
AB InBev (Anheuser-Busch InBev). n.d. Global smart drinking goals. http://www.ab-inbev.com/better-world/a-healthier-world/global-smart-drinking-goals.html (accessed December 6, 2017).
Advocates for Highway and Auto Safety. 2017. Have we forgotten what saves lives?: 2017 roadmap of state highway safety laws. Washington, DC: Advocates for Highway and Auto Safety.
Ames, G. M., and J. W. Grube. 1999. Alcohol availability and workplace drinking: Mixed method analyses. Journal of Studies on Alcohol and Drugs 60(3):383–393.
Anderson, P., and J. Rehm. 2016. Evaluating alcohol industry action to reduce the harmful use of alcohol. Alcohol and Alcoholism 51(4):383–387.
APIS (Alcohol Policy Information System). 2016. Retail sales: Beverage service training and related practices. https://alcoholpolicy.niaaa.nih.gov/Beverage_Service_Training_and_Related_Practices.html (accessed March 31, 2017).
Aston, E. R., and A. Liguori. 2013. Self-estimation of blood alcohol concentration: A review. Addictive Behaviors 38(4):1944–1951.
Babor, T. 2010a. Alcohol: No ordinary commodity: Research and public policy. New York: Oxford University Press.
Babor, T. 2010b. Alcohol: No ordinary commodity—A summary of the second edition. Addiction 105(5):769–779.
Babor, T. F., K. Robaina, and D. Jernigan. 2015. The influence of industry actions on the availability of alcoholic beverages in the African region. Addiction 110(4):561–571.
Babor, T. F., K. Robaina, and J. Noel. 2018. The role of the alcohol industry in policy interventions for alcohol-impaired driving. Paper commissioned by the Committee on Accelerating Progress to Reduce Alcohol-Impaired Driving Fatalities (see Appendix C).
Baer, J. S., A. Stacy, and M. Larimer. 1991. Biases in perception of drinking norms among college students. Journal of Studies on Alcohol 52(6):580–586.
Beck, L. F., J. Downs, M. R. Stevens, and E. K. Sauber-Schatz. 2017. Rural and urban differences in passenger-vehicle-occupant deaths and seat belt use among adults—United States, 2014. Morbidity and Mortality Weekly Report Surveillance Summaries 66(17):1–13.
Beer Marketer’s Insights. 2017. 2017 beer industry update. Suffern, NY: Beer Marketer’s Insights.
Bergen, G., A. Pitan, S. Qu, R. A. Shults, S. K. Chattopadhyay, R. W. Elder, D. A. Sleet, H. L. Coleman, R. P. Compton, J. L. Nichols, J. M. Clymer, and W. B. Calvert. 2014. Publicized sobriety checkpoint programs: A community guide systematic review. American Journal of Preventive Medicine 46(5):529–539.
Berger, D. E., and J. R. Snortum. 1985. Alcoholic beverage preferences of drinking-driving violators. Journal of Studies on Alcohol 46(3):232–239.
Berning, A., R. Compton, and K. Wochinger. 2015. Results of the 2013–2014 National Roadside Survey of Alcohol and Drug Use by Drivers. DOT HS 812 118. Washington, DC: National Highway Traffic Safety Administration.
Blincoe, L., T. R. Miller, E. Zaloshnja, and B. A. Lawrence. 2015. The economic and societal impact of motor vehicle crashes, 2010 (revised). DOT HS 812 013. Washington, DC: National Highway Traffic Safety Administration.
Bond, J., T. K. Greenfield, and W. Kerr. 2008 (unpublished). Variation in the relationship between alcohol beverage choice, risk perception, and self-reported drunk driving across the US states. Emeryville, CA: Alcohol Research Group.
Bouchery, E. E., H. J. Harwood, J. J. Sacks, C. J. Simon, and R. D. Brewer. 2011. Economic costs of excessive alcohol consumption in the U.S., 2006. American Journal of Preventive Medicine 41(5):516–524.
Breslow, R. A., I. P. Castle, C. M. Chen, and B. I. Graubard. 2017. Trends in alcohol consumption among older Americans: National Health Interview Surveys, 1997 to 2014. Alcoholism: Clinical and Experimental Research 41(5):976–986.
CDC (Centers for Disease Control and Prevention). 2016. Motor vehicle crash deaths: How is the US doing? CDC Vital Signs. https://www.cdc.gov/vitalsigns/pdf/2016-07-vitalsigns.pdf (accessed August 7, 2017).
CDC. 2017a. Fact sheets—Alcohol and caffeine. https://www.cdc.gov/alcohol/fact-sheets/caffeine-and-alcohol.htm (accessed October 2, 2017).
CDC. 2017b. Impaired driving: Get the facts. https://www.cdc.gov/motorvehiclesafety/impaired_driving/impaired-drv_factsheet.html (accessed January 30, 2017).
Chavez, P. R., D. E. Nelson, T. S. Naimi, and R. D. Brewer. 2011. Impact of a new gender-specific definition for binge drinking on prevalence estimates for women. American Journal of Preventive Medicine 40(4):468–471.
Chicago Board of Election Commissioners. 2009. Guideline for local option referenda. https://chicagoelections.com/dm/general/document_51.PDF (accessed August 10, 2017).
Clarke, T. C., T. Norris, and J. S. Schiller. 2017. Early release of selected estimates based on data from the 2016 National Health Interview Survey. Hyattsville, MD: National Center for Health Statistics.
Collins, T., and W. Vamplew. 2011. Mud, sweat and beers: A cultural history of sport and alcohol, Global sport cultures. London, UK: Bloomsbury Academic.
Compton, R. P., and A. Berning. 2015. Drug and alcohol crash risk. Washington, DC: National Highway Traffic Safety Administration.
De Visser, R. O., and J. A. Smith. 2007. Alcohol consumption and masculine identity among young men. Psychology and Health 22(5):595–614.
DiMaggio, C., K. Wheeler-Martin, and J. Oliver. 2018. Alcohol-impaired driving in the United States: Overview, review of data sources, and analyses. Paper commissioned by the Committee on Accelerating Progress to Reduce Alcohol-Impaired Driving Fatalities (see Appendix A).
Dixon, M. A., and K. G. Chartier. 2016. Alcohol use patterns among urban and rural residents: Demographic and social influences. Alcohol Research 38(1):69–77.
DOJ (U.S. Department of Justice). 2009. Enforcing underage drinking laws program. https://www.ncjrs.gov/pdffiles1/ojjdp/227469.pdf (accessed August 23, 2017).
Dwyer-Lindgren, L., A. D. Flaxman, M. Ng, G. M. Hansen, C. J. Murray, and A. H. Mokdad. 2015. Drinking patterns in US counties from 2002 to 2012. American Journal of Public Health 105(6):1120–1127.
Esser, M. B., S. L. Hedden, D. Kanny, R. D. Brewer, J. C. Gfroerer, and T. S. Naimi. 2014. Prevalence of alcohol dependence among US adult drinkers, 2009–2011. Preventing Chronic Disease 11:E206.
Esser, M. B., J. Bao, D. H. Jernigan, and A. A. Hyder. 2016. Evaluation of the evidence base for the alcohol industry’s actions to reduce drink driving globally. American Journal of Public Health 106(4):707–713.
Fell, J. C., S. Tippetts, and R. Voas. 2010. Drinking characteristics of drivers arrested for driving while intoxicated in two police jurisdictions. Traffic Injury and Prevention 11(5): 443–452.
FHWA (Federal Highway Administration). 2015. Annual vehicle distance traveled in miles and related data-2014. https://www.fhwa.dot.gov/policyinformation/statistics/2014/vm1.cfm (accessed October 31, 2017).
FHWA. 2016. Highway statistics 2015. Distribution of licensed drivers—2015. By sex and percentage in each age group and relation to population. https://www.fhwa.dot.gov/policyinformation/statistics/2015/dl20.cfm (accessed August 23, 2017).
FHWA. 2017. Highway statistics series. Highway statistics 2015. Licensed drivers, vehicle registrations, and resident population (in millions). https://www.fhwa.dot.gov/policyinformation/statistics/2015/dv1c.cfm (accessed August 23, 2017).
Fisher, D. A. 2018. Content analysis of alcohol-impaired driving stories in the news. Paper commissioned by the Committee on Accelerating Progress to Reduce Alcohol-Impaired Driving Fatalities (see Appendix B).
Flowers, N. T., T. S. Naimi, R. D. Brewer, R. W. Elder, R. A. Shults, and R. Jiles. 2008. Patterns of alcohol consumption and alcohol-impaired driving in the United States. Alcoholism, Clinical and Experimental Research 32(4):639–644.
FollowTheMoney.org. n.d. National Institute on Money in State Politics. https://www.followthemoney.org (accessed October 2, 2017).
Forster, J. L., D. M. Murray, M. Wolfson, and A. C. Wagenaar. 1995. Commercial availability of alcohol to young people: Results of alcohol purchase attempts. Preventive Medicine 24(4):342–347.
Forward, J., J. Akhurst, R. Bruno, X. Leong, A. VanderNiet, H. Bromfield, J. Erny, T. Bellamy, and A. Peacock. 2017. Nature versus intensity of intoxication: Co-ingestion of alcohol and energy drinks and the effect on objective and subjective intoxication. Drug and Alcohol Dependence 180:292–303.
Fosdick, R. B., and A. L. Scott. 1933. Toward liquor control. New York: Harper and Brothers.
Foster, S. E., R. D. Vaughan, W. H. Foster, and J. A. Califano, Jr. 2006. Estimate of the commercial value of underage drinking and adult abusive and dependent drinking to the alcohol industry. Archives of Pediatrics & Adolescent Medicine 160(5):473–478.
FTC (Federal Trade Commission). 2013. Alcohol advertising. https://www.consumer.ftc.gov/articles/0391-alcohol-advertising (accessed September 20, 2017).
Gallup. 2000. Volume I: Findings, racial and ethnic group comparisons, National Survey of Drinking and Driving, June 2000, attitudes and behaviors—1993, 1995, 1997. DTNH22-96-c-05081. Washington, DC: National Highway Traffic Safety Administration.
Galvan, F. H., and R. Caetano. 2003. Alcohol use and related problems among ethnic minorities in the United States. Alcohol Research & Health 27(1):87–95.
GHSA (Governors Highway Safety Association). 2016. Sobriety checkpoints. http://www.ghsa.org/state-laws/issues/Sobriety-Checkpoints (accessed March 31, 2017).
Gjerde, H., M. C. Strand, and J. Morland. 2015. Driving under the influence of non-alcohol drugs—An update. Part I: Epidemiological studies. Forensic Science Review 27(2):89–113.
Goodwin, A., L. Thomas, B. Kirley, W. Hall, N. O’Brien, and K. Hill. 2015. Countermeasures that work: A highway safety countermeasure guide for state highway safety offices, 8th ed. DOT HS 812 202. Washington, DC: National Highway Traffic Safety Administration.
Grant, B. F., S. P. Chou, T. D. Saha, R. P. Pickering, B. T. Kerridge, W. J. Ruan, B. Huang, J. Jung, H. Zhang, A. Fan, and D. S. Hasin. 2017. Prevalence of 12-month alcohol use, high-risk drinking, and DSM-IV alcohol use disorder in the United States, 2001–2002 to 2012–2013: Results from the National Epidemiologic Survey on Alcohol and Related Conditions. JAMA Psychiatry 74(9):911–923.
Greenfield, T. K., and J. D. Rogers. 1999. Alcoholic beverage choice, risk perception and self-reported drunk driving: Effects of measurement on risk analysis. Addiction 94(11): 1735–1743.
Gruenewald, P. J., and W. R. Ponicki. 1995. The relationship of the retail availability of alcohol and alcohol sales to alcohol-related traffic crashes. Accident Analysis & Prevention 27(2):249–259.
Gruenewald, P. J., T. Stockwell, A. Beel, and E. V. Dyskin. 1999. Beverage sales and drinking and driving: The role of on-premise drinking places. Journal of Studies on Alcohol 60(1):47–53.
Hadland, S. E., Z. Xuan, V. Sarda, J. Blanchette, M. H. Swahn, T. C. Heeren, R. B. Voas, and T. S. Naimi. 2017. Alcohol policies and alcohol-related motor vehicle crash fatalities among young people in the US. Pediatrics 139(3):e20163037.
Harvard Law Review. 2016. Fresh pursuit from Indian country: Tribal authority to pursue suspects onto state land. Harvard Law Review 129(6):1685–1708.
Haughwout, S. P., and M. E. Slater. 2017. Apparent per capita alcohol consumption: National, state, and regional trends, 1977–2015. Surveillance report 108. Arlington, VA: CSR, Inc., National Institute on Alcohol Abuse and Alcoholism.
Haughwout, S. P., R. A. LaVallee, and I.-J. P. Castle. 2016. Apparent per capita alcohol consumption: National, state, and regional trends, 1977–2014. Surveillance report 104. Arlington, VA: CSR, Inc., National Institute on Alcohol Abuse and Alcoholism.
Hels, T., I. M. Bernhoft, A. Lyckegaard, S. Houwing, M. Hagenzieker, S.-A. Legrand, C. Isalberti, T. Van der Linden, and A. Verstraete. 2011. Risk of injury by driving with alcohol and other drugs. Driving under the Influence of Drugs, Alcohol and Medicines. Kongens Lyngby: Technical University of Denmark.
HHS and SAMHSA (U.S. Department of Health and Human Services and Substance Abuse and Mental Health Services Administration). 2016. Chapter 3: A coordinated federal approach to preventing and reducing underage drinking. In September 2016 Report to Congress on the Prevention and Reduction of Underage Drinking. Washington, DC: Interagency Coordinating Committee on the Prevention of Underage Drinking.
Hingson, R. W., W. Zha, and A. M. White. 2017. Drinking beyond the binge threshold: Predictors, consequences, and changes in the U.S. American Journal of Preventive Medicine 52(6):717–727.
Huber, H., R. Karlin, and P. E. Nathan. 1976. Blood alcohol level discrimination by nonalcoholics. The role of internal and external cues. Journal of Studies on Alcohol 37(1):27–39.
Huckle, T., M. Pledger, and S. Casswell. 2006. Trends in alcohol-related harms and offences in a liberalized alcohol environment. Addiction 101(2):232–240.
Huseth, A. 2012. Alcohol-impaired driving: Common practices and performance. Fargo: Rural Transportation Safety and Security Center, Upper Great Plains Transportation Institute, North Dakota State University.
IIHS (Insurance Institute for Highway Safety). 2016. Urban/rural comparison. http://www.iihs.org/iihs/topics/t/roadway-and-environment/fatalityfacts/roadway-and-environment (accessed October 31, 2017).
Impact Databank. 2017a. The U.S. spirits market: Impact databank review and forecast, 2017 ed. New York: Shanken Communications.
Impact Databank. 2017b. The U.S. wine market: Impact databank review and forecast, 2017 ed. New York: Shanken Communications.
Jang, J. B., M. E. Patrick, K. M. Keyes, A. D. Hamilton, and J. E. Schulenberg. 2017. Frequent binge drinking among US adolescents, 1991 to 2015. Pediatrics 139(6):e20164023.
Jernigan, D., J. Noel, J. Landon, N. Thornton, and T. Lobstein. 2017. Alcohol marketing and youth alcohol consumption: A systematic review of longitudinal studies published since 2008. Addiction 112(Suppl 1):7–20.
Jewett, A., R. A. Shults, T. Banerjee, and G. Bergen. 2015. Alcohol-impaired driving among adults—United States, 2012. Morbidity and Mortality Weekly 64(30):814–817.
Jones, L., G. Bates, E. McCoy, and M. A. Bellis. 2015. Relationship between alcohol-attributable disease and socioeconomic status, and the role of alcohol consumption in this relationship: A systematic review and meta-analysis. BMC Public Health 15:400.
Katikireddi, S. V., E. Whitley, J. Lewsey, L. Gray, and A. H. Leyland. 2017. Socioeconomic status as an effect modifier of alcohol consumption and harm: Analysis of linked cohort data. Lancet Public Health 2(6):e267–e276.
Kelley-Baker, T., J. H. Lacey, R. B. Voas, E. Romano, J. Yao, and A. Berning. 2013. Drinking and driving in the United States: Comparing results from the 2007 and 1996 national roadside surveys. Traffic Injury and Prevention 14(2):117–126.
Kerr, W. C., and T. K. Greenfield. 2015. Racial/ethnic disparities in the self-reported number of drinks in 2 hours before driving becomes impaired. American Journal of Public Health 105(7):1409–1414.
Kerr, W. C., and T. Stockwell. 2012. Understanding standard drinks and drinking guidelines. Drug and Alcohol Review 31(2):200–205.
Kerr, W. C., T. K. Greenfield, J. Tujague, and S. E. Brown. 2005. A drink is a drink? Variation in the amount of alcohol contained in beer, wine and spirits drinks in a US methodological sample. Alcoholism: Clinical and Experimental Research 29(11):2015–2021.
Kerr, W. C., T. K. Greenfield, and L. T. Midanik. 2006. How many drinks does it take you to feel drunk? Trends and predictors for subjective drunkenness. Addiction 101(10): 1428–1437.
Kerr, W. C., D. Patterson, M. A. Koenen, and T. K. Greenfield. 2008. Alcohol content variation of bar and restaurant drinks in northern California. Alcoholism: Clinical and Experimental Research 32(9):1623–1629.
Kerr, W. C., D. Patterson, T. K. Greenfield, A. S. Jones, K. A. McGeary, J. V. Terza, and C. J. Ruhm. 2013a. U.S. alcohol affordability and real tax rates, 1950–2011. American Journal of Preventive Medicine 44(5):459–464.
Kerr, W. C., D. Patterson, and T. K. Greenfield. 2013b. The blurring of alcohol categories. Alexandria, VA: National Alcohol Beverage Control Association.
Keyes, K. M., and D. S. Hasin. 2008. Socio-economic status and problem alcohol use: The positive relationship between income and the DSM-IV alcohol abuse diagnosis. Addiction 103(7):1120–1130.
Keyes, K. M., X. C. Liu, and M. Cerda. 2012. The role of race/ethnicity in alcohol-attributable injury in the United States. Epidemiologic Reviews 34:89–102.
King, C., 3rd, M. Siegel, C. S. Ross, and D. H. Jernigan. 2017. Alcohol advertising in magazines and underage readership: Are underage youth disproportionately exposed? Alcoholism: Clinical and Experimental Research 41(10):1775–1782.
Lalanne, L., P. E. Lutz, and F. Paille. 2017. Acute impact of caffeinated alcoholic beverages on cognition: A systematic review. Progress in Neuro-Psychopharmacology & Biological Psychiatry 76:188–194.
Landen, M., J. Roeber, T. Naimi, L. Nielsen, and M. Sewell. 2014. Alcohol-attributable mortality among American Indians and Alaska Natives in the United States, 1999–2009. American Journal of Public Health 104(Suppl 3):S343–S349.
Lansky, D., P. E. Nathan, S. M. Ersner-Hershfield, and T. R. Lipscomb. 1978. Blood alcohol level discrimination: Pre-training monitoring accuracy of alcoholics and nonalcoholics. Addictive Behaviors 3(3–4):209–214.
Lapham, S. C., J. C’de Baca, G. McMillan, and W. C. Hunt. 2004. Accuracy of alcohol diagnosis among DWI offenders referred for screening. Drug and Alcohol Dependence 76(2):135–141.
Lapham, S. C., R. Stout, G. Laxton, and B. J. Skipper. 2011. Persistence of addictive disorders in a first-offender driving while impaired population. Archives of General Psychiatry 68(11):1151–1157.
Laude, J. R., and M. T. Fillmore. 2016. Drivers who self-estimate lower blood alcohol concentrations are riskier drivers after drinking. Psychopharmacology 233(8):1387–1394.
LaVallee, R. A., T. Kim, and H.-Y. Yi. 2014. Apparent per capita alcohol consumption: National, state, and regional trends, 1977–2012. Surveillance report 98. Arlington, VA: CSR, Inc., National Institute on Alcohol Abuse and Alcoholism.
Letourneau, R. J., and C. E. Crump. 2016. Tribal motor vehicle injury preventions (TMVIP) best practices guide 2016. Atlanta, GA: Centers for Disease Control and Prevention.
Lipari, R. N., A. Hughes, and J. Bose. 2016. Driving under the influence of alcohol and illicit drugs. The CBHSQ report: December 27, 2016. Rockville, MD: Center for Behavioral Health Statistics and Quality, Substance Abuse and Mental Health Services Administration.
Lobstein, T., J. Landon, N. Thornton, and D. Jernigan. 2017. The commercial use of digital media to market alcohol products: A narrative review. Addiction 112(Suppl 1):21–27.
Lorenc, T., M. Petticrew, V. Welch, and P. Tugwell. 2013. What types of interventions generate inequalities? Evidence from systematic reviews. Journal of Epidemiology and Community Health 67(2):190–193.
Luoma, J., and M. Sivak. 2014. Why is road safety in the U.S. not on par with Sweden, the U.K., and the Netherlands? Lessons to be learned. European Transport Research Review 6(3):295–302.
Martens, M. P., J. C. Page, E. S. Mowry, K. M. Damann, K. K. Taylor, and M. D. Cimini. 2006. Differences between actual and perceived student norms: An examination of alcohol use, drug use, and sexual behavior. Journal of American College Health 54(5):295–300.
Martin, T. L., P. A. Solbeck, D. J. Mayers, R. M. Langille, Y. Buczek, and M. R. Pelletier. 2013. A review of alcohol-impaired driving: The role of blood alcohol concentration and complexity of the driving task. Journal of Forensic Sciences 58(5):1238–1250.
Mattson, J. 2016. Rural transit fact book 2016. Fargo: North Dakota State University. Upper Great Plains Transportation Institute. Small Urban and Rural Transit Center.
McKetin, R., A. Coen, and S. Kaye. 2015. A comprehensive review of the effects of mixing caffeinated energy drinks with alcohol. Drug and Alcohol Dependence 151:15–30.
Michael, J. 2017. Powerpoint presentation to the Committee on Accelerating Progress to Reduce Alcohol-Impaired Driving Fatalities in Washington, DC, February 16, 2017. http://www.nationalacademies.org/hmd/~/media/Files/Activity%20Files/AcceleratingProgresstoReduceAlcoholImpairedDrivingFatalities/16%20FEB%202017/1%20Michael.pdf (accessed September 26, 2017).
Mintel. 2015. The craft effect: One in four beers launched globally in 2014 was high strength. http://www.mintel.com/press-centre/food-and-drink/the-craft-effect-one-in-four-beers-launched-globally-in-2014-was-high-strength (accessed December 6, 2017).
Mulia, N., K. J. Karriker-Jaffe, J. Witbrodt, J. Bond, E. Williams, and S. E. Zemore. 2017. Racial/ethnic differences in 30-year trajectories of heavy drinking in a nationally representative US sample. Drug and Alcohol Dependence 170:133–141.
Naimi, T. S., D. E. Nelson, and R. D. Brewer. 2009. Driving after binge drinking. American Journal of Preventive Medicine 37(4):314–320.
Naimi, T. S., J. Blanchette, T. F. Nelson, T. Nguyen, N. Oussayef, T. C. Heeren, P. Gruenewald, J. Mosher, and Z. Xuan. 2014. A new scale of the U.S. alcohol policy environment and its relationship to binge drinking. American Journal of Preventive Medicine 46(1):10–16.
Naimi, T. S., Z. Xuan, V. Sarda, S. Hadland, M. Lira, T. Heeren, R. Voas, and M. H. Swahn. 2017. Alcohol policies and alcohol-related motor vehicle crash fatalities among U.S. adults. Paper presented at 43rd Annual Alcohol Epidemiology Symposium of the Kettil Bruun Society, Sheffield, England.
NASADAD (National Association of State Alcohol and Drug Abuse Directors). 2016. NASADAD priority programs within the Department of Justice (DOJ). http://nasadad.org/wp-content/uploads/2016/02/DOJ-Programs-Fact-Sheet-DRAFT-2016.pdf (accessed August 23, 2017).
NCSA (National Center for Statistics and Analysis). 2015. Alcohol-impaired driving: 2014 data. Traffic Safety Facts. DOT HS 812 231. Washington, DC: National Highway Traffic Safety Administration.
NCSA. 2016a. Alcohol-impaired driving: 2015 data. Traffic Safety Facts. Report No. DOT HS 812 350. Washington, DC: National Highway Traffic Safety Administration.
NCSA. 2016b. 2015 motor vehicle crashes: Overview. Traffic Safety Facts. Report No. DOH HS 812 318. Washington, DC: National Highway Traffic Safety Administration.
NCSA. 2016c. Rural/urban comparison: 2014 data. Traffic Safety Facts. Report No. DOT HS 812 301. Washington, DC: National Highway Traffic Safety Administration.
NCSA. 2017a. 2016 fatal motor vehicle crashes: Overview. Traffic Safety Facts Research Note. Report No. DOT HS 812 456. Washington, DC: National Highway Traffic Safety Administration.
NCSA. 2017b. Alcohol-impaired driving: 2016 data. Traffic Safety Facts. Report No. DOT HS 812 450. Washington, DC: National Highway Traffic Safety Administration.
Nelson, T. F., Z. Xuan, T. F. Babor, R. D. Brewer, F. J. Chaloupka, P. J. Gruenewald, H. Holder, M. Klitzner, J. F. Mosher, R. L. Ramirez, R. Reynolds, T. L. Toomey, V. Churchill, and T. S. Naimi. 2013. Efficacy and the strength of evidence of U.S. alcohol control policies. American Journal of Preventive Medicine 45(1):19–28.
NHTSA (National Highway Traffic Safety Administration), GHSA, and Volpe National Transportation Systems Center. 2017. Impact of the legalization and decriminalization of marijuana on the DWI system: Highlights from the expert panel meeting. Washington, DC: National Highway Traffic Safety Administration.
O’Brien, M. C., T. P. McCoy, S. D. Rhodes, A. Wagoner, and M. Wolfson. 2008. Caffeinated cocktails: Energy drink consumption, high-risk drinking, and alcohol-related consequences among college students. Academic Emergency Medicine 15(5):453–460.
O’Donnell, M. A. 1985. Research on drinking locations of alcohol-impaired drivers: Implications for prevention policies. Journal of Public Health Policy 6(4):510–525.
O’Neill, B., and S. Y. Kyrychenko. 2006. Use and misuse of motor-vehicle crash death rates in assessing highway-safety performance. Traffic Injury Prevention 7(4):307–318.
OpenSecrets.org. n.d. Beer, wine, and liquor: Industry profile: Summary, 2016. http://www.opensecrets.org/lobby/indusclient.php?id=N02&year=2016 (accessed October 2, 2017).
Pantani, D., R. Peltzer, M. Cremonte, K. Robaina, T. Babor, and I. Pinsky. 2017. The marketing potential of corporate social responsibility activities: The case of the alcohol industry in Latin America and the Caribbean. Addiction 112(Suppl 1):74–80.
Patrick, M. E., J. E. Schulenberg, M. E. Martz, J. L. Maggs, P. M. O’Malley, and L. D. Johnston. 2013. Extreme binge drinking among 12th-grade students in the United States: Prevalence and predictors. JAMA Pediatrics 167(11):1019–1025.
Perkins, H. W., M. P. Haines, and R. Rice. 2005. Misperceiving the college drinking norm and related problems: A nationwide study of exposure to prevention information, perceived norms and student alcohol misuse. Journal of Studies on Alcohol 66(4):470–478.
Piontkowski, S. R., J. S. Peabody, C. Reede, J. Velascosoltero, G. Tsatoke, T. Shelhamer, and K. R. Hicks. 2015. Reducing motor vehicle-related injuries at an Arizona Indian reservation: Ten years of application of evidence-based strategies. Global Health: Science and Practice 3(4):619–629.
Probst, C., M. Roerecke, S. Behrendt, and J. Rehm. 2014. Socioeconomic differences in alcohol-attributable mortality compared with all-cause mortality: A systematic review and meta-analysis. International Journal of Epidemiology 43(4):1314–1327.
Quinlan, K. P., R. D. Brewer, P. Siegel, D. A. Sleet, A. H. Mokdad, R. A. Shults, and N. Flowers. 2005. Alcohol-impaired driving among U.S. adults, 1993–2002. American Journal of Preventive Medicine 28(4):346–350.
Quinlan, K., R. A. Shults, and R. A. Rudd. 2014. Child passenger deaths involving alcohol-impaired drivers. Pediatrics 133(6):966–972.
Rahav, G., R. Wilsnack, K. Bloomfield, G. Gmel, and S. Kuntsche. 2006. The influence of societal level factors on men’s and women’s alcohol consumption and alcohol problems. Alcohol and Alcoholism 41(Suppl 1):i47–i55.
Rammohan, V., R. A. Hahn, R. Elder, R. Brewer, J. Fielding, T. S. Naimi, T. L. Toomey, S. K. Chattopadhyay, and C. Zometa. 2011. Effects of dram shop liability and enhanced overservice law enforcement initiatives on excessive alcohol consumption and related harms: Two community guide systematic reviews. American Journal of Preventive Medicine 41(3):334–343.
Redelmeier, D. A., and A. S. Detsky. 2017. Clinical action against drunk driving. PLoS Medicine 14(2):e1002231.
Rehm, J., D. W. Lachenmeier, E. J. Llopis, S. Imtiaz, and P. Anderson. 2016. Evidence of reducing ethanol content in beverages to reduce harmful use of alcohol. The Lancet Gastroenterology & Hepatology 1(1):78–83.
Retting, R. 2017. Pedestrian traffic fatalities by state: 2016 preliminary data. Washington, DC: Governors Highway Safety Association.
Rhoades, E., and D. H. Jernigan. 2013. Risky messages in alcohol advertising, 2003–2007: Results from content analysis. Journal of Adolescent Health 52(1):116–121.
Rickard, B. J., T. Garg, and M. Costanigro. 2013. Economic and social implications of regulating alcohol availability in grocery stores. Applied Economic Perspectives and Policy 35(4):613–633.
Roche, A., V. Kostadinov, J. Fischer, R. Nicholas, K. O’Rourke, K. Pidd, and A. Trifonoff. 2015a. Addressing inequities in alcohol consumption and related harms. Health Promotion International 30(Suppl 2):ii20–ii35.
Roche, A., V. Kostadinov, J. Fischer, and R. Nicholas. 2015b. Evidence review: The social determinants of inequities in alcohol consumption and alcohol-related health outcomes. Australian’s National Research Centre on AOD Workforce Development and Flinders University.
Romano, E., R. B. Voas, and J. C. Lacey. 2010. Alcohol and highway safety: Special report on race/ethnicity and impaired driving. Washington, DC: National Highway Traffic Safety Administration.
SAMHSA (Substance Abuse and Mental Health Services Administration). 2014. Results from the 2013 National Survey on Drug Use and Health: Summary of national findings. NSDUH series H-48, HHS publication 14-4863. Rockville, MD: Substance Abuse and Mental Health Services Administration.
SAMHSA. 2015. Behavioral health trends in the United States: Results from the 2014 National Survey on Drug Use and Health. HHS publication 15-4927, NSDUH series H-50. https://www.samhsa.gov/data/population-data-nsduh (accessed April 27, 2017).
SAMHSA. 2016. Results from the 2015 National Survey on Drug Use and Health: Detailed tables. https://www.samhsa.gov/data/sites/default/files/NSDUH-DetTabs-2015/NSDUH-DetTabs-2015/NSDUH-DetTabs-2015.htm#tab2-41b (accessed March 31, 2017).
Sanem, J. R., D. J. Erickson, P. C. Rutledge, K. M. Lenk, T. F. Nelson, R. Jones-Webb, and T. L. Toomey. 2015. Association between alcohol-impaired driving enforcement-related strategies and alcohol-impaired driving. Accident Analysis and Prevention 78:104–109.
Sauber-Schatz, E. K., D. J. Ederer, A. M. Dellinger, and G. T. Baldwin. 2016. Vital signs: Motor vehicle injury prevention—United States and 19 comparison countries. Morbidity and Mortality Weekly Report 65(26):672–677.
Scaglione, S., S. Kliethermes, G. Cao, D. Shoham, R. Durazo, A. Luke, and M. L. Volk. 2015. The epidemiology of cirrhosis in the United States: A population-based study. Journal of Clinical Gastroenterology 49(8):690–696.
Schmidt, L. A., P. Mäkelä, J. Rehm, and R. Room. 2010. Alcohol: Equity and social determinants. In Equity, social determinants and public health programs, edited by E. Blas and A. S. Kurup. Geneva, Switzerland: World Health Organization.
Schmidt, S. 2017. PowerPoint presentation to the Committee on Accelerating Progress to Reduce Alcohol-Impaired Driving Fatalities. Washington, DC, March 22, 2017. http://nationalacademies.org/hmd/~/media/Files/Activity%20Files/AcceleratingProgresstoReduceAlcoholImpairedDrivingFatalities/22%20March%202017/1%20Steve%20Schmidt.pdf (accessed August 9, 2017).
Schor, E. L. 1996. Adolescent alcohol use: social determinants and the case for early family-centered prevention. Family-focused prevention of adolescent drinking. Bulletin of the New York Academy of Medicine 73(2):335–356.
Schulenberg, J. E., L. D. Johnston, P. M. O’Malley, J. G. Bachman, R. A. Miech, and M. E. Patrick. 2017. Monitoring the future. National survey results on drug use, 1975–2016: Volume II, college students and adults ages 19–55. Ann Arbor, MI: Institute for Social Research, University of Michigan.
Sivak, M., and B. Schoettle. 2017. Recent diverging trends in the amount of urban and rural driving in the United States. Ann Arbor: University of Michigan, Sustainable Worldwide Transportation.
Smith, K., and J. Foster. 2014. Alcohol, health inequalities and the harm paradox: Why some groups face greater problems despite consuming less alcohol. London, UK: Institute of Alcohol Studies.
Strand, M. C., H. Gjerde, and J. Morland. 2016. Driving under the influence of non-alcohol drugs—An update. Part II: Experimental studies. Forensic Science Review 28(2):79–101.
Striley, C. W., and S. R. Khan. 2014. Review of the energy drink literature from 2013: Findings continue to support most risk from mixing with alcohol. Current Opinion in Psychiatry 27(4):263–268.
Subramanian, R. 2009. Geospatial analysis of rural motor vehicle traffic fatalities. Report No. DOT HS 811 196. Washington, DC: National Highway Traffic Safety Administration.
Sudhinaraset, M., C. Wigglesworth, and D. T. Takeuchi. 2016. Social and cultural contexts of alcohol use: Influences in a socio-ecological framework. Alcohol Research: Current Reviews 38(1):35–45.
TRB (Transportation Research Board). 2013. Emergency medical services response to motor vehicl crashes in rural areas. Washington, DC: The National Academies Press.
TRB. 2016. Between public and private mobility: Examining the rise of technology-enabled transportation services. Washington, DC: The National Academies Press.
TRIP (The Road Improvement Program). 2017. Rural connections: Challenges and opportunities in America’s heartland. Washington, DC: TRIP.
U.S. Census Bureau. 2010. 2010 census urban and rural classification and urban area criteria. https://www.census.gov/geo/reference/ua/urban-rural-2010.html (accessed August 11, 2017).
Utah State Legislature. 2017. H.B. 155 driving under the influence and public safety revisions. http://le.utah.gov/~2017/bills/static/HB0155.html (accessed March 30, 2017).
Vaca, F. E., E. Romano, J. C. Fell, and E. Choo. 2014. Female drivers increasingly involved in impaired driving crashes: Actions to ameliorate the risk. Academic Emergency Medicine 21(12):1485–1492.
Voas, R. B., and J. C. Lacey. 2011. Alcohol and highway safety: A review of the state of knowledge. Washington, DC: National Highway Traffic Safety Administration.
Vock, D. C. 2013. Rural states struggle to reduce road deaths. http://www.pewtrusts.org/en/research-and-analysis/blogs/stateline/2013/03/12/rural-states-struggle-to-reduce-road-deaths (accessed October 2, 2017).
Wagenaar, A. C., A. L. Tobler, and K. A. Komro. 2010. Effects of alcohol tax and price policies on morbidity and mortality: A systematic review. American Journal of Public Health 100(11):2270–2278.
Walker, S., S. Higgs, and P. Terry. 2016. Estimates of the absolute and relative strengths of diverse alcoholic drinks by young people. Substance Use & Misuse 51(13):1781–1789.
Wechsler, H., and T. F. Nelson. 2008. What we have learned from the Harvard School of Public Health College Alcohol Study: Focusing attention on college student alcohol consumption and the environmental conditions that promote it. Journal of Studies on Alcohol and Drugs 69(4):481–490.
WHO (World Health Organization). 2011. Global status report on alcohol and health. Geneva, Switzerland: World Health Organization.
WHO. 2014. Standard drink measures, in grams per unit. Data by country. http://apps.who.int/gho/data/view.main.54180 (accessed March 30, 2017).
WHO. 2015a. Global status report on road safety 2015. Geneva, Switzerland: World Health Organization.
WHO. 2015b. Report of the Second Technical Consultation on drug use and road safety. 16–17 December 2015. Mallorca, Spain: World Health Organization.
WHO. 2016. Drug use and road safety. Geneva, Switzerland: World Health Organization.
Williams, A. F., A. T. McCartt, and S. A. Ferguson. 2007. Hardcore drinking drivers and other contributors to the alcohol-impaired driving problem: Need for a comprehensive approach. Traffic Injury Prevention 8(1):1–10.
Wilsnack, R. W., N. D. Vogeltanz, S. C. Wilsnack, and T. R. Harris. 2000. Gender differences in alcohol consumption and adverse drinking consequences: Cross-cultural patterns. Addiction 95(2):251–265.
Wilsnack, R. W., S. C. Wilsnack, A. F. Kristjanson, N. D. Vogeltanz-Holm, and G. Gmel. 2009. Gender and alcohol consumption: Patterns from the multinational GENACIS project. Addiction 104(9):1487–1500.
Wilson, F. A., and J. P. Stimpson. 2010. Trends in fatalities from distracted driving in the United States, 1999–2008. American Journal of Public Health 100(11):2213–2219.
Wilson, F. A., J. P. Stimpson, and M. K. Tibbits. 2013. The role of alcohol use on recent trends in distracted driving. Accident Analysis & Prevention 60(November):189–192.
Xuan, Z., J. G. Blanchette, T. F. Nelson, T. C. Heeren, T. H. Nguyen, and T. S. Naimi. 2015a. Alcohol policies and impaired driving in the United States: Effects of driving- vs. drinking-oriented policies. International Journal of Alcohol and Drug Use 4(2):119–130.
Xuan, Z., T. H. Nguyen, N. L. Oussayef, T. S. Naimi, J. G. Blanchette, T. S. Naimi, T. F. Nelson, S. E. Hadland, and T. C. Heeren. 2015b. Youth drinking in the United States: Relationships with alcohol policies and adult drinking. Pediatrics 136(1):18–27.
Zaloshnja, E., T. R. Miller, D. Hendrie, and D. Galvin. 2007. Employer costs of alcohol-involved injuries. American Journal of Industrial Medicine 50(2):136–142.
Zaloshnja, E., T. R. Miller, and L. J. Blincoe. 2013. Costs of alcohol-involved crashes, United States, 2010. Paper read at 57th Annual Meeting of the Association for the Advancement of Automotive Medicine Conference, Quebec City, Canada.
Zhang, L., W. F. Wieczorek, and J. W. Welte. 2014. The link between early onset drinking and early onset alcohol-impaired driving in young males. American Journal of Drug and Alcohol Abuse 40(3):251–257.


