
3
E-Cigarette Devices, Uses, and Exposures
CHARACTERISTICS OF E-CIGARETTE DEVICES
Electronic cigarettes are a diverse group of products that produce a heated aerosol, typically containing nicotine, which users inhale via a mouthpiece. E-cigarettes range widely in design, appearance, and complexity, but generally contain similar components and operate in a similar manner (Brown and Cheng, 2014). Common components of e-cigarettes include a battery, heating coil, atomizer that transforms the e-liquid to an aerosol, cartridge that contains the e-liquid, and mouthpiece. Each component has the potential to affect health outcomes independently. They may also interact to create an influence different from the sum of their individual parts, posing a challenge for research in this field. The basic operation of e-cigarettes generally follows several steps and includes drawing on the e-cigarette, activation of a heating element, which aerosolizes the contained liquid, and inhalation of the liquid aerosol.
Currently, a diverse and non-standardized terminology is used to refer to e-cigarette devices, their components, and their use. Terms used differ in non-systematic ways, often simply due to user preference. This non-standard nomenclature presents a key challenge for e-cigarette product surveillance and examining patterns of use (Alexander et al., 2016). Appendix C lists some commonly used terms related to e-cigarette devices and their use, along with their definitions.
The e-liquids typically contain nicotine, flavorings, and a humectant. The health effects of nicotine are well documented, although much remains unknown about the specific health effects of nicotine when deliv-
ered as an aerosol as compared with a constituent in combusted smoke. Many of the flavoring constituents have been thoroughly evaluated for safety when included in food, but their effects when they enter the bloodstream through the lungs are less well known. Similarly, much remains unknown about the effects of inhaling aerosolized humectants such as propylene glycol (PG) and glycerol. Chapter 5 presents a comprehensive discussion on the toxicology of e-liquid constituents and other contaminants found in e-cigarette aerosols.
The battery design and type may put the device at risk for a fire or in rare cases for an explosion, and in combination with the heating coils, the battery also influences the aerosol properties (discussed in more detail in the following paragraph). The majority of e-cigarette devices are powered by a rechargeable battery (a manufacturer-supplied unit), a non-rechargeable battery, or a user-replaceable battery (rechargeable or non-rechargeable). Portable chargeable carrying cases are available for remote e-cigarette charging for some brands. Nickel-cadmium (NiCad), nickel metal-hydride (NiMh), lithium ion (Li-ion), alkaline and lithium polymer (Li-poly), and lithium manganese (LiMn) batteries may be used to power e-cigarettes (Brown and Cheng, 2014). Many e-cigarettes use lithium batteries because they can store a large amount of energy in a compact space. However, the inherent characteristics of lithium batteries can pose a risk of fire and explosion. Poor design, use of low-quality materials, manufacturing flaws and defects, and improper use and handling can all contribute to a condition known as “thermal runaway,” whereby the internal battery temperature can increase to the point of causing a battery fire or even an explosion. The use of overcharging protection circuits, thermal power cutoffs, and internal overpressure relief mechanisms can help prevent and mitigate thermal runaway.
The heating coils and atomizer influence the aerosol properties, and therefore potential health effects. When aerosolization settings are not optimal (e.g., when the heating power is too high), it creates a negative sensation called a “dry hit” in users. This unpleasant sensation may be related to the formation of thermal decomposition by-products of PG and glycerol, including toxic carbonyl compounds (Farsalinos et al., 2015b; Geiss et al., 2016). Of note, nicotine undergoes pyrolytic degradation at temperatures above 600ºC (Schmeltz et al., 1979), which no studies on e-cigarettes have reported reaching, so the potential pyrolytic degradation of nicotine is very unlikely in e-cigarettes. The amount of power applied to the atomizer also affects the mass of aerosol produced from the e-cigarette device, with more power typically creating denser aerosol per puff (Gillman et al., 2016).
The characteristics of the heating coils and atomizer can be customized by users. They may add more coils and/or lower the standard resis-
tance of the heating coils to generate more heat and create denser aerosols. In some devices it is possible for e-liquids to come into direct contact with the heating coils in a process known as “dripping,” which may introduce metals and other constituents into the aerosol that users inhale.
Classification of E-Cigarettes
For the purpose of this report, e-cigarette devices are classified as first, second, and third generation based on their product characteristics and operational features. Figure 3-1 shows typical first-, second-, and third-generation e-cigarette devices.
First-generation devices refer to e-cigarettes devices designed to mimic the smoking experience as close as possible. These products served as stand-ins for cigarettes among users who wished to quit smoking or sought out an alternative product to a cigarette. First-generation e-cigarettes are often designed to look like a combustible tobacco cigarette, but some are designed to simulate a cigar or pipe. They are also called cigalikes (cig-a-likes) or “vape sticks.” Other cigalikes are slightly longer or narrower than a combustible tobacco cigarette (so called “pen style”).
Second-generation e-cigarettes are characterized by a clearomizer—a transparent cartridge that holds e-liquid and an atomizer—and a thin battery. Second-generation devices include products that are shaped like pens, are comparatively larger and cylindrical, and are often referred to as “tank systems” in reference to the transparent reservoir that holds larger amounts of e-liquid than previous cartridge-containing models.
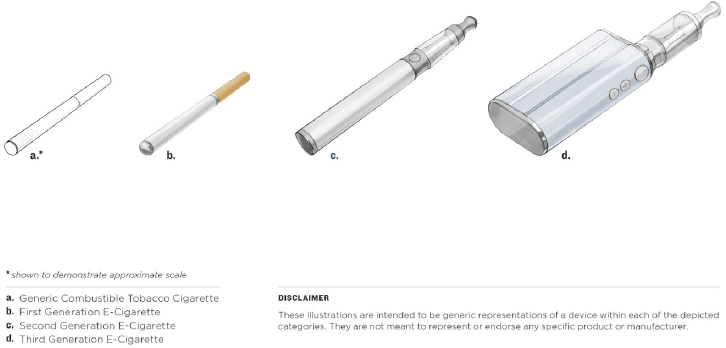
Third-generation devices represent a diverse set of products and represent the greatest departure from combustible tobacco cigarettes. Often these devices are advertised as “vaping” products and the associated marketing makes no reference to cigarettes (Zhu et al., 2014). Aesthetically they bear little resemblance to cigarettes, as many are square or rectangular and feature customizable and rebuildable atomizers and batteries. In addition, since the beginning of the availability of e-cigarettes and their component parts, users have been modifying the devices or building their own devices, which are often referred to as “mods.” The differences in design and engineering of the products are key factors in the size, distribution, and amount of aerosol particles. The variability in levels of chemicals and nicotine present in the e-liquid/aerosol determines the composition of the aerosol delivered to the user (Brown and Cheng, 2014).
E-CIGARETTE USE
The basic operation of e-cigarettes generally follows several steps. First, the user draws upon the e-cigarette. Then, a user either manually presses a switch button to activate a heating element, or draws upon the e-cigarette and an airflow sensor automatically activates it. In automatically activated devices, the airflow sensor detects pressure changes and prompts the flow of power to a heating element and (optionally) an LED. The e-liquid contained in the device saturates a wick via capillary action, which the heating element then aerosolizes. This process is commonly called “vaporization.” Aerosolized droplets of liquid subsequently flow into the user’s mouth and are inhaled into the lungs. Although e-cigarette use is commonly referred to as vaping, technically the device emits and the user inhales an aerosol, composed of a suspension of a mixture of gases, vapors, and aqueous particles, and not a vapor, which is a substance in gas phase. The exposure of a user to potentially hazardous chemicals depends on how the user inhales the aerosol, the physical characteristics of that aerosol, where the aerosol ends up in the respiratory tract, and the concentration of toxicants in the aerosol at different locations in the respiratory tract. The following sections review information about how to assess those exposures and illustrative results from the literature. The pharmacology and toxicology of those exposures is discussed in Chapters 4 and 5.
Puff Topography
For combustible tobacco cigarettes, smoking is understood to be a complex process that allows smokers to titrate their desired dose of nicotine and nicotine brain level on a puff-by-puff basis. The intake of nicotine
during smoking depends on what are referred to as topography variables, such as puff volume, the depth of inhalation, the rate of puffing, and the intensity of puffing, as well as the extent of smoke dilution with room air (Hukkanen et al., 2005). Puffing patterns influence nicotine intake and exposure to hazardous substances in tobacco smoke. Similarly, puffing behavior or topography may also be an important determinant of nicotine intake and exposure to potentially toxic substances in e-cigarette aerosol, with implications for disease risks. (An examination of the relationship between puff topography and nicotine exposure in e-cigarette users is presented in Chapter 4.). Furthermore, understanding user puff topography is also useful to inform animal, in vitro, and machine-based studies of e-cigarette aerosol exposures that are relevant to human exposures.
Fourteen studies were identified that described e-cigarette puffing topography. A summary of the studies is presented in Table 3-1, including the e-cigarette(s) used, nicotine concentration of the e-liquids consumed, study population (whether experienced e-cigarette users or e-cigarette–naïve smokers), the study conditions and vaping protocol, and averages of vaping topography variables.
The methods or instruments used to measure e-cigarette puffing topography varied across studies. Four of the studies used a modified Clinical Research Support System (CReSS Pocket, Borgwaldt Ltd., Germany) (Behar et al., 2015; Goniewicz et al., 2013; Lee et al., 2015; Norton et al., 2014). Three studies from one research group used a device developed and manufactured by collaborators at the American University of Beirut (Lopez et al., 2016; Spindle et al., 2015, 2017). Two other studies, led by the same author, used a wireless personal use monitor (wPUM) designed by researchers at Rochester Institute of Technology (Robinson et al., 2015, 2016). Other studies used video recordings (St.Helen et al., 2016a), an e-cigarette that tracks puff number and puff duration (eVic) (Dawkins et al., 2016; Farsalinos et al., 2015a), or a modified SA7 (British American Tobacco [Investments]) (Cunningham et al., 2016). Differences in instruments/methods of measurement likely introduce variability among study findings.
One question of interest is whether e-cigarette puffing topography is comparable to that of combustible tobacco cigarette use. Three studies examined this question. Norton and colleagues (2014) conducted a pilot study to examine initial reactions to e-cigarette use and puffing behaviors among combustible tobacco cigarette smokers. Puffing topography was measured on day 1 while participants smoked a combustible tobacco cigarette and about 24 hours later during ad libitum (ad lib) use of a first-generation e-cigarette. Participants had been asked to use the e-cigarette exclusively over the previous 24 hours. The study found that e-cigarette–naïve smokers (n = 18) took more puffs when smoking a combustible
TABLE 3-1 Summary of E-Cigarette Puffing Topography Studies
| Reference | Study Product | Nicotine Content | Sample Size | Study Conditions | Method |
|---|---|---|---|---|---|
| Norton et al., 2014 | Smoke 51 TRIO (1st generation) | 11 mg/ml | 18 | Lab; ad libitum (ad lib) | CReSS |
| Usual combustible tobacco cigarette | n/a | Lab; 1 cigarette | |||
| Farsalinos et al., 2015a | eVic by Joyetech (2nd generation) | 18 mg/ml | E-cigarette–naïve, combustible tobacco smokers: 23 | Lab; 10 puffs in 5 minutes followed by ad lib use in 60 minutes | eVic |
| Experienced e-cigarette users: 24 | |||||
| Lee et al., 2015 | M201 (1st generation) | 18 mg (11.0 ± 1.5 mg measured) | 20 | Lab; baseline, ad lib | CReSS |
| Lab; week 2, ad lib | |||||
| Lopez et al., 2016 | eGO 3.3-V battery with 1.5-Ω Smoktech cartomizer | 0 mg/ml 8 mg/ml 18 mg/ml 36 mg/ml |
16 | Lab; two 10-puff standardized sessions, 30-second interval, sessions were 1 hour apart | in-house device |
| Puff Count Mean (SD or SE) | Puff Duration Mean (SD or SE), seconds | Interpuff Interval Mean (SD or SE), seconds | Flow Rate Mean (SD or SE), ml/second | Puff Volume Mean (SD or SE), ml |
|---|---|---|---|---|
| 8.7 (SE = 1.6) | 3.0 (SE = 0.8) | 29.6 (SE = 11.7) | 52.0 (SE = 4.7) | 118.2 (SE = 13.3) |
| 13.2 (SE = 1.1) | 3.0 (SE = 1.0) | 21.3 (SE = 6.2) | 36.1 (SE = 1.8) | 67.5 (SE = 6.3) |
| n/a | E-cigarette–naïve, combustible tobacco smokers: 2.3 (SE = 0.2) | n/a | n/a | n/a |
| Experienced e-cigarette users: 3.5 (SE = 0.2) | ||||
| 19.3 (SE = 2.5) | 2.2 (SE = 0.1) | 19.2 (SE = 2.7) | 30.6 (SE= 2.3) | 64.0 (SE = 4.8) |
| 21.3 (SE = 2.4) | 2.9 (SE = 0.2) | 22.1 (SE = 4.9) | 24.8 (SE = 1.9) | 63.3 (SE = 5.2) |
| n/a n/a n/a n/a |
3.00 (SD = 1.38) 2.80 (SD = 1.41) 2.85 (SD = 1.49) 2.27 (SD = 0.99) |
n/a n/a n/a n/a |
30.0 (SD = 25.7) 30.9 (SD = 20.1) 27.1 (SD = 13.1) 31.8 (SD = 33.1) |
83.2 (SD = 62.6) 80.3 (SD = 53.8) 70.2 (SD = 28.8) 66.7 (SD = 55.9) |
| Reference | Study Product | Nicotine Content | Sample Size | Study Conditions | Method |
|---|---|---|---|---|---|
| Strasser et al., 2016 | Five brands: NJOY, V2, Green Smoke, blu, White Cloud | NJOY: 18 mg; V2: 18 mg; Green Smoke: 18.9–20.7 mg; blu: 20–24 mg; White Cloud: 23–24 mg | 28 | Lab; ad lib over 10 minutes (day 5) | videotape |
| Lab; ad lib over 10 minutes (day 10) | |||||
| Usual combustible tobacco cigarette | n/a | Lab; 1 cigarette (day 1) | |||
| Goniewicz et al., 2013 | Usual e-cigarette brands | n/a | 10 | Lab; ad lib | CReSS |
| Behar et al., 2015 | blu and V2 (1st generation) | blu: 16 mg/ml; V2: 18 mg/ml | 20 | Lab; ad lib use for 10 minutes | CReSS |
| Robinson et al., 2015 | blu (1st generation) | 16 mg | 22 | Naturalistic environment, ad lib, 1 day | wPUM |
| Spindle et al., 2015 | Usual battery with 1.5-Ω SmokTech cartomizer | Usual e-liquid: mean = 21.7 (SD = 3.9; range = 12–24) mg/ml | 13 | Lab; 10-puff standardized session, 30 seconds between puffs | in-house device |
| Puff Count Mean (SD or SE) | Puff Duration Mean (SD or SE), seconds | Interpuff Interval Mean (SD or SE), seconds | Flow Rate Mean (SD or SE), ml/second | Puff Volume Mean (SD or SE), ml |
|---|---|---|---|---|
| 16.1 (SD = 11.9) | 1.99 (SE = 0.7) | 11.2 (SD = 5.2) | n/a | n/a |
| 13.2 (SD = 9.4) | 2.06 (SE = 0.7) | 11.2 (SD = 5.2) | ||
| 13.6 (SD = 4.0) | 1.64 (SD = 0.3) | 25.3 (SD = 13.3) | ||
| 15 (SD = 6) | 1.8 (SD = 0.9) | 10 (SD = 13) | n/a | 70 (SD = 68) |
| 32 (SD = 8) | 2.65 (SD = 0.98) | 17.9 (SD = 7.5) | 20 (SD = 6) | 51 (SD = 21) |
| 24-hours: 225 (SD = 272); per session: 15 (SD = 25) | 3.5 (SD = 1.8) | n/a | 37 (SD = 16) | 133 (SD = 90) |
| n/a | 4.16 (SE = 1.06) | n/a | 24.17 (SE = 10.66) | 101.37 (SE = 50.01) |
| Reference | Study Product | Nicotine Content | Sample Size | Study Conditions | Method |
|---|---|---|---|---|---|
| Cunningham et al., 2016 | Vype Reload (1st generation) | 4.5% nicotine (45 mg/ml) | 32 | Lab; ad lib over self-determined length; mean = 6:54 (SD = 3:43) minutes | modifed SA7 |
| Vype ePen (2nd generation) | 3.0% nicotine (30 mg/ml) | 28 | Lab; ad lib over self-determined length; mean = 7:41 (SD = 6:17) minutes | ||
| Dawkins et al., 2016 | eVic by Joyetech (2nd generation) | 6 mg/ml | 11 | Lab; ad lib over 60 min | eVic |
| 24 mg/ml | |||||
| Robinson et al., 2016 | Usual device (1st generation) | Usual nicotine level | 20 | Naturalistic environment, ad lib, 1 day | wPUM |
| St.Helen et al., 2016a | Usual brands | Usual e-liquid: mean = 9.4 (SD = 4.1; range = 5.0–15.3) mg/ml | 13 | Lab; ad lib over 90 minutes | videotape |
| Spindle et al., 2017 | Usual battery with 1.5-Ω SmokTech cartomizer | Usual e-liquid: mean = 18.9 (SD = 5.9) mg/ml | 29 | Lab; 10-puff session (30-second interpuff interval) | in-house device |
| Lab; ad lib over 90 minutes |
NOTE: SD = standard deviation; SE = standard error.
| Puff Count Mean (SD or SE) | Puff Duration Mean (SD or SE), seconds | Interpuff Interval Mean (SD or SE), seconds | Flow Rate Mean (SD or SE), ml/second | Puff Volume Mean (SD or SE), ml |
|---|---|---|---|---|
| 21.1 (SD = 14.9) | 2.0 (SD = 0.7) | 23.2 (SD = 10.6) | Peak: 39.0 (SD = 10.3) | 52.2 (SD = 21.6) |
| 16.1 (SD = 8.0) | 2.2 (SD = 0.9) | 29.3 (SD = 19.2) | Peak: 60.6 (SD = 19.8) | 83.0 (SD = 44.3) |
| 70.73 (SD = 34.45) | 5.20 (SD = 1.39) | n/a | n/a | n/a |
| 48.36 (SD = 22.86) | 3.84 (SD = 1.02) | |||
| 78 (SD = 81) | 2.0 (0.6) | n/a | 30.4 (SD = 9.2) | 65.4 (SD = 24.8) |
| 64 (SD = 38) | 3.5 (SD = 1.4) | 118 (SD = 141) | n/a | n/a |
| 9.97 (SD = 0.12) | 4.51 (SD = 1.55) | 25.19 (SD = 1.55) | 27.78 (SD = 19.48) | 124.56 (SD = 89.13) |
| 62.55 (SD = 32.34) | 5.29 (SD = 2.08) | 102.77 (SD = 63.07) | 27.47 (SD = 22.63) | 148.52 (SD = 119.6) |
tobacco cigarette, but per-puff volume, flow rate, and peak flow rate were significantly higher with e-cigarettes; puff duration was not significantly different. The relatively short period of e-cigarette use (~24 hours) before the lab session was likely inadequate to stabilize e-cigarette puffing behavior; the findings may not be generalizable to experienced e-cigarette users. Spindle and colleagues (2015) measured puffing topography of 13 experienced second-generation e-cigarette users during a 10-puff session in which puffing characteristics such as duration were not standardized. The authors compared the findings with a previously published study on combustible tobacco cigarette smokers (Kleykamp et al., 2008). By comparison, experienced e-cigarette users took larger volumes per puff and longer puffs, but flow rate with e-cigarettes was lower. Given that these comparisons are not within subject, the findings should be treated cautiously. In another study, Strasser and colleagues (2016) measured puff topography of combustible tobacco cigarette smokers who switch to first-generation e-cigarettes. Puff topography when smoking one combustible tobacco cigarette was measured on the first day and e-cigarette puff topography was measured on days 5 and 10 during a 10-minute ad lib session. The number of puffs taken did not differ when smoking the combustible tobacco cigarette compared with using the e-cigarettes. However, puff duration increased with e-cigarette use while interpuff interval decreased. Because the study used video analysis, other variables such as puff volume and flow rate were not reported. Based on these three studies, it appears that puff duration is longer and puff volume larger with e-cigarette use compared with combustible tobacco cigarette use. The findings on flow rate were less consistent.
Another question is whether e-cigarette puffing topography of experienced users differs from that of e-cigarette–naïve users. In other words, does puffing topography change as e-cigarette–naïve users gain experience with e-cigarettes? Four of the studies enrolled e-cigarette–naïve combustible tobacco cigarette smokers, nine studies enrolled experienced e-cigarette users, and one enrolled both groups. Farsalinos and colleagues (2015a) compared the number of puffs taken and puff duration between 24 experienced e-cigarette users and 23 e-cigarette–naïve users. Participants were given a second-generation e-cigarette (eVic by Joyetech) and were asked to take 10 puffs in 5 minutes followed by 60 minutes of ad lib use. The number of puffs and puff duration were recorded by the e-cigarette (eVic by Joyetech). The study found that while the number of puffs taken during the 65-minute period did not differ between the two groups, experienced e-cigarette users took significantly longer puffs than the e-cigarette–naïve users. Two studies examined changes in puffing topography in e-cigarette–naïve combustible tobacco smokers over time. Lee and colleagues (2015) found that puff duration increased and
puff flow rate decreased significantly after e-cigarette–naïve smokers (n = 20) used a first-generation e-cigarette for one week compared with baseline (first use of the e-cigarette); these differences were sustained after 2 weeks of e-cigarette use. Strasser and colleagues (2016) reported similar average number of puffs, puff duration, and interpuff interval during a 10-minute ad lib session 5 and 10 days after switching from combustible tobacco cigarettes to e-cigarettes. Based on Table 3-1, in general, puff duration appears to be longer among experienced e-cigarette users (range of means = 1.8 to 5.29 seconds) compared with e-cigarette–naïve users (range of means = 1.64 to 3.0 seconds). Puff volume also appears to be larger with experienced e-cigarette users (range of means = 51.0 to 148.5 ml) compared with e-cigarette–naïve users (range of means = 63.0 to 118.2 ml).
A third question is whether e-cigarette device characteristics influence puffing topography. Device characteristics include the type of e-cigarette (first generation versus advanced models), voltage or power, and nicotine strength of e-liquids. In one study, Cunningham and colleagues (2016) assigned experienced e-cigarette users to either a first-generation device (Vype Reload, classic flavor bold containing 4.5 percent nicotine by volume) (n = 32) or to a button-activated, variable-voltage e-cigarette that uses prefilled cartridges containing e-liquid (Vype ePen with 3.0 percent nicotine by volume) (n = 28). Vaping topography was measured during ad lib sessions of self-determined durations during two lab visits. Participants used the same devices during each visit, but those with the variable-voltage Vype ePen alternated between a low or high voltage during each visit. No significant differences in puff topography were reported between different days of use of the first-generation e-cigarette or voltage of the advanced-model e-cigarette. However, compared with the first-generation e-cigarette (Vype Reload), average number of puffs taken was fewer, average puff volume was larger, mean interpuff interval was longer, and mean peak flow rate was higher with the advanced-model e-cigarette. These findings suggest that e-cigarette puffing topography is different among types of e-cigarettes. One likely explanation is the difference in power between types of devices, as more advanced e-cigarettes are operated at higher power (voltage) than first-generation e-cigarettes. However, this study found no differences in topography variables when the same participants switched between low and high voltage (the exact voltages were not stated), implying that, while plausible, power did not influence vaping topography in this study. Another plausible explanation for differences in puffing topography among types of devices is the nicotine concentration of the e-liquid. The first-generation had higher nicotine concentration compared with the second-generation e-cigarette.
Lopez and colleagues (2016) examined the effect of e-liquid nicotine concentration on puffing topography. Sixteen e-cigarette–naïve smokers
crossed over among second-generation e-cigarettes with 0, 8, 18, and 36 mg/ml nicotine over 4 days. Participants engaged in two 10-puff sessions in which puff parameters were not standardized. Puff volume and puff duration tended to decrease with increasing nicotine concentration, while there was no clear trend with flow rate. In a similar study, Dawkins et al. (2016) found that experienced e-cigarette users took fewer and shorter puffs at high nicotine concentration (24 mg/ml) compared with low nicotine concentration (6 mg/ml) over a 60-minute period of ad lib access to a second-generation e-cigarette. Based on these studies, it appears that nicotine concentration of the e-liquid used is a major determinant of e-cigarette puffing topography (Cunningham et al., 2016; Dawkins et al., 2016; Lopez et al., 2016).
Most of the studies (12 of 14) measured puffing topography in controlled environments, where puffing behavior may or may not represent e-cigarette use behavior in the “real world.” Two observational studies characterized puffing topography of experienced e-cigarette users of first-generation devices in their naturalistic environments. In the first study, Robinson and colleagues (2015) described puffing topography of e-cigarette users over a 24-hour period. Participants (n = 21) were given a day’s supply of blu rechargeable e-cigarettes (a first-generation device), which was used in conjunction with a wPUM (Robinson et al., 2015). Average puff duration, flow rate, and puff volume were within the range of reported values from studies of experienced e-cigarette users in controlled environments (see Table 3-1). In addition, the researchers identified what they characterized as three representative puff topographies: “many short” puffs (1.4-second puff duration); “typical” puffs (3.7-second puff duration); and “fewer long” puffs (6.9-second puff duration). The average number of puffs taken was 225 (SD = 272). Given that the study enrolled only users of first-generation e-cigarettes, the findings may not be generalizable to users of more advanced models.
Robinson and colleagues (2016) conducted a second observational study of experienced first-generation e-cigarette users in their naturalistic environment, but over a 7-day period. Participants (n = 20) used their usual e-cigarettes in conjunction with the topography device (wPUM). Average puff duration was at the lower end of the range of values observed among experienced e-cigarette users in controlled settings and also lower than the first study by Robinson and colleagues (2015). Three groups of puffs based on duration were identified: “short” puff duration (1.8 seconds), “moderate” puff duration (2 seconds), and “long” puff duration (2.5 seconds). These groups were different from the three representative topographies identified in the first study. In addition, the study found that participants engaged in an average of 6 distinct vaping sessions (activation of a wireless personal use monitor, taking puffs, and
turning the device off) per day, and took an average of 78 puffs per day. The average number of puffs taken per day was drastically lower than the average number of puffs taken per day in the first study. The lower number of puffs per day in the 7-day study compared with the 1-day study likely reflects variability in use patterns among days within subjects. In addition, it was uncertain to what extent participants complied with the study protocol by using the wPUM for every puff taken. Although studies of e-cigarette users in their naturalistic environments may offer realistic information on user behaviors, compliance with study protocol cannot be guaranteed, thus limiting the reliability of study findings.
In summary, puffing topography seems to differ between users of e-cigarettes and combustible tobacco cigarettes. E-cigarette users tend to take puffs of longer duration and larger volume. Furthermore, puffing topography changes as e-cigarette–naïve users become more experienced. Puff duration and puff volume increase with experience. Also, device characteristics such as type of device (first generation versus advanced models) and nicotine strength of e-liquids influence puffing topography. Number of puffs taken and puff duration tend to decrease as nicotine strength of the e-liquid increases. Finally, puffing topography of experienced e-cigarette users measured in their naturalistic environment was in the range of values measured in experienced users in controlled settings.
EXPOSURE TO AEROSOLS AND PARTICULATES
E-cigarette aerosol is best described as a mist, which is an aerosol formed by the condensation of spherical liquid droplets in the submicrometer to 200-µm size range. Methods for particle measurement have included spectral transmission using an electrical mobility analyzer. Pratte and colleagues (2016) used a light scattering methodology for droplet sizing of e-cigarette aerosols. Yet others have used the cascade impactors to determine the mass of various particle sizes.
Ingebrethsen and colleagues (2012) demonstrated particle size distribution of aerosols produced by electronic cigarettes in an undiluted state using a spectral transmission procedure after high dilution with an electrical mobility analyzer. They found particle diameters of average mass in the 250- to 450-nm size range with particle number concentrations of 109 particles/cm3. These measurements are comparable to those observed for combustible tobacco cigarette smoke in prior studies and also measured in the current study with the spectral transmission method and with the electrical mobility procedure. Total particulate mass for the e-cigarettes calculated from the size distribution parameters measured by spectral transmission were in good agreement with replicate determinations of total particulate mass by gravimetric filter collection. By contrast, average
particle diameters determined for e-cigarettes by the electrical mobility method were in the 50-nm range, and total particulate masses calculated based on the suggested diameters are orders of magnitude smaller than those determined gravimetrically. These small particle diameters observed are thought to arise from e-cigarette aerosol particle evaporation at the dilution levels and conditions of the electrical mobility analysis. By contrast, a smaller degree, approximately 20 percent by mass, of particle evaporation has been observed for combustible tobacco cigarette smoke.
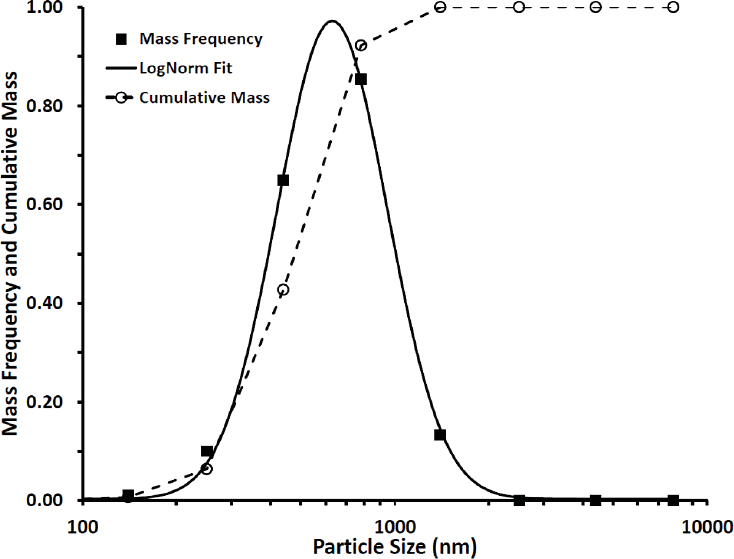
Alderman and colleagues (2014) did follow-up studies using a cascade impactor to determine particle size distribution by collecting eight puffs total (four per e-cigarette) with a 30-second interpuff interval. Three e-cigarette brands were evaluated. E-cigarette 1 and e-cigarette 2 were both rechargeable models, with cartomizer-type cartridges, while the e-cigarette 3 was a disposable model. All components were connected by conductive silicone rubber tubing to minimize particle loss during sampling. Figure 3-2 presents the representative impactor-collected data,
NOTE: The data shown here are representative of each e-cigarette brand evaluated.
SOURCE: Alderman et al., 2014.
TABLE 3-2 Particle Size Distribution Parameters Determined from Cascade Impactor Analysis
| E-Cigarette | MMAD (nm) | CMD (nm) | GSD | Puff Mass (mg/puff) |
|---|---|---|---|---|
| 1 | 631 | 319 | 1.50 | 2.16 |
| 2 | 487 | 262 | 1.52 | 3.07 |
| 3 | 534 | 261 | 1.52 | 1.95 |
NOTE: CMD = count mean diameter; GSD = geometric standard deviation; MMAD = mass mean aerodynamic diameter.
SOURCE: Alderman et al., 2014.
namely a mass frequency distribution curve and corresponding lognormal fit to the data, as well as the corresponding cumulative mass distribution. The data provided in Figure 3-2 are for e-cigarette 1 and are generally representative of each e-cigarette brand sampled. Figure 3-2 indicates that essentially all (95 percent) aerosol mass is confined to the particle size range of 280–1,420 nm. Further analysis of the particle size distribution from the cascade impactor analysis is shown in Table 3-2. Further analysis demonstrated that although the distribution of particle sizes represented by the mass median aerodynamic diameter and count mean diameter is heterogeneous, all particles are highly respirable throughout the respiratory tract.
Table 3-2 is a particle size summary for all products evaluated in the Alderman and colleagues (2014) study. The particle size distribution parameters in Table 3-2 are derived by fitting the mass frequency data to a lognormal function. In addition, the puff mass in Table 3-2 is based on the cumulative mass of particulate matter collected on the various impactor stages. Both curves from Figure 3-2 indicate that essentially all (95 percent) aerosol mass is confined to the particle size range of 280–1,420 nm, or in other words, highly respirable within the respiratory tract.
Fuoco and colleagues (2014) observed similar findings with different types of e-cigarettes, while also showing the total particle number concentration peak (using a 2-second puff), averaged across the different electronic cigarette types and liquids, at 4.4 ± 0.4 × 10⁹ particles/cm3, compared with the combustible tobacco cigarette at 3.1 ± 0.6 × 10⁹ particles/cm3. Puffing times and nicotine contents were found to influence the particle concentration, whereas no significant differences were recognized in terms of flavors and types of combustible tobacco cigarettes used. Particle number distribution modes of the e-cigarette–generated aerosol were in the 120- to 165-nm range. Marini and colleagues (2014)
further confirmed similar particle concentrations. This striking contrast in particle size between Alderman and Fuoco might suggest the generation of different particle sizes due to the wattage and temperature used to generate the e-cigarette aerosol, as well as possible differences in e-cigarette composition.
Ji and colleagues (2016) generated and characterized e-cigarette aerosols using advanced technologies. In the gas phase, the particle number concentration (PNC) of e-cigarette aerosols was found to be positively correlated with puff duration, whereas the PNC and size distribution may vary with different flavors and nicotine concentration. In the liquid phase (water or cell culture media), the size of e-cigarette aerosol particles appeared to be significantly larger than those in the gas phase, which might be due to aggregation of aerosol particles in the liquid phase.
While the particle count in e-cigarette aerosols may not be substantially different than mainstream combustible tobacco smoke, the nature of the particles is substantially different. E-cigarette aerosol particulates consist largely of aqueous droplets and vapors of humectants, either PG or glycerol, whereas particulates in combustible tobacco smoke are complex, largely organic constituents that contain polycyclic aromatic hydrocarbons and a variety of other known or suspected carcinogens. Thus, it would be incorrect to assume that the long-term health risks of the two aerosols were similar just because particle count was similar.
Particle Deposition
Deposition by e-cigarette vaping within the human respiratory tract is essential to better understand the biological dosing of gases, aerosols, and aqueous particles generated during e-cigarette use. To address particle dosing, Pichelstorfer and colleagues (2016) implemented the aerosol dynamics in containments (ADiC) model to describe the dynamic changes of both inhaled combustible tobacco cigarette smoke as well as aerosols generated by e-cigarette vaping. The model involved particles present during puffing, mouth-hold, inspiration, and expiration. The authors included consideration of coagulation, phase transition, conductive heat and diffusive/convective vapor transport, as well as dilution/mixing into a single-path representation of the stochastic lung dosimetry model IDEAL (inhalation, deposition, and exhalation of aerosols in the lungs) to compute particulate-phase deposition as well as vapor-phase deposition in the airway generations of the human lung.
The ADiC model applied to the inhalation of combustible and electronic cigarette aerosols is a means to understand those aerosol dynamics processes that influence the physical properties of the particle and vapor phases in the human respiratory tract with the following observations:
(1) reduced inhaled aerosol particle number is caused primarily by coagulation and less by deposition for both types of aerosols; (2) hygroscopic growth rates are higher for e-cigarettes than for combustible tobacco cigarettes; (3) the effect of particle growth on deposition leads to a lower total deposition in the case of combustible tobacco cigarette smoke particles and a higher total deposition in the case of e-cigarette droplets relative to their initial size distributions; and (4) most of the nicotine is deposited by the vapor phase for both aerosols (Pichelstorfer et al., 2016).
Because of the complexity of the model and the resulting extensive computational time, Pichelstorfer and colleages used a single-path version of the IDEAL airway geometry. Average airway dimensions for each airway generation were derived for the particle and vapor transport in the lungs, while average deposition fractions for each airway generation were based on the full stochastic deposition model.
Figure 3-3 illustrates the number/size distribution of inhaled particles of combustible tobacco cigarette smoke (panel A) and e-cigarette droplets (panel B) across time. These time points include after-puffing, mouth-hold, inhalation, and exhalation phases. The figure shows most particles in both aerosols are removed after the puffing and mouth-hold stages, eliminating initial size distribution disparities between the two aerosols (Pichelstorfer et al., 2016). This can largely be attributed to coagulation, which decreases particle concentration and increases particle diameter. For example, nicotine is almost eliminated in the alveolar region (as seen in that peak’s split in panel B). Evaporation of water and glycerol in smaller e-cigarette particles also occurs in the mouth during the puffing and mouth-hold periods (as shown in the peak of particles near 40 nm in panel B).
Size-selective deposition by Brownian motion in the lungs and hygroscopic growth, which becomes greater as particle size increases (Winkler-Heil et al., 2014), remove additional particles in the respiratory tract. These three processes (coagulation, size-selective deposition, and hygroscopic growth) result in particles with larger diameters by the expiration phase. Indeed, e-cigarette droplets’ higher hygroscopic growth rates make this change to larger diameters by the end stage more distinct than alterations to combustible tobacco cigarette smoke particle diameters. Furthermore, unlike combustible tobacco cigarettes, e-cigarette particles will not reach equilibrium with their surroundings because they have more volatile substances; combustible tobacco cigarettes’ tar content helps stabilize the particles. Therefore, smaller particles are removed by processes such as coagulation, resulting in a larger median particle diameter. E-cigarette aerosols’ higher growth rates increase total deposition in the lung. This deposition is powered mainly by inertia in bronchial airways and via gravity in alveolar spaces.
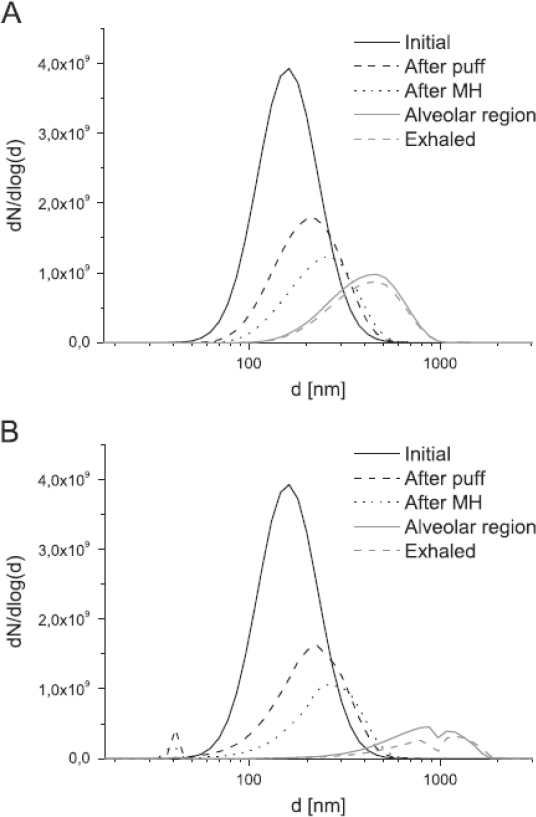
SOURCE: Pichelstorfer et al., 2016.
Finally, puff topography (Evans and Hoffman, 2014; Norton et al., 2014), on average, will not alter these results; the effects of longer puff duration with e-cigarettes on deposition fractions will be offset in general by their higher puff volume (Evans and Hoffman, 2014; Fuoco et al., 2014; Norton et al., 2014; Winkler-Heil et al., 2014).
Measurements of Constituents Found in E-Cigarettes
E-liquids generally contain four main components: nicotine, flavors, water, and carrier liquids (humectants). The carrier liquid dissolves flavors and nicotine and aerosolizes at a certain temperature on the atomizer of the e-cigarette. PG and glycerol, the principal carriers used in e-liquids, undergo partial decomposition in contact with the atomizer heating coil, forming volatile carbonyls. Some of these, such as formaldehyde, acetaldehyde, and acrolein, are of concern due to their adverse impact on human health when inhaled at sufficient concentrations. Physical, chemical, and toxicological characteristics of e-cigarette liquids and aerosols are discussed in Chapter 5.
Analytical methodology for qualitative and/or quantitative determination of a constituent in e-cigarette aerosol generally encompasses two areas of effort: sample preparation and instrumental analysis. Sample preparation involves aerosol generation, sample extraction, and sample collection. Instrumental analysis involves analyzing the sample to identify and quantify analytes of interest. The instrument is commonly selected based on the chemical characteristics of the target analyte, the applicable features of the instrument, and the instrument accessibility (Cheng, 2014).
Currently, there is no standardized method for generating and collecting aerosol from e-cigarettes for analytical purposes and laboratory studies. Factors influencing e-cigarette aerosol generation include the e-cigarette device and setup, puffing topography, machine aerosol generation parameters, and aerosol generation techniques. As described in the beginning of this chapter, the design and composition of e-cigarette devices (including e-liquid composition, device battery power, activation voltage, and coil resistance) vary considerably, and these variations influence the e-cigarette aerosol produced. Thus, it is crucial to understand each unique setup and test article prior to chemical analysis and in vitro biological exposure. Human puffing topography, described in detail above, is important in determining true levels of human exposure to constituents in e-cigarettes. Smoking machine parameters for laboratory studies are important in understanding the way that constituent yields delivered by a product can change over a range of different smoking conditions. With respect to aerosol generation techniques, current machine-based aerosol generation techniques pose several challenges for assessing different product aerosols because many smoking machines and exposure systems were originally designed for use with combustible tobacco cigarettes and do not easily translate to the standard production of e-cigarette aerosols. For example, e-cigarettes require a higher airflow rate and longer puff durations to produce aerosols than combustible tobacco cigarettes require to produce smoke. Furthermore, pressure drop (mmH2O across e-cigarettes during each puff) varies greatly, including
across cartridges used in the same models, across brands, and even within brands (Goniewicz et al., 2013, 2014; Trehy et al., 2011; Trtchounian et al., 2010; Williams and Talbot, 2011). Other important differences between e-cigarette aerosols and combustible tobacco cigarette smoke in such systems include aerosols condensing in transit tubing (possibly restricting aerosol flow and impeding syringe function) and some concerns with device button activation synchrony (either manually, or automated with a separate robot) with the syringe puffing to ensure the entire puff is activated and delivered (Goniewicz et al., 2014; Havel et al., 2016). These important methodological issues with generating e-cigarette aerosol for analytical and toxicological testing have important implications for analyzed dose and biological effects. A standardized protocol for evaluating emissions (particulate and gas phase) of e-cigarettes would facilitate interpretation of study results reported in literature.
Novel devices may help overcome the challenges of using smoking machines. For example, Herrington and Myers (2015) developed a simple sampling device to draw e-cigarette aerosol into a multisorbent thermal desorption tube, which was then thermally extracted and analyzed via gas chromatography (GC)–mass spectrometry (MS) methodology. The investigators found that this novel device was effective at providing detectable levels of numerous compounds from e-cigarette aerosol, including many not listed by the manufacturers and those not present in the e-liquid.
After producing aerosols, most studies conduct a multistep chemical analysis of emissions in e-cigarette aerosols. High performance liquid chromatography and GC-MS are analytical techniques commonly used for separation, identification, and measurement of chemicals in e-liquids. Aerosols also commonly require sample pretreatment such as extraction and/or derivatization (Geiss et al., 2015; Goniewicz et al., 2014; Ohta et al., 2011; Papousek et al., 2014; Schripp et al., 2013; Uchiyama et al., 2010). The instrument is typically selected based on the chemical characteristics of the target analyte, the applicable features of the instrument, and the instrument accessibility. For the identification of the major ingredients (PG and glycerol) and their relative concentrations, GC with flame ionization detector or with MS is usually used. For the identification and quantitative analysis of nicotine, GC with nitrogen-selective detector or with MS are typically used. Flavorings are commonly identified using GC with headspace sample delivery interface and tandem MS (GC-MS/MS) or time-of-flight mass spectrometer. Chromatography methods provide adequate sensitivity, but a main challenge includes a significant matrix effect, which results in peak suppression of analytes (Geiss et al., 2016; Herrington and Myers, 2015).
SECONDHAND EXPOSURE TO E-CIGARETTE AEROSOL
In 2006, the report of the Surgeon General on the health consequences of involuntary exposure to tobacco smoke concluded there is no risk-free level of exposure to secondhand tobacco smoke (Moritsugu, 2007). Consistently, the guidelines for the implementation of Article 8 of the World Health Organization (WHO) Framework Convention on Tobacco Control (FCTC) indicated there is no safe level of exposure to secondhand smoke, and the only effective measure to prevent exposure is the total elimination of smoking in indoor environments (WHO, 2003). Following those evidence-based conclusions, many cities and states in the United States and countries around the world have enacted comprehensive legislation banning smoking in all indoor public places. Many of those laws also include outside areas near the entrances to indoor areas. The spreading of the smoke-free movement and the banning of smoking indoors is probably one of the biggest achievements in public health in the first decade of the 21st century, protecting hundreds of millions of people from involuntary exposure to secondhand smoke around the world. Many people remain exposed, in venues that have been excluded from legislations (e.g., casinos), in states and countries that have not enacted legislation, and especially in private settings. While interventions rely mostly on educational and voluntary measures to eliminate secondhand tobacco smoke exposure in private spaces, legislation banning smoking in private places, such as in motor vehicles when children are present and in public housing, is increasing. For example, in 2016, the Department of Housing and Urban Development issued a mandate requiring housing authorities to adopt smoke-free policies, affecting 1.2 million households nationwide (PIH, 2016).
E-cigarettes were initially advertised as a form of tobacco that could circumvent existing smoke-free legislation (Paradise, 2014). Their increasing popularity brought initial confusion as to whether existing smoke-free legislation also applies to e-cigarettes (Stillman et al., 2015). Increasingly, legislation banning combustible tobacco cigarette smoking in indoor public places has been amended to expand coverage to e-cigarettes (Paradise, 2014). Many exceptions exist. For instance, vaping is allowed in e-cigarette shops and also in venues that hold vaping conventions (even if the use of e-cigarettes is banned in those venues during other events) (Jarmul et al., 2017) (see Figure 3-4). Overall, relatively few studies have investigated the characteristics and health effects of secondhand exposure to e-cigarette aerosol.
In this section, the committee reviews the evidence available on secondhand e-cigarette aerosol, its characteristics, and its possible health effects, compared with ambient air. Comparisons between secondhand
SOURCE: Chen et al., 2017.
exposure from e-cigarettes and combustible tobacco cigarettes are discussed in Chapter 18 on harm reduction.
Characteristics and Chemical Composition of Secondhand E-Cigarette Aerosol
For combustible tobacco cigarettes, secondhand smoke is defined as the combination of mainstream (exhaled by the smoker) and sidestream (emitted from the burning cigarette) smoke, with sidestream smoke representing more than 80 percent of the total amount of secondhand tobacco smoke. Secondhand aerosol from e-cigarettes is very different from secondhand combustible tobacco smoke. First, e-cigarette aerosol is composed in large part by small liquid droplets while tobacco smoke contains mostly solid and semi-solid materials, resulting in different half-lives and deposition behavior in the environment. Second, the e-cigarette aerosol is directly inhaled by the user from the battery-powered device without generation of sidestream smoke. The secondhand aerosol from the e-cigarette thus originates from the aerosol that is exhaled by the vaper and is almost 100 percent mainstream. Multiple studies have character-
ized the inhaled secondhand smoke using smoking machines or other systems to generate the e-cigarette aerosol, and described it as an aerosol formed by the condensation or atomization of spherical liquid droplets in the submicrometer to 200-µm range. Those studies are not directly relevant for understanding the characteristics and health risks of secondhand aerosol from e-cigarettes as it has not been exhaled by a vaper. In this part of the report the committee only reviews studies in which the aerosol under study has been originated by a person vaping an e-cigarette, and thus reflects the exposure to bystanders. The number of such studies is relatively small, despite its potential impact on indoor air quality and the involuntary nature of exposure. Those studies have been conducted in exposure chambers or rooms that tried to recreate a room where vaping is occurring (Czogała et al., 2014; Liu et al., 2017; Melstrom et al., 2017; Protano et al., 2017; Schober et al., 2014), in a real-life setting in the homes of e-cigarette users (Ballbè et al., 2014; Fernández et al., 2015), and during vaping conventions (Chen et al., 2017; Soule et al., 2016).
In a study conducted in an exposure chamber with five dual users who used their personal e-cigarette devices (no details provided regarding type of device) ad lib twice for 5 minutes with a 30-minute interval, mean (standard deviation [SD]) 1-hour air nicotine concentration measured using active sampling was 3.32 (2.49) µg/m3 compared with undetectable for 1-hour measure collected at baseline (p < 0.05) (Czogała et al., 2014). Real-time PM2.5 concentrations increased shortly after the beginning of vaping. The mean (SD) PM2.5 concentration was also higher following vaping (152 [86.8] µg/m3) compared with baseline (32.4 µg/m3) (p < 0.05). No differences were observed for CO (1.40 [0.55] versus 1.40 [0.55]). For volatile organic compounds (VOCs), toluene was the only one detected in the exposure chamber and the levels remained similar after vaping (3.79 [2.16] versus 4.09 [2.21]; p = 0.85) (Czogała et al., 2014). Another chamber study with four volunteers vaping e-cigarettes for 12 puffs with Smooke E-SMART device confirmed that particles increased in real time, although the concentrations were lower compared with secondhand tobacco smoke (Protano et al., 2017). In a chamber study with 37 volunteers using cigalikes and tank-style devices under controlled conditions and 4-hour ad lib use, nicotine, PG, and glycerol increased, but were several-fold below the time-weighted average limits used in workplace settings (Liu et al., 2017). The tank device produced the highest difference from baseline in the level of PG and glycerol. For nicotine, the air levels ranged from 0.38 to 2.83 µg/m3. Of the 15 carbonyls measured, only hexaldehyde and acetaldehyde were significantly higher with either cigalikes or tank-style devices, respectively. Of the 12 VOCs measured, benzene, isoprene, and toluene increased with the use of cigalikes or tank-style devices. This study did not measure particulate matter.
In a study of nine volunteers using e-cigarettes (with a refillable tank) for 2 hours in groups of three trying to recreate a real-life scenario (cafélike setting) and using different e-liquids with and without nicotine, the mean airborne concentration of PM2.5 during the vaping sessions was 197 µg/m3 versus 6 µg/m3 for the control periods (Schober et al., 2014). PM10 (mean 229 versus 47 µg/m3), particle number concentrations (61,682 versus 4,466 particles/cm3), nicotine (2.2 versus less than 0.04 µg/m3), total polycyclic aromatic hydrocarbons (PAHs) (515 versus 350 ng/m3), and aluminum (483 versus 203 ng/m3) also increased during the vaping sessions.
In real-life settings, studies in homes found small real-time increases in PM2.5 concentrations in the home of an e-cigarette user that coincided with vaping use during a 60-minute sampling, although the median concentration (9.88 µg/m3) was similar (8.32 µg/m3) to the levels found in the home of the non-vaper (Fernández et al., 2015). In another study in homes by the same research team, median air nicotine (0.11 versus 0.01 µg/m3; p = 0.007), salivary cotinine (0.24 versus 0.05 ng/ml; p = 0.003), and urinary cotinine (2.64 versus 0.72 ng/ml; p = 0.008) concentrations were higher in homes of participants who lived with somebody who vaped more than 2 hours/day versus control homes (Ballbè et al., 2014).
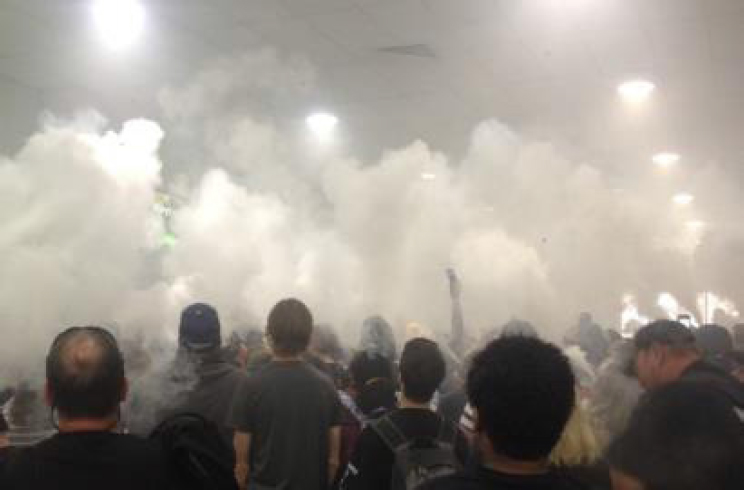
Two studies measured indoor air quality in e-cigarette convention events (Chen et al., 2017; Soule et al., 2016). Those events are often attended by tens to hundreds of e-cigarette users who often vape at the same time. In both studies levels of particulate matter (PM10 in one study, PM2.5 in the other study) were markedly elevated, reaching levels that are typical of bars and hookah venues. One of the studies measured PM2.5 the day before, during, and the day after the event (see Figure 3-5), showing that even on the day after, PM2.5 concentrations were still markedly higher compared with the day before the event (Soule et al., 2016).
In the other study in a vaping convention, in addition to real-time PM10, real-time CO2 (a marker of how many people were in the room) and total volatile organic compounds (TVOCs) were measured, as well as a 7-hour nicotine concentration (Chen et al., 2017). The estimated 24-hour time-weighted average PM10 was 1,800 µg/m3, 12 times higher than the Environmental Protection Agency 24-hour standard (150 µg/m3). Median indoor TVOC concentration was 0.13 (range = 0.04–0.3) ppm. TVOC and PM10 were highly correlated with CO2, indicating the high number of people using e-cigarettes and exposed to poor air quality. The concentrations of TVOC also increased markedly during a cloud competition (for PM10 the monitor stopped shortly after the beginning of the competition and the comparison is limited) (see Figure 3-6). The picture in Figure 3-6 shows a high moment during the cloud competition. Air nicotine concen-
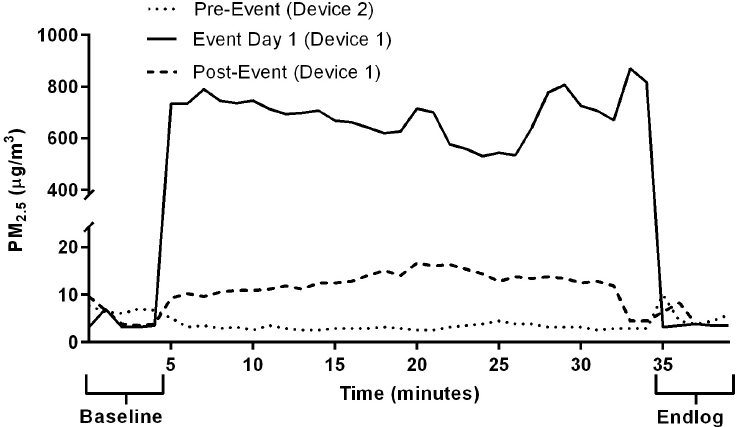
NOTE: PM2.5 = particulate matter 2.5 micrometers or less in diameter.
SOURCE: Soule et al., 2016.
tration was 125 µg/m3, similar to concentrations measured in bars and nightclubs.
The findings from these two studies indicate that e-cigarette aerosol in vaping conventions where many e-cigarette users congregate is a major source of particulate matter, air nicotine, and VOCs, impairing air quality. These exposures can also be a concern for e-cigarette vendors and other venue workers who spend many hours in those places (Chen et al., 2017).
In addition to these studies based primarily on exposure assessment and environmental sampling, two studies have developed models to evaluate the secondhand aerosol generated by e-cigarettes under different conditions (Logue et al., 2017; Rostami et al., 2016). For instance, one model assessed real-life settings, such as a residential setting where a non-user lives with a user and a bar that allows vaping indoors (Logue et al., 2017). The contribution of secondhand e-cigarette aerosols to air pollutant concentrations in the home did not exceed the California Office of Environmental Health Hazard Assessment 8-hour reference exposure levels (RELs), except when a high-emitting device was used (4.8 V). In that extreme scenario, the contributions from vaping amounted to as much as 12 µg m−3 formaldehyde and 2.6 µg m−3 acrolein. In the bar scenario, the contributions from vaping to indoor air levels were markedly higher than those in the home scenario. Formaldehyde (mean 135
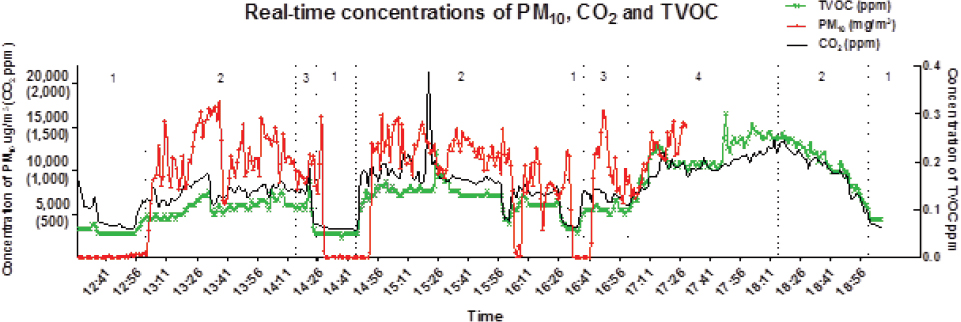
NOTES: 1 = outside the venue; 2 = inside the venue; 3 = trick competition; 4 = vaping competition. PM10 = particulate matter 10 micrometers or less in diameter; TVOC = total volatile organic compound.
SOURCE: Chen et al., 2017.
µg m−3) and acrolein (28 µg m−3) exceeded the acute 1-hour exposure REL for the highest emitting vaporizer/voltage combination. Predictions for these compounds also exceeded the 8-hour REL in several bars when less intense vaping conditions were considered. Benzene concentrations in a few bars approached the 8-hour REL, and diacetyl levels were near the lower limit for occupational exposures. These findings support the evidence that e-cigarettes can contribute to substantial air pollution, especially in places with a large number of e-cigarette users. The committee did not identify any studies evaluating health effects or early biomarkers of disease resulting from secondhand exposure to e-cigarette aerosols per se. One study conducted a health impact assessment based on computing disability-adjusted life-years (DALYs) lost due to exposure to secondhand e-cigarette aerosol (Logue et al., 2017). DALYs were estimated for residential and hospitality industry scenarios based on the recent incorporation of DALYs into health impact assessments of exposures to indoor pollutants, including tobacco smoke and particles, and estimating, on a compound-by-compound basis, the population-averaged health damage per year of exposure. The toxicants included were formaldehyde, acetaldehyde, benzene, acrolein, and glycidol. Formaldehyde, acetaldehyde, and benzene are established carcinogens and glycidol is a probable carcinogen according to the International Agency for Research on Cancer. Acrolein is not yet classified as a carcinogen but it was the dominant contributor to the aggregate harm (see Figure 3-7). DALYs for different combinations of device/voltage characteristics were lower, but in some instances comparable to those estimated for exposure to secondhand tobacco smoke.
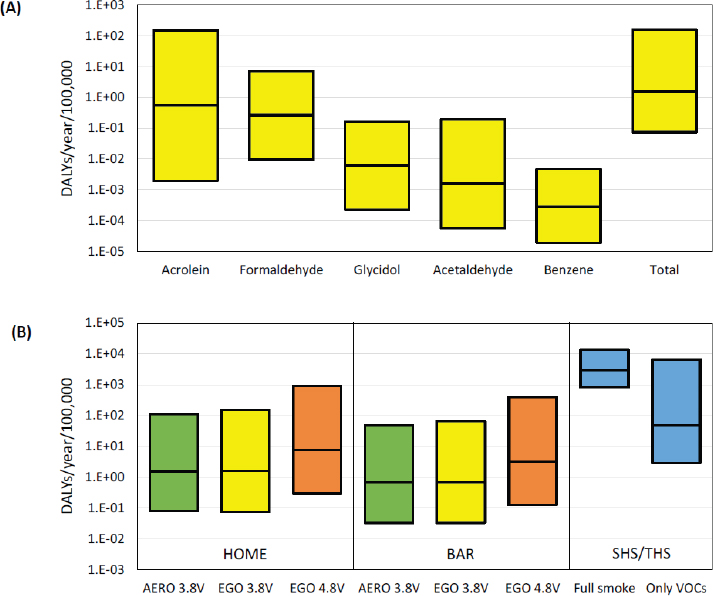
NOTES: The boxes show the median and 95th percentile range of predicted health damage. Panel A shows toxicant-specific impact estimated for the residential scenario in which the vaper consumes CT e-liquid using the EGO device at 3.8 V. Panel B shows aggregated damage for six scenarios of home and bar exposures using three device/voltage combinations. In all cases, emission rates correspond to typical vaping sessions of 25 puffs each. The figure includes the estimated damage due to second- and thirdhand smoke from combustible tobacco cigarettes as calculated in a previous study from St.Helen et al. (2016b). The DALYs are presented for full smoke and for the VOCs alone (excluding PM2.5). DALY = disability-adjusted life-year; SHS/THS = secondhand smoke/thirdhand smoke; VOC = volatile organic compound.
SOURCE: Logue et al., 2017.
Synthesis
Several studies have measured airborne concentrations of particulate matter, nicotine, and other constituents in indoor environments, either in exposure chambers, rooms trying to recreate real-life settings, or real-life
settings such as homes and conventions where vaping takes place. All studies measuring particulate matter and nicotine (for experiments with nicotine e-liquids) found statistically significant increases of those chemicals as compared with background. The levels of both particulate matter and nicotine were higher in experiments with more than one vaper, and they were extremely high in studies of vaping conventions, where levels of particulate matter and nicotine concentrations were comparable to those founds in bars and nightclubs. Among the other constituents, two studies detected airborne toluene and other VOCs in the air following vaping experiments. Total VOCs were markedly high and increased with increasing levels of vaping, during a vaping cloud competition, supporting the hypothesis that VOCs are released from the e-cigarettes into the environment during the exhalation of the e-cigarette aerosol. Overall, these exposure studies indicate that e-cigarette vaping contributes to some level of indoor air pollution, which, although lower than what has been observed from secondhand combustible tobacco cigarettes, is above the smoke-free level recommended by the Surgeon General and the WHO FCTC. As with secondhand smoke, children, pregnant women, the elderly, and patients with cardiorespiratory diseases may be at special risk. The e-cigarette convention studies also suggest that e-cigarette aerosol exposure could be substantial for workers in these venues, especially those who are exposed during multiple events. No available studies have evaluated health effects (either clinical effects or early biomarkers of disease) of secondhand e-cigarette exposure.
Conclusion 3-1. There is conclusive evidence that e-cigarette use increases airborne concentrations of particulate matter and nicotine in indoor environments compared with background levels.
This conclusion is supported by chamber experiments, real-setting experiments, and observational studies in homes and convention centers. In experiments with one single e-cigarette user, levels are markedly lower than for secondhand tobacco smoke. Levels increase markedly with the increase in the number of vapers, in particular at vaping conventions.
Conclusion 3-2. There is limited evidence that e-cigarette use increases levels of nicotine and other e-cigarette constituents on a variety of indoor surfaces compared with background levels.
REFERENCES
Alderman, S. L., C. Song, S. C. Moldoveanu, and S. K. Cole. 2014. Particle size distribution of e-cigarette aerosols and the relationship to Cambridge filter pad collection efficiency. Beitrage zur Tabakforschung International/Contributions to Tobacco Research 26(4):183–190.
Alexander, J. P., B. N. Coleman, S. E. Johnson, G. K. Tessman, C. Tworek, and D. M. Dickinson. 2016. Smoke and vapor: Exploring the terminology landscape among electronic cigarette users. Tobacco Regulatory Science 2(3):204–213.
Ballbè, M., J. M. Martínez-Sánchez, X. Sureda, M. Fu, R. Pérez-Ortuño, J. A. Pascual, E. Saltó, and E. Fernández. 2014. Cigarettes vs. e-cigarettes: Passive exposure at home measured by means of airborne marker and biomarkers. Environmental Research 135:76–80.
Behar, R. Z., M. Hua, and P. Talbot. 2015. Puffing topography and nicotine intake of electronic cigarette users. PLoS ONE 10(2):e0117222. https://doi.org/10.1371/journal.pone.0117222 (accessed February 6, 2018).
Brown, C. J., and J. M. Cheng. 2014. Electronic cigarettes: Product characterisation and design considerations. Tobacco Control 23(Supplement 2):ii4–ii10. http://tobaccocontrol.bmj.com/content/23/suppl_2/ii4 (accessed February 6, 2018).
Chen, R., A. Aherrera, C. Isicheye, P. Olmedo, S. Jarmul, J. E. Cohen, A. Navas-Acien, and A. M. Rule. 2017. Assessment of indoor air quality at an electronic cigarette (vaping) convention. Journal of Exposure Science and Environmental Epidemiologyhttps://www.nature.com/articles/s41370-017-0005-x (accessed December 29, 2017).
Cheng, T. R. 2014. Chemical evaluation of electronic cigarettes. Tobacco Control 23:11–17.
Cunningham, A., S. Slayford, C. Vas, J. Gee, S. Costigan, and K. Prasad. 2016. Development, validation and application of a device to measure e-cigarette users’ puffing topography. Scientific Reports 6:35071. https://www.nature.com/articles/srep35071 (accessed February 6, 2018).
Czogała, J., M. L. Goniewicz, B. Fidelus, W. Zielinska-Danch, M. J. Travers, and A. Sobczak. 2014. Secondhand exposure to vapors from electronic cigarettes. Nicotine & Tobacco Research 16(6):655–662.
Dawkins, L. E., C. F. Kimber, M. Doig, C. Feyerabend, and O. Corcoran. 2016. Self-titration by experienced e-cigarette users: Blood nicotine delivery and subjective effects. Psycho-pharmacology (Berl) 233(15–16):2933–2941.
Evans, S. E., and A. C. Hoffman. 2014. Electronic cigarettes: Abuse liability, topography and subjective effects. Tobacco Control 23(Supplement 2):ii23–ii29. http://dx.doi.org/10.1136/tobaccocontrol-2013-051489 (accessed February 6, 2018).
Farsalinos, K. E., A. Spyrou, C. Stefopoulos, K. Tsimopoulou, P. Kourkoveli, D. Tsiapras, S. Kyrzopoulos, K. Poulas, and V. Voudris. 2015a. Nicotine absorption from electronic cigarette use: Comparison between experienced consumers (vapers) and naïve users (smokers). Scientific Reports 5:11269. https://www.nature.com/articles/srep11269 (accessed February 6, 2018).
Farsalinos, K. E., V. Voudris, and K. Poulas. 2015b. E-cigarettes generate high levels of aldehydes only in “dry puff” conditions. Addiction 110(8):1352–1356.
Fernández, E., M. Ballbè, X. Sureda, M. Fu, E. Saltó, and J. M. Martínez-Sánchez. 2015. Particulate matter from electronic cigarettes and conventional cigarettes: A systematic review and observational study. Current Environmental Health Reports 2(4):423–429.
Fuoco, F. C., G. Buonanno, L. Stabile, and P. Vigo. 2014. Influential parameters on particle concentration and size distribution in the mainstream of e-cigarettes. Environmental Pollution 184:523–529.
Geiss, O., I. Bianchi, F. Barahona, and J. Barrero-Moreno. 2015. Characterisation of mainstream and passive vapours emitted by selected electronic cigarettes. International Journal of Hygiene and Environmental Health 218(1):169–180.
Geiss, O., I. Bianchi, and J. Barrero-Moreno. 2016. Correlation of volatile carbonyl yields emitted by e-cigarettes with the temperature of the heating coil and the perceived sensorial quality of the generated vapours. International Journal of Hygiene and Environmental Health 219(3):268–277.
Gillman, I. G., K. A. Kistler, E. W. Stewart, and A. R. Paolantonio. 2016. Effect of variable power levels on the yield of total aerosol mass and formation of aldehydes in e-cigarette aerosols. Regulatory Toxicology and Pharmacology 75:58–65.
Goniewicz, M. L., T. Kuma, M. Gawron, J. Knysak, and L. Kosmider. 2013. Nicotine levels in electronic cigarettes. Nicotine & Tobacco Research 15(1):158–166.
Goniewicz, M. L., J. Knysak, M. Gawron, L. Kosmider, A. Sobczak, J. Kurek, A. Prokopowicz, M. Jablonska-Czapla, C. Rosik-Dulewska, C. Havel, I. P. Jacob, and N. Benowitz. 2014. Levels of selected carcinogens and toxicants in vapour from electronic cigarettes. Tobacco Control 23(2):133–139.
Havel, C. M., N. L. Benowitz, P. Jacob, 3rd, and G. St.Helen. 2016. An electronic cigarette vaping machine for the characterization of aerosol delivery and composition. Nicotine & Tobacco Research 19(10):1224–1231.
Herrington, J. S., and C. Myers. 2015. Electronic cigarette solutions and resultant aerosol profiles. Journal of Chromatography A 1418:192–199.
Hukkanen, J., P. Jacob, 3rd, and N. L. Benowitz. 2005. Metabolism and disposition kinetics of nicotine. Pharmacological Reviews 57(1):79–115.
Ingebrethsen, B. J., S. K. Cole, and S. L. Alderman. 2012. Electronic cigarette aerosol particle size distribution measurements. Inhalation Toxicology 24(14):976–984.
Jarmul, S., A. Aherrera, A. M. Rule, P. Olmedo, R. Chen, and A. Navas-Acien. 2017. Lost in e-cigarette clouds: A culture on the rise. American Journal of Public Health 107(2):265–266.
Ji, E. H., B. B. Sun, T. K. Zhao, S. Shu, C. H. Chang, D. Messadi, T. Xia, Y. F. Zhu, and S. Hu. 2016. Characterization of electronic cigarette aerosol and its induction of oxidative stress response in oral keratinocytes. PLoS ONE 11(5):e0154447. https://doi.org/10.1371/journal.pone.0154447 (accessed February 6, 2018).
Kleykamp, B. A., J. M. Jennings, C. Sams, M. F. Weaver, and T. Eissenberg. 2008. The influence of transdermal nicotine on tobacco/nicotine abstinence and the effects of a concurrently administered cigarette in women and men. Experimental and Clinical Psychopharmacology 16(2):99–112.
Lee, Y. H., M. Gawron, and M. L. Goniewicz. 2015. Changes in puffing behavior among smokers who switched from tobacco to electronic cigarettes. Addictive Behaviors 48:1–4.
Liu, J., Q. Liang, M. J. Oldham, A. A. Rostami, K. A. Wagner, I. G. Gillman, P. Patel, R. Savioz, and M. Sarkar. 2017. Determination of selected chemical levels in room air and on surfaces after the use of cartridge- and tank-based e-vapor products or conventional cigarettes. International Journal of Environmental Research & Public Health 14(9):E969.
Logue, J. M., M. Sleiman, V. N. Montesinos, M. L. Russell, M. I. Litter, N. L. Benowitz, L. A. Gundel, and H. Destaillats. 2017. Emissions from electronic cigarettes: Assessing vapers’ intake of toxic compounds, secondhand exposures, and the associated health impacts. Environmental Science & Technology 51(16):9271–9279.
Lopez, A. A., M. M. Hiler, E. K. Soule, C. P. Ramoa, N. V. Karaoghlanian, T. Lipato, A. B. Breland, A. L. Shihadeh, and T. Eissenberg. 2016. Effects of electronic cigarette liquid nicotine concentration on plasma nicotine and puff topography in tobacco cigarette smokers: A preliminary report. Nicotine & Tobacco Research 18(5):720–723.
Marini, S., G. Buonanno, L. Stabile, and G. Ficco. 2014. Short-term effects of electronic and tobacco cigarettes on exhaled nitric oxide. Toxicology and Applied Pharmacology 278(1):9–15.
Melstrom, P., B. Koszowski, M. H. Thanner, E. Hoh, B. King, R. Bunnell, and T. McAfee. 2017. Measuring PM2.5, ultrafine particles, air nicotine and wipe samples following the use of electronic cigarettes. Nicotine & Tobacco Research 19(9):1055–1061.
Moritsugu, K. P. 2007. The 2006 report of the Surgeon General: The health consequences of involuntary exposure to tobacco smoke. American Journal of Preventive Medicine 32(6):542–543.
Norton, K. J., K. M. June, and R. J. O’Connor. 2014. Initial puffing behaviors and subjective responses differ between an electronic nicotine delivery system and traditional cigarettes. Tobacco Induced Diseases 12(1):17.
Ohta, K., S. Uchiyama, Y. Inaba, H. Nakagome, and N. Kunugita. 2011. Determination of carbonyl compounds generated from the electronic cigarette using coupled silica cartridges impregnated with hydroquinone and 2,4-dinitrophenylhydrazine. Bunseki Kagaku 60(10):791–797.
Papousek, R., Z. Pataj, P. Novakova, K. Lemr, and P. Bartak. 2014. Determination of acrylamide and acrolein in smoke from tobacco and e-cigarettes. Chromatographia 77(17–18): 1145–1151.
Paradise, J. 2014. Electronic cigarettes: Smoke-free laws, sale restrictions, and the public health. American Journal of Public Health 104(6):e17–e18.
Pichelstorfer, L., W. Hofmann, R. Winkler-Heil, C. U. Yurteri, and J. McAughey. 2016. Simulation of aerosol dynamics and deposition of combustible and electronic cigarette aerosols in the human respiratory tract. Journal of Aerosol Science 99:125–132.
PIH (Office of the Assistant Secretary for Public and Indian Housing). 2016. Instituting smoke-free public housing. Federal Register 81(233):87430–87444.
Pratte, P., S. Cosandey, and C. Goujon-Ginglinger. 2016. A scattering methodology for droplet sizing of e-cigarette aerosols. Inhalation Toxicology 28(12):537–545.
Protano, C., M. Manigrasso, P. Avino, and M. Vitali. 2017. Second-hand smoke generated by combustion and electronic smoking devices used in real scenarios: Ultrafine particle pollution and age-related dose assessment. Environment International 107:190–195.
Robinson, R. J., E. C. Hensel, P. N. Morabito, and K. A. Roundtree. 2015. Electronic cigarette topography in the natural environment. PLoS ONE 10(6):e0129296. https://doi.org/10.1371/journal.pone.0129296 (accessed February 6, 2018).
Robinson, R. J., E. C. Hensel, K. A. Roundtree, A. G. Difrancesco, J. M. Nonnemaker, and Y. O. Lee. 2016. Week long topography study of young adults using electronic cigarettes in their natural environment. PLoS ONE 11(10):e0164038. https://doi.org/10.1371/journal.pone.0164038 (accessed February 6, 2018).
Rostami, A. A., Y. B. Pithawalla, J. M. Liu, M. J. Oldham, K. A. Wagner, K. Frost-Pineda, and M. A. Sarkar. 2016. A well-mixed computational model for estimating room air levels of selected constituents from e-vapor product use. International Journal of Environmental Research and Public Health 13(8):E828.
Schmeltz, I., A. Wenger, D. Hoffmann, and T. C. Tso. 1979. Chemical studies on tobacco smoke. 63. On the fate of nicotine during pyrolysis and in a burning cigarette. Journal of Agricultural and Food Chemistry 27(3):602–608.
Schober, W., K. Szendrei, W. Matzen, H. Osiander-Fuchs, D. Heitmann, T. Schettgen, R. A. Jorres, and H. Fromme. 2014. Use of electronic cigarettes (e-cigarettes) impairs indoor air quality and increases FeNO levels of e-cigarette consumers. International Journal of Hygiene and Environmental Health 217(6):628–637.
Schripp, T., D. Markewitz, E. Uhde, and T. Salthammer. 2013. Does e-cigarette consumption cause passive vaping? Indoor Air 23(1):25–31.
Soule, E. K., S. F. Maloney, T. R. Spindle, A. K. Rudy, M. M. Hiler, and C. O. Cobb. 2016. Electronic cigarette use and indoor air quality in a natural setting. Tobacco Control 26(1):109.
Spindle, T. R., A. B. Breland, N. V. Karaoghlanian, A. L. Shihadeh, and T. Eissenberg. 2015. Preliminary results of an examination of electronic cigarette user puff topography: The effect of a mouthpiece-based topography measurement device on plasma nicotine and subjective effects. Nicotine & Tobacco Research 17(2):142–149.
Spindle, T. R., M. M. Hiler, A. B. Breland, N. V. Karaoghlanian, A. L. Shihadeh, and T. Eissenberg. 2017. The influence of a mouthpiece-based topography measurement device on electronic cigarette user’s plasma nicotine concentration, heart rate, and subjective effects under directed and ad libitum use conditions. Nicotine & Tobacco Research 19(4):469–476.
St.Helen, G., K. C. Ross, D. A. Dempsey, C. M. Havel, P. Jacob, 3rd, and N. L. Benowitz. 2016a. Nicotine delivery and vaping behavior during ad libitum e-cigarette access. Tobacco Regulatory Science 2(4):363–376.
St.Helen, G., C. Havel, D. Dempsey, P. Jacob, 3rd, and N. L. Benowitz. 2016b. Nicotine delivery, retention and pharmacokinetics from various electronic cigarettes. Addiction (111)3:535−544.
Stillman, F. A., A. Soong, L. Y. Zheng, and A. Navas-Acien. 2015. E-cigarette use in air transit: Self-reported data from US flight attendants. Tobacco Control 24(4):417–418.
Strasser, A. A., V. Souprountchouk, A. Kaufmann, S. Blazekovic, F. Leone, N. L. Benowitz, and R. A. Schnoll. 2016. Nicotine replacement, topography, and smoking phenotypes of e-cigarettes. Tobacco Regulatory Science 2(4):352–362.
Trehy, M. L., W. Ye, M. E. Hadwiger, T. W. Moore, J. F. Allgire, J. T. Woodruff, S. S. Ahadi, J. C. Black, and B. J. Westenberger. 2011. Analysis of electronic cigarette cartridges, refill solutions, and smoke for nicotine and nicotine related impurities. Journal of Liquid Chromatography and Related Technologies 34(14):1442–1458.
Trtchounian, A., M. Williams, and P. Talbot. 2010. Conventional and electronic cigarettes (e-cigarettes) have different smoking characteristics. Nicotine & Tobacco Research 12(9): 905–912.
Uchiyama, S., Y. Inaba, and N. Kunugita. 2010. Determination of acrolein and other carbonyls in cigarette smoke using coupled silica cartridges impregnated with hydroquinone and 2,4-dinitrophenylhydrazine. Journal of Chromatography A 1217(26):4383–4388.
WHO (World Health Organization). 2003. WHO framework convention on tobacco control. Geneva, Switzerland: World Health Organization. http://www.who.int/fctc/text_download/en (accessed February 6, 2018).
Williams, M., and P. Talbot. 2011. Variability among electronic cigarettes in the pressure drop, airflow rate, and aerosol production. Nicotine & Tobacco Research 13(12):1276–1283.
Winkler-Heil, R., G. Ferron, and W. Hofmann. 2014. Calculation of hygroscopic particle deposition in the human lung. Inhalation Toxicology 26(3):193–206.
Zhu, S. H., J. Y. Sun, E. Bonnevie, S. E. Cummins, A. Gamst, L. Yin, and M. Lee. 2014. Four hundred and sixty brands of e-cigarettes and counting: Implications for product regulation. Tobacco Control 23(Supplement 3):iii3–iii9. http://tobaccocontrol.bmj.com/content/23/suppl_3/iii3 (accessed February 6, 2018).


