


Below is the uncorrected machine-read text of this chapter, intended to provide our own search engines and external engines with highly rich, chapter-representative searchable text of each book. Because it is UNCORRECTED material, please consider the following text as a useful but insufficient proxy for the authoritative book pages.
24 The air quality analyst typically makes decisions about the appropriate level, quantity, and pre- cision of GAV data in consultation with the regulatory agency requiring the study. This chapter focuses on the techniques used to collect the GAV data. Typically, decisions about the appropriate collection techniques are made by the traffic engineer/specialist who will be responsible for the actual collection of the data. Collection techniques range from the very simple (e.g., manual traffic counts) to the highly- technical (e.g., collection of global positioning system [GPS] data, use of ultrasonic sensors). Any techniqueâor, more commonly, a combination of these techniquesâmay be used for any GAV data collection effort, regardless of which tier the project may fall under. 6.1 GAV Data CollectionâExisting Conditions Table 6-1 lists many of the options available to collect basic GAV data on existing traffic vol- umes, vehicle speeds, and vehicle types. The options are categorized as being simple, automated, or intelligent based on the need to use specialized technology (e.g., automated traffic recorders [ATRs] or an intelligent transportation system [ITS]). The table also indicates the applicability to emissions modeling of the data obtained using each technique in relation to volume, vehicle class, and speed, and notes whether the option involves temporary and/or permanent arrange- ments or installations. The text in this section addresses the data collection options in relation to specific parameters (e.g., traffic volume, vehicle mix, operating speed, and idle/dwell time) that are needed for emissions modeling. 6.1.1 Traffic Volume Regardless of the airport infrastructure for which GAV traffic volumes are desired, the sim- plest method of collecting GAV-related traffic volumes is for individuals equipped with hand-held counters and/or electronic or paper forms to record the data manually. Depending on the traffic volumes, the number of locations for which volumes are desired, or the duration of the survey, this method can be cost-effective for small or uncomplicated applications. This method can be labor intensive, however, and it can become costly as the complexity of the data collection increases. A more advanced Tier II approach to collecting traffic volume data involves technologies such as ATRs. ATRs can be permanently embedded into the roadway in strategic locations or (as is typically done with pneumatic road tubes) temporarily set for a time period and then removed at the completion of the data collection period. Higher-level traffic management systems are among those categorized as ITSs. These systems monitor traffic flow and other parameters, providing data on âreal-timeâ conditions. Other ITSs Data Collection and Development C H A P T E R 6
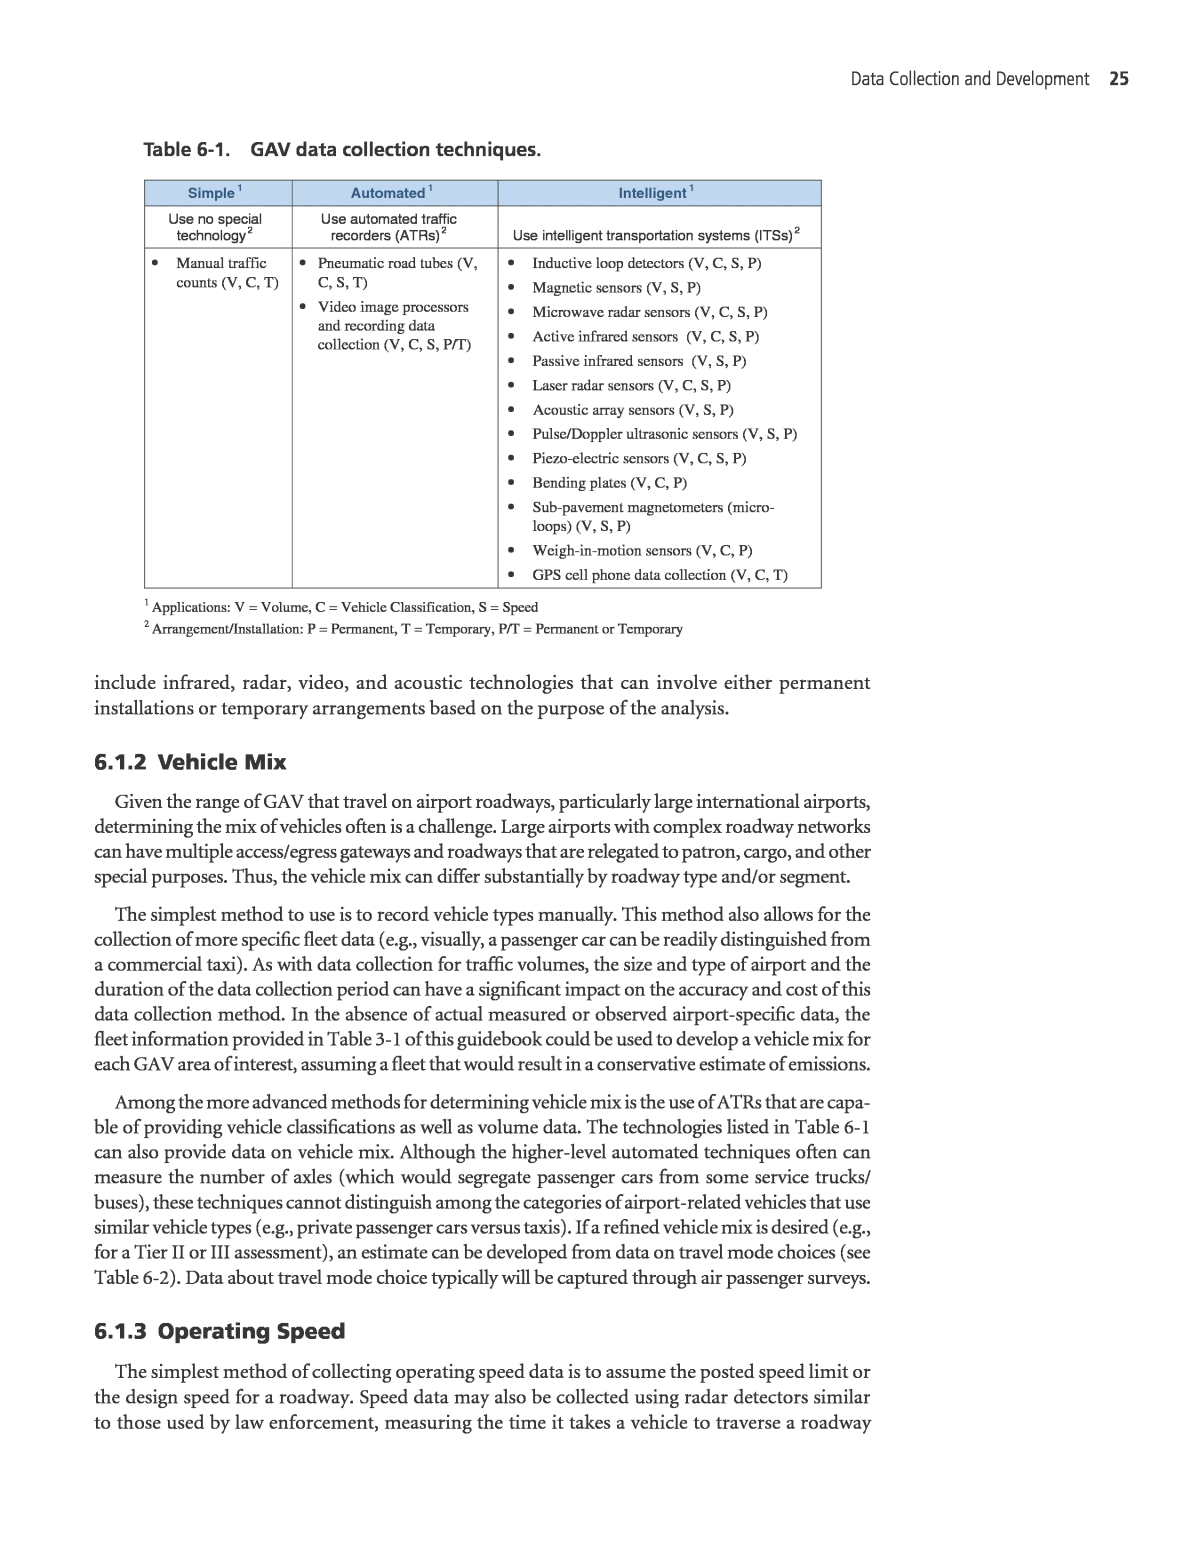
Data Collection and Development 25 include infrared, radar, video, and acoustic technologies that can involve either permanent installations or temporary arrangements based on the purpose of the analysis. 6.1.2 Vehicle Mix Given the range of GAV that travel on airport roadways, particularly large international airports, determining the mix of vehicles often is a challenge. Large airports with complex roadway networks can have multiple access/egress gateways and roadways that are relegated to patron, cargo, and other special purposes. Thus, the vehicle mix can differ substantially by roadway type and/or segment. The simplest method to use is to record vehicle types manually. This method also allows for the collection of more specific fleet data (e.g., visually, a passenger car can be readily distinguished from a commercial taxi). As with data collection for traffic volumes, the size and type of airport and the duration of the data collection period can have a significant impact on the accuracy and cost of this data collection method. In the absence of actual measured or observed airport-specific data, the fleet information provided in Table 3-1 of this guidebook could be used to develop a vehicle mix for each GAV area of interest, assuming a fleet that would result in a conservative estimate of emissions. Among the more advanced methods for determining vehicle mix is the use of ATRs that are capa- ble of providing vehicle classifications as well as volume data. The technologies listed in Table 6-1 can also provide data on vehicle mix. Although the higher-level automated techniques often can measure the number of axles (which would segregate passenger cars from some service trucks/ buses), these techniques cannot distinguish among the categories of airport-related vehicles that use similar vehicle types (e.g., private passenger cars versus taxis). If a refined vehicle mix is desired (e.g., for a Tier II or III assessment), an estimate can be developed from data on travel mode choices (see Table 6-2). Data about travel mode choice typically will be captured through air passenger surveys. 6.1.3 Operating Speed The simplest method of collecting operating speed data is to assume the posted speed limit or the design speed for a roadway. Speed data may also be collected using radar detectors similar to those used by law enforcement, measuring the time it takes a vehicle to traverse a roadway Table 6-1. GAV data collection techniques. Simple 1 Automated 1 Intelligent 1 Use no special technology 2 Use automated traffic recorders (ATRs) 2 Use intelligent transportation systems (ITSs) 2 ⢠Manual traffic counts (V, C, T) ⢠Pneumatic road tubes (V, C, S, T) ⢠Video image processors and recording data collection (V, C, S, P/T) ⢠Inductive loop detectors (V, C, S, P) ⢠Magnetic sensors (V, S, P) ⢠Microwave radar sensors (V, C, S, P) ⢠Active infrared sensors (V, C, S, P) ⢠Passive infrared sensors (V, S, P) ⢠Laser radar sensors (V, C, S, P) ⢠Acoustic array sensors (V, S, P) ⢠Pulse/Doppler ultrasonic sensors (V, S, P) ⢠Piezo-electric sensors (V, C, S, P) ⢠Bending plates (V, C, P) ⢠Sub-pavement magnetometers (micro- loops) (V, S, P) ⢠Weigh-in-motion sensors (V, C, P) ⢠GPS cell phone data collection (V, C, T) 1 Applications: V = Volume, C = Vehicle Classification, S = Speed 2 Arrangement/Installation: P = Permanent, T = Temporary, P/T = Permanent or Temporary
26 Guidebook for Quantifying Airport Ground Access Vehicle Activity for Emissions Modeling Table 6-2. Travel mode choice data collection methods and sources for traffic count programs. GAV Infrastructure Collected Data Source General Vehicles Roadway Curbside cars, vans, buses, etc. Vehicle volume and mix Curbside observations/counts Parking Facilities (Surface and Multi-Level) On-airport cars and trucks Vehicle entries and exits Transaction/gate data or driveway counts Off-airport cars, vans, buses, etc. Vehicle entries and exits Parking transaction/gate data, driveway counts, or courtesy shuttle boarding counts Rental vehicles (cars) Vehicle entries and exits Rental transaction data, driveway counts, or courtesy shuttle boarding counts Vehicle Staging/ Queuing Areas On-demand Taxis/Limousines Vehicle volume Curbside observations/counts, taxi dispatch data, or taxi pool driveway counts Door-to-door/shared ride cars and vans Vehicle volume or the number of air passengers per shuttle Curbside observations/counts, shuttle boarding counts, or reservation data Hotel/motel shuttles Vehicle volume or the number of air passengers per shuttle Curbside observations/counts, shuttle boarding counts, or shuttle schedule Parking shuttles (on and off airport) Vehicle volume or the number of air passengers per shuttle Curbside observations/counts, shuttle boarding counts Other Public transit buses and vans Vehicle volume or the number of air passengers per shuttle Curbside observations/counts, vehicle boarding counts, station gate counts, or transit schedule/frequency Charter buses Vehicle volume or the number of air passengers per bus Curbside observations/counts, bus boarding counts segment with a known length and dividing by the length, or by travel-time runs (i.e., speeds taken by a driver or passenger in a car). If more refined data are necessary or required, ATRs and Advanced Traffic Management System (ATMS) or other advanced data collection technologies can be used to measure vehicular speeds in addition to volumes and vehicle mix. 6.1.4 Idle/dwell Time Idle and dwell time, or the time a vehicle spends parked at the terminal curb, is defined as the time from when a driver parks a vehicle until the time the vehicle departs the curbside area. An analysis that uses the Tier I approachâwhich minimizes or avoids extensive field work in the GAV data collection effortâcan use the average curbside dwell times presented in ACRP Report 40: Airport Curbside and Terminal Area Roadway Operations (LeighFisher 2010) (see Table 6-3). The times presented in the table are based on measured dwell times at airports in Memphis (medium hub), Oakland (medium hub), Portland (medium hub), San Francisco (large hub), and Washington, D.C. (large hub). For a Tier II analysis, manual recordings and observations can also be made to determine average dwell time, but it should be noted that this technique can be labor intensive depending on the length of curbside and the resources available. To collect more refined idle/dwell times (e.g., for a Tier III analysis), use of advanced data collection technologies (e.g., video analytics) should be considered.
Data Collection and Development 27 6.1.5 Existing Data Collection Considerations Table 6-4 summarizes the optional approaches to collecting and/or developing data about the existing traffic volume, vehicle mix, average travel speed, and idle/dwell times of GAV operating at an airport. Any combination of these techniques may be used for GAV data collection for any emissions inventory; however, the more advanced and automated techniques will generally be appropriate for Tier II or Tier III analyses. Whether the analyst chooses a Tier I, Tier II, or Tier III approach, several factorsâincluding time of day, day of the week, and time of yearâare important considerations when collecting GAV data. These factors are: ⢠Time of day/duration. Airport vehicle activity can vary significantly by time of day. GAV emissions analysis sometimes dictates the use of the roadway peak hour, so it is important to determine when the airport roadway peak hour occurs. The roadway peak hour does not necessarily, or even typically, coincide with the airport flight schedule. An airportâs departures-level roadways are typically busiest an hour or more prior to the peak flight depar- ture time of the day. The arrivals-level roadways are typically busiest an hour or more after the peak number of arriving flights. ⢠Day of the week. Depending on the airport, activity can vary significantly by day of the week. At commercial airports, the busiest days typically are Mondays through Fridays. At a general aviation airport, the busiest day may occur on the weekend. ⢠Time of year/seasonality. Airport activity also varies depending on the time of year. When developing a count program, it is important to understand this nuance. Care should be taken when extrapolating hourly or daily counts to annual average daily or annual counts. The season during which a count is obtained may need to be considered, along with special events (e.g., air shows) that may sometimes occur at an airport. Data collected during peak seasonality will represent a conservative assessment of landside conditions. Vehicle Type Average Dwell Time (minutes) Enplane Level Deplane Level Private Vehicle 3 5.2 Taxicab 2 -- Limousine 2.5 5.2 Door-to-Door Van 3 -- Courtesy Van 4 1 Scheduled Bus 5 -- Source: ACRP Report 40 (LeighFisher 2010) Table 6-3. Curbside dwell times. Table 6-4. Data recording methods for existing conditions. Vehicle Parameter Simplest Methods Methods Using Some Automation Methods Using Highest Levels of Automation Traffic Volume Manual counts ATRs (temporary) ATMS and advanced collection technologies Vehicle Mix Manual counts Fleet (see Table 3-1) Vehicle classification ATRs Advanced collection technologies Average Speed Manual recording Posted speeds Roadway design speeds Speed ATRs ATMS and advanced collection technologies Idle/dwell Time ACRP Report 40 dwell times Manual recording/ observations Video analytics
28 Guidebook for Quantifying Airport Ground Access Vehicle Activity for Emissions Modeling ⢠Lead and lag times. Air passengers arrive via GAV prior to their scheduled departure (lead time) and depart via GAV after their scheduled arrival (lag time). Lead and lag times can vary significantly based on several factors, including passenger characteristics and airport oper- ational characteristics. For example, air passengers arriving via international flights require longer lag times because of immigration and customs processing. Lead and lag time data are typically obtained through air passenger surveys or using data from peer airports with similar air passenger and operational characteristics. ⢠Cold versus warm starts. The GAV data for parking facilities may also include the operating conditions of the parked vehicles. As a rule, cold-starting motor vehicle engines emit more emissions than warm-starting vehicles. For this reason, GAV that have been parked for sev- eral hours or days are characterized by âcoldâ engine emissions, whereas those parked for shorter periods (up to a few hours) are treated as âwarm starts.â To simulate these differing engine operating modes, MOVES provides emission factors that are representative of each condition. ⢠Other input factors. This guidebook focuses on collecting the appropriate traffic data for conducting emissions modeling of airport GAV. MOVES files obtained from state and local agencies will include other, area-specific input factors. 6.2 GAV Data DevelopmentâFuture Conditions To perform emissions modeling of future conditions at an airport, data about GAV volumes, vehicle mix, average speed, and idle/dwell time also are required. Typically, these forecasts are based on the results of the data collection effort for existing conditions (see box). Anticipated future projects (e.g., a new airport roadway, relocated parking structure, or new terminal) that would alter travel patterns and paths also have to be included in the analysis. This section of the guidebook presents methods and data collection techniques that can be used to derive data representative of predicted future conditions. Estimating Future Conditions Preparing the data necessary for computing future GAV emissions presents unique challenges. Forecasting methods necessarily involve uncertainties. Generally, how- ever, the more accurate and refined the data are for inputting critical parameters, the more accurate and reliable will be the outputs. 6.2.1 Traffic Volume Growth in GAV traffic volume on airport roadways typically results from changes in the num- bers of airline passengers, airport employees, employees of supporting concession and other air- port tenants, employees who service cargo and airmail facilities, and airport service and delivery functions. As with estimating existing conditions, the effort required to estimate future traffic volume can vary based on the purpose of the emissions calculation. For example, the develop- ment of a GHG emissions inventory for planning purposes is a relatively simple project. In this case, the analyst may choose to simply multiply the traffic volume of existing GAV in each area of an airportâs landside by a simple growth factor. On the other hand, the NEPA process may require greater effort to estimate GAV emissions for future airport activity and traffic volumes resulting from new airport projects.
Data Collection and Development 29 ACRP Report 40 (LeighFisher 2010) introduced the following four-step transportation modeling approach to estimate future airport roadway traffic volumes: ⢠Step 1. Estimate traffic volume for each on-airport land use (i.e., trip generation). ⢠Step 2. Determine trip distribution. ⢠Step 3. Analyze the travel mode choice. ⢠Step 4. Distribute the estimated traffic volumes to the airport roadways. Mode choice analysis (Step 3) requires a sophisticated travel demand forecasting model. In an airport setting, Step 3 typically is not required unless a new travel access mode (e.g., rail service to the airport) is introduced into the transportation system. Notably, the other three steps require their own set of collected data and analysis processes. The next section provides an overview of the data inputs necessary to complete Step 1, the estimation of traffic volume for each on-airport land use. 6.2.1.1 Airline Passengers This section of this guidebook presents the tiered approaches to estimating the growth in air- line passengers at an airport. Among other factors, it discusses how changes in the number of pas- sengers who begin or end their flights at an airport might affect this growth, how these changes might influence other travel choices made by passengers (e.g., using private versus shared rides), and when the peak volumes of GAV traffic would be expected compared to the peak aircraft arrival and departure times. 6.2.1.1.1 Growth in passenger numbers. Future air passenger numbers are a function of future flight schedules, aircraft size (number of seats), and anticipated percentage load factor. This information can generally be found in recent airport master plans, the FAA Terminal Area Forecast (TAF), and other sources. It is important to understand whether the projected growth is evenly dis- tributed throughout the day or if it is tied to specific time periods (i.e., during specific peak periods or at midday), as the pattern of increased numbers has a direct impact on peak-hour GAV volumes. 6.2.1.1.2 Originating and destination (O-D) passengers. O-D passengers are those whose flight itinerary begins or ends at the airport in question, as opposed to those whose flights connect within the airport. Because air passengers who arrive and connect to flights within the airport do not exit the airport terminals, changes in their numbers do not influence GAV volumes. It is important, however, to consider changes in the mix of O-D air passengers. If an airportâs antici- pated growth is largely due to its activity as an airline hub, GAV volumes may not increase at the same rate as other airport metrics. Existing originating and terminating air passenger data can be found online in the Airline Origin and Destination Survey (DB1B), available at https://www. transtats.bts.gov/DatabaseInfo.asp?DB_ID=125 (U.S.DOT n.d.). The database is based on a 10% sample of airline tickets collected by U.S. airlines. The future O-D passenger mix should be deter- mined based on airport estimates from recent master plans, traffic studies, and/or anticipated changes in airline operations. 6.2.1.1.3 Passenger characteristics. Air passenger GAV travel patterns are a direct function of several passenger characteristics, such as trip purpose (business/non-business), place of resi- dence (local resident/non-resident), and type of flight (short-haul domestic, long-haul, trans- border, overseas, or other). For example, local residents traveling for business are more likely to use private vehicles and on-airport parking than are visiting non-residents. For modeling purposes, data regarding passenger characteristics typically are obtained through air passenger surveys commissioned by the airport or by governing authorities. 6.2.1.1.4 Lead and lag times. In general, lead and lag times will stay constant from existing to future conditions unless significant changes are made to air passenger processing time (e.g., customs immigration throughput, security procedures).
30 Guidebook for Quantifying Airport Ground Access Vehicle Activity for Emissions Modeling 6.2.1.1.5 Vehicle occupancy. In addition to travel mode choice, vehicle occupancy (i.e., the number of passengers per vehicle) also factors into conversion of air passenger volumes to vehi- cle volumes. Vehicle occupancy data can be acquired through air passenger surveys or through curbside observations, particularly for multi-party vehicles. Vehicle occupancy data also can be obtained from peer airports; however, caution must be observed when applying this data to other airports. Table 6-5 provides typical vehicle occupancy rates at airports. 6.2.1.1.6 Traffic circulation patterns. GAV activity often is not as simple as an arrival or departure of a vehicle. Vehicles might take many different travel paths, depending on the travel mode choice and the configuration of the roadway network. Some passenger trips may include use of several travel modes. For example, passengers who arrive at a transit station at the airport may also use an airport circulator shuttle on trips of varying length to access specific terminals. Airport passengers who are traveling in a group also may choose to drive together to the airport, drop off one or more other passengers at an airport curbside check-in prior to parking their vehicles, and then have the driver(s) rejoin their travel party. It is important for the analyst to understand the nuances of their airportâs transportation system and GAV behavior and adjust their analyses accordingly. Data regarding circulation patterns may be captured in air passen- ger surveys or using existing precedents. In general, future vehicle circulation patterns can be assumed to follow existing patterns unless significant changes are made to the airportâs road- way network. Table 6-6 provides the typical vehicle circulation patterns of originating airline passengers. 6.2.1.1.7 Summaryâpassengers. Based on the discussion in this section, the various options for methods to estimate future passenger-related GAV activity can be generally matched to the tiered approaches as shown in Table 6-7. 6.2.1.2 Visitors Airport passengers are sometimes accompanied by non-traveling members of the public prior to their departing flight and/or greeted upon their arrival (i.e., âmeetersâ and âgreetersâ). The number of these airport visitors typically is a function of the passengersâ trip purpose and des- tination, with higher numbers of airport visitors associated with international and leisure air Mode Typical Vehicle Occupancy Curbside 1.2 3.1 gnikrap mret-trohS Long-term parking 1.3 3.1 gnikrap tropria-ffO Rental car 1.4 5.1 bacixaT Limousine 1.5 0.4 elttuhs rood-ot-rooD Hotel/motel courtesy vehicle 2.6 0.5 tisnart cilbuP Charter/other bus 15.0 Source: ACRP Report 40 (LeighFisher 2010) Table 6-5. Typical vehicle occupancy at airports.
Data Collection and Development 31 Travel Mode Circulation Pattern Percentage Private Vehicle(s) Drop off at curb, then exit 31 Drop off at curb, then park â Hourly, remain 9 Drop off at curb, then park â Hourly, then exit 4 Drop off at curb, then park â Daily parking 7 Drop off at curb, then park â Economy parking 4 Direct to park â Hourly, remain for duration 4 Direct to park â Hourly, exit immediately 14 41yliaDâkrapottceriD Direct to park â Economy 9 4noitacoltropria-ffoottceriD Total 100 Rental Cars Direct to rental car return 73 Drop off at curb, then rental car return 23 Direct to off-airport location 4 001latoT 38tixeneht,ffoporDsbacixaT Drop off, then hold area 17 001latoT Source: LeighFisher (July 2009), based on data gathered at Los Angeles International, Salt Lake City International, Tampa International, and other airports Table 6-6. Typical vehicle circulation patternsâoriginating passengers. Table 6-7. Tier methodsâfuture passenger-related GAV activity. Factor Tier I (Basic) Tier II (Intermediate) Tier III (Advanced) Future Air Passenger Growth Use FAA TAF, airport master plan or documented regional or economic growth forecast Analysis based on airport-specific future flight schedule, aircraft size, and load factor Shifts in O-D Air Passengers Use existing FAA airport O-D data and assume no shift in O-D mix Estimates from recent master plans and/or analysis based on airport-specific future flight schedules and airline hub activity Passenger Characteristics Air passenger survey Lead and Lag Times Air passenger survey or data from peer airports Travel Mode Choices Air passenger survey or comprehensive count program Vehicle Occupancy Data from peer airports Curbside observations Air passenger survey Traffic Circulation Patterns Data from peer airports Air passenger survey Origin-destination license plate survey or microsimulation
32 Guidebook for Quantifying Airport Ground Access Vehicle Activity for Emissions Modeling passenger trips. Based on the airportâs operations and facilities (e.g., the availability and cost of short-term parking or availability of a cell phone lot), visitors will have unique on-airport trip pat- terns. Data on visitor-generated traffic can be obtained through air passenger surveys or through a combination of curbside observations and short-term parking transaction data. 6.2.1.3 Employees GAV employee-generated traffic characteristics are largely a function of the number of employees, their travel mode choice, the on-airport driving patterns, and work schedules. A partial list of on-airport employers with staff includes: ⢠Airport operator and third-party contractors such as janitorial, parking operators, and bus operators; ⢠Airlines, including flight crews, maintenance staff, and terminal employees; ⢠Concessionaires and other airport tenants such as rental car companies, food service com- panies, and retail establishments; ⢠Government agencies, including TSA, FAA, U.S. Customs and Border Protection (CBP) and DHS, and the U.S. Postal Service; ⢠Air cargo shippers; ⢠Fixed-base operators (FBOs); and ⢠Construction contractors. The data needed to calculate traffic volumes generated by employees working at airports includes: ⢠Employee population, ⢠Employee travel mode choices, ⢠Employee circulation patterns, and ⢠Employee work schedules. Given the varying staff and work hours, establishing a representative GAV count is sometimes difficult. For example, non-standard work hours could affect the traditional âpeakâ hour or âpeak dayâ volumes. Further, many of the airport employees are not directly managed by the airport operator, which adds to the challenges of collecting these data. ACRP Report 40 provides estimated average daily number of employees for large and medium hub airports and reveals a wide range in each employee category (LeighFisher 2010). Employee surveys based on travel mode choices, work schedules, and travel patterns are among the most common methods for collecting these data. Alternatively, employee GAV data can be estimated based on entry and exit counts at employee parking areas. Non-Passenger GAV Trips Quantifying motor vehicle trips associated with airport employees, delivery vehicles, and non-aviation activities is possible, but may not warrant extensive efforts given their comparatively small contribution to airport-wide emissions. 6.2.1.4 Air Cargo GAV trips generated by air cargo (including airmail) include vehicles transporting the cargo, cargo facility employeesâ private vehicles, and cargo customersâ vehicles. According to ACRP
Data Collection and Development 33 Report 40, the volume of GAV trips generated by air cargo should be estimated separately from that generated by airport employees (LeighFisher 2010). Also, trip generation rates for air cargo are unique to individual airports. The two most available dependent variables related to air cargo (cargo tonnage and air cargo facility size) typically are not reliable indicators for GAV activity. For Tier I air quality assessments, if cargo-related GAV should be considered in the assessment, the trips can be assumed to be included in the background traffic at the airport. For Tier II or Tier III assessments, trip generation rates can be calculated using the arrival or departure of cargo tonnage over a defined time period or periods. 6.2.1.5 Service and Delivery Vehicles Service and delivery vehicles include those vehicles providing goods and materials to/from the terminal building loading docks, transporting individuals performing maintenance and con- struction, vehicles being used by emergency response (police, fire, emergency medical service), and other vehicles making trips not directly generated by airport passengers, employees, or air cargo (LeighFisher 2010). Often, data on these vehicles are not readily available. Moreover, the data collected at selected airports are not easily transferrable to other airports. Additional research on this GAV category is necessary if these vehicles are to be specifically identified in the emissions assessment. Otherwise, they should be assumed to be included in an airportâs background traffic. 6.2.1.6 Other Airport Land Uses Other airport land uses may generate GAV trips and contribute to the GAV volumes on airport roadways. In general, GAV trips related to such other uses are difficult to quantify and, given their relatively low numbers compared to total airport volumes, they should be considered as background traffic. For a particular assessment, if other airport-related land uses are estimated to be significant, standard trip generation rates can be used to estimate vehicular volumes. 6.2.1.7 Non-Airport Vehicles Using Airport Roadways Some on-airport roadways may be used by vehicles that do not originate on or travel to the airport, and that are not otherwise associated with the airport. These vehiclesâ âcut-throughâ trips can affect airport GAV activity levels. Determining the volume (or proportion) of cut-through trips on airport roadways requires information on such vehiclesâ entry and exit points as well as the shared roadway segments. License plate surveys (tracking the entry and exit point of a vehicle by capturing its license plate information) or data from tolling tags can be used to determine the proportion of non-airport vehicles. The analyst also should be aware of any major roadway infrastructure or land use changes within the region that may shift travel patterns and increase or decrease cut-through trips along on-airport roadways. If available, a regional travel demand model can be used to determine the proportion of non-airport vehicles traveling on a roadway link and the implications of future transportation infrastructure or land use changes on cut-through trips on airport roadways. 6.2.1.8 SummaryâFuture Traffic Volumes This section has presented approaches to developing future-year GAV for airport visitors, employees, vehicles related to air cargo, and service and delivery vehicles (i.e., non-passenger traffic volumes). Considerations for other airport land uses and non-airport vehicles that use air- port roadways were introduced. From this discussion, it is possible to generally align the estima- tion techniques discussed with the tier-levels identified for emission inventory studies, as shown in Table 6-8.
34 Guidebook for Quantifying Airport Ground Access Vehicle Activity for Emissions Modeling 6.2.2 Distributing Future Roadway Traffic Step 2 for estimating future-year GAV is determining the volume distribution from the airport entry and exit point(s) and on the airportâs roadways. Some airports have a single entry and exit gateway while other airports have several. In some cases the entry and exit point is a single intersection; in others, it is as complex as a regional highway interchange. In all cases, the analysts should determine which roadways are within the scope of the air emissions assessment and, if it is possible, develop cordons that isolate airport traffic from non-airport traffic. Existing distributions of airport trips may be used to project the distribution of future GAV volumes. This approach is applicable for Tier I and II assessments. Some caution should be taken, however, as regional land uses and transportation infrastructures may change over time, shifting the overall trip distribution at the entry and exit point(s). For a Tier III analysis, a regional travel demand model can be used to determine the trip dis- tribution at the airportâs entry and exit points. Regional travel demand models typically reflect changes in regional land use and transportation infrastructure, particularly over longer time horizons. Mode choice analysisâStep 3 of the four-step approachârequires a sophisticated travel demand forecasting model and is typically not required in an airport setting unless a new travel access mode to the airport is introduced into the transportation system. In Step 4, future volumes on airport roadways are assigned. At this point, the traffic engineer should already have determined (1) the overall increase in GAV volume, by user and mode if applicable; (2) the locations where these new GAV trips will enter and/or exit the airport; and (3) the origin and destination points within the airport. To assign volumes to on-airport roadways, GAV travel paths are first defined. Typically, GAV travel paths are chosen based on circulation patterns and on paths that reflect the shortest Factor Tier I (Basic) Tier II (Intermediate) Tier III (Advanced) Visitors Data from peer airports Air passenger survey Origin-destination license plate survey or microsimulation Employees Assume as part of background volumes Development of employee trip generation rates based on entry and exit counts at employee parking areas (if no additional modal options exist) and total number of employees Development of employee trip generation rates based on data from employee transportation survey and total number of employees Air Cargo Assume as part of background traffic Development of air cargo trip generation rates based on entry and exit counts at air cargo area(s) and total tonnage of cargo over time Other Airport Land Use Assume as part of background traffic Use of ITE trip generation rates (if applicable for land use type) Non-Airport Vehicles Using Airport Roadways Assume proportion of vehicle volume cut-through traffic License plate survey or regional travel demand model Table 6-8. Tier methodsâfuture non-passenger-related traffic volumes.
Data Collection and Development 35 travel times. Unlike city streets, internal airport roadways limit the number of path options, which simplifies this analysis. Private vehicle GAV will typically follow wayfinding signs that guide them through the airport to major airport destinations. Service vehicles, taxis, and other GAV operated by drivers familiar with the airport roadways typically find and follow the quick- est paths. Changes in traffic volumes, particularly increases, can affect airport roadway congestion and also affect travel time. A microscopic transportation model (e.g., VISSIM or Transmodeler) can account for changes in travel time and balance the volumes assigned to multiple travel paths. However, GAV operators will typically not deviate to different routes unless they are guided to do so or are familiar with the roadway network. Finally, some vehicular volumes may need to be reassigned if the airport road network changes or if significant changes occur in on-airport land use. 6.2.3 Vehicle Mix, Operating Speed, and Idle/Dwell Time Determination of the future airport-related GAV fleet mix largely depends on the purpose and time horizon of the analysis. For example, if the analysis involves a short-term time horizon, the analyst can generally assume a vehicle mix similar to existing conditions. If the time horizon is several years or more, however, a number of important questions should be considered: ⢠What are the macroscopic changes to the transportation system? ⢠What are the anticipated changes to travel options? ⢠What airport policies affect or address these changes? ⢠What fuel and technology will be employed? Future-year vehicle speeds also should be considered. Such speeds often are functions of road- way geometry, vehicular volumes, driver behavior, and future technology. Increases in vehicular volume may further constrain congested roadway conditions, decreasing vehicular speeds. The analyst can choose to assume that vehicle speeds remain constant over time or conduct simula- tion analyses that take into account these variables. A variety of factors could affect the length of time during which vehicles idle/dwell at airport terminal curbsides (i.e., departure/arrival curbs and other airport vehicle staging areas). For Tier I assessments, this data can be assumed to be included as a component of the GAV vehicles operating near the terminal area. For Tier II, an idle/dwell time based on existing conditions may be used, with adjustments, if necessary. For Tier III, obtaining specific terminal area traffic data is the most desirable approach. The Tier I, Tier II, and Tier III assumptions and methods for future vehicle mix, operating speed, and idle/dwell time are summarized in Table 6-9. Table 6-9. Tier methodsâfuture vehicle mix, operating speed, and idle/dwell time. Factor Tier I (Basic) Tier II (Intermediate) Tier III (Advanced) Future Vehicle Mix Same as for existing condition Special considerations Average Speed Same as for existing condition Microsimulation analysis Idle/Dwell Time Same as for existing condition
36 Guidebook for Quantifying Airport Ground Access Vehicle Activity for Emissions Modeling 6.2.4 Regional (Off-Airport) GAV Data When preparing an airport air quality assessment, the most common convention is to include only the GAV that operate within the airportâs property line because doing so is consistent with two common tenets of airport emissions modeling: ⢠SIP surface transportation emissions. All motor vehicles operating on the regional roadway network (i.e., off-airport property) are understood to be accounted for in this category of emission sources. If they are included in an allocation for an airport, the emissions would be âdouble-counted.â ⢠âForeseeable and practicably controllable.â This phrase from the federal CAA General Conformity Rule applies to emissions sources over which the sponsoring agency (i.e., FAA or the airport authority) has jurisdiction. In the case of airport GAV, it is often successfully argued that when the GAV are off the airport property, the agency has little to no control over their movements or operating conditions. Occasions and reasons exist for preparing emissions associated with GAV that occur outside the airportâs boundaries. For example, if a proposed project is forecast to increase the number of commercial aircraft operations at an airport, an estimate would be computed of the emissions attributable to the increase in passengers traveling to and from the airport. Emissions that occur outside an airportâs boundary are a function of travel distances, speeds, and roadway conditions. Commonly represented as vehicle-miles traveled (VMT), the associated data can be assumed or derived using a variety of methods, although none of the methods are considered to be âstandardâ or airport-specific. For illustrative purposes, Figure 6-1 demonstrates the âgravityâ model, an often-used approach to estimating off-airport GAV VMT. The example assumes an airport (in this example, a non- hub airport) surrounded by three municipalities of varying sizes (i.e., varying populations). The towns also are located at varying distances from the airport. The population and distance from the airport to each town are presented in Table 6-10. Using these data, a weighted VMT (per vehicle) is calculated as follows: Weighted travel distance = Distance to Town A percentage of total area population + Distance to Town B percentage of total area population Distance to Town C percentage of total area population . ( ) ( ) ( ) à à + à Figure 6-1. Example, off-site GAV trip distances (gravity model).
Data Collection and Development 37 The gravity model method may be appropriate if the analyst is developing a regional (off- airport) GAV forecast for an uncomplicated project emission inventory (e.g., Tier I). When the analyst is performing a Tier II or Tier III air quality assessment, the estimation of regional airport GAV traffic requires that a large amount of data be obtained and analyzed (typically through air passenger surveys). This data is then used in a mathematical spreadsheet model to develop a âmod- erateâ estimate of regional GAV data (Tier II) or fed into a regional travel demand model (Tier III). The survey data needed to estimate regional airport GAV traffic data include: ⢠Travel mode share, ⢠Mode share vehicle occupancy rate, ⢠Regional origin (e.g., zip code), and ⢠Distance from regional origin to airport. The air quality analyst or traffic engineer will also need to assume or develop GAV fleet mixes and travel speeds. For a Tier I analysis, the national default MOVES/EMFAC fleets can be used. For a Tier II analysis, a coarse assessment can be prepared using data from air passenger sur- veys. Finally, if a Tier III analysis is necessary, a regional travel demand model should be used to develop the required data. Town Distance from Airport (miles) Population Percentage of Total Area Population Weighted Distance (in miles) to/from Airport (one-way) A 4.5 27.78 1.25 B 10.0 16.67 1.67 C 8.5 55.56 4.72 Total 100.00 7.64 20,000 40,000 12,000 72,000-- Table 6-10. Regional (off-airport) GAV travel distance (gravity model method).
