
2
Background on the Surveys
The mission of the National Center for Science and Engineering Statistics (NCSES) includes providing data on the science and engineering workforce, which NCSES defines as individuals educated or employed in a science and engineering field. Over the years, the science and engineering workforce surveys have provided valuable data to stakeholders, such as policy makers, the Office of Management and Budget, the Office of Science and Technology Policy, the National Science Board, other federal agencies, researchers, industry, the media, and the public. Based on online downloads of the National Science Board’s Science and Engineering Indicators (SEI) report, data provided on the science and engineering workforce represent the most widely accessed statistics from the report, suggesting that these data are some of NCSES’s most useful products (National Research Council, 2014).
THE NCSES HUMAN RESOURCES STATISTICS PROGRAM
The NCSES Human Resources Statistics Program provides data that help policy makers and researchers understand the continuum from precollege education through undergraduate enrollment, undergraduate degrees, graduate enrollment, graduate degrees, and the workforce. Several governmental agencies and organizations, including the National Center for Education Statistics (NCES) in the U.S. Department of Education (ED), and the U.S. Census Bureau, provide data on the different stages along this continuum. NCSES plays a major role in providing education data based on two censuses: (1) the Survey of Graduate Students and Postdoctorates
in Science and Engineering (GSS), which provides annual data on current graduate enrollment in science, engineering, and selected health fields; and (2) the Survey of Earned Doctorates (SED), which provides annual data on research doctoral degrees received. NCSES provides workforce data based on the National Survey of College Graduates (NSCG), the Survey of Doctorate Recipients (SDR), and the Early Career Doctorates Survey (ECDS).
For each stage on the continuum from precollege education to participation in the workforce, the key information NCSES considers important to understand includes (Rivers, 2016) the following:
- How many people are at that stage?
- What are their demographic characteristics?
- What are the short-term and long-term trends at that stage?
- How does performance at one stage relate to performance at subsequent stages?
NCSES EDUCATION SURVEYS
GSS
Description
The GSS is an annual census survey of all academic institutions in the United States that award research-based master’s degrees or doctorates in science, engineering, and selected health fields. The GSS has been conducted since 1972, and is sponsored by the National Science Foundation (NSF), the National Institutes of Health (NIH), and in some years the U.S. Department of Energy.
Through institutional coordinators, the GSS collects aggregate data on graduate students and postdoctoral appointees, as well as other doctorate-holding nonfaculty researchers, by demographic and other characteristics. These data enable the assessment of shifts in graduate enrollment and postdoctoral appointments and trends in financial support.
The GSS is completed at the level of organizational units (e.g., academic departments, degree-granting programs, university-affiliated research centers, and health care facilities), and as noted, the respondents are typically institutional coordinators. As of the most recent survey for which data are available (2015), there were 15,202 organizational units of interest at 711 academic institutions. The data collection is conducted in two stages: (1) verification of GSS-eligible units at the institution and (2) reporting of the data.
Institutional coordinators are initially contacted by e-mail and then followed up by telephone and FedEx letter. The overwhelming majority
of institutional coordinators respond using a Web questionnaire (89.0%), but there is also an option to upload the data in a batch format (9.8%) or submit an Excel file (1.1%). The response rate for the 2015 GSS was 99.5 percent as a result of NCSES’s extensive efforts to cultivate relationships with the institutions and the institutions’ interest and willingness to be included in the study (see Chapter 5 for further discussion of the data collection methods). Box 2-1 shows the data collected as part of the GSS (see https://www.nsf.gov/statistics/srvygradpostdoc [January 2018] for the survey instrument).
NCSES has made several enhancements to the GSS over the past few years. In 2010, it expanded the postdoc section of the survey to collect detailed information on postdocs and doctorate-holding nonfaculty researchers (see Box 2-1). It also began requesting that a respondent knowledgeable about postdoc data be designated to complete the survey on behalf of the institution. In 2013, it added a checkbox to confirm that reported data excluded practitioner-oriented graduate degrees. In 2014, the survey frame was updated to add units from 151 newly eligible institutions and exclude 2 private for-profit institutions because they were offering primarily practitioner-based graduate degrees.
Some of the strengths of the GSS are that it provides long-term trend data on graduate student and postdoc counts in science, engineering, and selected health fields by citizenship, ethnicity, race, and sex. The survey also provides data on primary source of financial support for graduate students and postdocs by sex and field and on mechanism of financial support by field. The institution-level data can be used for peer institution comparisons. One of the limitations of the GSS is that it is becoming increasingly more difficult to distinguish research and practitioner-oriented degrees with the current data collection approach. Historically, another limitation was that the survey did not provide separate counts for master’s or doctorate students because the data were available only at the aggregate level. However, NCSES plans to address this limitation with the 2017 survey cycle, when separate enrollment counts will be collected for master’s and doctoral students.
Uses of the GSS Data
The GSS is the only national survey that provides data on graduate enrollment at the detailed field-of-study level by such institutional characteristics as highest degree granted, geographic location, public or private institution, medical schools, historically black colleges and universities, and land-grant institutions. Available information includes foreign enrollment, minority enrollment, field-specific enrollment, and so on.
One of the main uses of GSS data is to understand trends in the future stock of personnel trained in science, engineering, and selected health fields. The data are also used to analyze participation in selected fields by specific groups of individuals (such as minorities) or by types of institutions and to track student support patterns. GSS data are consulted to determine department eligibility for NSF programs targeted at special populations or types of programs and are used to assess the effects of NSF initiatives.
Data from the GSS are used by NSF to update the SEI and Women, Minorities, and Persons with Disabilities in Science and Engineering (WMPD) reports and are provided to Congress and the Executive Branch for a variety of uses. Data are also provided to NCES, which produces the Digest of Education Statistics. Tabulations are often prepared for NIH for use in program evaluation and to inform NIH budgets.
GSS data are also used by the academic institutions providing the data. NSF prepares the Academic Institutional Profiles by combining data from different sources, including the GSS, and addresses additional data requests from individual institutions and academic organizations. Academic institutions use the data to assess how they compare with other institutions (for example, in terms of federal support of their students or ability to reach special populations) and for planning purposes. Data from the GSS are
also used in developing the Carnegie Classification of Institutions of Higher Education, a framework for classifying U.S. academic institutions for educational and research purposes.
Professional societies, such as the Association of American Universities, the Council of Graduate Schools, the American Society for Engineering Education, and the National Postdoctoral Association, use GSS data to track trends in graduate enrollment by fields of study. GSS data are also used by researchers from academia and other sectors to understand trends in graduate training.
NCSES has several ongoing activities aimed at increasing the usefulness of GSS data, including various outreach efforts to stakeholders. The agency held a data user workshop with federal and nonfederal stakeholders to better understand current uses of the data and increase the survey’s usefulness. The agency also conducted an institutional coordinator survey to determine how data are maintained and accessed at different institutions and to assess institutions’ potential ability to report master’s and doctoral student data in more detail, such as separately by Classification of Instructional Programs codes. In addition, NCSES conducted a pilot survey during the 2016 survey cycle to determine the feasibility of collecting data separately for master’s and doctoral students and postdoc data by file upload.
SED
Description
The SED is an annual census survey of all new recipients of research doctorates from research doctorate–granting institutions in the United States in a given academic year. A research doctorate is defined as a doctorate that requires an original contribution of knowledge to the field (typically in the form of a dissertation) and is not intended primarily for the practice of a profession (for example, as an M.D. or J.D. would be). Doctorate recipients in all fields are included, not just those in science and engineering.
The SED has been conducted since academic year 1958 and is sponsored by NSF, NIH, ED, the U.S. Department of Agriculture (USDA), the National Endowment for the Humanities (NEH), and the National Aeronautics and Space Administration (NASA). Data from the survey provide an assessment of characteristics of the doctoral population and of trends in doctoral education and degrees.
In 2015, the universe for the SED included 432 academic institutions and approximately 55,000 doctorates. Institutional coordinators facilitate the distribution of information about the survey around the time of degree completion, and NCSES’s data collection contractor follows up with non-respondents using e-mail, letters, postcards, and telephone calls (for a more
detailed discussion of the data collection methods, see Chapter 5). Most questionnaires are completed by Web (93.0%), but mail (5.4%) and telephone (1.6%) modes are also available. The overall response rate is around 90 percent.
Box 2-2 shows the data collected as part of the SED. The full questionnaire can be viewed at https://www.nsf.gov/statistics/srvydoctorates/ [January 2018] and a crosswalk of the survey questions is included in Appendix B.
NCSES has made several changes to the SED over the years to increase the survey’s efficiency and usefulness. Between 2010 and 2015, reliance on the Web as a primary mode for the survey increased substantially. In 2011, disability-related questions were replaced with questions about functional limitations. In 2014, the means of collecting salary data in the Web survey mode was changed to an approach that splits the item over two screens, resulting in a nearly 30 percent increase in reporting of exact salaries instead of salary ranges. In the same year, new items were added to enhance education timeline analyses. In 2015, additional improvements were made to the Web survey with the addition of a field-of-study search function and optimization for mobile devices.
Among the strengths of the SED are that it provides reliable counts of research doctorates earned in the United States by demographic and degree characteristics. The survey also provides information on postgraduation plans for employment, including lack of firm plans (reported by 38% of respondents in the 2015 SED). Data are available for research doctorates as far back as 1920. The survey also serves as a sampling frame for the SDR.
Although the SED manages to obtain very high response rates, maintaining these response rates is increasingly difficult for both institutions and individuals. Among other challenges mentioned by NCSES is researchers’ growing interest in linking SED data to administrative records maintained by the institutions, which raises confidentiality concerns. Researchers are also interested in access to a public dataset and online analysis tools.
Uses of the SED Data
The SED is the only source of national data on the education and career plans of research doctorate recipients from U.S. academic institutions. This data collection complements the GSS, which collects data on the training of graduate degree recipients. Federal agencies use the data for program evaluation and planning purposes. The White House Office of Science and Technology Policy and the Congress also use the data to inform policy discussions and the development of legislation on such topics as doctorates awarded to temporary visa holders and student debt levels. The six federal agencies that sponsor the survey—NSF, NIH, ED, USDA, NEH, and NASA—are particularly heavy users of the data.
NSF uses the SED data in a series of internal and external reports, including the SEI and WMPD reports. Several NSF programs focused on women, minorities, and persons with disabilities, as well as fellowship programs, use the data for evaluation and planning purposes. In addition, SED data have informed the work of NSF’s Directorate for Education and Human Resources and of an interagency committee on foreign access to U.S. science and engineering at American academic institutions. As part of its participation in the international Careers of Doctorate Holders project, NCSES has also provided SED data to the OECD. The SED data serve an important role as well as the sampling frame for the SDR.
NIH has used SED data to monitor the volume of doctorate recipients in the biomedical, behavioral, and clinical sciences. This information feeds into the agency’s efforts to evaluate and plan its research training programs and grants.
ED, particularly NCES, uses SED data in its annual Digest of Education Statistics and for occasional other reports. SED data are also used to evaluate several ED programs, including those of the Office of Federal Student Aid and Office of Planning, Evaluation, and Policy Development.
USDA uses SED data to monitor trends in fields of particular interest to the agency. The data are also used for evaluation and planning purposes for several Land Grant and Tribal College programs. In addition, USDA publishes tables based in part on SED data on the Food and Agricultural Education Information System Website.
NEH and NASA use SED data to monitor trends in the number and characteristics of doctorate recipients in the fields that are most relevant to these agencies’ missions.
SED data are also used for evaluation and planning purposes by the academic institutions that provide the data. Detailed data are provided to graduate school deans on the characteristics of their degree recipients, along with comparisons with national data and data for peer institutions. Institutions use the data to analyze such questions as minority enrollment or the time it takes to obtain a degree.
Finally, SED data are used by researchers from other sectors, including academic researchers.
NCSES WORKFORCE SURVEYS
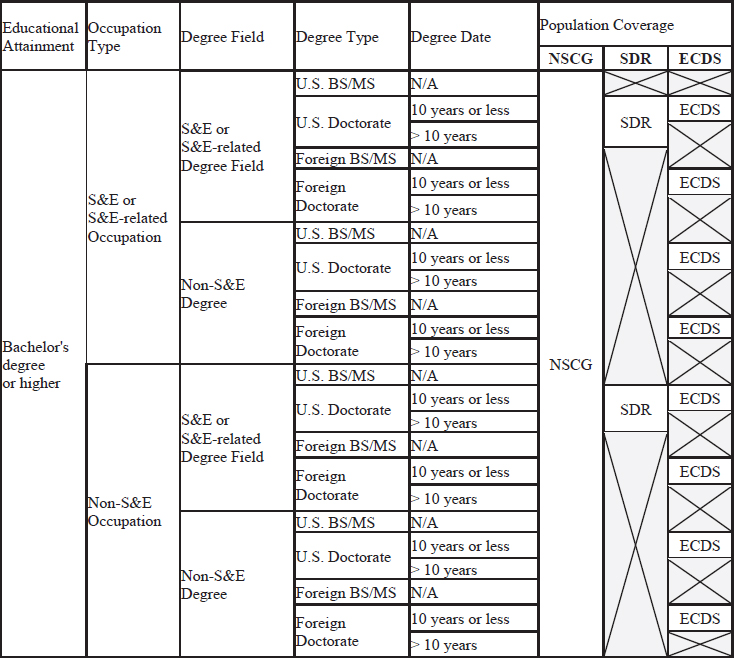
Figure 2-1 shows the population coverage for the three main NCSES surveys that are focused primarily on the workforce. The NSCG is the most comprehensive in terms of population coverage, including individuals with degrees in both science and engineering fields, as well as other fields, and regardless of type of terminal degree or when and where the degree was awarded. The SDR focuses on individuals with research doctoral degrees in science, engineering, or selected health fields obtained from academic institutions in the United States. The ECDS sample includes individuals with doctoral degrees from abroad and individuals with a degree in a nonscience and engineering field, but unlike the SDR, focuses on recent graduates only.
NSCG
Description
The NSCG has been conducted approximately biennially since 1972. The sample includes individuals with a bachelor’s degree or higher who are under the age of 76 and reside in the United States in a noninstitutionalized setting, regardless of whether the person obtained a degree in the United States or abroad. The survey provides data on college graduates but has a particular focus on those in the science and engineering workforce.
The current NSCG uses a rotating panel sample design. Each new sample is selected from the American Community Survey (ACS), a large
SOURCE: Finamore (2016).
ongoing survey that is conducted by the U.S. Census Bureau and uses monthly samples to produce estimates for small areas, such as census tracts and block groups. The ACS includes questions on degree level, bachelor’s degree field of study, occupation, and demographic characteristics, enabling NCSES to select a sample for the NSCG without having to conduct a separate costly screening of households. Sample members are interviewed every 2–3 years for four cycles before rotating off the panel. For the 2015 data collection, the overall sample size was approximately 135,000, including old and new cases, and the response rate was 70 percent.
NCSES uses several modes of contact to communicate with NSCG sample members, including letter, postcard, e-mail, and telephone; sample members can respond by Web (77%), mail (15%), and telephone (8%). The data collection process is discussed in further detail in Chapter 5.
Box 2-3 shows the NSCG data collected. The full questionnaire can be viewed at https://www.nsf.gov/statistics/srvygrads [January 2018].
In addition to its core items, the survey occasionally also includes special modules. Modules over the course of the years have included the following:
- Professional certifications: 2015
- Community college enrollment: 2013, 2015
- Education debt (amount borrowed/owed): 2013, 2015
- Job satisfaction and attributes: 2003, 2010, 2013, 2015
- Federal support of work: 2003, 2010, 2013, 2015
- Immigration information: 2003, 2010, 2013, 2015
- Organization of work: 2006
- International collaboration: 2006
- Academic positions: 2003
- Productivity measures (publications, patenting): 2003
Since the 2010 implementation of the rotating panel design, recent changes to the NSCG have included the implementation of a young graduates
oversample in 2013, designed to replace the discontinued National Survey of Recent College Graduates (NSRCG)1 as a source of information on recent graduates. In the same year, adaptive design was implemented, and emphasis on the Web as the preferred mode of response was increased to improve the efficiency of the data collection.
In addition to reliable estimation of the science and engineering workforce by demographic, occupation, and degree characteristics, the strengths of the NSCG include estimation of foreign-earned degree holders and the ability to measure the inflow of new graduates into the science and engineering workforce. In addition, the data enable researchers to compare estimates of the science and engineering population with estimates of other groups. In terms of challenges, despite the survey’s relatively high response rates, the NSCG is struggling with increasing nonresponse, as is the case with other surveys. The data available from the NSCG also are not as detailed as some researchers would like—for example, in the areas of geography, race and ethnicity, and occupation. In addition, the survey’s dependence on the ACS for its sampling frame represents a unique challenge because that survey is overseen by another statistical agency, the U.S. Census Bureau, and faces complex challenges of its own.
Uses of the NSCG Data
The NSCG is the most comprehensive source of national data on college graduate scientists and engineers in the U.S. workforce. The data are used by policy makers; federal, state, and local government agencies; industry; professional organizations; educational institutions; researchers; and others. Frequently examined questions include the impact of foreign-born and foreign-educated scientists and engineers in the U.S. workforce, characteristics of the transition from higher education to the workforce, issues related to diversity, and the implications of an aging cohort of scientists and engineers. NSF regularly produces reports examining workforce issues using the NSCG data. The National Science Board uses NSCG data in the SEI reports, and has also used the data in occasional additional reports focused on national workforce policies. NCSES uses NSCG data in the WMPD reports.
Another regular federal use of the NSCG data is a biennial congressionally mandated report by the Committee for Equal Opportunities
___________________
1 The NSRCG was a survey conducted by NCSES between 1973 and 2010. The survey sampled individuals who received a bachelor’s or master’s degree in a science, engineering, or health field from a U.S. academic institution in the 2 or 3 academic years prior to each biennial data collection. The NSRCG provided data on the education and employment characteristics of recent college graduates, and it also served as a primary source of recent college graduates for the NSCG sample. For a more detailed discussion of the NSRCG, see Chapter 4.
in Science and Engineering (CEOSE) highlighting areas of concern related to equal opportunities for participation in science, technology, engineering, and mathematics (STEM) fields. In the past, the Executive Office of the President also has used NSCG data to understand the contribution of immigrants in science and engineering occupations.
Finally, the NSCG is used by nonprofit education organizations and associations. For example, the Council of Graduate Schools (CGS) uses NSCG data to estimate the return on investment for obtaining an advanced degree. In collaboration with the Educational Testing Service, CGS also has used NSCG data to examine national benchmarks for career outcomes of graduate degree recipients by field. The data are used by academic researchers as well.
SDR
Description
The SDR is a longitudinal survey conducted biennially since 1973. It provides demographic and career history information about individuals with a U.S. research doctoral degree in a science, engineering, or selected health field who are under the age of 76 and in a noninstitutionalized setting. Beginning with the 2015 survey cycle, those surveyed included U.S.trained research doctoral degree recipients living abroad.
The SDR uses the SED as the sampling frame and provides cross-sectional trend data on the employment and occupation of degree recipients since their degree was awarded. The data used in the design of the stratified sample include race/ethnicity, sex, age, disability status, degree field, postgraduation plans for staying in or leaving the United States, year of degree, citizenship status, and place of birth. The sample design is a fixed panel, with each survey cycle consisting of the prior round’s sample along with a new cohort of the most recent graduates. The sample size in 2015 was approximately 120,000 cases.
Most sample members are contacted to participate in the SDR for the first time approximately 2–3 years after receiving their doctoral degrees, based primarily on contact information obtained at graduation. For this reason, and because this survey does not benefit from the assistance of institutional coordinators as does the SED (sample members are contacted directly by NCSES’s data collection contractor), the response rate is much lower than that of the SED. Respondents can participate by Web (82%), mail (10%), and telephone (8%); the overall response rate for the most recent survey was 63 percent.
Box 2-4 shows the data collected as part of the SDR. The full questionnaire can be viewed at https://www.nsf.gov/statistics/srvydoctoratework [January 2018].
In addition to the core questions, the SDR has included modules on the following special topics over the years:
- Job satisfaction and attributes: 2001, 2003, 2010, 2013, 2015
- Federal support of work: 2003, 2010, 2013, 2015
- Immigration information: 2003, 2010, 2013, 2015
- Organization of work: 2006
- International collaboration: 2006
- Productivity measures (publications, patenting): 1995, 2001, 2003, 2008
- Postdoctoral experiences: 1995, 2006
A number of enhancements have been made to the SDR in recent years. First, like the NSCG, the SDR recently implemented adaptive design strategies to increase the efficiency of the data collection, reduce nonresponse bias, and maximize the representativeness of several key domains.
In addition, the SDR sample has undergone several redesigns over the years. Most notably, in 2015 the sample was substantially increased from 40,000 to 120,000. The expansion included a cohort of doctorate recipients with degrees awarded since 1961, a cohort of new doctorate recipients with degrees awarded in 2012 and 2013, and a subsample of the 2013 SDR panel. The purpose of the expansion was to improve estimation of employment outcomes at the fine field-of-degree level (at the level of distinct subfields, as opposed to only broad fields) and improve the existing aggregated degree-level estimates for domains defined by various demographic characteristics. The increased sample size is expected to improve researchers’ ability to conduct analyses of small populations, including by gender, ethnicity, and race.
Another strength of the redesigned SDR is that it can track international mobility by following up with sample members who have moved abroad (the international follow-up was piloted in the 2003, 2006, and 2008 survey cycles and referred to as the International Survey of Doctorate Recipients). However, the survey still does not allow reliable estimation across all 215 fine fields by demographic characteristics because of small sample sizes in some fields. Increasing nonresponse also is a challenge for the SDR, especially within the expansion cohort. Another challenge for the survey is locating respondents who have been in the sample for a long time, especially those who have moved abroad, and the proportion of sample members living abroad has been increasing. The recent sample redesign introduced an additional locating challenge because a new cohort of doctorate recipients with degrees awarded since 1961 was added to the sample for the first time in 2015. For these sample members, the only contact information available was that current at the time the degree was awarded. These factors contributed to a predictable drop in the SDR response rate, from 76 percent in 2013 to 63 percent in 2015 (by comparison, the response rate for the NSCG declined from 74 percent in 2013 to 70 percent in 2015). The issue with the SDR will be slightly ameliorated as new graduates are added to the sample in each cycle, and NCSES is working with its data collection contractor to refine the locating procedures.
Uses of the SDR Data
The SDR provides the most comprehensive data on scientists and engineers with research doctoral degrees from U.S. institutions. The data are used by policy makers; federal, state, and local government agencies; industry; professional organizations; educational institutions; researchers; and others. Issues examined using SDR data include the impact of foreign-born U.S.-trained scientists and engineers in the U.S. workforce, the role of postdocs in careers, characteristics of the transition from higher education
to the workforce, issues related to diversity, and the implications of an aging cohort of scientists and engineers.
NSF produces a variety of reports using the SDR data. As is the case with the data from other NCSES workforce surveys, the National Science Board is one of the regular users of the SDR for its SEI and companion reports. NCSES also uses SDR data in the WMPD reports. In addition, the NSF Education and Human Resources Directorate frequently uses SDR data for the development and evaluation of programs. Aside from NSF, NIH, USDA, NASA, the Department of Energy, and the Department of Commerce use SDR data for a variety of planning purposes. And CEOSE uses SDR data in its biennial congressionally mandated report on equal opportunities for participation in STEM fields.
NCSES also has provided SDR data to OECD. In addition, the data are used by academic researchers examining questions related to the U.S. workforce.
ECDS
Description
The ECDS is a new cross-sectional NCSES survey designed to provide estimates of the work-related experiences of early career doctorates who earned their first doctorate or doctorate-equivalent degree within the past 10 years and are working at an academic institution (as defined in the GSS), at a federally funded research and development center (FFRDC), or in the NIH Intramural Research Program (NIH IRP). A pilot of this survey was conducted in 2014–2015, and the first full-scale data collection has begun. Although the sampling frame is limited in terms of coverage, at least at this stage in the survey’s development, the ECDS is intended to fill an important gap in understanding of the circumstances and characteristics of early career doctorates.
The ECDS uses a two-stage sample design, which includes a stratified probability sample of institutions followed by a stratified probability sample of individuals. The pilot study included a sample of 176 institutions and 6,872 individuals. The next round of the survey is expected to include 350 institutions and 22,855 individuals.
Almost all of the pilot study interviews (99.5%) were conducted by Web and the remainder by telephone. The overall response rate was 56 percent, with 84 percent in the first stage, and 66 percent in the second stage.
Box 2-5 shows the topics covered in the ECDS. The full questionnaire can be viewed at https://www.nsf.gov/statistics/srvyecd/ [January 2018]. The ECDS is the first survey to provide national estimates of the early career doctorate population working at GSS academic institutions, FFRDCs, and
the NIH IRP. The survey determines common definitions for the different types of early career doctorates that can be applied across and within sectors. Other strengths of the survey are that it allows for comparisons between estimates of scientists and engineers and estimates of other groups, as well as for comparisons between U.S. and non-U.S. doctoral degree holders. As with other surveys, nonresponse is a challenge, and the pilot study experienced particular difficulty with obtaining buy-in from institutions. Other challenges include the difficulty of obtaining a comprehensive sampling frame for employment sectors beyond the GSS academic institutions, FFRDCs, and the NIH IRP, and the lack of demographic data available for use in the stage 2 sampling design.
Uses of the ECDS Data
NCSES released data from the ECDS pilot study in the 2017 WPMD report and in an InfoBrief. The ECDS is a unique source of detailed information on early career doctorates, including their employment and productivity, career pathways followed, and future career plans. Beyond being able to expand the data in the SEI reports and produce additional reports focused on this population, NCSES anticipates that the ECDS data will be useful to government agencies, such as NIH, and to organizations, such as CGS, the Association of American Universities, the American Association of Medical Colleges, the National Postdoctoral Association, and the American Association for the Advancement of Science. NCSES also expects to share the data with OECD.
Survey of Postdocs at FFRDCs
In addition to the workforce surveys described above, since 2005 NCSES has conducted the Survey of Postdocs at FFRDCs every 2–3 years. The survey collects aggregate data on postdocs by citizenship, ethnicity, race, and sex, as well as field of research and citizenship. The frame for this survey includes all FFRDCs in the Master Government List maintained by NSF and the NIH IRP. The survey is conducted by Web, and typically achieves a 100 percent response rate.
PRIOR COMMITTEE ON NATIONAL STATISTICS STUDIES
Over the years, the National Academies of Sciences, Engineering, and Medicine’s Committee on National Statistics (CNSTAT) has convened several panels to assist NCSES (formerly the Division of Science Resource Statistics) with issues pertinent to the agency’s mission. Some of these reports have played a particularly important role in guiding NCSES’s approach to measuring the science and engineering workforce (National Research Council, 1989, 2003, 2008).
One of the key reports, issued at the end of the 1980s, focused on the NSF surveys that made up what was at the time called the Scientific and Technical Personnel Data System (National Research Council, 1989). The database included data from the NSF Postcensal Survey, which was a survey of individuals in science and engineering fields sampled based on the decennial census, and reinterviews with the same respondents as part of the NSF New Entrants Survey. The data system also included the SED and SDR. The CNSTAT panel recommended a redesign of the data system, in part to address reliability issues. The ensuing design changes led to the establishment of the Scientists and Engineers Statistical Data System
(SESTAT). The panel that authored a second report revisited the SESTAT design and recommended modifications to prepare SESTAT for the beginning of the new century (National Research Council, 2003).
A few years later, a CNSTAT panel examined options for addressing a challenge faced by NSF as a result of the elimination of the decennial census long form, which had served as the source of information on college graduates for the sampling frame of the survey that came to be known as the NSCG (National Research Council, 2008). The panel recommended the use of the Census Bureau’s new ACS as a sampling frame for the NSCG. The panel’s input led to the implementation of a rotating panel design for the NSCG and the discontinuation of the NSRCG. This report also set the stage for further evaluation of NSF’s approach to measuring the science and engineering workforce.
A recent CNSTAT panel examined the status of science, technology, and innovation indicators being published by NCSES and whether new or revised indicators are needed (National Research Council, 2014). Some of the relevant recommendations from that panel’s report are that NCSES
- consider options for exploiting the longitudinal panel structure of the SDR to create indicators of researcher mobility over time and track the initial employment and career paths of recent doctorate recipients in the first years after they receive their doctoral degrees;
- draw on occupation data from the Longitudinal Employer-Household Dynamics Program and education data from the Baccalaureate and Beyond Longitudinal Study to create indicators of labor mobility, particularly for industries with high growth and those in which the United States has a competitive advantage;
- enhance data on STEM subpopulations, such as early career doctorate recipients, master’s degree holders, and community college graduates;
- explore the possibility of utilizing full-text resources of dissertation databases to create new indicators, for example, on the relatedness of different fields; and
- consider using ACS data to produce indicators that track salaries in different occupations and for college graduates receiving different types of degrees.
NCSES has begun addressing some of these recommendations, as well as making various improvements noted in this report. The recommendations in Chapters 3–6 reinforce some of those made by the 2014 CNSTAT panel and address other directions NCSES is taking, while raising further issues relevant to the present panel’s charge.


