
4
Sample Design and Estimation Procedures
As discussed in Chapter 2, the National Center for Science and Engineering Statistics (NCSES) conducts two annual census surveys to collect data on the education of scientists and engineers: the Survey of Graduate Students and Postdoctorates in Science and Engineering (GSS) and the Survey of Earned Doctorates (SED). The agency also conducts three sample-based workforce surveys: the National Survey of College Graduates (NSCG), the Survey of Doctorate Recipients (SDR), and the Early Career Doctorates Survey (ECDS). This chapter focuses on potential enhancements to the sample design and estimation procedures used for the latter three surveys.
NCSES’S WORKFORCE SURVEYS
NSCG
The NSCG is a biennial survey whose sample includes individuals who have a bachelor’s degree or higher, are under the age of 76, and reside in the United States in a noninstitutional setting. Since 2010, the NSCG has used a rotating panel design with stratified sampling that combines samples from the most recent round of the American Community Survey (ACS) and the previous three rounds of the NSCG. As discussed in Chapter 2, the use of the ACS as a sampling frame for the NSCG was a recommendation made by a previous panel of the National Academies of Sciences, Engineering, and Medicine when the ACS replaced the decennial census long form (National Research Council, 2008). Prior to the transition to the ACS, NCSES used the long form for information on college graduates. The ACS collects data
continuously (annual estimates are produced based on a series of monthly samples), which represents an advantage over the long-form data that were available only once a decade. Figure 4-1 shows the NSCG sample design, which includes four rounds of interviews and a typical expected sample size of about 130,000.
The variables used in the stratification process for the NSCG sample include highest degree type; occupation/degree type (a composite variable that captures both occupation field and bachelor’s degree field); a composite demographic variable that combines information about race, ethnicity, disability status, and citizenship; and the likelihood that the person holds a degree obtained in the United States. Recent NSCG surveys have included an oversample of young graduates with a bachelor’s or master’s degree, which serves to replace data previously collected through the National Survey of Recent College Graduates (NSRCG).
The NSCG sample allocation is based on reliability targets for the survey’s key analytic domains, which are determined primarily according to the needs of NCSES’s two congressionally mandated reports, Science and Engineering Indicators and Women, Minorities and Persons with Disabilities in Science and Engineering. These primary data needs include characteristics defined by degree level, occupation field, degree field, demographic group, and being a young graduate.
SDR
The SDR is a biennial survey whose sample includes individuals who have received a research doctoral degree in a science, engineering, or selected health field from an academic institution in the United States are under the age of 76 and reside in a noninstitutional setting. Sample members are contacted every 2 years, and unlike the NSCG, the SDR since 2010 has followed up with sample members living both in the United States and abroad.
The SDR uses as a sampling frame respondents to the SED census of completed doctorates (which consists of approximately 55,000 new graduates annually, including about 38,000 graduates in science, engineering, and selected health fields). In 2015, the survey underwent a major redesign that involved a large increase in sample size, from typically around 40,000 cases prior to 2015 to around 120,000 cases. The goal of the redesign was to enable NCSES to produce estimates of employment characteristics at the fine field-of-degree level that is reported in the SED (215 fine fields of degree, compared with the 26 broad fields reported in the past), while at the same time maintaining the aggregate degree-level estimates for domains defined by demographic characteristics used in the main NCSES publications.
The 2015 sample redesign has engendered some controversy among some of the data users. From the panel’s point of view, the redesign has
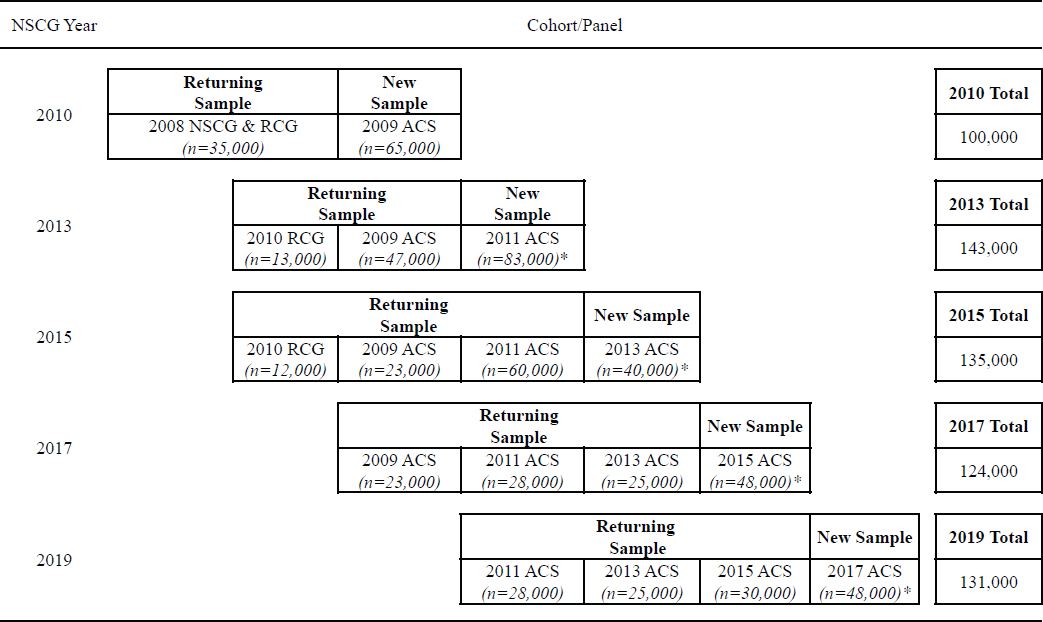
NOTES: *Indicates the inclusion of an oversample of young graduates. RCG refers to the discontinued National Survey of Recent College Graduates.
SOURCE: Finamore (2016).
both positive and negative aspects. Positive aspects are described in this section, negative aspects in the following section on Longitudinal Design. Regardless of the pluses and minuses, the panel sees good opportunities for further increasing the usefulness of the SDR going forward.
The sample size increase and the redesign were implemented at the request of the U.S. Office of Management and Budget and based on consultation with an expert panel to address a need for understanding the characteristics of the science and engineering workforce by specific fields of study. Many of the federal government’s investments in research and advanced training are focused on specific fields of study, and the level of detail previously available by broad categories of fields of study was not always adequate to inform policy decisions.
The redesign enhanced NCSES’s ability to produce reliable estimates of counts and employment characteristics of doctorate recipients by such subfields as “bioinformatics” and “biotechnology” in addition to the broader field of “other biological sciences”; to track changes by subfield; and to make this information available by such demographic characteristics as gender, ethnicity, and race. The redesign will enable analyses that will help explain variations within subfields that can inform policy decisions aimed at broadening participation by underrepresented groups, for example, by answering such questions as the following: What are the occupation category differences for different groups in particular subfields? Is there “early attrition” from the research track by some demographic groups? and Are women in particular academic disciplines being promoted/tenured at the same rate as men? The data also will shed light on the sometimes very different employment patterns of graduates in different types of subfields (for example, subfields focused on basic versus applied research) within a broader field. In addition, it will be possible to conduct research on foreign-born recipients of doctoral degrees in specific fields (for example, among foreign-born U.S.-trained doctorate holders in particular fields, who stays in the United States and who returns home, and the employment characteristics of foreign-born doctorate holders when working abroad or when working in the United States). NCSES expects the 2015 SDR public-use data file to expand the data available by field of degree from the 20 broad fields in the 2013 file to approximately 90 fields of degree. Although the sample sizes are still not large enough to enable NCSES to release data for all fine fields of degree in the public-use data file, the restricted-use microdata file that is made available to researchers who obtain a license will include all 215 fine fields of degree.
Prior to 2015, the survey used a fixed-sample panel design, which meant that new graduates were added to the sample in each survey cycle, and sample members were dropped only when they no longer met eligibility criteria or if doing so was necessary to maintain the overall sample
size. With the 2015 sample, NCSES attempted to optimize weighting and variance estimation in 215 fine field-of-degree strata for demographic characteristics. The downside of this design focused on fine fields of degree is that it entails highly unequal sampling rates across strata, creating some inefficiencies (discussed later in this chapter).
For the 2015 sample, NCSES considered a complete recasting of the sample, based on the recommendation of a panel of experts asked to assist with the redesign. In the end, the agency decided to drop approximately two-thirds of the existing cases, but carry forward 16,075 cases from the eligible 2013 sample to enable analysis using these older cases. Still, the majority of the redesigned sample is new to the SDR. Table 4-1 shows the 2015 sample by cohort. In the 2017 SDR, NCSES carried forward the entire 2015 sample to facilitate an improved longitudinal design for this survey in subsequent cycles of data collection. This approach is consonant with the emerging data needs and recommendations presented in Chapter 3, whereas the 2015 design was not.
ECDS
As discussed in Chapter 2, the ECDS is a new survey, for which a pilot data collection was conducted in 2014–2015. The pilot sample included individuals who had earned their first doctorate or doctorate-equivalent degree within the past 10 years and who were working at an academic institution included in the GSS, in a federally funded research and development center (FFRDC), or in the National Institutes of Health Intramural Research Program (NIH IRP). The pilot survey had a two-stage stratified sample design. Primary stratification was based on the above three sectors—academic institution, FFRDC, and NIH IRP. Academic institutions were further stratified by type: highly active research institutions, institutions with medical schools, doctorate-granting institutions, and master’s-granting
TABLE 4-1 Sample of the 2015 Survey of Doctorate Recipients (SDR), by Cohort
| Sample Cohort | 2015 Count |
|---|---|
| Panel continuing from 2013 SDR | 16,075 |
| Expansion sample: new to the SDR in 2015 | 87,252 |
| Expansion sample: previously deselected and resurrected for 2015 | 6,336 |
| New graduates sample (academic years 2012 and 2013) | 10,337 |
| Total | 120,000 |
SOURCE: Finamore (2016).
institutions. Academic institutions were selected with probability proportional to size, while FFRDCs and the NIH IRP were sampled with certainty. After the institutional data collection had been completed, individuals were selected from the institutions that responded. Stratification was based on the likelihood that the person was an early career doctorate recipient and postdoctoral status. Approximately 44 sample members were selected from each of the academic institutions and FFRDCs, and 250 individuals were sampled from across the NIH IRP.
Possible Enhancements to Sample Design and Estimation Procedures
As discussed above, the sample designs for the NSCG and SDR are based on achieving prespecified precision requirements for a large number of respondent categories. For example, the SDR has specific sample sizes allocated to 216 strata, defined by fine field of doctoral degree. The sample sizes for these strata range from 3,661 (with a sampling fraction of 0.09) to 42 (with a sampling fraction of 1.00). The overall sampling fraction is about 0.11. The NSCG sample design is similarly motivated.
The precision requirements are carefully specified in the design documents for the surveys, and it is obvious that great attention has been paid to ensuring that the respective designs meet the goals for adequate precision of results for a large group of reporting categories. Accordingly, it would appear that two primary considerations apply to potential enhancements to the sampling design and estimation procedures for these surveys:
- What enhancements would permit the current design goals to be met more efficiently?
- Are there other design goals that should be considered, either in addition to the current goals or requiring some kind of compromise with the current goals?
The remainder of this chapter reviews possible enhancements to both sample design and estimation that address these considerations.
SAMPLE DESIGN
Longitudinal Design
In principle, both the NSCG and SDR are longitudinal panel surveys, but historically NCSES has focused on the surveys’ primary goal of producing cross-sectional estimates and maintained the longitudinal sample design simply to take advantage of cost efficiencies associated with interviewing the same sample members over multiple cycles. NSCG sample members
are interviewed four times, and most SDR cases remain in the sample until the age of 76.
Although some researchers have created longitudinal datasets based on these surveys in the past, the data files released by NCSES were not configured to facilitate this type of use and did not include weights appropriate for longitudinal analyses. The cuts made to the SDR sample to maintain the overall sample size (discussed earlier) also introduced challenges over the years.
Despite the fact that some cases from previous years were maintained in the new sample even after the 2015 SDR redesign, the changes involved the loss of about two-thirds of the existing cases. This represents a substantial setback for potential longitudinal uses of the data, but also an opportunity to develop a design that better supports these types of analyses because the design can be developed with longitudinal analysis goals in mind.
Following the redesign, NCSES launched several activities focused on enhancing the usefulness of the data for longitudinal research going forward. First, the agency commissioned technical and analytic support to construct properly weighted longitudinal files for the 2008, 2010, and 2013 SDR, as well as the 2010, 2013, and 2015 NSCG. This work is ongoing, and it is expected to serve as a template for longitudinal files based on data from subsequent survey cycles as well. NCSES also is working with a panel of experts in sample design to inform longitudinal design options for the 2019 SDR cycle and has been proactive in informing the data user community about the options that are being considered and the progress of the work.1 To obtain input before finalizing the plans, the agency has scheduled a meeting with stakeholders in August 2017 and is planning to hold an additional meeting in early 2018.
As discussed in Chapters 1 and 3, the present panel believes enabling longitudinal analyses is the most important enhancement for expanding the usefulness of the NCSES workforce surveys, particularly to meet increasingly urgent data needs to better understand career pathways and mobility (see Recommendation 3-1 in Chapter 3). The work on the SDR sample design is promising because the agency has made demonstrated progress in the direction of building up a longitudinal sample in the SDR: in addition to the activities described above, it carried forward the 2015 sample to the 2017 SDR. The panel assumes that the design changes going forward will also address the previous inefficient practice of ad hoc cuts to maintain sample size.
___________________
1 Summaries of the expert panel meetings are available at https://www.nsf.gov/statistics/srvydoctoratework/longitudinal-design.cfm [October 27, 2017].
RECOMMENDATION 4-1: The National Center for Science and Engineering Statistics should maintain and accelerate its efforts to develop sample designs that facilitate the increased generation and analysis of longitudinal data in the National Survey of College Graduates and the Survey of Doctorate Recipients, including the generation of appropriate weights and documentation for longitudinal analysis.
If integration with data from administrative records, such as unemployment insurance earnings data, becomes more feasible in the future, this development could pave the way for a longitudinal system of surveys in which some of the updates would originate from administrative databases or from custom follow-up surveys triggered by the updates to administrative data (see Appendix D for a more detailed discussion).
International Mobility of Doctorate Recipients
The goal of the SDR has been to provide data on the employment characteristics and career pathways of individuals who obtained a doctorate in a science, engineering, or selected health field from an academic institution in the United States, and sample members have been interviewed even if they moved abroad after obtaining their degree. With the 2015 redesign, the sample became fully representative of these graduates, regardless of where they reside at the time of the survey. This change allows the SDR to capture important populations that represent substantial subsets of U.S. doctorate recipients. The importance of these groups of doctorate recipients is demonstrated by data from the SED indicating that in recent years, approximately one-third of doctorates awarded by U.S. institutions in the fields of interest have been awarded to individuals with a temporary visa, and about one in four of these degree recipients with a temporary visa were planning on leaving the United States after graduation (National Center for Science and Engineering Statistics, 2017e). The expanded sample enables analyses of the employment characteristics of foreign-born recipients of degrees from U.S. institutions by fine field and by residence in the United States or abroad. Figure 4-2 shows for the 2013 and 2015 SDR the number of sample members who reside abroad, by degree year.
Scientists and Engineers with Foreign-Earned Doctorates
One group of doctorate recipients not well represented in the current system of surveys is those who obtained their degree abroad but are now living in the United States. The NSCG samples individuals currently residing in the United States, and as discussed, the variables used in the stratification process include a composite demographic variable combining information on
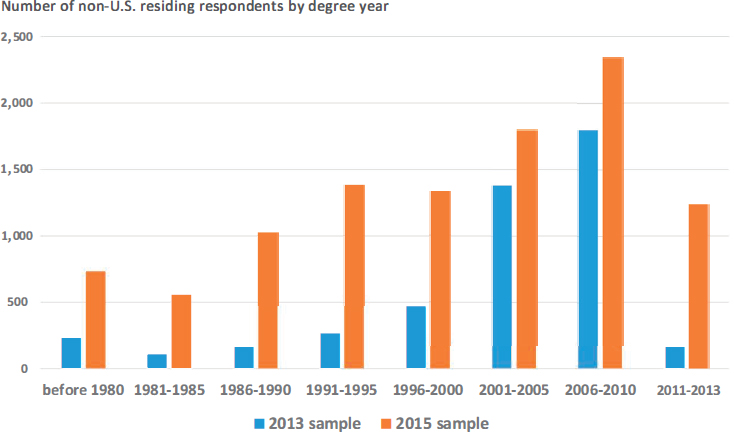
NOTE: The sample size was increased from approximately 40,000 in 2013 to approximately 120,000 in 2015. The 2013 SDR included only eligible graduates from the 2011 academic year and did not fully represent those living abroad who earned their degrees prior to academic year 2001.
SOURCE: National Center for Science and Engineering Statistics (2017f).
race, ethnicity, disability status, citizenship, and the likelihood that the person holds a degree obtained in the United States. However, the information available from the ACS is not ideally suited to obtaining a large enough sample of this population for the NSCG to make the survey truly useful for tracking the international flow of doctorate recipients with degrees obtained abroad. In the 2015 NSCG, for example, the number of holders of foreign-earned doctorates who originated from the 2013 ACS sampling frame was 243. In other words, after 4 years, the rotating panel design that combines samples from the most recent round of the ACS and the previous three rounds of the NSCG is expected to include around 1,000 foreign-earned doctorates.
The sample of doctorate recipients with degrees obtained abroad could be increased in the NSCG in three ways. First, it might be possible to improve the stratification so that oversampling would be more efficient in identifying those with foreign-earned doctorates. Second, it might be possible to retain members of this group in the survey sample for a longer period of time. The third option is expanded use of data from the ACS for NSCG sample design and estimation. These options are discussed below. With all of these options, in addition to generating more adequate sample
sizes of doctorate recipients with degrees from abroad, the NSCG would follow sample members who moved abroad, regardless of degree level.
Improved Stratification to Increase the Sample of Foreign-Earned Doctorates
The ACS does not collect information about when and where respondents earned their degrees, so for sampling purposes, NCSES assumes that people born in the United Sates have a “high likelihood of a U.S.-earned degree.” For foreign-born individuals, NCSES uses information on age, year when the person came to live in the United States, and highest degree attained to develop a proxy variable for the likelihood of a U.S.-earned degree (the ACS does not ask for year of degree). In addition to not measuring whether a degree was earned in the United States, the ACS questions have limitations as proxy variables. In the case of individuals who came to live in the United States on more than one occasion, for example, the ACS asks only about the most recent year in which the person moved to the United States. For NSCG sampling purposes, it would be more useful to know the year when a person first moved to the United States (or ideally whether the person’s degree was earned outside of the United States).
Using the proxy information available from the ACS, NCSES categorizes foreign-born individuals with a doctorate as their highest degree as having a “high likelihood of a U.S.-earned degree” if they came to live in the United States when they were aged 24 or younger. If they came to live in the United States at age 25 or older, they are categorized as having a “low likelihood of a U.S.-earned degree.” The majority of sample members classified as having a “low likelihood of a U.S.-earned degree” on the basis of their responses to the ACS also report a foreign-earned degree in the NSCG, but NCSES finds that many individuals have a foreign-earned bachelor’s or master’s degree and a U.S.-earned doctorate. In the 2013 and 2015 NSCG samples, the stratum of doctorate recipients with “a low likelihood of a U.S.-earned degree” included around 50 percent actual foreign-earned doctorates, around 40 percent actual foreign-earned bachelor’s or master’s degree holders who had no foreign-earned doctorate, and approximately 10 percent without a foreign-earned degree.
The variables used to identify the strata (age, highest degree, and year when the person moved to the United States most recently) are, in all likelihood, the strongest predictors of foreign-earned doctorates. However, it might be possible to improve the sensitivity of this classification by using other data available from the ACS, such as birthplace, citizenship, or veteran status (see the next section). Several modeling techniques would be appropriate for this classification task, such as random forest models, gradient-boosted decision trees, logistic regression, or classification and regression trees (CART) (Hastie et al., 2009).
A suitable modeling approach would use respondent data from the NSCG to define the outcome (foreign-earned doctorate), with the predictors coming from the available ACS data. A logistic regression modeling approach, for example, would predict the NSCG-reported degree (highest foreign-earned degree is a doctorate, 1 = yes, 0 = no) as the outcome. The data from the ACS could be used as predictors. The current rule could be emulated, for example, by including a predictor that coded cases as meeting the current rule for inclusion in the “low likelihood of a U.S.-earned degree” category (1 = meets rule, 0 = does not meet rule). In such a model, the estimated probability would likely be approximately 0.50 for cases in the group that met the rule. However, a logistic regression model has more flexibility to include more predictors. A CART model might also be very useful for this classification problem.
Given that the most likely predictors of a foreign-earned doctorate available from the ACS are used in the current classification scheme, the gains from using additional variables are likely to be relatively small. If the stratification can be improved, however, this would make it more efficient to increase the sample size for this population in the NSCG.
RECOMMENDATION 4-2: The National Center for Science and Engineering Statistics should evaluate whether modeling techniques could be used to improve the sensitivity of the classification used to stratify the National Survey of College Graduates (NSCG) sample drawn from the American Community Survey, thereby making it more efficient to increase in the NSCG the sample of doctorate holders who obtained their degree from abroad.
Longer Retention of Identified Foreign-Earned Doctorates
Given interest in the movement in and out of the U.S. workforce of doctorate recipients who obtained their degree abroad, it may be useful to track these cases for longer than the four waves of the current NSCG design. If the longitudinal analysis capabilities of the survey can be enhanced, the NSCG panel design would be particularly well suited to studying the within-person movements of this population in and out of the U.S. workforce. Additional follow-ups also would have the advantage of increasing the sample sizes for this group as more cases were accumulated over time.
The decision to limit the number of follow-ups in the NSCG to four was based on the observed pattern of decline in response rates in subsequent waves. However, the SDR manages to follow sample members for longer periods. Furthermore, if it is particularly important to understand the mobility of the NSCG population, it may be worth considering alternative design options or customized survey procedures for this group
(although these types of approaches would be applicable to any group with specific characteristics and a small sample size or the entire NSCG sample if the number of follow-ups were increased). Such alternatives could include shorter survey instruments, more frequent administration of shorter instruments, sending between-wave updates to panel members, higher incentives, tailored contact materials, or more intensive locating efforts. It might be possible to create a very short survey focused on key questions about this group that could be administered annually or biannually over a longer period of time. Reliance on administrative records for some of the data might also be an option.
In determining the optimum number of waves, it would be necessary to balance the goals of maximizing the benefits of the longitudinal design and maintaining reasonable response rates. The cost implications of the additional follow-up would have to be assessed as well.
RECOMMENDATION 4-3: To enhance understanding of the movements in and out of the U.S. workforce of those who obtained their doctorate degree abroad, the National Center for Science and Engineering Statistics should consider increasing the number of follow-up waves for this subgroup in the National Survey of College Graduates.
Expanded Use of Data from the ACS for NSCG Sample Design and Estimation
As discussed, the ACS variables (or variables derived from the ACS) currently used in the stratification of the NSCG sample include highest degree type; occupation/degree type (a composite variable that captures both occupation field and bachelor’s degree field); and a composite demographic variable combining information about race, ethnicity, disability status, citizenship, and the likelihood that the person holds a degree obtained in the United States. The ACS collects additional data that do not appear to be used in the NSCG, but could potentially be useful at either the design or estimation stage. These data include geographic location, gender, age (more generally than just defining young graduates), birthplace, veteran status, employment status, employer type, industry, and income.
These additional variables could be used in one or more of three ways. First, additional information from the ACS could be used at the design stage, either for explicit stratification, for implicit stratification (sorting), or to determine selection probabilities. For example, it would appear that the process of identifying those who obtained a doctorate outside the United States might be enhanced by including birthplace and veteran status in the model. Information obtained from the ACS also could be used to enhance the NSCG data file, particularly in the case of variables not subject to
change over time. This type of potential use might have confidentiality implications, but researching its feasibility would be worthwhile. Finally, ACS data could be used in estimation, for calibration or generalized regression. Although the benefits of using the same data for design and estimation may be limited, doing so could still be effective when nonresponse is substantial, as discussed in more detail below.
RECOMMENDATION 4-4: The National Center for Science and Engineering Statistics should evaluate potential additional uses in the National Survey of College Graduates (NSCG) for information obtained from the American Community Survey (ACS). These additional uses could include using additional variables in the design stage, using ACS data to enhance the NSCG data file, and using ACS data in estimation.
Possible Alternative Sampling Frames for the NSCG and SDR
As discussed in Chapter 3, NCSES is researching the use of alternative data sources, such as administrative records, to expand and improve the range, accuracy, and efficiency of the data collected through its science and engineering workforce surveys. Alternative data sources also could be considered for use in the sampling frames for the surveys, either as supplemental frames, combined with samples from the current frames (the SED for the SDR or the ACS for the NSCG), as part of multiple-frame methods, or if necessary as replacement frames. The SED and ACS, respectively, represent the most suitable sources of data for the SDR and NSCG sampling frames, and the potential loss of the SED or ACS as data sources for the respective sampling frames would likely lead to a substantial loss of precision for the affected survey. However, continued research to evaluate alternative data sources appears prudent in case either of the current sampling frames should become degraded or unavailable.
NCSES is working with the Census Bureau’s Center for Administrative Records Research and Applications (CARRA) to evaluate these types of alternative frame options. CARRA’s research is focused on the NSCG because the Census Bureau is the current data collection contractor for that survey. It is therefore more feasible to link the NSCG, relative to the other NCSES surveys, to other data that are already available or can be obtained by the Census Bureau. However, some of the alternative data sources being considered by CARRA could also be useful for the other NCSES workforce surveys. The main alternative data sources being actively researched by CARRA on behalf of NCSES are described below, along with the panel’s perspectives on their potential. As stated in the panel’s charge, NCSES is particularly interested in the use of multiple data sources, but is cognizant that the availability of these data sources can change over time.
Federal and Other National-Level Data Sources
Form 1098T data. One type of Internal Revenue Service (IRS) data that could be used for the sampling frame of NCSES’s science and engineering surveys is data from form 1098T. This form includes tuition information and is filed annually by educational institutions and insurers that provide reimbursements or refunds of tuition and related expenses. The Census Bureau has an agreement with the IRS to obtain data on payments for qualified tuition and related expenses and scholarships or grants, along with information on whether the student was attending the institution at least half-time or was a graduate student.
The form 1098T data could potentially provide a frame of individuals who already have a bachelor’s degree and are currently enrolled as graduate students. Useful information on the form is limited, but includes the institution where the student is enrolled and the student’s place of residence. These data might be useful if there were a particular desire to oversample students currently enrolled in graduate degree programs.
The ACS asks about whether the respondent is currently enrolled in a graduate degree program, subdividing responses into master’s, professional, and doctorate programs. Also available from the ACS is information on undergraduate field of degree, improving the ability to identify graduate students in fields of interest. Thus, the use of form 1098T data appears worth considering only if either ACS data became unavailable or the ACS sample size were determined to be insufficient for some future purpose.
W-2 tax form data combined with Business Register (BR) and Longitudinal Business Database (LBD) data. Another way in which IRS data could potentially be used for an NSCG frame would be to combine W-2 tax form data with data from the BR and LBD, which are databases of business establishments and companies maintained by the Census Bureau. Combining these data from these sources could result in a sampling frame containing extensive information about individuals’ income and some characteristics of their employers, particularly if the W-2 could be obtained and included. However, addressing the confidentiality issues associated with the use of these data would likely be challenging, and information on educational background and current occupation would be imprecise.
Longitudinal Employer-Household Dynamics Program (LEHD) data. As discussed in Chapter 3, linkages to the Census Bureau’s LEHD data could supplement the NSCG data with additional detail on sample members’ employers and could potentially serve as a source of updates on employment that would reduce the need for frequent survey follow-ups. However, there are coverage limitations associated with the LEHD data (they do not
include the self-employed), and the database contains insufficient information to be suitable for use in developing a sampling frame (information on educational background or occupation is lacking).
National Student Clearinghouse (NSC) data. The NSC is a nonprofit organization that provides educational reporting, data exchange, research, and degree and enrollment verification services. More than 3,600 colleges and universities, representing 98 percent of all students enrolled in educational institutions in the United States, participate in the clearinghouse, and the degree verification service encompasses about 90 percent of 4-year degrees obtained in the United States. In CARRA’s assessment, the NSC database appears to show the most promise as a potential source of data for a sampling frame replacement, although obtaining access to NSC data needs to be viewed as a long-term project, primarily because of confidentiality restrictions as the Family Educational Rights and Privacy Act (FERPA) requires students’ permission for uses of the data beyond evaluations of specific programs. In addition, rates of missing and underreported data in the NSC are higher for certain demographic groups.
U.S. Department of Education data. The National Student Loan Data System (NSLDS) is a database of student aid recipients maintained by the U.S. Department of Education. Again because of FERPA restrictions, there are limitations on how these data can be used. The Department of Education cannot provide its data files to the Census Bureau for use in constructing a sampling frame, but may be willing to provide limited information on specific individuals who are already in the NSCG sample, thereby facilitating follow-up between data collection waves.
Department of Homeland Security (DHS) data. DHS approves visa applications for entry into the United States, including student visas (F-1) and exchange visitor visas (J-1). The agency maintains information about foreign nationals, including education status and location and description of work in the case of J-1 visa applicants, that could be a source for a supplemental sampling frame on foreign nationals. However, DHS has not indicated willingness to share this type of data with the Census Bureau.
Other alternative data sources. As discussed in Chapter 3, NCSES, with the help of CARRA, is evaluating several other alternative sources of data, such as online resumés and information available from career networking sites such as LinkedIn, Monster.com, and chroniclevitae.com. Because of their limited coverage, however, these sources may be suitable primarily for supplementing the survey data rather than serving as a source of information for the sampling frame.
Summary. NCSES is casting a wide net in reviewing nonsurvey data sources that could be used in the development of sampling frames for the science and engineering workforce surveys. None of these data sources stands out currently as potential improvements over the sampling frames used for the NSCG or SDR. Continuing to monitor all of these data sources is important, however, because the availability, accessibility, characteristics, and relative benefits of these types of data are constantly changing.
Institution-Based Sampling Frame for the NSCG
As part of the GSS data collection, NCSES conducts a large-scale outreach effort annually to all U.S. academic institutions that grant research-based master’s degrees or doctorates in science, engineering, and selected health fields. Although the data collected are at the aggregate level and are limited to students enrolled in master’s- or higher-level programs, it may be possible to collaborate with academic institutions to obtain information for the NSCG sampling frame.
Indeed, between 1973 and 2010, the NCSES portfolio of science and engineering data collections included an additional survey, the NSRCG. Prior to the NSCG’s transition to the use of the ACS for its sampling frame, the NSRCG was the primary source of new graduates in the NSCG sampling frame. The NSRCG was based on a two-stage sample design. In the first stage, a sample of academic institutions was selected using the list of institutions in the Integrated Postsecondary Education Data System database maintained by the National Center for Education Statistics. In the second stage, a sample of graduates was selected from the lists provided by the sampled institutions.
An institution-based sample for the NSCG would have several limitations and challenges compared with the ACS. The sampling frame would have to be supplemented with data from other sources in addition to the lists obtained from the academic institutions. A list of recent graduates obtained from institutions would not include people who joined the workforce many years ago or those who earned their degrees outside the United States but are now living here. As discussed, the options for developing a frame of individuals who obtained their degrees abroad may be particularly limited. NCSES is highly successful in obtaining data from institutions, but some government agencies are experiencing increasing difficulties with these types of requests, and this trend could have an adverse impact on response rates. In addition, it is important to note that the NSRCG faced some additional response rate challenges, primarily because of the difficulties associated with locating sample members who have left school and tended to be highly mobile during the years following their graduation. As the longitudinal aspects of the science and engineering surveys become more of a priority,
however, some of these disadvantages may diminish somewhat if respondents are kept in the sample longer. Furthermore, educational institutions are increasingly motivated to track outcomes for their graduates, and this trend would be worth monitoring, possibly working closely with a small number of institutions.
Household-Based Sampling Frame for the NSCG
Although the focus of the NSCG is on college graduates who are in the science and engineering workforce, the target population is fairly broadly defined. The proportion of households with a member who holds a bachelor’s degree in a science or engineering field or works in one of these fields is likely reasonably high (based on 2011–2015 ACS data, approximately 38.8 percent of households include at least one person with a bachelor’s degree or higher). Although not likely to be more efficient than the current design, a household-based survey could potentially be considered as an alternative to the current NSCG design, particularly if the data collection could be combined with another survey. Another household survey also could potentially serve as a source of data for part of the sampling frame.
It might be possible to imagine the NSCG as a supplement to the Current Population Survey (CPS), which is a monthly rotating panel survey. In its current form, the CPS sample is not large enough to meet the NSCG’s precision requirements, and it is unlikely to be capable of readily accommodating the increased respondent burden. If necessary, however, NSCG data could potentially be collected as a one-time, special module best administered by personal interview.
The cases leaving the CPS could be accumulated over time to provide a frame for a survey such as the NSCG. The monthly CPS sample size is approximately 60,000 households, and each household contains on average two working-age people (aged 15+). In other words, the CPS sample in a given month includes 120,000 individuals. One-eighth of the sample is replaced monthly, which means approximately 15,000 people leave the sample each month. Assuming that it would be permissible for the NSCG to survey people in the initial sample even before they left the CPS, a sample of 285,000 cases (120,000 + 11 × 15,000 = 285,000) could be available in the first year. In subsequent years, an additional sample of 180,000 cases could be available (12 × 15,000 = 180,000). Respondent burden, however, would be a concern for sample members who would be included in the follow-ups for both surveys. In addition, these numbers would not be sufficient to produce the level of detail currently published by NCSES. Even with the use of the ACS, which surveys 250,000 new addresses per month (compared with 7,500 new households in the CPS), it is necessary to aggregate multiple months to develop a frame for the NSCG (see Fecso et al., 2012, pp. 18–19).
Despite the challenges, the appeal of the CPS is that it could potentially serve as a source for a sampling frame of people who have been in the workforce for a while and obtained their degrees outside the United States. This sampling frame could then be used to complement a primarily institution-based sample of recent college graduates. In the long term, as the frame of bachelor’s and master’s graduates accumulated over years, the role of the CPS could be reduced. Eventually, the CPS could be used mainly or exclusively to sample people who received their degrees outside the United States.
Each of the potential frames discussed above has weaknesses, such as the lack of full coverage of the population, high cost, and incomplete data for stratification. At present, it appears likely that any alternative to the ACS as a sampling frame for the NSCG would have to involve the use of multiple frames.
RECOMMENDATION 4-5: It does not appear that any existing data sources would represent improvements over the current sampling frames for the National Survey of College Graduates or the Survey of Doctorate Recipients. Nonetheless, the National Center for Science and Engineering Statistics should continue evaluating alternative data sources for this purpose to ensure that it maintains awareness of the strengths and weaknesses of rapidly evolving options.
Other Sample Design Issues
Integrating the ECDS into the SDR
As discussed, the pilot ECDS relied on a sampling frame of individuals who earned their first doctorate or doctorate-equivalent degree within the past 10 years and who were working at an academic institution included in the GSS, in an FFRDC, or in the NIH IRP. The survey had a two-stage stratified sample design: after the institutional data collection was completed, individuals were selected from the institutions that responded. While the ECDS greatly expanded data collection on important emerging topics of interest, several challenges, associated primarily with the sample design, were experienced during the pilot study. First, the sampling frame is limited in its representation of employment sectors. Second, obtaining buy-in from the institutions was challenging, and NCSES has been experiencing increasing nonresponse among GSS institutions in general. Finally, demographic data for the second stage of the sampling design are lacking.
The question arises of whether the ECDS could be integrated more closely with the SDR. NCSES has considered administering the ECDS on a biennial schedule, alternating it with the SDR data collection. The
possibility of a longitudinal component for the ECDS also has been considered, with follow-ups approximately 5 and 8 years after the initial survey cycle and the ECDS longitudinal respondents potentially being merged into the SDR sample when they age out of the ECDS target population. To implement a longitudinal design, however, NCSES would first have to overcome the response rate challenges that are currently impacting the ECDS.
As discussed in Chapter 3, some of the questions included in the ECDS would also be of interest for the SDR population. Accordingly, another possibility to consider is whether the SDR and ECDS samples could be integrated in a way that would treat the ECDS population as a subsample of the SDR. In this scenario, some questions would be administered to all sample members, and early career–focused questions would be treated as a module administered only to a subset of the respondents (see below and Chapter 3 for additional discussion of topic modules). If the sampling frame and response rates continued to be a challenge, the use of an SED-based sampling frame for early career doctorate recipients might have some advantages, although the sample would not include individuals with degrees obtained abroad.
RECOMMENDATION 4-6: The National Center for Science and Engineering Statistics should evaluate the feasibility of merging the Early Career Doctorates Survey into the Survey of Doctorate Recipients.
NSCG Primary Stratification Variable
The redesigned SDR sampling frame uses fine field of degree to stratify the sample. This approach is both important, because reporting by fine field of degree is of high value to the SDR, and straightforward, because the information is available on the sampling frame (SED). However, the NSCG is stratified by occupation. The question arises of whether the precision of key NSCG estimates could be improved by stratifying this survey as well by field of degree rather than occupation.
The panel does not believe that modifying the NSCG sampling frame to prioritize stratifying by field of degree would be beneficial. For degrees awarded at the baccalaureate level, and especially across the full age range of the workforce, an individual’s current occupation is likely to be more informative than the degree obtained with respect to workforce capability, going beyond the science and engineering and nonscience and engineering classification. The SDR differs in this regard, because for doctoral degree holders, field of degree is likely much more relevant to workforce capability compared with baccalaureate holders.
Another question that arises is whether the surveys are collecting enough information, of the right kind, about individuals who hold a master’s degree
but not a doctorate. These individuals would appear to represent a vital component of the science and engineering workforce, and it might be useful to modify the design of the NSCG accordingly by oversampling those with a master’s degree, at least among those with an undergraduate degree in a science and engineering field. It appears likely that a high proportion of individuals who hold a bachelor’s degree in a science and engineering field and go on to obtain a master’s degree obtain the latter degree in such a field as well.
RECOMMENDATION 4-7: The National Center for Science and Engineering Statistics should evaluate whether oversampling individuals with a master’s degree who obtained a bachelor’s degree in a science and engineering field would be a useful modification to the National Survey of College Graduates sample design.
Use of Matrix Sampling or Topic Modules in Questionnaire Design
A matrix sampling approach could provide one avenue for relieving the tension between needing some estimates reliable at the fine field level while not overburdening respondents with questions that need not be analyzed at that level. For example, the questionnaire items that are critical to fine field of degree could be administered to everyone, and items used only for estimates at higher levels of aggregation could be administered only to a subsample of respondents. This approach might also address NCSES’s expressed need for a “quick turnaround” capability for some survey topics. An alternative design would be a short survey supplemented by administrative data and a long survey for a random subsample. The short survey could have more equivalent rates of sampling across fine fields. The short survey combined with the administrative data could be focused on meeting key reporting requirements, while the long survey could serve additional analytic purposes, including those of external data users. For sample members who did not consent to record linkage, the survey could default to the long version. These types of designs would be most feasible in electronic data collection modes and less realistic as long as a mail data collection mode was deemed necessary.
True matrix sampling is difficult to implement (see National Academies of Sciences, Engineering, and Medicine, 2016b). This approach would require reliable predictions of response rates for each stratum by mode (mail, Web, telephone). The use of matrix sampling in a mail survey would be especially challenging because multiple versions of the questionnaires would need to be produced and mailed. This approach would therefore be more feasible with a Web or telephone survey. Matrix sampling also has disadvantages for secondary users of the data as it would result in datasets with planned missing data, increasing the complexity of analyses.
For additional discussion of the potential use of topic modules (without a true matrix sampling design), see Chapters 3 and 5.
Possible Reconsideration of Design Objectives
It might be worthwhile to reflect on whether, by basing the designs of the SDR and NSCG primarily on prescribed levels of precision at very fine levels, the surveys are being rendered inefficient for many of the purposes for which the data are used. The prescribed precision levels may be necessary if one wishes to obtain estimates at very fine levels, but this capability comes at the expense of precision when one moves to more consolidated levels. Also, in determining the sample size requirements, it may be that improvements in precision that are being, or could be, obtained in estimation are not being considered. That is, it appears likely that the sample size calculations assume that Horvitz-Thompson estimation is being used, whereas in fact there is considerable scope for variance reduction through the use of auxiliary information, at least some of which is already being utilized.
The current designs have highly unequal sampling rates across different strata. This wide variation is likely to lead to considerable inefficiency for those estimates that cross stratum boundaries, as undoubtedly is the case for many of the key estimates. In the current NSCG sample design, a sample of 2,700 mathematicians represents a population of 200,000, while a sample of 5,000 represents the population of 3.3 million in science and engineering–related nonhealth occupations, resulting in average weights that are nine times higher than that of the mathematicians. In the case of the SDR, every graduate in behavioral analysis as well as health and medical psychology is included, but only 5 percent of clinical psychology graduates are included. This allocation makes sense if one is interested simply in data broken out by fine field of degree, but it is not a good allocation if one has any interest in those with a doctorate in psychology more generally, because clinical psychology graduates outnumber those other two groups combined by about 236 to 1.
Another disadvantage of the differential sampling rates that arise as a consequence of setting precision goals at the level of fine field of degree is that misclassification of a sampled unit can render the estimates almost meaningless. For example, if one of the 2,700 clinical psychology graduates sampled in the SDR actually obtained a degree in behavioral analysis, that one respondent would contribute 16 percent of the total estimate for behavioral analysis graduates. The question that arises is whether it is possible to achieve a better balance of the estimation goals for the SDR and NSCG at different levels. One enhancement that could potentially permit designs with less extreme differential sampling fractions yet maintain good
precision by fine field of degree is the use of small area estimation techniques, discussed further below (see Recommendation 4-9).
ESTIMATION METHODS
The estimation procedures used for the NCSES workforce surveys are appropriate and well developed, but there may be opportunities to enhance the usefulness and reliability of estimates by using more sophisticated estimation methods than are currently employed. This section describes some avenues that could be explored to evaluate whether worthwhile enhancements to the current estimation methods are possible. The NSCG is used illustratively, but some of the ideas discussed are likely to be relevant to the SDR as well.
Composite Estimation
Composite estimation methods take advantage of the fact that respondents are included in a sample for several waves of data collection, and their responses to many questions are highly correlated over time. Because these conditions apply in the case of the current design of the NSCG, there is considerable scope for applying such a technique in deriving estimates for each cycle. Over time, methods of composite estimation have become increasingly sophisticated, and it might be profitable to invest resources in researching different options for use of such methods. One possible approach is discussed below.
If we are interested in estimating a population total Yt for time t, then we denote its usual estimator by Ŷt. We define a different estimator, the K-composite estimator ![]() , by considering not only the sample at time t but also the sample on the previous occasion, t – 1. The sample at time t consists of units (people in the case of the NSCG) that were also in the sample at time t – 1, which is denoted by the subscript commont,t–1, and units that are new to the sample. Using only the common units, we can produce estimates of both Yt and Yt–1, denoted by
, by considering not only the sample at time t but also the sample on the previous occasion, t – 1. The sample at time t consists of units (people in the case of the NSCG) that were also in the sample at time t – 1, which is denoted by the subscript commont,t–1, and units that are new to the sample. Using only the common units, we can produce estimates of both Yt and Yt–1, denoted by
![]()
respectively. Then, of course,
![]()
is an estimate of the change in Y, and it can be added to the previous estimate ![]() for time t – 1 to produce an alternative estimate for Yt, namely
for time t – 1 to produce an alternative estimate for Yt, namely
![]()
We emphasize that
![]()
are based on the same sample units. Because we now have two estimates of Yt, it is natural to take a weighted average of the two:
![]()
Because ![]() uses more information than Ŷt, it will often be a better estimator of Yt.
uses more information than Ŷt, it will often be a better estimator of Yt.
The K-composite estimator was first used by the CPS but has since been replaced by more sophisticated forms of the estimator (U.S. Census Bureau, 2006, Ch. 10). The K-composite estimator can be used as a starting point, and if it is found to be useful for the NSCG, other types of composite estimation can also be considered. Applying the concept of composite estimation to the NSCG should be relatively straightforward since the sample components (rotation panels) are clearly defined. Developing a suitable variance estimator will require some thought. Note that both composite estimation and estimation for longitudinal analysis use survey responses spanning multiple time periods, but the goal of composite estimation is to produce cross-sectional estimates (in the case of the NSCG, estimates for the latest year of the survey).
RECOMMENDATION 4-8: The National Center for Science and Engineering Statistic should evaluate whether composite estimation techniques could be used to improve the National Survey of College Graduates and possibly the Survey of Doctorate Recipients estimates.
Model-Based Methods: Small Area Estimation
Because of the interest in highly detailed estimates (for example, by occupation, by field of study, and for various subpopulations), it is worth exploring the use of small domain estimation, more commonly referred to as small area estimation, techniques (Rao and Molina, 2015) for the NCSES workforce surveys. Using occupation as an example, it may be possible to group certain occupations into sets, where the behavior of units in each set is thought to be similar (with respect to variables of interest). If this grouping effort is successful, it will be possible to use small area estimation methods to “borrow strength” within a set, allowing better estimates for occupations (or for occupation by domain, such as race and gender) that
have small sample sizes. In fact, if this approach is successful, it should be possible to reduce the sample size in some strata and either allocate the resources to other parts of the sample or invest the savings in data collection (e.g., better tracing in subsequent waves).
A good starting point would be to try the basic area-level model. Let y be the variable of interest (e.g., average income for different occupations). Then for occupation i, the survey estimator yi is assumed to follow the model
yi = θi + ei,
where θi is the true average, and ei is the sampling error. The model assumes the existence of auxiliary variables that are related to income via the model
![]()
The “borrowing of strength” occurs via the parameter β, which will be estimated using sample data from all the occupations in a set. The literature contains numerous approaches to applying this model, with the greatest challenge being the need to estimate the variances of ei and εi. The model can be generalized in different ways, including by adding the time element (the parameter of interest becomes θit). If suitable auxiliary information is available, it is also possible to consider using a unit-level rather than an area-level model.
If the research centers of excellence discussed in Chapter 6 were established, the potential uses of small area estimation techniques could be explored through that mechanism.
RECOMMENDATION 4-9: The National Center for Science and Engineering Statistics (NCSES) should evaluate whether small area estimation techniques could be used to enable reducing the sample size in some strata, thereby reducing the variability of the sampling rates used across strata and also perhaps freeing resources for use toward other NCSES objectives.


