
5
Data Collection and Processing
As described in Chapter 2, the Survey of Graduate Students and Postdoctorates in Science and Engineering (GSS) and Survey of Earned Doctorates (SED) are censuses, with a high degree of involvement from the relevant educational institutions. Over time, data collection procedures have been developed that result in very high response rates. The GSS collects data from approximately 700 academic institutions annually. Respondents are institutional coordinators who are asked to provide aggregate data on graduate students enrolled in science, engineering, or selected health field organizational units (such as academic departments and degree-granting programs) within the institution. The data collection consists of two stages. In the first stage, the list of eligible units at the institution is verified, and in the second stage, the aggregate student data are collected. Coordinators who respond on behalf of the institutions are contacted by e-mail, telephone, and FedEx letter, and they submit the data by Web or data upload or by sending an Excel file. Although the data collection is a substantial undertaking, the GSS has a response rate of more than 99 percent.
The SED is an annual census of individuals receiving doctoral degrees in that year. Unlike the GSS, it collects individual-level data directly from research doctorate recipients, and the initial request for participation comes from the educational institution at the time the degree is granted. This survey provides information on trends in degrees, the characteristics of the doctoral population, and postgraduation plans at the time of graduation. It also serves as an ideal sampling frame for the Survey of Doctorate Recipients (SDR). In administering the SED, NCSES receives substantial help from institutional coordinators because the data collected through the survey are
valuable to the institutions. Asking students to complete the survey as part of the final stages of their graduation also is particularly effective because it is integrated into the graduation process, which marks an important milestone in the students’ lives.
NCSES’s data collection contractor follows up by e-mail, postal letter, postcards, and telephone with doctoral degree recipients who do not respond. Although respondents can participate in the SED by Web, mail, or telephone, NCSES has successfully transitioned the survey from a primarily paper-based data collection (whereby students returned completed mail questionnaires to the institutional coordinators, which were then forwarded to the data collection contractor) to a primarily Web-based survey (whereby responses are transmitted directly to the data collection contractor). Given the synergy of interests in having these data available and the resulting assistance from institutional coordinators, the response rates for the SED are typically 90 percent or higher. Although maintaining these response rates is becoming increasingly difficult as part of a trend that affects all surveys, the data collection procedures appear well suited to maximizing response rates efficiently.
This chapter focuses primarily on the National Survey of College Graduates (NSCG), the SDR, and the Early Career Doctorates Survey (ECDS). These three sample-based surveys have the most complex data collection procedures and face increasing implementation challenges at a time when the composition of the science and engineering workforce is undergoing rapid changes—in other words, at a time when the ability to produce high-quality measures of employment characteristics is more important than ever. These changes in the composition of the workforce also mean that the composition of the survey samples may be changing in ways that warrant adjustments to the data collection procedures.
OVERVIEW OF DATA COLLECTION PROCEDURES FOR THE WORKFORCE SURVEYS
NSCG
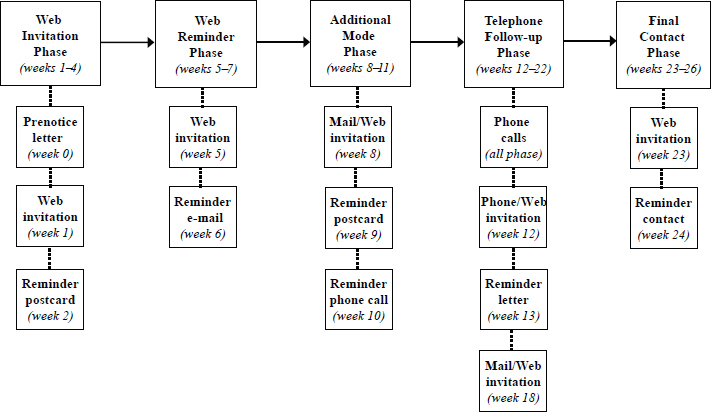
As discussed in Chapter 4, the NSCG has a rotating panel design that uses the American Community Survey (ACS) as a sampling frame for new cases. NSCG sample members are contacted by letter, by postcard, by telephone, and, in the case of sample members that have provided an e-mail address during a previous round of the survey, by e-mail (see Figure 5-1 for the contact strategy). Sample members who are characterized as having a low propensity to respond and a large sample weight are offered a $30 prepaid incentive.
SOURCE: Finamore (2016).
In 2015, the overall NSCG response rate was about 70 percent, slightly lower than the 74 percent response rate in 2013. This survey also was transitioned successfully to a “Web first” strategy, with mail and telephone response modes offered later in the data collection. This change increased the percentage of responses received by Web from 35 percent in 2010 to 77 percent in 2015 at considerable cost savings for the overall data collection (Finamore and Dillman, 2013). The remaining responses included 15 percent by mail and 8 percent by telephone. Although the great majority of responses are now received by Web, mail and telephone remain important modes of contact with sample members, and indeed the initial Web invitation is sent by postal letter (see below for detailed discussion).
As is the case for any longitudinal survey, one challenge for the NSCG is panel attrition. Because differential attrition and its impact on data quality are of particular concern, the NSCG design limits the number of followups to four rounds of biennial data collection. In other words, sample members remain in the survey for three rounds after the initial survey cycle. Since 2010, to minimize attrition bias, sample members who participated in the initial interview have been considered eligible for follow-up, regardless of the case’s disposition in other, previous follow-ups. In the 2015 NSCG, this approach resulted in a 53 percent unconditional response rate for the
sample obtained from the 2009 ACS. The conditional response rate was 80 percent among those who had responded in the previous round and 26 percent among those who had not responded in previous rounds.
SDR
The SDR survey sample is based on the SED census. Most SDR sample members are contacted approximately 2–3 years after their participation in the SED, and they receive follow-ups every 2 years until they reach the age of 76 or otherwise become ineligible. Sample members are contacted by letter, postcard, e-mail, and telephone. Figure 5-2 shows the SDR contact strategy. Over the years, NCSES has continued to refine the incentive strategy for the SDR. The survey currently uses a prepaid incentive of $30, strategically targeted to reduce nonresponse bias depending on the sampling group and whether an incentive was needed for the sample member in previous rounds of data collection. The survey achieves a response rate
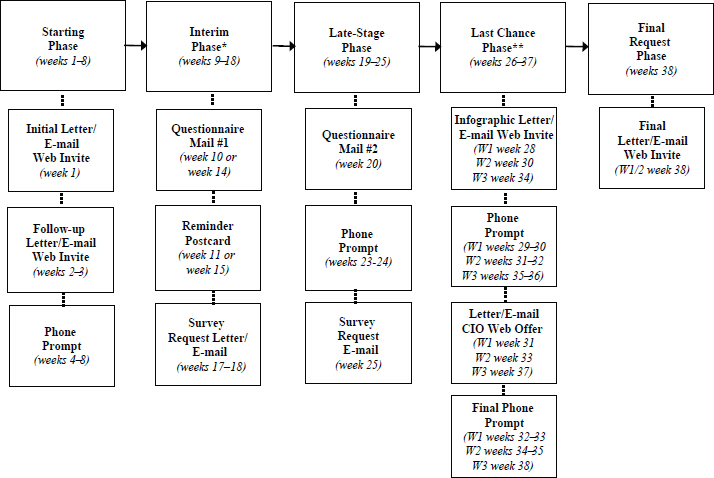
*There was a partial contacting hiatus during weeks 5–13.
**To allow adequate locating of newly selected sample member, the Last Chance contact sequence was deployed in three waves as cases continued to be found.
SOURCE: Finamore (2016).
of about 63 percent. In 2015, 82 percent of the respondents completed the survey by Web, 10 percent by mail, and 8 percent by telephone.
Nonresponse in the SDR is associated primarily with challenges of locating the sampled individuals rather than with lack of willingness to participate. Sample members with incomplete information in the SED sampling frame and noncitizens tend to be particularly difficult to locate. To increase the proportion of cases that are successfully located, the NCSES data collection contractor performs several locating activities prior to the beginning of the field period (and prior to contact with sample members).
ECDS
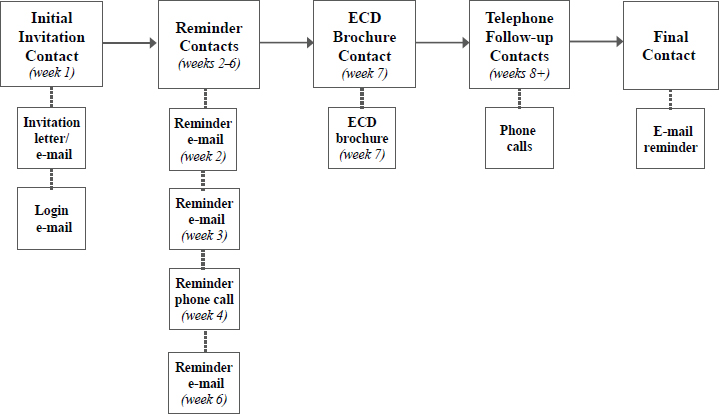
As discussed in Chapter 2, the ECDS is only now moving to full implementation, following completion of a pilot test that NCSES judged to be successful. The survey has a two-stage sample design that involves a stratified probability sample of institutions in the first stage and a stratified probability sample of individuals in the second stage. For the pilot, a combination of mail, e-mail, and telephone contacts was used for both the institutional contacts and individual sample members. Institutional coordinators were asked to submit lists of eligible employees electronically, and NCSES’s data collection contractor drew from these lists samples of individuals to be contacted. Pretesting showed that having someone from an institution reach out to individual sample members led to higher compliance relative to initial contact from the National Science Foundation, so institutional coordinators were asked to send an initial e-mail introducing the survey. Following the initial contact, NCSES’s data collection contractor managed the subsequent follow-ups. The response rate for the pilot study was 56 percent. Sample members could respond by Web or telephone, and the Web was used by nearly all respondents (99.5%) during the pilot test. Figure 5-3 shows the sequence of contacts with individual sample members for the ECDS.
Table 5-1 summarizes the key data collection characteristics of the NCSES education and workforce surveys. The remainder of this chapter focuses on aspects of the data collection and processing that would particularly benefit from changes or enhancements.
DATA COLLECTION MODES
NCSES has been actively researching the optimal use of different data collection modes for its science and engineering workforce surveys. The question of how to optimize the use of different modes to increase contact, encourage cooperation, enhance data quality, and reduce costs is complex and dependent on the target population and types of questions asked.
SOURCE: Finamore (2016).
Ongoing research is needed in this area for a number of reasons. First, there is an intricate interdependence among the different modes of contact and different response options. Even if Web responses are the goal or the only response mode offered, contact through another mode, such as mail or telephone, often is necessary, and combining modes in this way can substantially boost response rates. Mail contact, such as an advance letter, also can serve the purpose of legitimizing the survey and delivering incentives to respond. Second, from a respondent’s perspective, the relative importance and desirability of different modes of communication and response are constantly evolving. It is increasingly more difficult to reach sample members by voice telephone, while the role of electronic communication, particularly by smartphone, is increasing. Third, although NCSES’s definitions of the target populations for its surveys have not changed substantially in recent years, the characteristics of the samples are constantly evolving. For example, the increase in sample members residing abroad presents new challenges in terms of locating and communicating with them.
Consequently, one area of research that deserves further consideration is the optimal mix of modes of contact and modes of response that are offered or encouraged. A related issue is the optimal use of incentives. NCSES has been evaluating these issues with particular emphasis on the NSCG, which must begin with contact by mail in the first year of data collection
because other forms of contact information from the ACS sampling frame are more limited. At the end of the NSCG, respondents are asked to provide telephone and email information, which enables follow-ups through multiple modes in subsequent waves. The use of multiple contact modes improves response rates because the survey reaches a larger proportion of the sample members and because using a variety of modes to communicate with sample members offers multiple opportunities to deliver persuasive messages.
Although NSCG sample members are contacted initially by mail, they are asked to complete the survey by Web, and a mail questionnaire generally is not provided until later stages in the follow-up process. As discussed above, this “Web first” data collection strategy, tested in 2010 and fully implemented starting with the 2013 NSCG, substantially increased responses by Web. NCSES has found that the use of this approach maintains the overall response rate at a lower cost relative to either telephone or paper questionnaire first strategies (Finamore and Dillman, 2013).
One question that deserves consideration is whether it is worthwhile to continue providing a mail response option in the later stages of the data collection, or the mail contact could simply direct sample members to the Web after a paper questionnaire has been included once. A mail response option is expensive because the questionnaires must be printed, and the responses must then undergo data entry or scanning. Eliminating the paper questionnaires altogether also could greatly increase the flexibility of the survey instruments because electronic modes can more readily accommodate complex branching and the tailoring of questions on the basis of information available from prior rounds of data collection or from other data sources, such as administrative records. In addition, limiting the response options to Web and telephone would make matrix sampling options, or the use of topic modules, more feasible. However, the implications of eliminating the mail response mode would need to be carefully researched, particularly in light of the rapid decline in the acceptability of voice telephone as a response (and contact) mode, and because the mail contact mode would still be necessary even if a questionnaire were not mailed.
NCSES collected data and carried out experiments to better understand the role of the mail questionnaire, particularly in the NSCG. When respondents are asked about their response mode preferences at the end of their first NSCG questionnaire, somewhat fewer than one in five indicate that they would prefer to complete the survey via a questionnaire sent by mail. In the 2015 NSCG, approximately 15 percent of the returned sample responses were received by mail, but among those who indicated a preference for a mailed questionnaire in 2013 and completed the survey in 2015, just over half (54%) responded by mail (approximately 40% completed the survey by Web and 7% by telephone) (information provided by NCSES
TABLE 5-1 Key Data Collection Characteristics of the NCSES Education and Workforce Surveys
| Survey | Target Population |
|---|---|
| Survey of Graduate Students and Postdoctorates in Science and Engineering (GSS) | Graduate students, postdoctoral appointees, and doctoral-level nonfaculty researchers at a U.S. academic institution granting research-based master’s or doctoral degrees in science, engineering, and health fields (information collected from institutional coordinators) |
| Survey of Earned Doctorates (SED) | Recipients of research doctorate degrees in any field, graduating from U.S. academic institutions |
| National Survey of College Graduates (NSCG) | Individuals living in the United States who have at least a bachelor’s degree in any field |
| Survey of Postdocs at Federally Funded Research and Development Centers (FFRDCs) | Postdocs employed at the FFRDCs |
| Survey of Doctorate Recipients (SDR) | Individuals with a science, engineering, or health research doctorate degree from a U.S. academic institution (sample based on the SED) |
| Early Career Doctorates Survey (ECDS) | Postdoctoral fellows and other doctoral degree recipients working at a U.S. academic institution, at an FFRDC, or in the National Institutes of Health Intramural Research Program who received a doctorate-equivalent degree in the past 10 years in any field and any country |
at the panel’s request). To potentially increase the efficiency of subsequent contacts, information collected from respondents when they first participate in the survey could be expanded to include questions about access and preferences for desktop computers, tablets, and smartphones, and to obtain permission for contact by text messages. However, the cost implications of further customizing modes of contact would have to be carefully researched, in particular in comparison with strategies that encourage participation by a certain mode (such as the Web-push strategy). Research on the impact of telephone contact could be focused on attempting to determine the type
| Data Collection Frequency | Contact Modes | Response Modes | Response Rates (most recent year available) | Incentives |
|---|---|---|---|---|
| Annual | E-mail, telephone, letter | Web, data upload, Excel file | Overall: 99.5% Web: 89.0% Data upload: 9.8% Excel file: 1.1% |
None |
| Annual | E-mail, letter, postcard, telephone | Web, mail, telephone | Overall: 90.2% Web: 93.0% Mail: 5.4% Telephone: 1.6% |
None |
| Biennial | Letter, postcard, e-mail, telephone | Web, mail, telephone | Overall: 70% Web: 77% Mail: 15% Telephone: 8% |
$30 prepaid for a subset of the respondents |
| Periodic (every 2–3 years) | Letter, e-mail, telephone | Web | 100% | None |
| Biennial | Letter, postcard, e-mail, telephone | Web, mail, telephone | Overall: 63% Web: 82% Mail: 10% Telephone: 8% |
$30 prepaid, depending on case |
| To be determined | Letter, e-mail, telephone | Web, telephone | Overall: 56% Web: 99.5% Telephone: 0.5% |
To be determined |
of phone the respondent has and to examine the role of caller IDs, leaving messages, and sending text messages as reminders.
The 2015 NSCG included an experiment that varied when the mail questionnaire was first provided to returning sample members. The four experimental conditions were as follows: (1) mail questionnaires in weeks 8 and 18 (control group), (2) mail questionnaire in week 8 and Web invitation in week 18, (3) Web invitation in week 8 and mail invitation in week 18, and (4) Web invitations in weeks 8 and 18. Respondents who had indicated a preference for a mail questionnaire in a previous round
were randomly assigned to one of the four groups, but also received a mail questionnaire in week 1. The overall response rate across modes did not vary by experimental condition. However, there was a small difference in when people responded: the use of a paper questionnaire in week 8 rather than a Web invitation resulted in an incremental response rate increase of approximately 2 percentage points.
While this research provides valuable insight into the potential consequences of removing the mail response option, further research is needed on the role of the paper questionnaire. A mailed questionnaire appears to make a difference even if sample members choose to respond by a different mode. There are several possible explanations for this finding. For some respondents, the ability to see the questions ahead of time clarifies the purpose of and expectations for the study and so removes a barrier to completing the survey. This informative function of a paper instrument may be particularly important for sample members who are new to the survey. Another possible explanation is that a mailing including a paper questionnaire simply serves as an additional form of communication differing from previous ones, and boosts response rates in the same way as other strategies focused on varying the types of contact and incentives. It is possible that increased telephone contact could serve a similar function for at least a subset of respondents, but contacting sample members by telephone is becoming increasingly difficult and less cost efficient.
NCSES has a commendable record of conducting experiments to improve the response rates and control the costs of its surveys, complemented by publishing the survey results and making them accessible to the scientific community, including other statistical agencies facing similar challenges. Continued investigation into the interaction among mode of contact, mode of response, and the timing and amount of incentives will be needed as the characteristics of the sample change over time. Again, research conducted in this area by other government agencies, such as the Census Bureau’s research for the 2020 census and ongoing research for the ACS, could provide useful insights on which to build.
RECOMMENDATION 5-1: The National Center for Science and Engineering Statistics (NCSES) should continue to research the optimal mix and sequence of contact, response modes, and incentives. Lessons learned from the National Survey of College Graduates should be evaluated in the context of the other surveys, particularly the Survey of Doctorate Recipients. NCSES should ensure that costs are tracked in sufficient detail, for both new and continuing participants, to enable sophisticated comparisons of the different options, along with the implications for data quality.
SURVEY CONTENT
The content of the NCSES surveys has undergone many changes over the years as the agency has attempted to keep the questionnaires current and anticipate data needs for the near future. As discussed in Chapter 3, there are emerging data needs that could be met by changes ranging from relatively modest additions to the questionnaires (e.g., adding some of the questions from the ECDS to the SDR, and possibly to the NSCG) to the development of modules that could be used to accommodate data collection on more complex topic areas (e.g., modules based on the ECDS content, such as professional activities or work–life balance, or a module on entrepreneurship and innovation). New questions or modules could be particularly useful if the content were coordinated across all of the surveys to which it is applicable, which is in line with how NCSES has always approached the development of new questions.
A major challenge for NCSES when considering questionnaire updates is that the surveys serve an essential role in monitoring trends. In addition to new data needs, however, the relatively rapid changes in the workforce discussed in this report necessitate continuous review and updating of the terminology used in the existing questions. As discussed in Chapter 3, for example, the question on training needs to be updated to prompt respondents to consider newer forms of training in their responses. Sources of funding for education represent another key area of interest that undergoes constant changes the questionnaires need to reflect. Some questions could simply use further refinement because they may be too technical or ask about circumstances with which many respondents may not be familiar. For example, the SED question on tuition remission asks respondents whether they received a “full or partial tuition remission (waiver).” It is not clear whether graduate students would know whether they had received an out-of-state tuition remission or whether they would consider any tuition they had not paid out of pocket as “waived.”
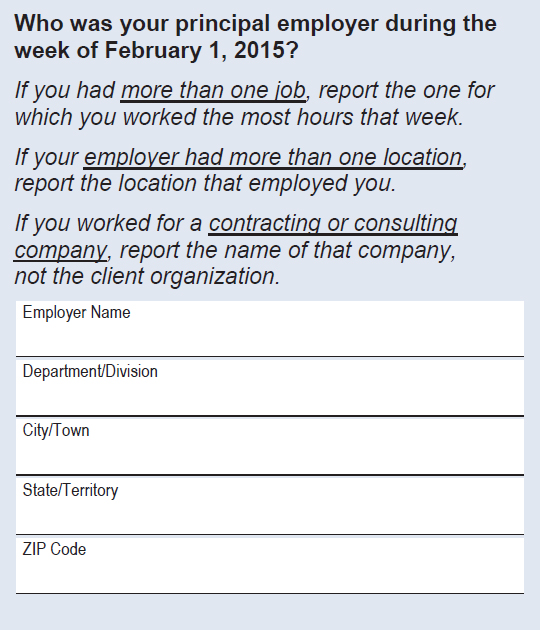
Participants in the workshop held for this study (see Chapter 3) indicated that in its current form, the questionnaire item about the employer’s location may become increasingly less informative as more people telework or work from locations other than where their employer is located. Figure 5-4 shows the current question wording, including the respondent instructions, which attempt to capture unconventional scenarios. NCSES has tested this approach, but it is not clear whether increasingly more complex working arrangements mean that fewer respondents are able to interpret the question as it was intended. It is also possible that tailored approaches using a series of simpler questions (e.g., “Did you have more than one job?”, “Did your employer have more than one location?”) rather than instructions might yield more reliable and valid answers.
SOURCE: National Survey of College Graduates Questionnaire. Available: https://www.nsf.gov/statistics/srvygrads/surveys/srvygrads-newrespond2015.pdf [December 6, 2017].
Keeping concepts and terminology current is an ongoing challenge for all longitudinal surveys, and there is no well-developed methodology for doing so. Nonetheless, periodic and regular reassessment of concepts and terminology is needed in any longitudinal study. Regular programs of cognitive interviewing, ongoing random probes (Redline, 2013; Schuman, 1966), and feedback from analysts who work with specialized subpopulations each could contribute to the process, as could the outside advisory mechanism discussed with and/or included in Recommendation 3-10 in Chapter 3.
New topics also emerge as times change. When NCSES identifies the need for new content areas, it needs to continue to carry out a full development program that includes a literature review, input from stakeholders, question development and testing, and usability testing for the instrument
across all modes. New items need to be considered for inclusion in all surveys for which they are relevant, either as core questions or as topical modules, to promote comparability of data across surveys. The potential impact of any new items on trend data needs to be researched and tested with particular care, and possibly benchmarked when new items are introduced.
RECOMMENDATION 5-2: The National Center for Science and Engineering Statistics should continue to monitor, and formally evaluate as needed, the content of its survey questionnaires to ensure that the concepts and terminology are up to date and familiar to respondents. Changes should be implemented with careful consideration of their impact on trend data.
Topic Modules
As discussed in Chapters 3 and 4, increased reliance on topic modules is a potential solution that could reconcile the need to provide fine-grained data on core questions with the need to gather detailed data periodically for an in-depth understanding of certain topics. To a limited extent, NCSES already relies on questionnaire structures that include core topics and occasional modules, but the modules are essentially special topics that are administered to the entire sample. At the other end of the spectrum, as discussed in Chapter 4, true matrix sampling is difficult to implement and produces datasets that are difficult to use. Looking forward, it may be possible to move closer to a middle-ground approach, particularly if the surveys become less dependent on paper-and-pencil questionnaires (see below) and if greater integration can be achieved with administrative records databases that could trigger custom surveys for subsets of the sample.
From an implementation perspective, the first round of data collection for each sample member would have to be a comprehensive survey, likely without modules. Some of the data collected during this initial round could then be used to target modules in subsequent rounds. For example, those working in the private sector could receive questions about training, skills, and experiences specific to this sector. As discussed in Chapter 4, it might also be possible to integrate the ECDS with the SDR and administer to early career sample members modules applicable to them. This approach would require incorporating a career life-cycle perspective into the selection of the survey content and modules. Samples for various modules could be staggered in replicates to smooth fieldwork (possibly moving to year-round data collection) and management. With a design of this type, early replicates could be used to obtain data that would in turn be used to improve estimates and fielding of later replicates, as is done for the National Survey of Family Growth (Centers for Disease Control and Prevention, 2015).
As discussed in Chapter 3, the use of topic modules may increase not only the complexity of the survey but also response burden. Greatly increasing the length of the survey instruments may not be feasible in light of the need to adapt them for smartphone administration (see below). A series of shorter follow-up surveys could be considered instead of periodic longer surveys, with intervals determined by the stage in a person’s career or potentially information from administrative records. This approach could increase costs and could also adversely impact participation rates. If the surveys were viewed as true panel surveys, however, it might be possible to further refine contact and incentive strategies that would facilitate more frequent follow-ups. Techniques to this end could include obtaining more detailed contact information (such as multiple e-mail addresses) and more information about available technologies (desktop, tablet, smartphone) and preferred modes of contact. Sample members also could be asked about the likelihood of their moving or changing jobs in the near future.
An additional consideration for the use of modules is that if the questionnaires became highly customized, resulting context effects could have an impact on the trend data available for the other items, and potentially the core items, on the surveys.
Government surveys exist that use topic modules in a variety of different ways, and the experiences of other agencies could provide valuable insights to NCSES. Some of the surveys that could be reviewed are the National Health Interview Survey, the Survey of Income and Program Participation, and the Current Population Survey.
RECOMMENDATION 5-3: Looking ahead, the National Center for Science and Engineering Statistics (NCSES) should explore placing greater reliance on topic modules to address the need for occasional detailed data on selected topics for subgroups. NCSES should evaluate whether the challenges associated with implementing topic modules might be reduced and the benefits increased as a result of the recent increased reliance on the Web mode, as well as potential integration with data from administrative records and the development of tailored field procedures to reduce respondent burden (see Recommendation 3-2 in Chapter 3).
Optimizing the Survey Instruments for Smartphones
One area that deserves attention going forward is the increasing use of mobile devices to access Websites, including Web surveys, because this trend has challenging implications for the design and content of the NCSES survey questionnaires. In the 2015 NSCG, approximately 4 percent of Web surveys were completed by smartphone and an additional 8
percent by tablet computer (see Table 5-2). These numbers, and particularly respondents’ expectations for seamless interaction with a Web instrument on a smartphone, are likely to increase over the coming years. As new modes of data collection have been introduced, NCSES has worked on redesigning its questionnaires to reduce measurement error and minimize potential mode effects across the mail, voice telephone, and Web modes. For example, many of the long “check-all that apply” lists have been replaced with “yes/no” questions as a result of research supported by NCSES (Smyth et al., 2006, 2008). NCSES also undertook a research project to optimize the 2017 NSCG instrument for mobile devices. If the server detects that a mobile device is being used for the NSCG, the layout will adjust to provide larger font, buttons, and spacing and to eliminate the need for horizontal scrolling. Additional research could focus on revising remaining questions with relatively long lists of answer options and on turning definitions and instructions into questions (e.g., asking how many classes of a particular type people took instead of instructing them to exclude such classes) as part of an overall effort to unify the instrument construction across modes.
The challenge of adapting complex surveys to smartphones is not unique to NCSES, and best practices for meeting this challenge have not yet been widely developed and accepted in the survey industry. Research in this area is ongoing, and NCSES needs to continue to monitor new developments and conduct research on potential advancements. This research needs to be expanded to all of the agency’s science and engineering workforce surveys.
TABLE 5-2 National Survey of College Graduates Web Survey Response by Device, 2013 and 2015
| 2013 NSCG | Number of Web Respondents | Mean Completion Time | Median Completion Time | |
|---|---|---|---|---|
| Device | Smartphone | 766 | 35.8 | 32.1 |
| Tablet | 5,595 | 30.0 | 26.2 | |
| Desktop/Laptop | 56,021 | 27.8 | 24.2 | |
| 2015 NSCG | Number of Web Respondents | Mean Completion Time | Median Completion Time | |
| Device | Smartphone | 2,123 | 31.0 | 27.7 |
| Tablet | 4,644 | 28.3 | 25.4 | |
| Desktop/Laptop | 52,676 | 25.8 | 22.5 | |
SOURCE: Fiegener and Finamore (2016).
RECOMMENDATION 5-4: The National Center for Science and Engineering Statistics should continue to conduct research on ways of optimizing its surveys for smartphone administration and to monitor further developments in questionnaire administration and response technology. This research should be conducted toward the overall goal of unifying the instrument construction across the different survey modes and, to the extent applicable, the different surveys.
MAINTAINING PANEL PARTICIPATION AND RESPONSE RATES
NCSES has a number of completed and ongoing research projects focused on maintaining participation and response rates. In recent years, the agency also has begun implementing adaptive design, which enables researchers to tailor data collection decisions in ways that optimize costs and data quality. NCSES began experimenting with adaptive design for the NSCG in 2013, and the 2015 mode experiments described above can be considered part of these efforts. NCSES found that active data monitoring and adaptive data collection interventions during the fieldwork improved representativeness. The agency is gradually building up research to inform possible interventions, such as targeted questionnaire mailing, special routing or handling of cases in the telephone mode and prioritization of calls, and changes to the default response mode for subsets of the cases. Adaptive design also was implemented in the SDR in 2015, with the goals of cost-efficiently minimizing response bias and maximizing the representativeness of key domains.
The use of paradata, such as the use of information from contact histories to tailor subsequent contacts, can prove especially useful in guiding decisions about follow-ups. The potential use of information from external data sources, such as the unemployment insurance earnings database, is another area that needs to be explored in the context of adaptive design, particularly for the NSCG (see Chapter 3).
NCSES’s collaboration with the Census Bureau to assess the potential feasibility of using alternative data sources to expand the usefulness or efficiency of the NSCG also could be expanded to include the use of administrative data, such as information from the unemployment insurance earnings database, in the data processing stages to evaluate nonresponse bias or subsequently to contribute to nonresponse weights. The possibility of using administrative data in the processing stages of the SDR needs to be considered as well. Although the Census Bureau may not be able to share individual-level data with NCSES for this purpose, particularly for the SDR, which is not conducted by the Census Bureau, a “blinded” process could be developed to obtain group characteristics for batches of sample members, based on limited identifying information sent to the Census Bureau.
Experiments conducted in the NSCG revealed that offering incentives early is the approach that best balances costs, response rates, and the representativeness of the sample. NCSES also found that offering incentives to past incentive recipients increases response rates and representativeness. The agency continues to experiment with and refine the optimal use of incentives, and this research could be expanded to evaluate whether certain types or timing of incentives can further increase Web response among subgroups of respondents.
Research in the area of adaptive design is still in the early stages, but the development of strategies that increase the flexibility of large government data collections such as the NSCG and the SDR has promising implications for increasing efficiency. This type of research is particularly useful in balancing considerations related to increasing participation, reducing nonresponse, and controlling costs. Publishing research on these topics in methodological journals also is important to expand knowledge in the area in general and enable others to build on NCSES’s work.
As discussed, the NCSES surveys face particular nonresponse challenges due to panel attrition, which has at least two components: those who are difficult to locate and those who may not be motivated to participate. In the case of both the NSCG and SDR, these two causes contribute about equally to nonresponse, although there are differences among subgroups.
While NCSES has worked continuously to build on the latest research in the field toward improving response rates overall, the understanding that could be gained from the experience of other longitudinal studies in particular may be underutilized. The repertoire of techniques used to maintain high response rates for several large-scale longitudinal government surveys could be considered. Although such techniques as sending newsletters with study results involve expense, these contacts without a request can communicate to sample members that their contributions are appreciated and cultivate a sense of ownership. These techniques also can help with keeping address lists current, which is particularly important for keeping in touch with sample members who move overseas.
RECOMMENDATION 5-5: The National Center for Science and Engineering Statistics should continue research aimed at expanding the use of adaptive design in the National Survey of College Graduates and Survey of Doctorate Recipients. Experiments involving contact schedules, incentives, and modes should focus on the goals of increasing participation, reducing nonresponse bias, and controlling costs.
RECOMMENDATION 5-6: The National Center for Science and Engineering Statistics should evaluate the feasibility of using administrative data, such as unemployment insurance earnings data, to inform adaptive
design, address nonresponse due to lack of contact information, conduct nonresponse bias analysis, and develop nonresponse weights.
RECOMMENDATION 5-7: The National Center for Science and Engineering Statistics (NCSES) should consult with other agencies that have longitudinal government surveys in their portfolios to identify techniques they have used successfully to increase the ability to locate sample members, motivate continued participation, and prevent panel attrition in the surveys. NCSES should develop an integrated approach to building and maintaining relationships with panel members and evaluate its success. Insights from research on these strategies should then be shared with other agencies.
DATA PROCESSING
One of the desires voiced most frequently by data users during the workshop held for this study was for more timely data. Given the increase in Web responses and continuous improvements in data cleaning and data entry procedures in general, it may be worthwhile to evaluate the data processing procedures for the science and engineering workforce surveys to assess (1) whether all types of errors that are found and corrected are sufficient in number to warrant the time and expense, and (2) whether any steps in the process lead to delays in public release of the data. Steps that do not result in quality improvement (e.g., cleaning of data from Web surveys) might then be reduced, and steps that lead to delays in data release might require redesign. Research conducted in the area of establishment surveys could provide a perspective that NCSES has not yet explored (see Biemer and Lyberg, 2003; Smith et al., 2003).
RECOMMENDATION 5-8: The National Center for Science and Engineering Statistics should evaluate the data processing methods used for the surveys to identify potential opportunities to increase efficiency and the timeliness of data releases.


