
6
Estimating the Cost of High-Quality Early Care and Education
Estimating the cost of providing high-quality early care and education is a critical first step in developing a financing system designed to ensure access to high-quality early care and education for all children. The total resources that need to be invested to achieve a high quality, highly accessible early care and education (ECE) system include the costs to providers of delivering quality early care and education as well as the costs of system-level supports. The total resources minus any family contributions (in the form of out-of-pocket payments) yields the amount that public and/or private groups will have to provide to fully fund access to high-quality early care and education for all children.
This chapter first describes the elements that contribute to the cost of providing high-quality early care and education with a highly qualified workforce, as outlined in the Transforming report (Institute of Medicine and National Research Council, 2015). The second section of the chapter presents the committee’s illustrative estimate of the total cost of providing high-quality early care and education for all children from birth to kindergarten entry, based on a hypothetical set of policy specifications and assumptions. The third section describes one way to structure family contributions to ECE costs to be progressive across income groups, such that access to quality ECE options is not limited by families’ income levels. Based on the committee’s estimate of the cost of a high-quality system, the chapter concludes with an illustrative calculation of the share of funding that would need to be supported by public or private sources—that is, the total cost of a high-quality and accessible ECE system minus the aggregate family contribution to the cost—and places these costs in context.
COST ELEMENTS OF HIGH-QUALITY EARLY CARE AND EDUCATION
Consistent with the Transforming report, the committee identified the following quality-related cost elements of providing high-quality early care and education with a highly qualified workforce.1 The first cost element comprises onsite costs, which include the costs of maintaining appropriate staffing levels and structures; compensating a high-quality staff; providing onsite staff supports and professional development; and nonpersonnel items such as curriculum, facilities, and equipment. Second are system-level costs in two categories. One consists of workforce development supports, including offsite training, ongoing professional learning, and higher education. The second category of system-level costs includes those related to quality assurance and improvement, such as monitoring and regulation, quality and systems improvement and accountability, data systems, and licensing and accreditation.2
Onsite Costs
Onsite costs are determined by staff qualifications and compensation; staffing levels and structures; staff supports; operating hours and days; and nonpersonnel costs such as curricular materials, facilities, and equipment.
___________________
1 It is difficult to pinpoint the drivers of costs for home-based ECE settings, since providers are working out of their homes, often with assistance from family members, and balancing an array of activities across a typical day or week. What they charge families is a combination of their own financial needs, the families’ ability to pay, the prices of alternatives such as center-based ECE, and costs related to their specific location. These cost differences result in different market dynamics and highly variable costs of delivering high-quality services in home-based settings; in addition, the data needed to estimate these costs are limited.
2 In Chapter 3, we discussed the financing mechanisms that support direct service delivery as separate from mechanisms for compensation to attract and retain a highly qualified workforce, professional development and higher education, facilities, and quality assurance and improvement. In the current system, payment for direct service delivery covers basic, day-to-day care, with routinely inadequate compensation for ECE professionals and little or no money to support professional development, facilities, and quality assurance and improvement. Because of the siloed nature of current ECE financing, that chapter examined the financing mechanisms for each component of ECE separately. In this chapter, which explores the true cost of a comprehensive, harmonized, and high-quality ECE system, the committee looks at the costs in three categories: costs that are incurred on site (including facilities, compensation, staffing, and professional support), costs that are incurred at the system level to support the workforce (ongoing learning, workforce development, and higher education), and quality assurance and improvement costs (e.g., licensing, data and accountability systems). The committee emphasizes that all of these costs should be financed together, with a harmonized system of financing mechanisms as described in Chapter 7, but for ease of reading, the committee discusses the onsite costs, offsite workforce supports, and system-level quality assessment and improvement costs in separate sections of this chapter.
Staffing Levels and Structures
Like staff qualifications and compensation, staffing levels and structures greatly affect site-level costs and are important elements of providing high-quality early care and education.3 ECE staffing levels and structures differ from those typically found in kindergarten to grade 12 (K–12) classrooms. Whereas a K–12 educator typically works alone (although some educators of younger children have the assistance of an aide or paraprofessional), teaching in early care and education is a collective effort, which requires more than one educator–staff member in most situations because of the needs of very young children. At least two or more ECE staff (educators or assistants) are generally required to be in the classroom at all times to meet required child-to-staff ratios, which are lower for early care and education than for elementary schools (Whitebook, 2014). The need for more educators in the classroom to meet these lower ratios increases the total cost of providing services. However, classrooms typically are staffed by a lead educator with assistants who have lower qualifications, which reduces the cost per child.
Current state licensing standards and recommendations from the National Association for the Education of Young Children (NAEYC) suggest the staffing levels to apply when estimating the costs of a highly qualified and well-compensated ECE workforce. The requirements for child-to-staff ratio vary by age of children and by state. Table 6-1 shows the range of child-to-staff ratios required under state licensing regulations; Table 6-2 shows the range of child-to-staff ratios and group size requirements recommended by the NAEYC as “best practices.” Some European countries use higher child-to-staff ratios (see, e.g., Kagan et al., 2002); however, comparability to the United States is unclear, especially given more extensive training for entry-level educators in Europe and the higher percentage of children living in poverty and dealing with chronic stress in this country.
___________________
3 Research highlighted by the American Academy of Pediatrics, the American Public Health Association, and the National Resource Center for Health and Safety in Child Care and Early Education (2011) in their national health and safety performance standards guidelines has found that children benefit from being placed in groups with lower child-to-staff ratios. According to studies by Alkon and colleagues (2008), Benjamin and colleagues (2007), and Dellert and colleagues (2006), lower child-to-staff ratios result in more sensitive and appropriate care and children in these groups score higher on developmental assessments, particularly vocabulary, than children in groups with higher child-to-staff ratios. Group size is also important because small group sizes and low child-to-staff ratios allow for continuing adult support and guidance while encouraging children to undertake independent, self-initiated play and other activities (Gupta et al., 2005). In addition, children’s physical safety and sanitation routines require a staff presence that is not fragmented by excessive demands. Staff stress levels are also affected by child-to-staff ratios. Caring for too many young children, in particular, increases the possibility of stress to the educator, and may result in the educator showing diminished executive function (Isbell et al., 2013; Whitebook and Sakai, 2004).
TABLE 6-1 Range of Child-to-Staff Ratio Requirements for ECE Centers (2011)
| Age of Children | Lowest Required Ratio | Number of States | Highest Required Ratio | Number of States | Most Common Ratio | Number of States |
|---|---|---|---|---|---|---|
| Infants | ||||||
| 6 weeks | 3:1 | 3 | 6:1 | 4 | 4:1 | 33 |
| 9 months | 3:1 | 3 | 6:1 | 5 | 4:1 | 32 |
| Toddlers | ||||||
| 18 months | 3:1 | 1 | 9:1 | 3 | 6:1 | 14 |
| 27 months | 4:1 | 4 | 12:1 | 2 | 8:1 | 10 |
| Prekindergarten | ||||||
| 3 years | 7:1 | 2 | 15:1 | 4 | 10:1 | 23 |
| 4 years | 8:1 | 1 | 20:1 | 2 | 10:1 | 17 |
| School-age | ||||||
| 5 years | 9:1 | 1 | 25:1 | 2 | 15:1 | 14 |
| 10 years | 10:1 | 1 | 26:1 | 1 | 15:1 | 16 |
SOURCE: Administration for Children and Families (2013b, p. 9).
The implication of these requirements is that costs will be higher to provide high-quality early care and education for younger children, as two staff members are required to care for eight toddlers, whereas only one staff member is needed for eight 4-year-olds.
Staff Qualifications and Compensation
Because early care and education is a labor-intensive industry, staff qualifications and compensation, as well as staffing levels and structure (discussed below), largely drive the cost of service. As described in previous chapters, the vast majority of ECE professionals receive low wages with low benefits, which affects their status and well-being and in turn may impede their ability to deliver quality care and instruction to children.4 This situation reflects insufficient levels of resources invested in early care and education and the absence of adequate educational and competency requirements, as well as historical perceptions about the workforce. Significantly higher levels of compensation will be required to recruit and retain a well-qualified workforce of lead educators and assistants, directors,
___________________
4 It is difficult to determine compensation for home-based providers because most home-based providers are not paid a salary and even as the owners of businesses, it can be difficult for them to adequately compensate themselves. According to Ullrich, Hamm, and Schochet (2017, p. 14), “[A]ddressing compensation for the home-based workforce is complex. As small-business owners, family child care providers have some agency around the number of children they care for and the number of hours they work, which affects their revenue.”
TABLE 6-2 NAEYC Recommended Child-to-Staff Ratios Within Group Size
| Age Category | Age Rangea | Group Sizeb | ||||||||||
|---|---|---|---|---|---|---|---|---|---|---|---|---|
| 6 | 8 | 10 | 12 | 14 | 16 | 18 | 20 | 22 | 24 | 30 | ||
| Infant | Birth–15 months | 3:1 | 4:1 | |||||||||
| Toddler/Two | 12–28 months | 3:1 | 4:1 | 4:1c | 4:1 | |||||||
| 21–36 months | 4:1 | 5:1 | 6:1 | |||||||||
| Prekindergarten | 30–48 months (2½–4 years) | 6:1 | 7:1 | 8:1 | 9:1 | |||||||
| 48–60 months (4–5 years) | 8:1 | 9:1 | 10:1 | |||||||||
| 60 months (5 years)–kindergarten enrollment | 8:1 | 9:1 | 10:1 | |||||||||
| Kindergarten | Enrolled in any public or private kindergarten | 10:1 | 11:1 | 12:1 | ||||||||
a These age ranges overlap on purpose. If a group includes children whose ages range beyond the overlapping portion of two age categories, then the group is a mixed-age group. For mixed-age groups, universal criteria and criteria relevant to the age categories for that group apply.
b Group sizes are stated as ceilings, regardless of number of staff.
c Group size of 10 is permissible for this age range, but an additional adult is required to stay within the best practice ratio.
SOURCE: National Association for the Education of Young Children (2017, p. 102). Used with permission. Copyright © 2017 NAEYC®.
learning specialists, and consultants and to support the existing ECE workforce in obtaining the necessary credentials to provide high-quality instruction and care to meet the needs of all children.5 Therefore, the costs of a high-quality system will be much higher than current costs.
While it is clear that current compensation is too low, it is less clear how high compensation needs to be to attract and retain a highly qualified workforce. A labor market approach to compensation indicates that it is most cost-effective for local employers to offer the level of compensation necessary to recruit and retain staff with requisite skills and qualifications for different positions in their local labor market, while taking account of individual differences. The available literature provides two potential perspectives for estimating the necessary levels of compensation: one that identifies comparable occupations and one that considers how a range of attributes are related to compensation.
The first perspective identifies the qualifications and competencies necessary for the selected occupation and the range of compensation required to hire individuals with those qualifications and competencies, as demonstrated by market levels. Using this perspective, one of the important areas of debate that is essential for determining appropriate compensation is determining which sectors of the labor market should serve as relevant bases of comparison for early care and education.
Drawing on the Transforming report, which asserts that teaching children younger than age 5 is as complex as teaching children of ages 5 to 8 and that ECE educators need an equivalent level of preparation, support, and reward as educators of older children, some scholars propose that compensation levels for ECE educators should be on par with that of kindergarten-to-3rd grade (K–3) educators and should be applied to ECE educators, regardless of the ages of children or the type of setting in which they work (see, e.g., Whitebook and McLean, 2017b).6 Thus, they call for
___________________
5 The Transforming report envisions achieving a well-qualified workforce through strengthening foundational knowledge, with demonstrated competencies for all ECE professionals working with children, as well as implementing phased, multiyear pathways to transition to a minimum bachelor’s degree requirement for lead educators. According to the Transforming report, these requirements for higher levels of education, foundational knowledge, and competencies must be linked with fair compensation to recognize the professionalization of the workforce and to ensure workforce recruitment and retention. Without linking qualification requirements to compensation, more-highly-qualified educators will seek higher-paying jobs in other settings or with older children, making recruitment and retention of highly qualified professionals for younger children difficult (Institute of Medicine and National Research Council, 2015).
6 Compensation parity for ECE educators (lead and assistants) with public K–3 educators is defined by Whitebook and McLean (2017b, p. 3) as “parity for salary and benefits for equivalent levels of education and experience, adjusted to reflect differences in hours of work in private settings, and including payment for non–child contact hours (such as paid time for planning).”
compensation parity with K–3 educators among educators in public prekindergarten, Head Start, and other center-based ECE settings.7
In a review of compensation parity policies in state-funded prekindergarten, Barnett and Kasmin (2017) found that currently, six state-funded prekindergarten programs have implemented K–3 compensation parity across all three components of compensation—salary, benefits, and payment for professional responsibilities—for lead educators and assistant educators.8 Six additional programs have extended compensation parity to lead educators alone.9 While states are making progress toward salary parity with K–3 educators for prekindergarten educators, less progress has been made in terms of benefits parity; moreover, for many of these state-funded programs, some components of compensation parity are extended only to educators in public settings, leaving out educators in state-funded center-based settings.10
Barnett and Kasmin (2017) found no evidence that the higher earnings associated with parity for prekindergarten educators came at the expense of access to services for prekindergarten-aged children, as the share of 4-year-olds enrolled in states with salary parity policies is statistically similar to states without a parity policy. The study also found that states with parity policies met, on average, one additional quality benchmark of the National Institute for Early Education Research, suggesting higher levels of support for quality in these states, compared to those without parity policies.11
There are a number of challenges to achieving parity with K–3 educators, including the differences (sometimes actual and sometimes perceived) between the compulsory public K–12 system and market-based early care and education. Particular forces drive K–12 educator compensation—including state constitutional mandates, a high level of unionization, and
___________________
7Whitebook and McLean (2017b) noted that it is important to ensure that pay is adequate for K–3 educators as well, since parity should not be achieved via low pay for educators at any level.
8 The six programs are New Jersey (former Abbott, Early Launch to Learning Initiative, Early Childhood Program Aid), New Mexico PreK, North Carolina Pre-Kindergarten Program, and Tennessee Voluntary Pre-K (Barnett and Kasmin, 2017).
9 The six programs that extend compensation parity only to lead educators in public prekindergarten are Iowa Statewide Voluntary Preschool Program, Kentucky Preschool Program, Maryland Prekindergarten Program, the Missouri Preschool Program, the Nevada State Prekindergarten Program, and the Oklahoma Early Childhood Four-Year-Old Program (Barnett and Kasmin, 2017).
10 See Chapter 3 for a discussion of the ways in which states and cities are approaching implementation of policies that set compensation for prekindergarten educators on a par with K–3 educators.
11Barnett and Kasmin (2017, p. 9) noted that the number of benchmarks is “a (very) rough indicator of state policy emphasis on program quality.” It is not a measure of program quality per se.
protected funding sources dedicated to public education—that do not exist in the ECE sector, except for the small share of programs that are school-sponsored and pay higher salaries. However, a new financing structure for early care and education that included funding sources dedicated to it may mitigate these challenges.
Other scholars suggest that there may be an additional range of occupations with relevant educational requirements, skills and competencies, and motivations that could be used as the benchmark for ECE compensation parity. For example, if child and family social workers or nurses are required to have a baccalaureate-level education and the skills and competencies needed to interact with and provide direct care to children and families on an ongoing basis, then the compensation they command is evidence that individuals with those qualifications and competencies can be hired for that compensation (Brandon et al., 2004b).12 Similarly, the pay schedule for ECE professionals in the military system is benchmarked not to other educators but to the federal pay scale, ensuring parity with other similarly qualified professionals in the military (see Box 2-1 in Chapter 2 for a discussion of the Department of Defense’s ECE system).
Another method for linking compensation to qualifications and characteristics of the workforce is to consider how a range of attributes (gender, age, geographic region, etc.) are related to compensation across the entire United States (see, e.g., Stanley and Jarrell, 1998). Analyses of the multiple factors affecting earnings have produced a consistent set of characteristics, of which educational attainment is the largest but not the only determinant of wages. Factors such as gender, age, experience, race, marital status, region of the country, and urban and rural status also affect compensation (Stanley and Jarrell, 1998). Brandon, Stutman, and Maroto (2010) used this approach to estimate the differential wage level of ECE professionals attributable to their occupation and found that women working in ECE occupations averaged 31 percent lower wages than other women when education, age, experience, location, and other variables predicting wages were held constant. If ECE compensation is currently low because of a disproportionate share of female and non-White staff in the occupation—characteristics that may reflect discrimination rather than competence—then cost estimates for adequate compensation, using this method, would need to be adjusted from current levels to levels that reflect a gender and racial composition similar to other occupations.
The literature also makes clear that effective leadership is also important to promote high-quality ECE practice (Institute of Medicine and National Research Council, 2015), and any cost estimate of high-quality ECE
___________________
12 The committee did not determine which occupations would be an appropriate benchmark for this approach.
will also need to account for adequate compensation for ECE professionals in leadership positions, including directors, program leaders, and coaches/mentors. In addition, across the entire ECE system, a number of specialist staff (reading and language specialists and special education consultants) are required for substantial minorities of children with special physical, emotional, and developmental needs, and the number of specialists required to meet the needs of children in a particular program will affect costs (see Box 6-1 on the costs of serving children with special needs).
Onsite Professional Responsibilities and Learning
As described in the Transforming report, consistent supports for professional responsibilities and professional learning during ongoing practice—such as paid planning and assessment time, paid time for conferencing and communicating with families, paid time for professional sharing and reflection and for coaching and mentoring, and paid time for attending onsite professional development activities—are critical for supporting the ECE workforce and delivering high-quality early care and education to children. ECE educators may also need training to support specific populations of children in their classrooms (see, for example, Box 6-2 on the costs of implementing dual language learning practices in early education).
The cost of providing these staff supports will vary depending on how much time is allotted for each activity and whether additional staff will need to be hired to provide the supports. For professional development and professional responsibilities, the frequency, duration, and approach will affect the cost. Though the available literature is mixed regarding the effectiveness of particular coaching and mentoring approaches, a review of coaching and mentoring initiatives in ECE programs found that coaching visits most commonly happen on a weekly or biweekly schedule and the majority of initiatives involving coaching last for about 1 year (Isner et al., 2011).
For onsite professional development activities, educator in-service requirements vary by state and by program within states. In public K-12, most states support induction and have ongoing professional development requirements for educators, whereas many ECE settings do not have continuing education requirements for educators (Whitebook, 2014). The professional development benchmark in the National Institute for Early Education
Research’s State of Preschool Yearbook for 2017 suggests that lead and assistant ECE educators should receive at least 15 hours of in-service professional development each year. In addition, lead and assistant educators should have individualized professional development plans and receive ongoing coaching or embedded classroom support (Barnett et al., 2017).
For educator planning time, examples from Head Start, international sources, and the U.S. Department of Defense’s ECE program are informative. The U.S. Department of Defense recommends that its educators in the Sure Start prekindergarten program receive 45 minutes of planning time without students each day (U.S. Department of Defense, 2009, p. 15). K–12 educators in a majority of districts are given 45 minutes of planning time per day within their contract hours, although the time varies greatly by site. For example, elementary school educators were found to have anywhere from 12 to 80 minutes of planning time per day, while planning time for secondary school educators ranged from 30 to 96 minutes per day (National Council on
Teacher Quality, 2012). In addition, paid time for additional professional responsibilities conducted without children present will need to be built into the workday and accounted for in any cost estimate, including paid time for assessment, professional sharing and reflection, and engagement with families.
The cost of providing these staff supports will vary, but they need to be embedded in the costs at the site level in order to support continuous quality improvement.
Operating Hours and Days
The cost of early care and education will vary depending on the number of hours per week that ECE services are offered and when those services are offered, as well as the length of the yearly period during which services are provided. Early care and education is typically provided for more hours in a day than K–12 education, and any estimate of the cost of providing high-quality early care and education needs to account for these differences. Of course, the duration of service offered will vary by the program type. For example, Head Start programs consider themselves to be full-day and full-year, based on operating no fewer than 230 days a year and no less than 6 hours a day, though not all operate on this schedule. Conversely, 37 of the 59 state-funded prekindergarten programs currently operate on only a part-day (fewer than 4 hours) basis (Barnett et al., 2017, p. 11). Listed home-based providers operate a median of 54 hours per week, and paid, unlisted home-based providers operate a median of 40 hours per week (National Survey of Early Care and Education Project Team, 2016b).
The length of the year that ECE services are offered will also affect costs, and cost estimates may need to be adjusted based upon utilization trends. For example, in the current ECE system, utilization tends to dip in summer months. Should such a drop-off persist in a high-quality system, cost estimates need to account for the reduction in required staffing during the summer.13 However, estimating the amount of the drop-off across types of early care and education is difficult, and few studies focus on the summer months and related changes in care arrangements. While there is some evidence that the use of formal care arrangements declines in the summer, the size of that decline varies by type of care and age of child. According to a 2009 survey of Minnesota households (including children with both employed and unemployed mothers), for children from birth to age 2, there was a reduction in the percentage of children using licensed family childcare providers during the summer months, yet an increase for those using center-based care. For
___________________
13 The Bureau of Labor Statistics reports that employment for ECE practitioners (not including prekindergarten educators, some of whom work in programs that are offered on a full calendar year basis) drops by about 5 percent to 7 percent in the summer months (Barnett et al., 2017; Bureau of Labor Statistics, 2017).
children ages 3 to 5 years, percentage use of center-based care over the summer months decreased dramatically from 76 percent during the school year to 39 percent over the summer months (Chase and Valorose, 2010).
In addition, the 2005–2006 Survey of Income and Program Participation (covering only children with employed mothers) found that while there was a drop in the percentage of children with any regular ECE arrangement in the summer (from 55–37%), the percentage in “organized care facilities” such as ECE centers was nearly constant, at about 24 percent (Laughlin, 2010). Whether similar utilization patterns, with a summer-time decline in use of certain types of care for some ages, will persist in a high-quality, affordable ECE system is unknown but will have implications for the cost of a high-quality system.
Facilities
Facilities are an often overlooked but important element of onsite costs, since a high-quality ECE facility offers young children opportunities for cognitive, emotional, and physical development that go beyond basic expectations of physical protection. A small body of research has examined the costs of ECE facilities and found that two types of capital costs contribute to facilities costs: immediate costs for modernizing or building facilities (or transition costs) and long-term costs (occupancy costs) for maintenance or rental costs of the space. Transition costs include expenditures associated with purchasing, improving, or building a physical asset such as buying land, construction of the building, and purchasing equipment, as well as services and fees such as professional services for project planning and oversight (e.g., architects, engineers, and lawyers), taxes, and insurance premiums. Long-term costs, or occupancy costs, of a newly renovated space should also be considered. These expenses may vary depending on the building’s size and energy-efficiency, among other factors (National Center on Program Management and Fiscal Operations, n.d.).
Ongoing occupancy costs for facilities should be included in onsite cost estimates. However, transition costs for building or renovating facilities costs, potentially a major cost driver, are generally not accounted for in the costs of delivering ECE services. No comprehensive national or multistate data on the percentage of centers and homes that need improvements or new facilities are available. Moreover, no data are available on how many new ECE facilities would need to be built if improved financing increased access to and utilization of early care and education. However, some regional and program-specific assessments are informative. According to data on Head Start facilities from fiscal 2015, more than one-half of the centers monitored were reported to have been built before 1990, with more than one-third built before 1970. The average age of Head Start facilities was
40 years (Office of Head Start, 2015b). On the state level, a recent survey revealed that while the majority of ECE facilities in Massachusetts met regulatory standards, most fell below accessibility, professional, and best practice standards (Pardee, 2011).
Given the current state of ECE facilities, estimated transition costs (in this case, the amount of money required to modernize the facilities) are high. The costs to make necessary infrastructure repairs to the 7,857 Head Start centers in the United States are estimated at approximately $3.84 billion, or $488,703 per center ($252.94 per square foot) (Office of Head Start, 2015b).14 Though the Head Start estimate assumes a minimum of 35 square feet of usable classroom space per child, in accordance with Head Start Program Performance Standards and NAEYC accreditation guidelines, this number may be low because multiple sources highlight the need for reception areas, staff lounges, and adequate storage space as critical components to maintaining high-quality ECE facilities (Child Care Inc., 2007; Mead, 2016; Singh and Bluestein, 2016).
Similarly high costs have been projected at the state level. The Children’s Investment Fund commissioned the Facilities Inventory in Massachusetts to review both ECE and out-of-school-time facilities. The Facilities Inventory sampled licensed nonprofit centers that served children whose families receive tuition subsidies or grants. According to this research, the average cost per site to meet accessibility standards amounted to $68,000, costs to meet regulatory standards equaled $18,000, costs to meet professional standards equaled $90,000, and costs to meet best-practice standards equaled $154,000.15
___________________
14 This is an estimate of the average cost to rebuild, renovate, or repair Head Start centers. The Office of Head Start estimated that it would cost $252.94 per square foot to rebuild a Head Start center. This estimate is based on RSMeans data, which are used for construction budgeting and estimating new building and renovation projects. Using RSMeans data gave an estimated cost of $194.57 per square foot as a U.S. national average cost to build a new facility. This estimate is based on a building model that assumes basic components and uses union labor for a 10,000 square foot day care center as the standard. Office of Head Start added 30 percent to the $194.57 cost per square foot to include added costs for paying Davis Bacon Act Wages, the cost of special requirements for compliance with program performance standards, and an adjustment for the high cost of construction in remote areas (Office of Head Start, 2015b, pp. 16–17).
15 Meeting accessibility standards, for example, might include installation of elevators or chair lifts or construction of accessible bathrooms. Examples of meeting regulatory standards include the cost at some centers to repair exterior walls, roof, or flooring or to install appropriate outdoor play equipment over an approved resilient safety surface. Commonly needed modifications to meet professional standards include upgrading heating, ventilation, and cooling systems; installation of classroom sinks; creating suitably equipped professional work spaces for educators and administrators; and improvements to outdoor play space. To meet best-practice standards, many centers would need to construct children’s bathrooms adjacent to classrooms; create direct exits to outdoor play space from every classroom; or make modifications to improve acoustics, ventilation, and thermal comfort (Pardee, 2011).
Facilities costs are an important consideration when estimating the cost of onsite services. However, limited data are available to inform national estimates of the cost of ECE facilities. To produce a national estimate of costs for ECE facilities, data are needed that (1) can be used to estimate the number of ECE centers receiving free or reduced-price space and the percentage of centers and homes requiring facilities improvements, and (2) differentiate between tight commercial real estate markets (where affordable rental space may not be available) and other markets. Data are also needed to estimate the number of new facilities required for a high-quality system serving all areas of the nation.
Workforce Development Costs (system level)
As noted in Chapter 3, various funding streams and mechanisms currently exist to support the professional development of the ECE workforce outside the opportunities available through the specific centers or home-based programs where ECE professionals are employed. Early childhood–specific programs such as Teacher Education and Compensation Helps (T.E.A.C.H.)16 provide financial support for members of the ECE workforce to pursue higher education degrees, covering the cost for tuition and fees. Wage supplementation programs, including those that provide scholarships and other tuition offsets for higher education, are in place in some communities to provide additional compensation to members of the ECE workforce who pursue higher education, achieve a particular degree, or meet a retention milestone. In the current system, such costs are recognized as part of the system-level costs beyond those associated with direct service provision. However, many of these costs are necessary because the current system does not provide compensation commensurate with the educational attainment or other professional credentials of an ECE professional, for all of the reasons discussed in the Transforming report. By comparison, such system-level mechanisms may not be required in a system that includes the costs of appropriate compensation and professional development supports for the ECE workforce as part of the cost of providing ECE services—that is, where the ECE system reimburses these workforce costs as part of direct service provision. However, the transition phase during which the skills, competencies, and education of the current workforce are transformed to the levels required for the envisioned, highly qualified ECE workforce would entail nonrecurring system-level costs. Additional ongoing supports to ensure diversity across professional roles would also add to system-level costs.
___________________
16 The T.E.A.C.H. program is described in Chapter 3. See Box 3-3 and the discussion of the T.E.A.C.H. scholarship program in the section on “Ongoing Professional Learning and Higher Education.”
Cost components of system-level workforce development supports that may remain in a transformed ECE system include information systems, curriculum development, system evaluation, career counseling, leadership development, textbooks and scholarships for educators’ continuing professional development, and support for home-based ECE provider networks, among others. The Professional Development System Cost Analysis Tool may be particularly useful for estimating these costs (see Appendix B).
Quality Assurance and Improvement Costs (system level)
A robust system of quality assurance and improvement supports is also essential to improve coordination and efficiency and to ensure quality in the delivery of ECE services. Key components of quality assurance and improvement systems that affect system cost include monitoring and regulation systems, quality improvement and accountability systems, and data and information management systems. Each of these component systems carries a cost and is a factor in the quality of the ECE system.
Monitoring and Regulation Systems
There is great variation in the use of tools and methods for monitoring and regulation, frequency or sequencing of monitoring processes, components or features emphasized for compliance and inspection, and the ultimate consequences from monitoring findings. Meeting each set of regulatory standards and monitoring requirements can carry costs. For example, state ECE program licensing systems entail the costs of defining the minimum standards required for an ECE program, establishing the provider types that must be licensed, and verifying and enforcing the licensing requirements. Program-specific regulations are often associated with a particular funding stream such as Head Start or state prekindergarten programs. Costs are then associated with defining the program standards, monitoring funded providers to ensure that they achieve the program’s requirements, and verifying whether providers that have failed to meet the program’s standards do subsequently come into compliance. Important drivers of costs in such monitoring and regulation systems, in addition to the number of providers to be monitored, are the frequency and intensity of the monitoring process.
Quality Improvement and Accountability Systems
Quality improvement and accountability systems can likewise take multiple forms, each with associated system-level costs. Costs for a quality
rating and improvement system (QRIS)17 typically include the costs of the quality rating process and the quality improvements supports provided to participating ECE providers. In this section, we review the costs of the rating process, as the costs of quality improvement supports were included in the above discussions of the onsite costs for professional responsibilities and learning and workforce development costs.
The quality rating process encompasses assessment and rating of ECE providers; management and administration of the QRIS; evaluation and continuous improvement of the QRIS; and communication, outreach, and constituent engagement. The costs of assessing and rating providers will depend upon the frequency of rating and re-rating, the number and content of standards and criteria that are reviewed for a rating decision, the number and complexity of onsite assessments, the approach to inter-rater reliability requirements, and the extent of use of automated systems in the assessment and rating process (BUILD Initiative, 2017, p. 3). The tools used in each state’s QRIS vary and can impact system cost. Some focus on structural aspects of quality such as child-to-staff ratios, which are relatively easy to measure and not costly to collect. However, many state QRISs use onsite observational tools such as the revised Early Childhood Environment Rating Scale or the Classroom Assessment Scoring System to assess process quality. Getting the most reliable measures of provider-level quality requires observing multiple classrooms, potentially multiple times—a process that can be time consuming and costly.
Data and Information Management Systems
Each of the component systems for quality assurance and improvement relies on data and information management systems—for example, to track program licensing or quality monitoring. Data systems also support the administration of public funding for early care and education, such as verifying provider eligibility, tracking provider participation in programs, capturing participant outcomes, and collecting data on the ECE workforce. Such data systems may be more or less efficient in supporting these objectives, depending upon how well integrated they are. Data system costs include not only the direct cost of operation but also the indirect costs of the time it takes ECE providers and their staff to provide information to populate the data systems. Furthermore, the application of the data to improve instructional methods will entail a cost of staff time.
___________________
EXAMPLE PART I: ILLUSTRATION OF A TOTAL COST ESTIMATE
Drawing from the above literature on the costs of various elements of a high-quality ECE system, this section presents the committee’s illustrative example of estimating the total systemwide cost18 of providing access to high-quality early care and education for all children from birth to kindergarten entry, based on the policy specifications and assumptions described in detail in Appendix A. The total cost includes estimates of onsite costs and system-level costs; the latter include the costs of offsite training and professional development as well as quality assurance and improvement costs. The sections following this illustrative estimate of the total cost use this figure for total cost to illustrate one way to structure family contributions to the cost of high-quality early care and education and to estimate the share of funding that would need to come from public or private sources, based upon the family contribution.
The committee’s estimates for this illustration represent an up-to-date national calculation tied directly to the major recommendations of the Transforming report, particularly the recommendation that all lead educators have at least a bachelor’s degree and receive considerable day-to-day as well as ongoing professional support. In addition, while most previous analyses simply compare the current situation to a desirable future situation, an essential feature of the committee’s approach is to determine the costs of transitioning to high-quality early care and education over a four-phase process. Further, the committee’s dynamic estimate takes account of the likely response to higher quality and improved affordability produced by implementation of our recommendations (see Chapter 7). The committee recognizes that transforming the qualifications for a sizable portion of the ECE workforce of more than 2 million paid professionals to meet the requirements of their post-transformation jobs will not be accomplished immediately. Thus, our cost estimate example includes estimated costs for each of four stages of improvement.
We note at the outset that there are many uncertainties inherent in projecting the national, aggregate costs of implementing an ECE system that is markedly different from what exists currently. In reality, a combination of public and private entities, operating within a partially regulated marketplace and subject to regional, state, and local variation in labor market conditions and to national economic trends, will interpret and implement the major policy parameters that affect costs. The resulting costs may therefore be significantly different from the committee’s projections in this example.
How families will respond to a different set of conditions regarding the quality and payment structure of different types of early care and education is also uncertain: How much will overall participation in nonparental early care
___________________
18 The estimate of the total systemwide cost includes onsite costs, system-level workforce development costs, and system-level quality assurance and improvement costs.
and education greatly increase? How substantial a shift from home-based to center-based ECE services will occur for each age and family income group? To what degree will improved ECE access lead to major increases in family employment, resulting in higher incomes, which would somewhat offset increased public costs for the new ECE system? The answers to these questions all have implications for the cost of providing high-quality early care and education to all children, compounding the uncertainty in any estimate based on one set of assumptions. The available economic and evaluative research literature provides a relatively clear sense of the direction of such changes in utilization, but the specific quantities of change are uncertain.
Despite these limitations, the committee’s example is important for decision makers working to implement the recommendations of the Transforming report. The example includes estimates for onsite costs, the costs of system-level workforce supports, and the costs of quality assessment and improvement systems. It thus provides a national-level perspective on the cost of implementing, over four phases, a high-quality ECE system with a highly qualified workforce. For decision makers at the state and local level, other costing tools and models may also be useful; we review some of these in Appendix B.
Estimates of Onsite Costs
Using adapted elements of cost calculators developed by Brandon (2011) and Elicker, Brandon, and MacDermid (2016), the committee estimated the average costs per child-hour of center-based early care and education for infants (less than 1 year), toddlers (1–3 years), and prekindergartners (3–5 years), given specified policies (e.g., the mix of staff with particular qualifications, appropriate compensation, the components of ongoing professional support, and child-to-staff ratios) over four phases of transformation.
Appendix A describes in detail the methodology used for the cost calculations as well as the various policy choices and assumptions, guided by the recommendations of the Transforming report, that underlie the committee’s cost estimate. Key among these are (1) lead educators with a bachelor’s degree, (2) resources committed to coaching and mentoring, (3) paid release time for professional development, (4) specialists available to support children with special needs, and (5) paid nonchild-contact time.19
___________________
19 In phase 4 of the cost estimate, the salaries for lead educators do not represent full parity with K–3 educators. The cost estimate in phase 4 sets lead educators’ salaries to the level of a kindergarten educator’s annual salary payment for a 9-month contract. If, instead, lead educators’ salaries in phase 4 were pegged to an annualized equivalent of the normal 9-month kindergarten educator salary, and if all other leadership and instructional salaries were adjusted in a similar fashion, achieving full parity would add about 11 percent to onsite costs and about 10 percent to total system costs (see Appendix A).
Over the four phases of improvement, these specifications are gradually scaled up to achieve high quality. For example, the resources devoted to coaching and mentoring increase across the phases.
Since the purpose of the illustrative cost estimate is to consider the potential costs of making high-quality early care and education available to all children in the United States, the policy choices and relevant current data refer to overall national averages. Because there are currently about 130,000 center-based providers and roughly 1 million paid home-based providers, with great variation in funding and sponsorship, organization structure, and size, the committee expects considerable variation in the actual costs incurred by individual providers. We also expect variation in costs to reflect providing services to different groups of children. For example, the number of specialist staff to serve children with special physical, emotional, or linguistic needs is included in the overall staffing pattern, at ratios reflecting the shares of children with these needs in the overall population, as detailed in Appendix A. Similarly, the estimate assumes that the enhanced professional development resources and reduced child–to-adult ratios used in the illustrative cost estimate will facilitate the delivery of appropriate services to these children with special needs who are in mainstream settings. However, the partial costs of such staffing and supports are not shown separately.
Because about half the paid ECE workforce consists of home-based providers, the committee also included a projected cost20 of providing high-quality home-based early care and education.21 In addition to the large size
___________________
20 There is an accepted methodology for estimating costs of center-based early care and education, since data are available on the major ingredients, especially salaries. However, since most home-based providers are not paid a salary, and it is difficult to partition the costs of their home between their own use and ECE service, it is not currently possible to reliably estimate costs for home-based care. Therefore, prices are used as a rough proxy for costs in the estimation algorithm. The committee’s estimates reflect an assumption that home-based payments will continue at their current ratio to center-based prices (roughly 50% for infants, about 63% for toddlers, and about 76% for prekindergartners), yielding higher home-based payments as center-based care costs increase. That is, as center costs increase to support high quality-standards, the committee assumes home-based prices would increase commensurately.
21 The committee does not differentiate between home-based services that are regulated through licensing or registration and other home-based services. Under standard federal terminology, anyone who is paid for a certain type of work, such as early care and education, is a member of the workforce in that area of work. Using this standard definition, the National Survey of Early Care and Education (NSECE) provided the first nationally representative sampling and count of the entire home-based ECE workforce. Only about 10 percent of those paid ECE practitioners were covered by any administrative list, such as licensing or registration records, or were known to a resource and referral agency. The requirements for which home-based providers must be licensed or registered vary greatly across states, and there is inconsistent enforcement of such requirements. For these reasons, the committee chose not to differentiate, for this national estimate, between licensed/registered ECE practitioners and other ECE practitioners.
of the home-based sector, there is substantial evidence that families select between using center-based or home-based early care and education based upon price, program attributes, hours of operation, location, and other factors (see e.g., Blau, 2000; Blau and Hagy, 1998; see also the discussion of utilization in the Chapter 4 section titled “Current ECE Usage and Affordability for Families”). It is therefore necessary to estimate the costs of each of these sectors to obtain a realistic estimate of the total cost of providing access to high-quality early care and education. The committee’s estimate of aggregate costs distinguishes the center-based cost component, which reflects a well-established methodology, from the more uncertain home-based component.
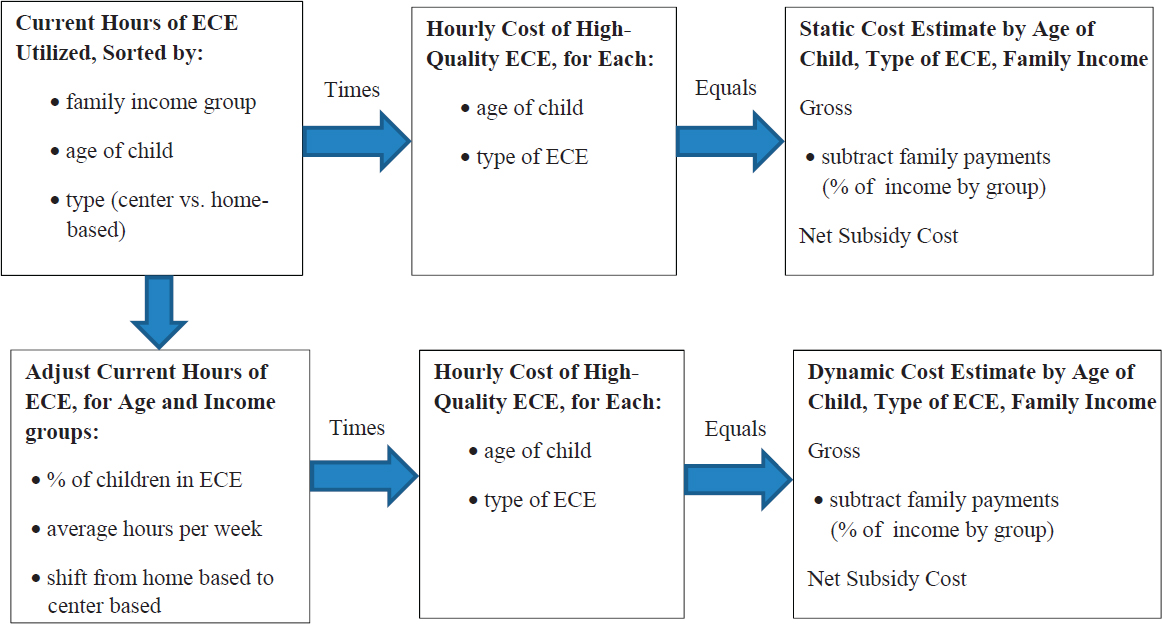
The committee produced both a static estimate and a dynamic cost estimate (see Appendix A for a detailed methodology). For its static estimate, the committee applied the estimated costs per child-hour of high-quality early care and education to current ECE utilization data (number of families and average hours of ECE service used across types of early care and education) garnered from the National Survey of Early Care and Education (NSECE)22 to generate gross onsite costs by child age and ECE type. For this static estimate, the committee adjusted utilization downward 5 percent to reflect reduced ECE utilization in summer months (see discussion above). Figure 6-1 shows a simplified flowchart of the committee’s methodology for estimating the static and dynamic costs. The static estimate is important because it illustrates the incremental costs of phasing up quality standards and compensation levels.
However, to understand the likely costs of improved quality and accessibility, it is necessary to take account of the likely family responses to these changes, as reflected in the economics literature cited above. The committee therefore developed an illustrative scenario of changes in ECE utilization patterns over the four phases and calculated a dynamic estimate of costs that would be expected to result from higher quality and increased affordability to families, given the policy choices in this scenario. Since the literature on ECE utilization indicates that child age and family income are major predictors of the type and amount of early care and education used, the estimates applied were varied by age of child and family income group.
The literature suggests three likely changes: overall increase in utilization (percentage of children participating in early care and education), an accelerated shift from home-based to center-based early care and education, and an increase in average weekly hours of ECE services used per child (see e.g., Blau, 2001; Blau and Hagy 1998). The increased share for center-based early care and education is based on the committee’s expectation that as
___________________
22 See Chapter 2; data are from Latham (2017) and the National Survey of Early Care and Education Project Team (2016a, 2016b).
the prices of center-based care charged to moderate- and middle-income23 families decrease, families in these income ranges will gradually shift to using less home-based and more center-based ECE services (see, e.g., Blau, 2001; Cascio, 2015).24 We expect this shift to be greater for infants and toddlers than for prekindergartners, three-fourths of whom are already in center-based ECE settings. Table 6-3 summarizes the projected increase in utilization of center-based early care and education by child age group.
Based on past econometric estimates, the committee also estimated that the average weekly hours of early care and education used by enrolled children would increase by 8 percent for all age and income groups. Thus, the committee assumes that more families will use early care and education, more will use center-based ECE options, and they will use more ECE hours per child, on average. Overall, the combined adjustments for these higher rates of center enrollment and additional weekly hours per enrolled child increased total hours of ECE utilization by 20 percent to 25 percent of total ECE hours for low-income families, 15 percent for middle-income families, and 10 percent for affluent families. This pattern reflects financing policies that offset the greater price sensitivity and current limitations on access faced by low- and middle-income families.
TABLE 6-3 Projected Increased Use of Center-Based Early Care and Education, by Child Age Group
| Percentage of Families Using Center-Based ECE | ||
|---|---|---|
| Current (2012) | By Phase 4 | |
| Infants (<12 mos.) | 5 | 20 |
| Toddlers (1–3 years) | 21 | 50 |
| Prekindergarteners (3–5 years) | 75 | 90 |
SOURCE: Current usage data are from Latham (2017), using data from the 2012 National Survey of Early Care and Education Public Data Set. Phase 4 projections were generated by the committee.
___________________
23 For this discussion, “low-income” refers to families with household incomes that are from zero to 2 times the federal poverty level (FPL); “moderate-income” and “middle-income” refer to families with household incomes that are 2 to 3 times the FPL; and “affluent” refers to families with household incomes greater than 4 times the FPL.
24 The adjustments were informed by published literature on the response of utilization to changes in prices charged families (“elasticities”) (Blau, 2001), but they also reflect the committee’s informed judgement because the elasticities reported by Blau were based on the ECE system of 25 years ago and were not specific to different age and income groups. In general, the committee judged that lower-income families would be more responsive to changes in affordability and that the shift toward center-based early care and education would be greater for younger children, since their current utilization is lower and price is a greater barrier. However, many families may continue to prefer home-based care due to the need for evening and weekend hours, lower child-to-adult ratios, and trust of known individuals.
Estimated System-Level Costs: Workforce Development Supports and Quality Assurance and Improvement
Given that the approaches to system-level workforce development and quality assurance and improvement are varied, the committee follows prior practice in assuming that these costs can reasonably be represented in our cost estimate by fixed percentages of the direct cost of ECE service provision. For example, Brandon and colleagues (2004b) and Karoly and colleagues (2016) both developed estimates of these system-level costs as a percentage of the direct onsite cost of early care and education.
The committee applied an increment of 8 percent a year to service delivery costs to estimate the system-level costs of workforce development supports and quality assurance and improvement systems in order to determine an illustrative estimate of the total cost of high-quality early care and education. The 8 percent was derived from adjusting cost estimates developed by Brandon and colleagues for the Financing Universal Access to ECE project, which developed a detailed cost estimate for a set of infrastructure and system support elements similar to those envisaged by the Transforming report (Brandon et al., 2004b; see also Institute of Medicine and National Research Council, 2015, Chapter 9 and Chapter 10). The specifications were developed by several different teams of state ECE leaders and stakeholders, informed by a group of experts convened by the Financing Universal Access to ECE project (Kagan et al., 2002). For this discussion, we have omitted the elements that were included in the onsite cost estimates, such as coaching/mentoring and release time for professional development and professional responsibilities. The major elements suggested by convened experts and state teams, for which ingredient costs were specified, include the following:
- Professional support for educators, home-based providers, program leaders, and trainers: provider and staff registry, an information system, curriculum development, system evaluation, career counseling, leadership development, staff stipends for early care and education of staff members’ children, textbooks and scholarships for educators taking courses, and support for home-based provider networks.
- Support for families: resource and referral networks, consumer information about quality and financial assistance.
- Regulation of centers and homes operating at least 8 hours per week, 4 weeks per year: twice-annual visits for monitoring and support by regulators with advanced credentials and compensation exceeding that of educators, inspectors for regulatory entities assigned caseloads of about 60 centers or 80 homes.
- Governance and administration at state and local levels: accreditation facilitation systems, policy/legal and support staff, and management information systems.
The cost of these elements was consistently about 6 percent of the total costs of a higher-quality ECE system (Brandon et al., 2004b). However, those estimates did not include observational monitoring of program quality and professional practice or evaluations and cross-state studies of the impact of reforms to the ECE system and the workforce itself, as anticipated by the committee. The committee, using our informed judgment, thus estimates that these components would raise the total system and infrastructure costs to about 8 percent of the total costs. While some of the support costs, such as transitioning to a more qualified workforce, would likely decline in the later phases of the ECE system transformation, others such as assessment and analysis of impacts would increase, so the same 8 percent increment to direct service costs was applied at each phase.
Results
The cost of high-quality early care and education is presented first in terms of the estimated unit costs to providers offering high-quality ECE services on a per-child basis (on both an hourly and an annualized [full-time, full-year] basis)25 and second, in terms of the aggregate national costs, accounting for present and projected patterns of utilization of center-based and home-based early care and education for the entire U.S. population. All cost estimates are presented in constant 2016 dollars to illustrate the impact of the assumed policies without adding in the potential costs of inflation.
Unit Costs per Child
Table 6-4 reports estimates of onsite center-based ECE costs on both a per-child-hour basis and an annual basis for full-time, full-year early care and education, all in 2016 dollars. These numbers show the magnitude of differences among the costs at different phases, which reflect different policy specifications. The annualized onsite costs of center-based care per child generally decrease as the child’s age increases. In phase 4 the decrease is from $35,354 per year for infants to $13,655 per year for 3-to-5 year olds. Comparatively, the onsite costs of home-based care per child in phase 4
___________________
25 Because current average utilization is less than full time, the annualized figures are illustrative of what full-time, full-year costs would be if incurred. The committee notes that the “annualized figures” only apply to per-child costs, not the aggregate cost estimate, which applies actual hours per week utilized.
TABLE 6-4 Estimated Onsite Costs for High-Quality Early Care and Education, Center-Based and Home-Based, Unit Costs per Child, Compared to Current Prices
| NSECE Estimates, Adjusted to 2016 | Estimated Cost per Child, Illustrative Scenario | |||||
|---|---|---|---|---|---|---|
| Median Price | Mean Price | Phase 1 | Phase 2 | Phase 3 | Phase 4 | |
| Center-Based ECE | ||||||
| Prekindergartners, ages 3–5 years | ||||||
|
Annualized, FT/FY |
$8,278 | $14,040 | $9,416 | $10,538 | $12,271 | $13,655 |
|
Per child-hour |
$3.98 | $6.75 | $4.53 | $5.07 | $5.90 | $6.57 |
|
Toddlers, ages 12–36 months |
||||||
|
Annualized, FT/FY |
$8,944 | $15,080 | $16,382 | $18,806 | $24,715 | $28,203 |
|
Per child-hour |
$4.30 | $7.25 | $7.88 | $9.04 | $11.88 | $13.56 |
|
Infants, age <12 months |
||||||
|
Annualized, FT/FY |
$10,130 | $17,950 | $16,045 | $21,389 | $23,654 | $35,354 |
|
Per child-hour |
$4.87 | $8.63 | $7.71 | $10.28 | $11.37 | $17.00 |
| Home-Based ECEa | ||||||
|
Prekindergartners, ages 3–5 years 0.76 Ratio, homes/centers |
||||||
|
Annualized, FT/FY |
$8,112 | $10,712 | $7,156 | $8,009 | $9,326 | $10,378 |
|
Per child-hour |
$3.90 | $5.15 | $3.44 | $3.85 | $4.48 | $4.99 |
|
Toddlers, ages 12–36 months 0.63 Ratio, homes/centers |
||||||
|
Annualized, FT/FY |
$3.70 | $4.90 | $4.96 | $5.70 | $7.48 | $8.54 |
|
Per child-hour |
$7,696 | $10,192 | $10,321 | $11,848 | $15,570 | $17,768 |
| NSECE Estimates, Adjusted to 2016 | Estimated Cost per Child, Illustrative Scenario | |||||
|---|---|---|---|---|---|---|
| Median Price | Mean Price | Phase 1 | Phase 2 | Phase 3 | Phase 4 | |
Infants, age <12 months 0.50 Ratio, homes/centers |
||||||
Annualized, FT/FY |
$7,696 | $8,944 | $8,023 | $10,695 | $11,827 | $17,677 |
Per child-hour |
$3.70 | $4.30 | $3.86 | $5.14 | $5.69 | $8.50 |
NOTES: Annual FT/FY = full-time, full-year annual costs. The cost estimate defines key salary levels as paying ECE educators with a bachelor’s degree wages equivalent to child-family social workers with a bachelor’s degree by phase 2 and equivalent to kindergarten educators by phase 4, though not annualized for a full year (12 months) of ECE service. In the phase 4 specifications, lead educators’ salaries are equivalent to a kindergarten educators’ salaries for a 9-month contract. If phase 4 bachelor’s degree–level salaries were set equivalent to 12 months at the monthly rate of the contract amount for kindergarten educators’ salaries, they would be about $74,000 rather than $55,460 (see Appendix A for an explanation of key salary levels across phases).
a The ratios shown for home-based care are the ratios of the NSECE mean price of home-based care to the NSECE mean price of center-based care (second data column). For the scenario estimates (last four columns), these ratios of mean prices were used to derive the estimated home-based care cost from the committee’s projection of center-based care cost.
SOURCE: NSECE data from National Survey of Early Care and Education Project Team (2016a), adjusted to 2016 dollars. Estimated costs for the phases in the illustrative scenario were generated by the committee.
increase slightly from infant care ($17,677) to toddler care ($17,768) before decreasing for 3- to 5-year-olds ($10,378). This pattern results from the interaction of two factors. The NAEYC recommendations are for similar child-to-staff ratios for infants and toddlers but substantially higher ratios for prekindergartners. However, the mix of staff educational qualifications and attendant salaries is richer for toddlers than infants. Therefore, though toddlers and infants have similar child-to-staff ratios, the policy specifications for educators working with toddlers require stronger qualifications and higher compensation and the unit cost for toddlers slightly exceeds that of infants in phase 1. In phase 4, as the staff qualifications for infants are increased, and child-to-staff ratios decrease, the costs for infants become much greater than for other age groups. (These specifications are shown in detail in Appendix A, specifically Table A-2.)
Table 6-4 also presents estimated onsite home-based ECE costs, which were derived using the committee’s assumption that home-based payments will continue at their current ratio to center-based ECE prices, yielding higher home-based payments as center costs increase (see discussion above). These home-based to center-based ratios for infants, toddlers, and prekindergartners are, respectively, 50, 63, and 76 percent.
Aggregate National Costs for High-Quality Early Care and Education
For this illustrative scenario, the committee also projected total aggregate national costs (including onsite costs and system-level costs), showing both a static estimate and a dynamic estimate.26 These values are based on applying the estimated costs per child-hour to the current and projected utilization patterns by age of child and family income group, as reported in the NSECE (as opposed to the illustrative full-time, full-year annualized costs in Table 6-4). Table 6-5 shows a comparison of the static and dynamic estimate of the total direct service cost of high-quality early care and education. For the static estimate, the committee estimates costs will increase from about $66 billion in phase 1 to $110 billion in phase 4 as quality standards are increased in each phase. The share for center-based care remains at about two-thirds in all phases, given the committee’s
___________________
26 The aggregate cost estimates apply the estimated hourly costs per child for high-quality early care and education to the average weekly hours of center-based and home-based ECE services actually used by children of different age and income groups as described in Chapter 4. These are converted to annual costs by multiplying by 52 weeks and then adjusting downward by 5 percent to reflect the pattern of summer decreases in ECE employment (see discussion above).
TABLE 6-5 Static and Dynamic Estimates of Total Cost and Share of Total Cost by ECE Provider Type and by Scenario Phase (billions of 2016 dollars)
| Phase 1 | Phase 2 | Phase 3 | Phase 4 | |
|---|---|---|---|---|
| Total, Static Estimate | $65.7 | $76.1 | $93.2 | $109.5 |
| Center based | $42.8 | $49.3 | $59.9 | $70.0 |
| Home based | $22.9 | $26.8 | $33.2 | $39.6 |
| Share of Total Cost by Provider Type | ||||
| Center based | 65% | 65% | 64% | 64% |
| Home based | 35% | 35% | 36% | 36% |
| Total, Dynamic Estimate | $74.5 | $89.0 | $114.3 | $139.9 |
| Center based | $49.8 | $62.5 | $82.9 | $105.2 |
| Home based | $24.8 | $26.4 | $31.4 | $34.7 |
| Share of Total Cost by Provider Type | ||||
| Center based | 67% | 70% | 73% | 75% |
| Home based | 33% | 30% | 27% | 25% |
assumption that home-based costs will shift in constant proportion to center-based costs.
In the dynamic estimate, the committee assumes a steady increase in overall utilization of early care and education, with a shift toward more use of center-based ECE options over the four phases. This approach produces an overall increase in the share of children and families using ECE services by about 6 percent for upper-middle income families to 15 to 20 percent for low-to-middle-income families that are currently more constrained by price. The total costs of providing high-quality early care and education in this dynamic estimate increase over the static projections by 13 percent in phase 1 and by up to 27 percent by phase 4. The dollar amount attributable to increased utilization ranges from about $3.8 billion in phase 1 to $27 billion in phase 4. The total costs (onsite plus system-level costs) of high-quality early care and education would increase from about $75 billion in phase 1 to $140 billion in phase 4, using the dynamic utilization assumptions in this scenario. The share of utilization for center-based care would increase from two-thirds in phase 1 to three-fourths in phase 4. In the dynamic estimate, onsite costs for center-based and home-based care by child age group increase most for younger children, as they are expected to have the greatest increase in utilization, combined with an accelerated shift from home-based to center-based care. The cost estimates also reflect the scenario’s result that the increase in staff compensation combines with lower child-to-staff ratios to make the cost per child much higher for the younger age groups, especially toddlers.
EXAMPLE PART II: FAMILY PAYMENTS IN A HIGH-QUALITY EARLY CARE AND EDUCATION SYSTEM
For the purposes of illustrating and estimating the public (and private nonfamily) expenditures needed to support high-quality early care and education, this section illustrates one way of designing a fair system of family contributions. Chapter 7 and Appendix C discuss alternative ways to determine a reasonable share for families to pay, including no-fee approaches. The illustration assumes that the current federal and state family contribution guidelines, which vary across states and across different programs, are harmonized to a consistent, progressive schedule to eliminate current gaps in affordability, informed by data on what families of different incomes currently pay for children of different ages (see Chapter 2).
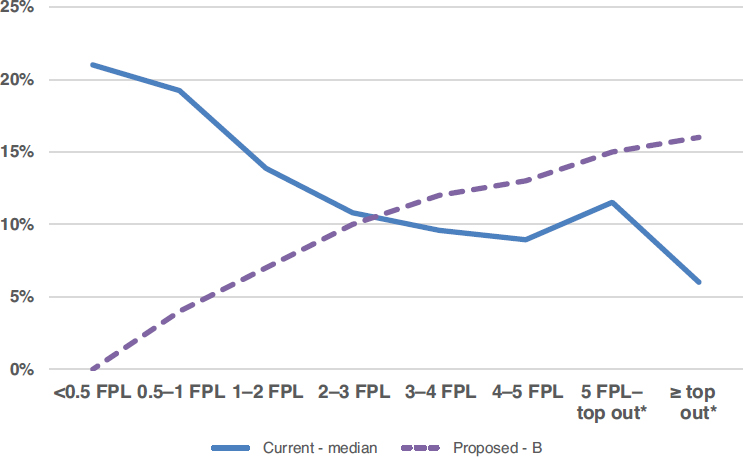
If fees are charged, Table 6-6 provides one example of such an alternative family payment schedule and illustrates a system of family payments that eliminates the current middle-income gap in affordability and utilization of center-based care. This family payment schedule is an example an equitable, progressive pattern that decreases payment shares for low-to-moderate-income families and increases payment shares for more-affluent families, compared to the current payment structure. Figure 6-2 shows a comparison of current payment rates as a share of family income to the illustrative family payment schedule. Note that the income groups are defined by multiples of the federal poverty level (FPL), which takes family size into account, so the greater needs of families with more children are built into the schedule. The illustrative family payment levels were based on the following factors:
- The current 10 percent median share of income in family payments derived from NSECE data, shown in Chapter 2, was set as the level for the 2–3 FPL group.27,28
- Families in deep poverty (<0.5 FPL) were assigned no payments; families above that level but below 2 FPL were assigned modest payments, increasing from 4 to 7 percent of income. These steady increases avoid the work disincentives from a “cliff” effect.
- Upper-income families currently pay about 12 percent of income for early care and education. However, this share of income is
___________________
27 The current mean family payment of 18 percent of income for the 2–3 FPL group reflects a small proportion of families in this income group that pay very large shares of income for ECE services. Because the committee judged the mean payment to not be generally affordable (see Chapter 2), the median share is used.
28 This factor uses the “revealed preferences” methodology for determining a reasonable share for families to pay, as discussed in Appendix C. The methodology assumes that average income families are currently paying what they are willing and able to pay for early care and education.
TABLE 6-6 Illustration of a Progressive, Affordable Family Payment Schedule
| Percentage of Family Income Paid for ECE Services | Pay Smaller Share of Income than Current Median | Pay Greater Share of Income than Current Median | |||||||
|---|---|---|---|---|---|---|---|---|---|
| All Households | <0.5 FPL | 0.5–1 F | L 1–2 FPL | 2–3 FPL | 3–4 FPL | 4–5 FPL | 5 FPL–top-outa | ≥ top outa | |
| Current Median | 10% | 21% | 19% | 14% | 11% | 10% | 9% | 12% | 6% |
| Current Mean | 17% | 35% | 34% | 21% | 18% | 12% | 11% | 13% | 8% |
| New Share of Income | 0% | 4% | 7% | 10% | 12% | 13% | 14% | 15% | |
| Annual Maximum Payment Amount | $0 | $699 | $2,379 | $5,804 | $9,423 | $13,196 | $16,576 | $21,869b | |
NOTES: FPL = federal poverty level.
a For the purposes of assigning families to income groups and computing average income per group, a maximum income eligibility level, the level above which families would receive no assistance, was estimated. This is referred to as the “top-out income level.”
b Maximum payment is limited to maximum cost, which equals about 12 percent of mean income for the highest income group
SOURCE: Current median and mean data from Latham (2017), using data from the 2012 National Survey of Early Care and Education Public Data Set. Share of income and annual maximum payment amount illustrations were generated by the committee.
NOTE: Current shares reflect only those families who make out-of-pocket payments; many low-income families currently use ECE services but make zero payments. For the purposes of assigning families to income groups and computing average income per group, a maximum income eligibility level—above which families would receive no assistance—was estimated. This level is referred to as “top-out income level.”
SOURCE: Current payment rate data are from Latham (2017), using data from the 2012 National Survey of Early Care and Education Public Data Set.
constrained by the market forces that limit the prices charged for ECE services. For the illustration, the highest-income families were assigned a contribution in the range of 12–15 percent of income.29
We note that for cost-estimation purposes, these same percentages of income were applied across all four phases of ECE system transformation. However, as the estimated costs of service increase, the aggregate total of payments would increase because higher-income families pay all or most of the higher costs.
Whereas Figure 6-2 shows family payments as a share of income, another approach to determining a reasonable share for families to pay focuses on the total amount of payments to be contributed by families in each income group. This approach allows for consideration of the many
___________________
29 The higher ECE costs projected by the committee generally do not exceed 12 percent of household income, except for those families with large numbers of young children.
low-income families that make zero out-of-pocket payments for early care and education and reflects variation in the number of families in each income group. Figure 6-3 illustrates the progressivity of this family payment schedule example by comparing the share of households in each income group to the share of total ECE payments that would be made by that group. For the lowest three income groups, the share of payments is substantially less than the share of households. For the moderate-income group (2–3 FPL), the shares of households and payments are approximately equal. The top three income groups in the example (3–4 FPL, 4–5 FPL, and top-out30 groups) would pay a substantially greater share of total payments than their share of total households, contributing 64 percent of all family payments while constituting just 34 percent of households.
EXAMPLE PART III: SHARING THE COST, FILLING THE GAP
The committee’s estimate of the total cost of a high-quality ECE system, based on specific, hypothetical assumptions and quality-related policy choices over four phases of implementation, was reported above in “Example Part I: Illustration of a Total Cost Estimate.” In the Example Part II section, the committee offered an example of an affordable and progressive pattern of family shares. This section illustrates the share of funding that would be required from public or private (nonfamily) sources in such a model by subtracting the illustrative estimate of family contribution from the illustrative estimate of the total cost of the ECE system. If the new system included no fees for families, as is the case for public K–12 schooling, the family contribution would be zero and funding from public or private sources would be required to cover the total cost of the system.
While specific estimates of the amount of public assistance needed may vary, depending upon the assigned family payment schedule, the overall picture has consistent themes: current funding levels are well below what would be necessary to support delivery of high-quality service (see Table 6-7).
Table 6-8 summarizes the committee’s illustrative projections—estimated total cost, estimated family contribution, and estimated gap in funding—across the four phases. In the static analysis, the projected annual cost would increase across the phases from about $66 billion to $110 billion, an increase of about 67 percent, as quality standards are increased through
___________________
30 For the purposes of assigning families to income groups and computing average income per group, a maximum income eligibility level—above which families would receive no assistance—was estimated. This level is referred to as “top-out income level.”
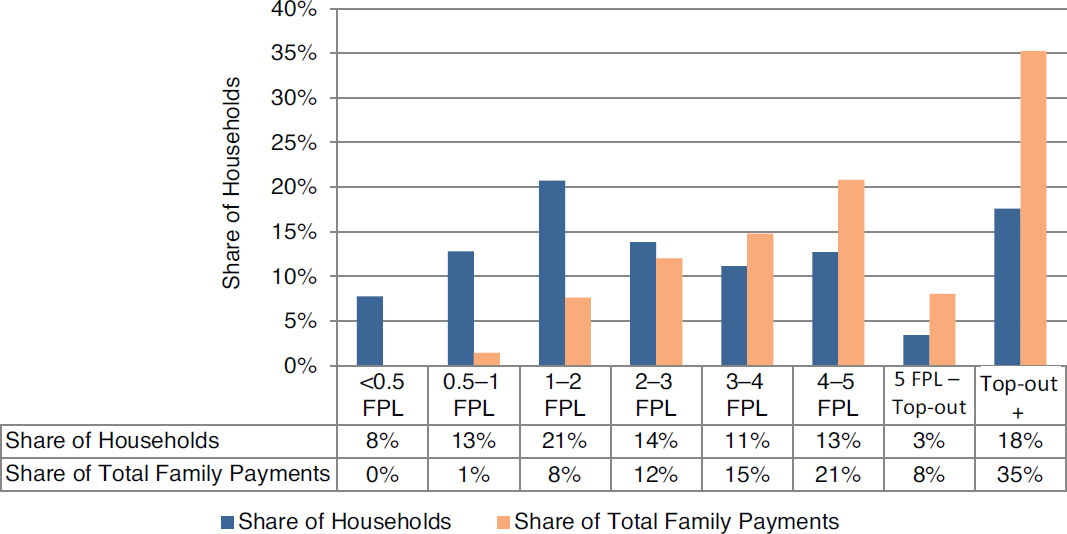
SOURCE: Share of household data from Latham (2017), using data from the 2012 National Survey of Early Care and Education Public Data Set. Share of total family payments for illustrative scenario were generated by the committee.
TABLE 6-7 Current Funding Levels Compared to Costs of High-Quality Center-Based Early Care and Education (ECE), Cost Per Child, Annualized
| Per Child: 2-year-olds | Per Child: 4-year-olds | |
|---|---|---|
| Current Funding Levels | ||
|
Head Start/Early Head Start funding per child |
$12,612 | $8,038 |
|
Public prekindergarten funding per child |
NA | $4,976 |
|
CCDF reimbursement rate (average state) |
$9,295 [for 1-year-old] |
$7,170 |
|
Federal income tax credits: allowable annual expenses |
||
|
CDCTC (per child)a |
$3,000 | $3,000 |
|
DCAP (per household) |
||
|
Married couples |
$5,000 | $5,000 |
|
Single parents |
$2,500 | $2,500 |
| Cost of High-Quality ECE | ||
|
Committee scenario, phase 4 |
$28,203 | $13,655 |
NOTES: CCDF = Child Care and Development Fund; CDCTC = Child and Dependent Care Tax Credit; DCAP = Dependent Care Assistance Program.
a Twenty to 35 percent of the first $3,000 spent on early care and education is allowed by the CDCTC, determined on a sliding scale based on family income (credit decreases with increasing income). The average credit amount is $553 (Internal Revenue Service, 2016b).
SOURCES: Current funding level data are from Barnett and Friedman-Krauss (2016, pp. 16–17); Barnett et al. (2017); Internal Revenue Service (2016); Schulman and Blank (2016, p. 40); Smith (2017). Estimates for cost of high-quality ECE are committee-generated.
TABLE 6-8 Static Estimate, Total Cost (onsite and system level) by Transformation Phase: Family and Public Contributions, Billions of Dollars, Constant 2016 Dollars
| Phase 1 | Phase 2 | Phase 3 | Phase 4 | |
|---|---|---|---|---|
| Total | $65.7 | $76.1 | $93.2 | $109.5 |
| Family payment | $32.2 | $34.0 | $36.7 | $39.6 |
| Public cost | $33.5 | $42.2 | $56.5 | $69.9 |
| Share of total | ||||
| Family payment | 49% | 45% | 39% | 36% |
| Public cost | 51% | 55% | 61% | 64% |
TABLE 6-9 Dynamic Estimate of the Total Cost (onsite and system level) by Transformation Phase, with Estimated Shares of Public and Family Contributions (billions of 2016 constant dollars)
| Phase 1 | Phase 2 | Phase 3 | Phase 4 | |
|---|---|---|---|---|
| Total | $74.5 | $89.0 | $114.3 | $139.9 |
| Family payment | $40.7 | $45.1 | $51.9 | $58.2 |
| Public/private assistance | $33.8 | $43.9 | $62.5 | $81.7 |
| Shares of Total | ||||
| Family payment | 55% | 51% | 45% | 42% |
| Public/private assistance | 45% | 49% | 55% | 58% |
the phases. The family contribution increases from about $32 billion in phase 1 (close to the current total, but distributed more fairly across income groups) to about $40 billion by phase 4.31 The remaining public and private assistance costs increase from about $34 billion in phase 1 to $70 billion in phase 4. The share of public and private assistance to total cost increases from about 51 percent in phase 1 to 64 percent in phase 4, as higher quality standards and cost make early care and education less affordable for some families unless they receive public or private assistance.
In the dynamic estimate (Table 6-9), total annual costs increase about $65 billion over the four phases, from $75 to $140 billion, or an 88 percent increase. The family payments increase from $41 to $58 billion, but their share of the total costs decreases from 55 to 42 percent. The public and private costs for assistance to families and providers, plus system-level quality costs, more than doubles: from about $34 to $82 billion as costs increase by increments greater than families’ ability to pay.
CONCLUSION
In this chapter, the committee provides an illustrative but hypothetical example of a national-level estimate for total costs of offering accessible and affordable high-quality early care and education with a highly qualified workforce to all children, consistent with the Transforming report. Once fully implemented (i.e., in phase 4 of a four-phase process to realize a
___________________
31 Whereas the share of income contributed by each income group remains constant across phases, the total cost of family payments increases for two reasons. First, family payments are capped at the estimated cost of service, so as cost increases, payments from upper-income families increase. Second, as costs increase they become less affordable for upper-middle-income families, who thereby become eligible for public support.
system consistent with the assumptions used for this particular example), the total cost amounts to at least $140 billion per year. If full compensation parity with K–3 educators on a monthly basis were to be reached at full implementation and if all other leadership and instructional salaries were adjusted in a similar fashion, the estimated total system cost for the example would increase by about 10 percent.
The net cost to public and private agencies assisting families to afford access to higher-quality, higher-cost ECE services of course depends on the share of total cost borne by families and by market responses in setting prices. Comparing current public (federal and state) ECE-related spending of roughly $29 billion32 with these estimates of the cost to implement a high-quality ECE system (under the set of assumptions used in this illustration) suggests that current funding levels are well below what would be necessary to support access to high-quality early care and education for all children. If families contribute to the costs as shown in our illustration of an affordable family payment schedule (again, a hypothetical example dependent on a specific set of assumptions), the families’ share of costs would be $41 billion in phase 1 and $58 billion in phase 4. Public costs, under this pair of scenarios (a scenario for ECE system transformation through a four-phase process and a second scenario for an affordable family payment schedule), would increase from about $34 billion in phase 1 to $82 billion in phase 4. For these illustrative scenarios, the increase in public funding from the actual current level would thus have to grow from about $5 billion (in phase 1) to $53 billion (phase 4) a year.33
It is clear that the committee’s estimate of the total cost of providing high-quality early care and education, reinforced by previous cost estimates, suggests that there is a significant gap between the amount of funding currently in the ECE system and the amount of money needed to support access to high-quality early care and education for all children. Given the increased costs of a high-quality system, more families, including low- and middle-income families, will need assistance in order to access and afford high-quality care.
These numbers are large but are not out of line with current international practice nor with current spending on K–12 education. Using the dynamic estimate, which is in 2016 dollar values, ECE costs as a share of gross domestic product (GDP) rise from about four-tenths of 1 percent (0.40%) in phase 1 to three-quarters of 1 percent (0.75%) in phase 4, which is still slightly less than the current average of 0.8 percent of GDP allocated
___________________
32 See Chapter 2 and Chaudry et al., 2017.
33 If no-fee approaches were adopted, the public share of costs would be equivalent to the total cost of implementing a high-quality ECE system.
to early care and education for the nations in the OECD (Penn, 2017).34,35 If families contribute to the costs using the illustrative family payment schedule in the committee’s example, the public contribution would only be about one-fifth of 1 percent (0.18%) of GDP in phase 1 and less than one-half of 1 percent (0.44%) of GDP by phase 4. Moreover, the estimated total cost of high-quality early care and education amounts to only about 12 percent of total K–12 expenditures36 in phase 1 and rises to about 22 percent in phase 4.37 That is, expenditures for one-third as many children of ages 0 to 5 years as children of ages 6 to 18 years would cost only from one-seventh to one-fifth as much.38 If families contribute to the costs using the illustrative family payment schedule, public ECE costs would only rise from about 5 percent of total K–12 expenditures to 13 percent of total K–12 expenditures across the phases.
Of course, the precise cost of a high-quality ECE system that is accessible and affordable to all families depends on the specific details of the system. In this chapter and Appendix A, the committee discusses a number of the decisions that would need to be made in creating a high-quality ECE system and explores ways that a decision maker could project drivers of cost. In doing so, we have provided a guide to decision makers for how to estimate the costs of their individual ECE systems, as well as providing a national-level estimate of the total cost of ensuring all children the opportunity to benefit from early care and education. Both levels of estimation will be necessary considerations in moving forward to an effective financing structure.
___________________
34 The OECD and the European Union suggest that 1 percent of GDP should be spent on ECE services (Penn, 2017).
35 The 2016 U.S. GDP was $18.6 trillion (World Bank, 2017).
36 K–12 expenditures for 2013–2014, adjusted to constant 2015–2016 dollars, total $633.8 billion. See https://nces.ed.gov/programs/digest/d16/tables/dt16_236.10.asp [October 2017].
37 The estimated total cost of early care and education (committee’s dynamic estimate) is equivalent to 10.9 percent of K–12 expenditures in phase 1, 13 percent in phase 2, 16.9 percent in phase 3, and 20.5 percent in phase 4.
38 Total expenditures for K–12 schools in the United States in 2013–2014 amounted to $12,509 per public school student enrolled (in constant 2015–2016 dollars). See https://nces.ed.gov/fastfacts/display.asp?id=66 [October 2017].


