
CHAPTER FOUR
Addressing Uncertainties in Anthropogenic Methane Emissions
Improvements in the accuracy and precision of methane emission estimates will require both top-down and bottom-up measurements, as described in Chapter 3. The improvements should be directed at the portions of the inventory with the greatest uncertainties, and this chapter describes current understanding of uncertainties in both bottom-up and top-down approaches to estimating emissions. Overall, the major drivers for uncertainty in atmospheric methane emission estimation methods are
- lack of accurate activity data throughout all the major source categories;
- deficiencies in sampling procedures, resulting in unrepresentativeness of the samples and therefore resulting in unrepresentative emission factors;
- poor understanding of temporal and spatial variability of emissions, including climate-driven feedbacks;
- presence of sources that are not accounted for;
- presence of episodic high-emitting sources;
- inadequate spatial coverage of observational networks;
- difficulty using top-down approaches in attributing emissions to particular sources;
- inherent uncertainties associated with methods utilizing atmospheric transport models; and
- incorrect assumptions used in calculations and models of methane emissions and atmospheric concentrations.
Additionally, uncertainty arises due to deficiencies in instruments and techniques used to measure methane emissions, which were discussed in Chapter 3.
In this chapter, uncertainties associated with bottom-up estimates are described for each major emission source category. For top-down approaches, uncertainties associated with both the spatial coverage of monitoring networks and the models used to estimate and attribute emissions are described. Uncertainties in methods used to compare top-down and bottom-up emission estimates are also discussed. Finally, this chapter addresses key features for the design of future methane measurement studies to improve the accuracy and precision of emission estimates.
SOURCES OF UNCERTAINTIES IN THE BOTTOM-UP APPROACH
Reported Emissions and Uncertainties
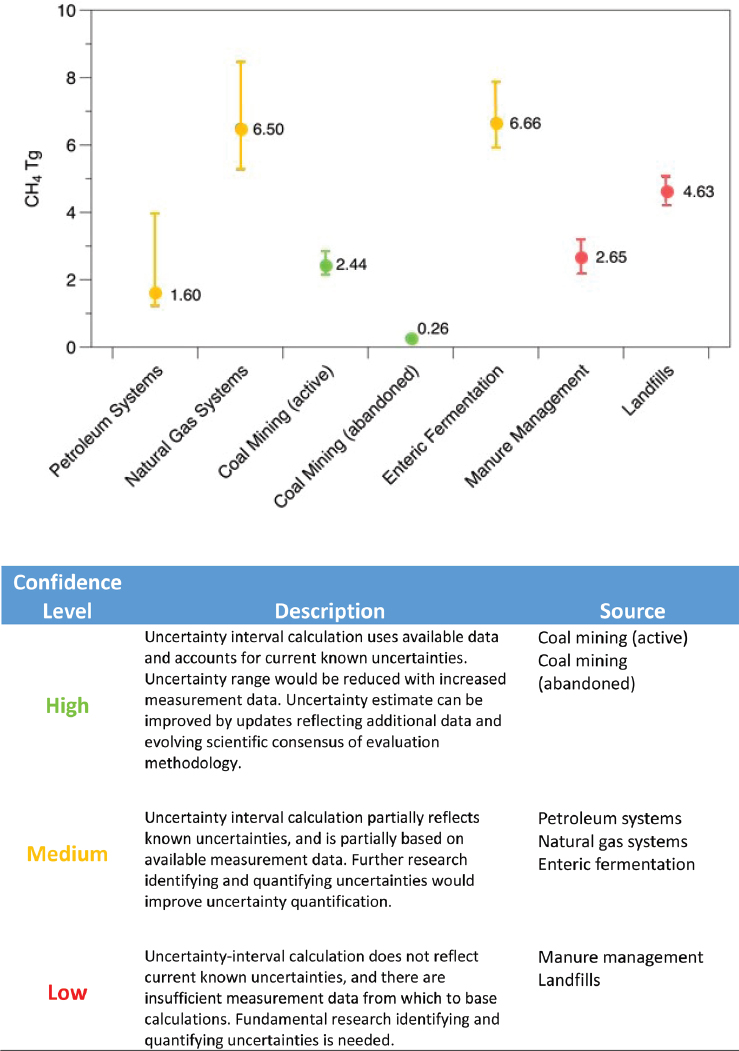
Although some sources of uncertainties are common across major methane emission categories, individual sources have specific types of uncertainties and approaches to address them. The sources of uncertainty, magnitudes of emissions and uncertainties, and recommended approaches for addressing uncertainties are summarized by source category in Table 4.1 and Figure 4.1.
Table 4.1 and Figure 4.1 report uncertainty ranges from the U.S. Environmental Protection Agency’s (EPA’s) 2015 Greenhouse Gas Inventory (GHGI), as well as some other published estimates. There is relatively little documentation of the uncertainty estimates in the GHGI, and the research literature for individual source categories typically indicates larger uncertainties than those reported in the GHGI. The sections that follow describe current understanding of uncertainties in individual source categories, as documented in publicly available sources. In addition, the Committee evaluated the reliability of the uncertainty estimates reported in the GHGI based on the individual source categories discussed here and their deficiencies in methane estimates. Figure 4.1 provides a qualitative assessment of the confidence level of the GHGI uncertainty estimates (high, medium, and low confidence levels).
Enteric Fermentation and Manure Management
The uncertainties associated with methane emissions from enteric fermentation and manure management are generally due to the accuracy of the activity data and the equations used to estimate emissions. For enteric fermentation, as noted in Table 4.1, the uncertainties are due to (1) activity data for cattle numbers, feed intake, and feed composition; and (2) emission factors adjusted by state or region that may be inaccurate on a local scale. Uncertainties associated with the activity data in the GHGI were estimated as ±10 percent, but those related to calculation of emission factors were estimated to be twice that level in the GHGI (EPA, 2017b). Overall estimates for uncertainties in enteric methane emissions in the GHGI were −11 to 18 percent (EPA, 2017b). In comparison, the gridded inventory of Hristov et al. (2017) estimated uncertainties in cattle enteric emissions of 15.6 and 16.9 percent (lower and upper 95 percent confidence bounds, respectively).
Evaluation of models for estimating enteric methane show that the best models for North American cattle had uncertainties of about ±15 percent (Appuhamy et al., 2016),
and the IPCC Tier 2 methodology had over 20 percent uncertainty for the United States (IPCC, 2006). These uncertainties are comparable to the level of uncertainty described in Chapter 3 for individual enteric emission measurements. Based on these uncertainty estimates from independent sources as well as the current state of knowledge of the factors controlling emissions from enteric fermentation, the Committee classifies the estimates of enteric fermentation uncertainties under a medium confidence level (Figure 4.1).
For manure management, uncertainties exist in the activity data and emission factors. The Intergovernmental Panel on Climate Change (IPCC, 2006) methodology estimates that the uncertainty in manure emissions is ±20 percent; however, this may be underestimated because it has been demonstrated with on-farm data that differences between observations and inventory estimates may be as much as 50 percent for some manure systems (Baldé et al., 2016; Leytem et al., 2017). The lower and upper 95 percent confidence bounds for manure emissions in the gridded inventory of Hristov et al. (2017) were even greater at 65.0 and 63.3 percent, respectively. A meta-analysis of on-farm studies by Owen and Silver (2015) reported that anaerobic dairy lagoon methane emissions were on average 368 kg head–1 yr–1 (or 3.68e–7 Tg head–1 yr–1), but the standard deviation was 579, and the range of emissions was from 4 to 2,814 kg head–1 yr–1 (or 2.814e–6 Tg head–1 yr–1), indicating a potentially large range in methane emissions based on the characteristics of any given site, which are likely not being accounted for in current inventory methodology. A lack of on-farm data for a variety of manure management systems under differing climatic conditions as well as a lack of knowledge of the variability of manure characteristics among farms are some of the underlying causes of these high uncertainties (Chapter 2). Because of the lack of activity data related to the distribution of manure (volatile solids) in different manure management systems, along with a lack of on-farm data verifying emissions for the different management systems, the Committee classifies the estimates of manure management uncertainties under a low confidence level (Figure 4.1). The uncertainty reported in the current EPA GHGI is ~20 percent, while the Committee expects the uncertainty to be higher than this, given the current state of the science.
Petroleum and Natural Gas Systems
Uncertainty in the methane estimates, reported in the EPA GHGI at a 95 percent confidence interval, were −19 to +30 percent for natural gas systems and −24 to +149 percent for petroleum systems (EPA, 2017b). Whereas some activity data, such as number of gas production wells, miles of pipelines, number of gas processing plants, and throughput of these systems, are well documented through various govern-
TABLE 4.1 Source of Uncertainties, Comparison of Uncertainty Estimates, and Approaches for Reducing Those Uncertainties in the Major Source Categories in the United States
| Source | Published Estimates of Uncertainties, Tg CH4 yr–1 and % | Key Uncertainties | Approaches for Reducing Uncertainties |
|---|---|---|---|
| Enteric fermentation | 6.66 (5.93-7.86)a (−11% to +18%)a (−15.6% to +16.9%)b (±15%)c (±20%)d |
|
|
| Manure management | 2.65 (2.17-3.18)a (−18% to +20%)a (−65% to +63.3%)b (±20%)d |
|
|
| Petroleum and natural gas systems | Petroleum systems: 1.60 (1.21-3.97)a (−24% to +149%)a Natural gas systems: 6.50 (5.26-8.45)a (−19% to +30%)a (−24% to +29%)e |
|
|
| Production 0.957 ± 0.200 (±21%)f Gathering and boosting 1.697 +0.189 or −0.185 (±11%)g Processing 0.506 +0.055 or −0.052 (+11 to −10%)g Transmission and storage 1.503 (1.220 to 1.950) (−22% to +30%)h Distribution 0.393-0.854i |
|
||
| Landfills | 4.63 (4.21-5.04) (–9% to +9%)a No alternative national assessments of uncertainties are available |
|
|
| Source | Published Estimates of Uncertainties, Tg CH4 yr–1 and % | Key Uncertainties | Approaches for Reducing Uncertainties |
|---|---|---|---|
| Coal mining | Active coal mining: 2.44 (2.13-2.83) (−12.5% to +16.2%)a Abandoned mines: 0.26 (0.21-0.31) (−15% to +24%)a No alternative national assessments of uncertainties are available |
|
|
| Unaccounted sourcesj | Varies |
|
|
f Allen et al., 2013. Emission sources measured: well completions, liquids unloadings, well workovers, equipment fugitive emissions, pneumatic controllers, and chemical pumps.
j For example, residential and commercial operations, natural gas power plants and refineries. NOTES: It is difficult to make direct comparisons between various uncertainty estimates because of different methodological approaches and data sources. This table includes national-scale estimates of methane emissions from major sources; regional estimates are discussed in the text that follows this table. EPA estimates are for the year 2015; reference years for the other cited assessments vary.
mental agencies, other activity data from the petroleum and gas industry, especially component- and subcomponent-level activity data (e.g., storage tank throughput, number of various types of pneumatic controllers, and reciprocating engines), have much higher uncertainty. Petroleum and gas infrastructure consists of millions of distinct emission sources, making measurement of emissions from every source and component practically unfeasible. Because of this, the extent of variability that may exist in these industries is not well understood and not captured in current emission estimates. Four primary sources of uncertainty, as documented in Table 4.1, are (1) temporal variability in emissions (> ±50 percent on a daily basis), (2) wide ranges in measured emissions for individual sources, (3) sparse activity data yet abundance of emission sources, and (4) presence of unrecognized or unaccounted-for emission sources.
Temporal variability in emissions and wide ranges in measured emission rates for individual sources both contribute to the observation of high-emitting sources in petroleum and gas systems (see Box 2.2). Some measurements of high emissions may be due to the size of the facility. However, as described in Chapter 3, even when emissions are normalized by gas throughput or gas produced, a small number of observations with high normalized emissions have been identified. Identifying and quantifying high-emitting sources remains a major challenge to improving bottom-up emission inventories for petroleum and natural gas systems; however, it is not fully understood why high-emitting sources exist. Episodic emissions can be measured or estimated by engineering methods. Malfunctioning high-emitting sources, however, are difficult to predict in terms of temporal and spatial occurrence and may lead to large uncertainties in mean emission estimates.
In addition to uncertainties in emission estimates due to high-emitting sources, there is uncertainty related to the activity data estimates used in the GHGI for key emission components (e.g., count of the different types of pneumatic controllers or condensate tanks). These uncertainties in activity data are difficult to quantify but can be significant. For example, for one of the largest sources of methane emissions in the natural gas supply chain—pneumatic controllers—the estimated number of controllers per well increased by 90 percent from the 2011 GHGI to the 2015 GHGI when new information from the EPA Greenhouse Gas Reporting Program was used to update activity data (see Chapter 3). As also described in Chapter 3, uncertainties arise from the granular estimates of emission factors and activity data for several emission categories (e.g., number of high-bleed, low-bleed, and intermittent pneumatic controllers; and number of centrifugal compressors with wet seals and dry seals).
Uncertainties in methane emissions from petroleum and natural gas systems also arise from emissions that are unaccounted for in current inventories (see Chapter 2).
In the past several years, there has been a significant effort to understand and quantify the uncertainties of methane emissions from petroleum and natural gas systems, and much has been learned about the top emission sources. The EPA is currently considering updates to petroleum and natural gas uncertainty estimates to incorporate these new data and revised methodologies into their inventory.1 Further work to estimate activity factors, to improve sampling strategies to better understand the mechanisms leading to high-emitting sources, and to incorporate currently unaccounted emission sources would improve the uncertainty estimates. The Committee’s assessment of the uncertainty estimation for this source category is at medium confidence level (Figure 4.1).
Landfills
Uncertainties within current landfill methane inventories are largely due to GHGI and GHGRP models, which do not rigorously account for site-specific climate and operational factors as discussed in Chapters 2 and 3. Realistically, uncertainties are much greater than current EPA estimates and require independent determination using site-specific data and process-based modeling with integrated uncertainty calculations. As discussed previously in Chapters 2 and 3, there are fundamental issues with the current IPCC (2006) methodology with regard to estimating site-specific landfill methane emissions for regional-scale inventories. Although it is important to track societal trends by quantifying annual U.S. waste generation, waste recycling/diversion strategies, and the residual mass of landfilled waste, there is no robust relationship between landfilled waste mass and annual emissions, as assumed by current inventory methods. Conversely, it can be readily demonstrated that waste mass is linearly related to the mass of recoverable methane using engineered biogas recovery systems. Chapter 3 previously addressed this relationship using 2010 data for 129 California sites (Spokas et al., 2015). The implication is that methane generation from landfilled waste can proceed at a relatively steady rate over decadal time frames, as opposed to the current IPCC (2006) first-order kinetic equation, wherein methane generation from a given mass of waste peaks in the year of disposal and declines exponentially thereafter. At present, there is approximately a half century of national U.S. experience with the controlled burial of organic waste in engineered landfills and concurrent biogas recovery.
___________________
1 See https://www.epa.gov/sites/production/files/2017-06/documents/updates_under_consideration_for_2018_ghgi_natural_gas_and_petroleum_systems_uncertainty_estimates_508.pdf.
Emissions, on the other hand, can be related to two major factors emphasized in recent literature: (1) site-specific operational practices (i.e., area/thickness/texture of cover soils, extent of biogas recovery, whether intermediate cover soils are stripped prior to “vertical expansions”; see Chapter 3) and (2) site-specific climate, which affects temporal methane transport and oxidation rates in cover soils. In general, landfill emissions have large spatial and temporal variabilities, which contribute to inherently high uncertainties.
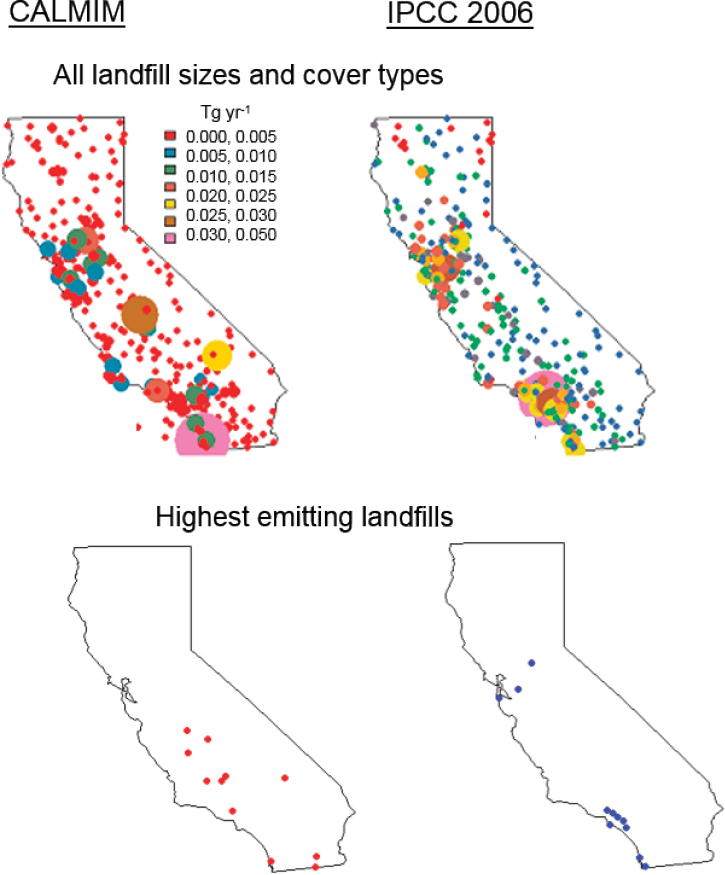
To better quantify those uncertainties, a field-validated process-based model (e.g., the California Landfill Methane Inventory Model [CALMIM] 5.4), also discussed in Chapter 3, could be applied to develop a complementary national inventory in parallel with the GHGRP during the next annual reporting cycle. A modest amount of additional data would be required for this task, namely, the area, thickness, and texture of facility-specific cover soils, as well as the extent of underlying biogas recovery. Spokas et al. (2015) previously compared 2010 California emissions (372 sites) using CALMIM to estimated 2010 site-specific methane emissions using IPCC (2006), as reported by the California Air Resources Board. Figure 4.2 gives an indication of the relative magnitude of those site-specific differences for individual California landfill sites. The total 2010 state emissions were serendipitously similar (0.30 and 0.34 Tg methane yr–1 for IPCC and CALMIM, respectively). However, the highest-emitting sites differed substantially, as also shown in Figure 4.2. The highest emitters using IPCC (2006) were the sites with the largest mass of waste, whereas, using CALMIM, the highest-emitting sites had large areas of intermediate cover (thinner than final cover) and low seasonal methane oxidation rates. The highest-emitting sites shown in the figure using CALMIM corresponded primarily to Central Valley and desert sites with deficient soil moisture and daily temperatures exceeding optimal oxidation conditions. Overall, the intermediate cover areas were responsible for 96 percent of the total state emissions. Currently, both the GHGI and the GHGRP “assign” percent methane recovery and oxidation values without complementary site-specific climate modeling; hence, those values may differ substantially from field reality, introducing large uncertainties. If CALMIM is applied to a national database such as the GHGRP, it could provide high-resolution output for cover-specific emissions at each site (10-min time steps and 2.5-cm depth increments) and cover-specific annual emissions, as well as cover-specific standard deviations for monthly and annual timescales.
In summary, the current methodology is outdated and does not explicitly consider the major drivers for emissions: (1) site-specific operational practices as discussed above (i.e., cover soils, extent of biogas recovery) and (2) site-specific climate (variable methane transport and oxidation rates in cover soils due to temporally variable soil moisture and temperature). It is important to note that IPCC (2006), as well as exten-
sions of that methodology for the GHGI and GHGRP, was never field-validated specifically for emissions and retains a major dependency for emissions on the mass of buried waste at each landfill site. Because of these deficiencies, the Committee classifies the estimates of landfill emission uncertainties under a low confidence level (Figure 4.1).
Coal Mining
In active underground mines, methane emission measurements from degasification systems are relatively easy to monitor because degasification systems are localized, and the measurements are usually performed at the surface. Therefore, the uncertainty of emission estimates for degasification systems is low.
Emission estimates from the ventilation systems carry larger uncertainty. These measurements are taken in mines to ensure safety by controlling the percentage of methane in the ventilation air. The measurements are usually performed at predetermined locations that are indicated in the mine’s ventilation plan submitted for approval and at the locations mandated by the U.S. Mine Safety and Health Administration. The monitoring devices can be handheld or machine-mounted sensors. As long as the equipment is functioning well and the measurements are taken frequently, methane emission estimates are reliable. However, the position of the sensor with respect to the cross section of the entry and how the measurements are taken can be critical. This is due to methane layering in low-velocity areas and variable airflow rates in high-velocity entries. For ventilation systems, methane emissions are calculated based on the flow rate and the methane content in the ventilation air. Both measurements rely on underground observations in entries connected to the ventilation shafts. Since the emission estimate relies on individual measurements in the entries rather than the total output on the surface, accurate reporting can be obtained by visiting and measuring all entries. Usually, there are no measurements conducted at the surface to confirm the values obtained underground, yet such measurements are needed to verify the current techniques. Further, methane emissions from mines change based on atmospheric pressure variations, and so continuous measurements are warranted. Therefore, a set of measurements that miss a major atmospheric change in pressure and temperature (e.g., large rainfall) may grossly underestimate or overestimate the actual emissions. Even for current measurements in underground mines, differences in annual emissions of 10 percent have been reported (Mutmansky and Wang, 2000).
For surface mines, although the production data are relatively accurate, uncertainties are present in the gas content data and the emission factor. Because gas content
can vary widely between and within the coal (e.g., Strąpoć et al., 2008), especially for shallow basins that have surface mines, basin-specific gas content data used in the calculations give only a very general estimate. Moreover, shallow coals, which are not a target for coal-bed methane (CBM) because of their low gas content, usually have limited gas content data; thus the basin gas content average may be far from accurate. Most gas content data come from coal occurring deeper than 76 m, which is typically gassier than shallow coals. If these gas content values are used, the values would overestimate the gas content and consequently the emissions. Emission factors may vary as well, depending on specifics of the mining method and coal and overburden handling in the mine, but their impact is likely lower than that of variation in gas content. As mentioned in Chapter 2, the current emission factor to calculate emissions from coal is a factor of 1.5 (or 150 percent of the in situ gas content; EPA, 2017b), an assumption based on the studies by Environment Canada (Jaques, 1992) and the EPA (Kirchgessner et al., 1992). A follow-up study of Canadian emissions (King, 1994) applied emission factors categorized by mine type, coal basin, and coal rank using mine-specific data and also suggested increasing gas content data by 50 percent to account for the emissions from unmined strata. Adding data about coal rank and mine-specific factors would decrease the uncertainty.
Post-mining emission factors currently assume 32.5 percent of in situ gas content (same for surface and underground mines; EPA, 2005), following a study on British coals (Creedy, 1993). For comparison, a 20 percent factor is used in Australian methodology, after data by Williams et al. (1993). For U.S. coals, Kirchgessner et al. (2001) estimated emission factors of 72-78 percent for surface mines (55-59 percent for underground mines). EPA uncertainty analysis for active coal mining (EPA, 2017b) indicates that, for example, in 2015, methane emissions from coal mines were estimated to be between 2.13 and 2.82 Tg methane at 95 percent confidence level, which suggests that approximately 16.2 percent above and 12.5 percent below the reported estimates could be expected.
The uncertainties for abandoned underground mines are related to uncertainties in generating a decline curve which, in turn, depends on (1) coal methane adsorption isotherms, (2) coal permeability (which determined methane flow capacity), and (3) pressure at abandonment. Methane adsorption isotherms can vary within the same coal seams and the same mines (Mastalerz et al., 2004). Isotherms are often not available for a specific coal or mine, necessitating the use of an isotherm of some other coal mine that may not be representative. Coal permeability is another parameter that is not often available for the specific coal and mine. Improved monitoring for abandoned mines could include pressure buildup and methane concentration measurements at the surface. EPA uncertainty analysis indicates that for 2015, emissions from
abandoned underground mines, a range of 0.21 and 0.32 Tg methane at 95 percent confidence level translates to a range of 18 percent below and 24 percent above the 0.26 Tg methane emission estimate for 2015 (EPA, 2017b).
There are several ways to reduce uncertainties in coal mining (Table 4.1). However, because the number of both surface and underground mines is well documented and there is good understanding of coal production, the Committee classifies the estimates of both active and abandoned mining uncertainties under a high confidence level (Figure 4.1).
Unaccounted-for Sources of Emissions
In addition to the uncertainties of the sources that are listed in the inventories, bottom-up emission inventories also have uncertainties due to emission source categories that are missing from the compiled estimates (see Chapter 2).
Both known unaccounted-for sources and previously unrecognized emission sources can be quantified and revealed (for previously unknown sources) by integrating top-down and bottom-up assessments. For example, Kort et al. (2014) discovered the largest point source of methane in the Four Corners region by carefully aggregating a decade of data from the Scanning Imaging Absorption Spectrometer for Atmospheric Cartography (SCIAMACHY) satellite with ground-based observations. Later analyses suggested that the dominant source was microbial coal-bed methane from active mining (e.g., Arata et al., 2016). In another example, by combining bottom-up and top-down approaches to partition emissions in an urban setting of Indianapolis, Lamb et al. (2016) suggested that the presence of diffuse, widespread emissions was the reason for lower bottom-up methane estimates.
Identifying and quantifying unaccounted-for emissions through multiscale measurement campaigns is critical to addressing uncertainties in emission inventories and to improving understanding of methane emissions in general.
Overall Source Category Conclusions
Based on the source category–specific discussion about uncertainties, the Committee concludes that
Each source category has a wide range of uncertainties for methane emission estimates: sparse activity data and limited emission measurements are the primary reason for uncertainties in most source categories. Reducing these
uncertainties requires collecting and reporting activity and emission data in a consistent and comprehensive manner and will be challenging because of cost, time, and technical limitations.
Priority anthropogenic sources for future research on methodological and data improvements are petroleum and natural gas systems, enteric fermentation, manure management, and landfills because of these sources’ high uncertainties and/or overall high contribution to total anthropogenic U.S. methane emissions (Figure 4.1).
SOURCES OF UNCERTAINTIES IN THE TOP-DOWN APPROACH
The sources of uncertainties in top-down approaches to estimating emissions can be due to sparse networks and infrequent sampling, models used to estimate emissions from atmospheric measurements (inverse models), and methods used to attribute top-down emissions to specific source categories. These uncertainties and approaches for addressing uncertainties are summarized in Table 4.2.
Sparse Atmospheric Monitoring Observations
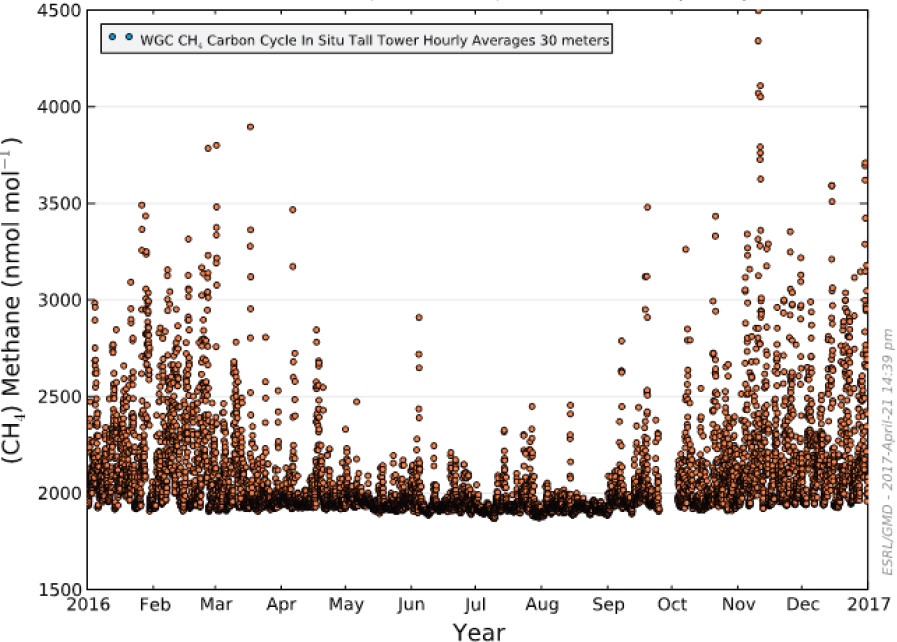
As described in Chapter 3, methods for measuring atmospheric methane using high-quality, globally distributed networks have uncertainties of 1.1 ppb (95 percent confidence, as of 2016), or only 0.06 percent assuming a global average atmospheric methane concentration of 1,850 ppb. However, the coverage of these measurement networks is sparse, and sampling is weekly or even less frequently at many sites. Even though current aircraft and surface sites that sample the continental United States are more densely located relative to many other parts of the world, the U.S. network is still very sparse. At continental scales, the presence of strong local sources and atmospheric variability requires dense and frequent sampling to produce accurate and precise emission estimates. Figure 4.3 shows the large variability in atmospheric methane from a continuous analyzer at Walnut Grove, California, that likely reflects large signals from nearby sources and variability in transport of the source signals. In addition, stable nighttime or wintertime meteorological conditions play a role in producing some of the large peaks because emissions can be trapped near the surface under stable conditions, leading to large anomalies. For this reason, current inverse modeling systems often use data that have been filtered to retain deep, well-mixed boundary-layer conditions that can occur during the afternoon hours. This is necessary because even high-spatial-resolution regional atmospheric transport models have difficulty
TABLE 4.2 Sources of Uncertainties in Top-Down Emission Estimates
| Source of Uncertainties | Recommended Approaches to Reduce Uncertainties |
|---|---|
| Sparse networks | |
|
|
| Inversion models | |
|
|
| Attribution methods | |
|
|
simulating the shallow nocturnal boundary layer, and filtering the data for this biases sampling toward particular times of the day.
Uncertainties in current top-down methane emission estimates at global and continental scales are increased by sparse surface observation networks that do not capture the full spatial variability in emissions.
Characterization of methane over continental regions is difficult due to the presence of local sources of emissions and atmospheric variability, which make more frequent and denser network observations necessary.
Continental methane mole fraction measurements have been used with mass balance approaches to estimate emissions for continental-scale regions. Upwind and downwind observations are required for this approach as is accurate knowledge of winds and atmospheric stability, which are often not well quantified. Aircraft monitoring observations collected along the Pacific and Atlantic coastal boundaries of the United States are a logical choice for quantifying background methane emissions (Crevoisier et al., 2010). However, infrequent sampling and large atmospheric variability likely limit the accuracy of boundary conditions derived from interpolated aircraft profiles (Bruhwiler et al., 2017).
Satellites can provide a complementary view of regional methane abundances from their vantage point in space. However, remotely sensed data are not as accurate as in
situ measurements, which can be calibrated against standards (see Chapter 3). In fact, current satellite instruments such as SCIAMACHY have been shown to have persistent biases in space and time (e.g., Bergamaschi et al., 2013; Houweling et al., 2014) that need to be accounted for if satellite data are to be assimilated into atmospheric inverse models. These biases are much reduced for the higher-spectral-resolution instruments (e.g., the Greenhouse Gases Observing Satellite; Butz et al., 2011; Schepers et al., 2012). Biases can be reduced with improved retrieval algorithms and instrument specifications and in comparison to ground-based remote sensing, for example, from the Total Carbon Column Observing Network (Wunch et al., 2010), many biases might remain that will be on the order of a few parts per billion for the column-averaged methane concentration. Atmospheric inversions employing satellite retrieval data must account for these systematic errors, which are often the same order of magnitude as the gradients used for inversion analysis.
For studies at smaller (e.g., regional) spatial scales, these larger-scale biases might not matter as long as observed gradients in methane can be much larger than these potential errors. A combination of ground-based background stations to provide accurate methane measurement in pristine air and satellite data to quantify strong local and regional gradients of methane has the potential to improve spatial and temporal coverage of measurements.
Top-down measurements using aircraft have also been used to estimate emissions at the spatial scale of a fossil fuel basin, but these measurements, while having a fine spatial resolution, are limited in temporal coverage. Steady winds and consistency in other meteorological conditions are needed, meaning that there are practically few flights where these conditions are met. Furthermore, these aircraft measurements are limited to midday periods when the planetary boundary layer is fully grown and well mixed. Hence, these measurements provide only a snapshot of emissions for that period, in contrast to tower or other measurements that provide a continuous time series. Measurement uncertainties can be reduced by employing a wind profiler and conducting multiple downwind transects. Since not all emissions are constant throughout the day (Allen, 2016; Allen et al., 2017; Schwietzke et al., 2017), care must be taken in comparing aircraft flights to bottom-up emission estimates. Daily and diurnal variability in emissions can be substantial (greater than 50 percent of the mean emissions) in some petroleum and gas production regions (Allen et al., 2017; Schwietzke et al., 2017). A significant investment in top-down measurement flights would likely be required to gather enough estimates to adequately characterize emissions, their intermittency, and their trends and, consequently, to reduce existing uncertainties.
Methane Flux Inversions
Emission estimates from methane flux inversions vary widely among different modeling systems, and this implies uncertainties in top-down methods. Global total emissions are well constrained by observations, and inversions using these observations should theoretically be in close agreement. As part of the Global Carbon Project (GCP) Methane Activity, Saunois et al. (2016) assembled 30 atmospheric inversions from nine different modeling systems. The GCP ensemble found that annual total global emissions for 2003-2012 were 558 Tg methane yr–1 with a range of 540 to 568 Tg methane yr–1 (5 percent of the mean value). Differences among the inversions for the north-south distribution of emissions were found to be larger, although the inversions agree that methane emissions are largest in the tropics and populated northern mid-latitudes. In the tropics, the range of the inversions can approach 50 percent of the mean zonal emissions. Even larger differences in estimated emissions occur at continental scales.
There are several reasons for the disagreement between the inversions. Observations are sparse in space and time, even for “well-observed” regions such as the United States; therefore, inverse techniques must rely on “first-guess” or “prior” emission estimates to stabilize the solution, and uncertainties in prior emissions are usually difficult to quantify. In particular, natural emissions such as those from wetlands are highly uncertain, and estimates of emissions from process wetland models can vary widely (Melton et al., 2013; Poulter et al., 2017). Biases in these models used for prior emissions can result in biased posterior flux estimates. These uncertainties have been summarized in the previous section of this chapter. Increasing the coverage of observations is needed to improve the ability of inverse modeling systems to accurately estimate emissions. For example, quasi-continuous observations are collected at 18 sites in Europe as part of the Integrated Non-CO2 Greenhouse gas Observing System project. These measurements are calibrated and carefully controlled for quality. Bergamaschi et al. (2018) demonstrated the value of these observations for estimating European methane emissions. Currently, the U.S. sites that measure methane continuously are located mainly in California and the Northeast. Consideration should be given to increasing the spatial coverage of continuous monitoring sites.
Increasing the spatial coverage of quasi-continuous observations over the United States will decrease uncertainties in top-down estimates of U.S. methane emissions. Different choices of prior emission estimates and their associated uncertainties is a driver for disagreement among inversions. Development and use of prior estimates that are as accurate as possible is a priority for improving top-down emission estimates using inverse models.
Some inversions use only observations from the National Oceanic and Atmospheric Administration surface network to avoid differences in analysis systems. Other modeling systems may use observations from different institutions that may not be comparable. Some modeling systems use only sites where data records of a certain length exist because in early years there were fewer sites, and changes in a sparse network over time can lead to abrupt and unrealistic changes in estimated emissions (e.g., Bruhwiler et al., 2011; Rödenbeck et al., 2003). The use of space-based data and their error covariance is another significant difference between inverse modeling systems since retrievals of average column abundance can have systematic biases that vary spatially and over time (Monteil et al., 2013). Finally, observations not available to all researchers have been used by some top-down studies, resulting in estimated emissions that can be significantly different. If observations are not made available, then these results cannot be reproduced, violating the scientific principle that studies should be reproducible.
An important source of disagreement among atmospheric inversions is the choice of observations and their weighting relative to prior information. Given that in situ observations are sparse and large regions are unconstrained, it is essential that existing observations are carefully calibrated and shared freely among the global research community.
A major source of difference among inversions is atmospheric transport, and Locatelli et al. (2015) showed that differences in modeled transport can change the source apportionment among regions. In particular, using relatively coarse-resolution global models to represent in situ point measurements is challenging. It may be possible to produce a fairly accurate simulation of methane at remote sites, but continental sites near strong local sources introduce additional complexity. Simulation of atmospheric transport at continental sites is further complicated by topography and processes that are difficult to resolve in coarse-resolution transport models, such as convection and the diurnal collapse and growth of the planetary boundary layer. An additional difficulty is determination of the transport model error for use in inversions since it is difficult to separate errors arising from lack of knowledge of the underlying emission distribution from model transport errors. Although it might be expected that higher model spatial and temporal resolution would lead to more accurate simulations at measurement sites, it has been difficult to prove (Díaz Isaac et al., 2014). More accurate transport models will likely require more computationally intensive models that have high spatial and temporal resolution.
At all scales, uncertainties in top-down methane emission estimates arise due to uncertainties in atmospheric transport models.
Current global and regional atmospheric transport models being used for atmospheric inversions are likely unable to accurately represent small-scale processes. As a result, it is difficult for these models to accurately simulate observed methane at continental sites. Developing higher spatial- and temporal-resolution atmospheric transport models and approaches for evaluating these models would likely improve transportation simulations.
Current inverse models suffer from several limitations that prevent them from being fully exploited to track methane emissions. To track changes in emissions and to quantify budgets on regional scales, a societal commitment to high-quality, long-lasting data records with adequate spatial coverage needs to exist. The in situ network should be supplemented by space-based observational strategies in order to increase spatial and temporal coverage. Data records need to be shared among international institutions so that results can be replicated by multiple groups. Furthermore, collaborations between the atmospheric modeling and weather prediction communities could lead to significant improvements in atmospheric transport models. Novel approaches to making measurements of important diagnostic quantities (such as planetary boundary layer depth) will also further the development of atmospheric transport models. It is hoped that the end result will be better understanding of how anthropogenic and natural emissions of methane evolve over time to influence the chemistry and radiative balance of the atmosphere.
EMISSION INVENTORY IMPROVEMENT STUDIES: DESIGN AND DATA ANALYSES
Improvements in the accuracy and precision of methane emission estimates will be maximized through the use of both top-down and bottom-up measurements. While working toward this goal, consistency in measurement and modeling approaches and development of study protocols need to be transparent to the researchers involved in methane emission measurements. As noted in prior chapters, one barrier to incorporating results from measurement studies into the GHGI is the mismatch of the spatial and temporal timescales of interest. The GHGI is tasked to provide national, annual average emission estimates, whereas bottom-up and top-down studies are conducted typically at much smaller spatial scales and are often paired to compare estimates over contemporaneous and short time periods. In addition to pairing multiple multiday top-down and bottom-up methods contemporaneously (Chapter 3), improvements to measurement studies, as discussed in more detail below, would enable the potential adoption of results from these studies to the GHGI.
Sampling Strategy and Statistical Analysis
An early study design question to be answered is sample size. Determining the sample size is difficult if the distribution is unknown. Before collecting data, sample size calculations are often done so that the predicted uncertainty (such as the width of the confidence interval [CI]) is below a desired level set by the researcher. However, such calculations require presumptions about the underlying distribution of the data, and achieved CIs may be wider than anticipated by sample size calculations. Brandt et al. (2016) illustrate that the achieved CI for data that exhibit heavy-tailed (see below) behavior is wider than the CI that results from a hypothesized lognormal distribution.
When enteric methane emissions are measured in livestock, sample size will depend on the method used. As described in Chapter 3, the use of respiration chambers is limiting the number of animals that can practically be included in a study. The use of the other two established methods for measuring enteric emissions, the SF6 tracer method and the GreenFeed® system, allow a larger number of animals to be studied. In the latter cases, the sample size will be determined based on the experimental design (i.e., randomized block or crossover), the expected response to treatment, and the variability in the parameters measured. Usually, a sample size of 12-20 cattle/treatment is sufficient for randomized block design studies to statistically detect a difference in emissions of >10-20 percent. A minimum of eight cattle may be required to detect such a difference in a crossover design study. The length of measurement is also important; a minimum of 3 days is required for respiration chambers and a minimum of 5 days for the SF6 method. The length of measurement for GreenFeed® will depend on the environment in which it is used. When animal access to GreenFeed is controlled by the investigator, eight measurements over a 24-hour cycle are sufficient; however, when the animals have free access to GreenFeed, a longer period is required to collect gas samples from all animals in the study and at times representative of a feeding cycle (see Renand and Maupetit, 2016).
When manure emissions are measured, it is usually done on a farm-by-farm basis. Unfortunately, no farm can truly be replicated because there are always differences in diet as well as manure handling and storage practices. Replication of measurements on several farms will provide data as to the potential range of emissions on farms. However, it may be more beneficial to report emissions per unit of volatile solids in storage over any given time period. This way a comparison can be made across farms that have variation in management practices. In addition, other variables that affect methane emissions need to be collected, including temperature, pH, and wind speed, in order to develop prediction equations that are meaningful across a range of management and climatic conditions.
Landfill emissions require consideration of the multiple cover soils at each site (e.g., thickness and properties), whether engineered biogas recovery exists under each cover, and seasonal climate effects on soil gas methane transport and microbial oxidation. Thus, combinations of techniques that can capture the spatial and temporal variability of emissions are frequently required, often along with a randomized statistical design for small-scale measurements for each cover type. In addition, linkage with climate models and temporal collection of site-specific weather data, as well as soil gas temperature and moisture data, are desirable to understand transient changes in soil gas transport and oxidation rates.
High-emitting sources are a small number of sources that contribute a high fraction of the cumulative total emissions, resulting in a data distribution that exhibits a fat, or heavy, tail. High-emitting sources have received a great deal of attention in petroleum and natural gas systems, and landfills can have “hotspots”; however, the question of whether other source categories have estimation issues due to high-emitting sources is relatively unstudied. The weight of a heavy distribution’s tail can be quantified by a parameter that can be estimated from data. Brandt et al. (2016) estimated extremely heavy tails in the distribution of emissions from petroleum and natural gas sources. Although there were large uncertainties associated with these estimates because of small sample sizes, tails were estimated to be heavier than those of other known heavy-tailed phenomena, such as crop losses and income distribution.
The presence of high-emitting sources contributes to increased uncertainty in mean methane emission estimates. Quantifying uncertainty in the case of heavy-tailed distributions is more challenging and should be addressed transparently and with statistical rigor. When data are heavy tailed, familiar distribution-based methods, which produce a symmetric confidence interval for the mean estimate, are clearly inappropriate. An attractive alternative is parametric bootstrapping, in which a distribution is assumed for the data, and the parameters for that distribution are estimated. Repeated samples are drawn from this fitted distribution, and mean estimates from these samples are used to produce the CI. However, even when the assumed distribution has a relatively heavy tail (such as the lognormal), these distributions can underestimate the magnitude of the largest observations when fitted to the data, resulting in an underestimated bootstrap uncertainty. Brandt et al. (2016) show that parametric bootstrapping methods can underestimate the uncertainty associated with the mean estimate for heavy-tailed distributions of methane emissions. Another alternative is nonparametric bootstrapping methods, which make no distributional assumption about the data. Rather than fitting a distribution, the original dataset is resampled, and mean estimates from these resamples are used to produce a CI. Even nonparametric bootstrapping methods are complicated by distributions with extremely heavy tails
because standard resampling methods may not be appropriate if the underlying distribution cannot be assumed to have a finite variance, and adjustments to the procedure have been suggested (Bickel et al., 1997; Politis et al., 1999).
To address the increased uncertainty arising from the presence of high-emitting sources, certain experiments have attempted to oversample the “tail” (Lan et al., 2015; Lyon et al., 2015; Yacovitch et al., 2015). By designing a study that oversamples the tail, it could be possible to reduce uncertainty in the mean emission estimate, and such a study likely may cost much less than a study with similar uncertainty resulting from a very large random sample. The result of such an experiment should be viewed as a stratified sample, and both study design and statistical analysis of the resulting data should reflect the stratification. Importantly, in addition to emission measurements being recorded for the general (nonexceeding) observations and the detected high-emitting sources, estimates of each stratum’s proportion of the population are required. Further complicating the analysis, the detection procedure is likely not perfect; that is, not all high-emitting sources may be detected during the initial screening. If so, the probability of detection should be estimated and incorporated into the analysis.
Mechanistic understanding of the causes and frequency of large emissions would also reduce uncertainty resulting from the presence of these high-emitting sources. Conceptually, one could perform multiday screening measurements at various times of the day to detect the presence of a high-emitting source (here defined as an observation whose emission rate exceeds some prespecified threshold), and if detected, the observation’s emission rate could then be quantified. Raster flights and mobile measurements paired with direct facility-level measurements across the area of interest could support this initial screening. Regardless, such screening needs to be “ground-truthed” with operator data on activities and classification of high-emitting sources as routine, episodic, or malfunctioning.
When emission data indicate a small number of high-emitting sources, uncertainty about the mean emission rate could be reduced by employing sampling strategies designed to better quantify the contribution from these high-emitting sources. Careful consideration of any assumptions underlying the statistical analysis is warranted and, when in doubt, selection of statistical methods with fewer distributional assumptions is optimal.
Much of the research thus far has been based on noncontemporaneous, offsite measurements without site data or access and has not attempted to attribute the classification of the high-emitting source (routine, episodic, or malfunctioning; Box 2.2). Without further classification of the observed high-emitting sources, oversampling the tail may assume that episodic events are prevalent for the entire year or that
chronic events have a higher statistical occurrence than in reality, which has direct implications for inventory estimates. Zimmerle et al. (2016) compared top-down and bottom-up measurements without reliance on statistical estimators by employing high-resolution spatiotemporal activity data from operators and measurements at operator sites.
Recent top-down and bottom-up studies have highlighted the importance of site access and collaboration with operators to improve emission estimates and provide a mechanistic understanding of emissions (e.g., Bell et al., 2017; Robertson et al., 2017; Schwietzke et al., 2017; Yacovitch et al., 2017). Inherent biases in measurement sample sites in bottom-up studies can be minimized through various strategies such as random selection of sites by the research team, paired measurements, review of operational records prior to site visit, and/or comparison of measurements at similar sites. Prescreen measurements employing raster flights and/or mobile methods around the study area of interest can aid the eventual sample selection process and provide an indication of the emission profiles of accessible sites relative to other sites. The opportunity to conduct paired emission measurements (i.e., measurements employing different methods contemporaneously) may reduce sampling bias between measured sites versus nonpartner sites. For example, conducting a tracer-flux measurement at a facility with site access and conducting aircraft measurements in the area can ascertain whether the sites are representative of operations in the area. In addition, having an independent site sampling coordinator to review operational and maintenance records, historical emission inventories, and distribution of emissions (including accounting for high-emitting chronic sites and episodic events) may help reduce the site selection bias. Further, having the independent site coordinator observe measurements and operational records during the field campaign helps to document potential bias of the sites being sampled. Additionally, conducting multiday measurements at sites with access may assist the researcher to ascertain variation in emissions from prior work.
Requirements for transparency regarding site access and communication of operational and maintenance details is vital for modeling the characteristics and frequency of all sources from a facility or a region.
Expanding the Observational Network
Many top-down approaches are inhibited by the limited number of spatial locations where methane concentration measurements are taken. It is logical and important to consider which additional locations would provide the most relevant information.
Observation system simulation experiments (OSSEs) can be conducted to determine how to best allocate resources when expanding the observation network. OSSEs involve using simulated data to explore the effect of their use in data assimilation, for example, atmospheric flux inversions. Because simulated data are used, hypothetical observation strategies can be explored. An example is the study by Basu et al. (2016) that found that with about 5,000 radiocarbon (14CO2) observations in the United States, uncertainties of top-down estimates of regional monthly fossil fuel emissions of carbon dioxide could be reduced to within 5 percent. Similar OSSEs could be developed to evaluate the potential benefit of measuring methane from commercial aircraft, or the distribution of monitoring sites needed to adequately define the temporal and spatial variability in methane inflow to the United States for regional top-down systems, or how frequent and dense observations must be to monitor emissions from a petroleum/gas field. An important caveat concerning the interpretation of OSSEs is that model errors must be carefully considered to prevent overly optimistic interpretation of the benefits of observing strategies. These errors are usually difficult to quantify, but possible approaches include using multiple independent atmospheric models and using model ensembles.
Top-down studies would benefit from careful consideration of how the placement of additional observation sites will influence the information they provide. Observation system simulation experiments can inform observation strategies and determine how best to allocate resources when expanding the observation network.
Source Attribution
Top-down measurements often result in total emission estimates; attributing these emissions to specific sources using the top-down approach can be done using forward and inverse models, as described in the preceding section. Molecular and isotopic tracers can also provide useful constraints on sources. Atmospheric molecular and isotopic trace species (e.g., ethane, methyl chloroform, and the methane isotope δ13CH4) collectively provide more information about the sources of emissions contributing to top-down measurements. However, using tracers to constrain top-down estimates of methane emissions introduces other uncertainties. For example, it is uncommon to find unique isotopic or molecular markers for major sources. Moreover, for soil sources (i.e., landfill methane) both the carbon and hydrogen isotopes are variably fractionated by seasonal oxidation in cover soils and thus not useful for top-down fingerprinting of landfill sources. In general, the ratios of various carbon and deuterium isotopes of methane vary across sources. The trace components of landfill
gas also vary temporally with changing societal practices, regulatory approaches, and rates of biochemical degradation processes within both the waste mass and the overlying cover soils.
The methane isotopic signature technique has been used to identify source contributions to atmospheric methane. Schwietzke et al. (2016), using δ13CH4 data, concluded that fossil fuel methane emissions are not increasing over time (although they reported 60-110 percent greater emissions than current estimates, such as the GHGI and European Commission [Emissions Database for Global Atmospheric Research]), implying that emissions of methane from microbial sources account for the recent global growth of atmospheric methane. Although Schwietzke et al. (2016) used a large database of source signatures, more data are still needed owing to the overlap of signatures from different sources. For example, relatively few source signature data exist for tropical wetland emissions, although available data are increasing (e.g., Brownlow et al., 2017).
For microbial processes, stable isotopic values depend on the substrate as well as the balance between methanogenesis and methane oxidation by methanotrophs, all of which can vary regionally as well as temporally (e.g., Strąpoć et al., 2011). As discussed above, for landfill emissions, for example, soil oxidation results in large shifts for δ13CH4 from around −60%0 to oxidized values of −30 to −35%0, as well as any value in between (e.g., Bogner et al., 1996; Chapter 3). Therefore, even though the 13CH4 analysis provides independent information, there are limitations. Additional isotope measurements such as 14CH4, D/H, CDH3, or clumped isotopes (heavy isotopes that are bonded to other heavy isotopes; Eiler, 2007; Stolper et al., 2014; Wang et al., 2015) would help to better discriminate individual source contributions but might not yet be feasible at the same scale as 13CH4 observations.
Ethane has been used as a marker for petroleum and natural gas emissions, typically assuming that all petroleum and gas sources in a region will have a characteristic ethane-to-methane ratio (Franco et al., 2015, 2016; Hausmann et al., 2016; Helmig et al., 2016; Smith et al., 2015). However, a challenge with this approach is that the methane-to-ethane emission ratio from specific petroleum and gas sources can change from region to region and even from day to day or hour to hour within a region, depending on the types of activities under way (e.g., Allen et al., 2017; Kort et al., 2016). As shown by Peischl et al. (2015), this ratio can range from 1.7 to 15 based on measurements from nine different U.S. petroleum and gas production regions. Ethane can also be emitted from sources other than petroleum and gas operations. To make ethane a strong constraint on the methane budget, more information about ethane/methane ratios and their temporal trends from different producing areas is needed. Especially in
areas with significant subsurface geological structures (faults, folds) and historic seismicity (e.g., Los Angeles), as well as historic methane seepages, there may be overlapping and currently unknown seepages that may contribute to observed atmospheric signatures.
Although the information provided by isotopes and molecular tracers can be limited by uncertainty related to trace species due to the lack of unique tracers for individual sources, these measurements can still provide significant information on source attribution. An approach that has been used for decades in attributing sources of particulate matter and volatile organic compounds is to attribute not a unique tracer to individual sources but a fingerprint of multiple tracers. This technique, referred to as the chemical mass balance (CMB) method or geochemical fingerprinting (Friedlander, 1973; Watson, 2004; Watson et al., 2001), takes advantage of multiple concentration ratios to attribute sources. For example, while the isotopic ratios for carbon and deuterium may be similar for emissions from livestock operations and landfills, manure emissions will contain trace species not present in landfill operations, and vice versa. Landfills may emit methane with elevated 14C due to buried older waste affected by atmospheric nuclear testing many decades ago. However, detailed source fingerprinting for minor and trace gases is landfill specific without widespread “universally” useful species; also, many trace hydrocarbon species are either anaerobically degraded in landfilled waste or aerobically degraded in cover soils. Allen (2016) describes how the CMB method can be used to identify emission source strengths that best match all observations of molecular and isotopic tracers.
Expanded use of complementary isotopic and molecular data (e.g., multiple C and H isotopic fingerprints, ethane, and other species) is needed to better constrain specific emission sources in top-down studies. This could include expanding compositional analysis of emitted gases.
Timing of Observations
Another issue in designing a sampling scheme is the timing of the observations. Depending on the specific bottom-up or top-down methodology employed, there can be a mismatch between measurements of short duration that are subsequently extrapolated to longer time frames (daily, monthly, seasonal, or annual). Temporal variability is related to human factors (e.g., site engineering and operations) as well as natural factors (e.g., diurnal and seasonal variability; Zimmerle et al., 2016). Often what is desired for inventory purposes is an annual estimate with defined error bars as
opposed to a simple extrapolation using a variety of existing data. There may also be a lack of winter data for sites with strong seasonality.
Episodic events require both an estimate of methane emissions during the event and an understanding of the frequency of such events. Incorrect handling of episodic emissions could result in upward or downward bias of inventory estimates. If observations tend to coincide with episodic events (e.g., both occur during the workday), then extrapolating emission rate over an entire day could result in overestimation. Conversely, if episodic events are discounted as outliers, the inventory could be underestimated. Both natural and anthropogenic episodic events occur in all sources that can influence estimated emissions for inventory reporting. Natural influences include longer-term climate and shorter-time weather events which affect gaseous transport and methanotrophic methane oxidation around pipelines, in manure management systems and manured soils, and in landfill cover materials (Bogner et al., 2011; Dungan et al., 2017; Leytem et al., 2017; Spokas and Bogner, 2011; Spokas et al., 2011, 2015). Anthropogenic influences include pipeline leakages due to hardware issues, maintenance of manure management facilities, and the installation and operation of landfill biogas recovery systems. The latter are frequently adjusted over short time frames to optimize methane recovery and reduce air intrusion. Often a stratified random sampling scheme that includes known sources of variability can provide critical input data. However, such sampling schemes may be expensive or infeasible, or they may require very large sample sizes in order to capture the temporal variability for purposes of annual inventory reporting.
In top-down assessments, accounting for temporal variability is also important. Aircraft-based mass balance approaches for estimating methane emissions are likely to exhibit temporal sampling issues because the timing of the aircraft measurements is not randomized. To study, for example, emissions from petroleum- and natural-gas-producing regions and livestock emissions, measurements are made for specific short time periods and only when conditions are conducive to the methodology (typically midday). Because of expense, aircraft measurements are made for only a small number of days, resulting in a very small sample size. Thus, aircraft observations can be very useful in validating contemporaneous bottom-up estimates for specific times. However, extrapolating estimates from the short periods when measurements are taken to obtain an estimate for a longer period (e.g., annual, which would be most relevant for GHGI development) would require an assumption that emissions were constant over time and that the sampled days are representative.
Spatial variability also needs to be accounted for. For natural gas, there have been many bottom-up emission studies that have focused on a particular region or produc-
tion area (see Chapter 3). It is tempting to consider combining the data from these various studies to inform national inventories. However, it would be erroneous to naively combine emission factor estimates from different regions to obtain a national estimate for natural gas. Brandt et al. (2016) investigated device-level estimates from multiple studies and concluded that distributions of commonly catalogued components differed significantly from study to study. Similarly, Allen et al. (2013, 2015a,b) found that emission rates for certain types of operations and equipment in natural gas systems varied significantly from region to region. It would also be erroneous to presume that different studies could be viewed as a stratified sample. A stratified sample requires that the population of interest be completely partitioned, the mean from each stratum estimated, and the proportion of each stratum to the population either known or estimated. Hence, the data from these regional studies can only be viewed as a sample of convenience. Although information provided by regional studies is relevant for considering updates to emission factors, incorporating this information directly is not straightforward and likely would require input from the scientific community.
Improved data collection strategies, monitoring observations (e.g., paired contemporaneous measurements), and process-based modeling (for soil sources encompassing large areas, i.e., landfills) are needed to better account for temporal and spatial variability in emissions. Bottom-up studies would be more rigorous with the assembly of comprehensive up-to-date spatially and temporally resolved emission estimates from all source categories, including emissions currently “unaccounted for” in the GHGI. This typically will require validated process-based models appropriate for facility-scale application.
This page intentionally left blank.


