Summary
Understanding, quantifying, and tracking atmospheric methane and emissions are essential for addressing concerns and informing decisions that affect the climate, economy, and human health and safety. Atmospheric methane is a potent greenhouse gas (GHG) that contributes to global warming. While carbon dioxide is by far the dominant cause of the rise in global average temperatures, methane also plays a significant role because it absorbs more energy per unit mass than carbon dioxide does, giving it a disproportionately large effect on global radiative forcing. In addition to contributing to climate change, methane also affects human health as a precursor to ozone pollution in the lower atmosphere. Methane is also the dominant component of natural gas used as a source of energy. Its recovery via natural gas or petroleum wells and from landfills provides an economic benefit. Monitoring of methane emissions is a safety need for petroleum and natural gas exploration, recovery, and transport, as well as for coal mines and landfill sites. For petroleum and natural gas companies, methane inventories and monitoring may improve their operational efficiency and support cost-effective mitigation actions to keep natural gas within engineered systems for useful purposes.
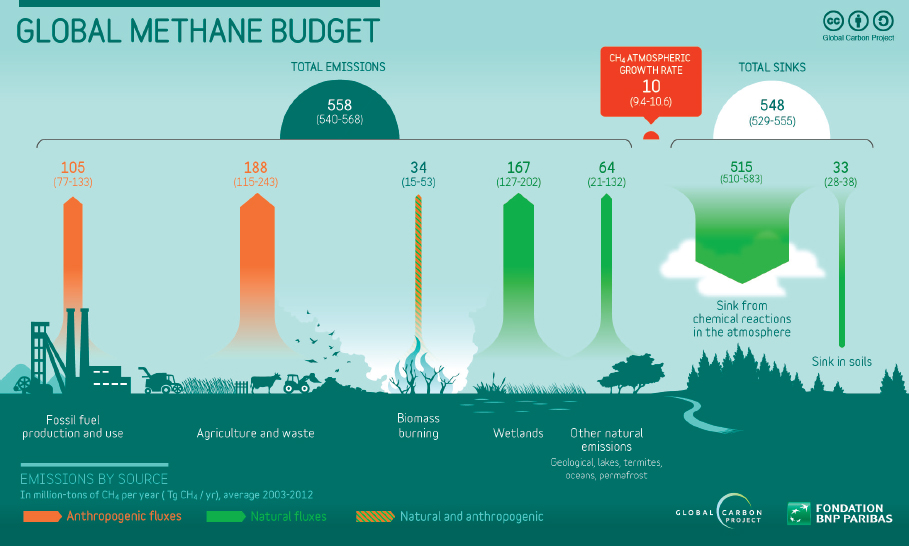
Methane is emitted to the atmosphere by human activities across key sectors of the economy—including energy, agriculture, and waste disposal—and has several natural sources as well (Figure S.1). About 60 percent of total global methane emissions are thought to be from anthropogenic sources and about 40 percent from natural sources.1 Livestock (through fermentation processes in their digestive systems that generate methane and manure management), rice cultivation, landfills, and sewage account for 55-57 percent of global anthropogenic emissions. Emissions from production of fossil fuels, including petroleum, natural gas, and coal, are estimated to account for 32-34 percent, with the remainder from biomass, biofuel burning, and minor industrial processes.
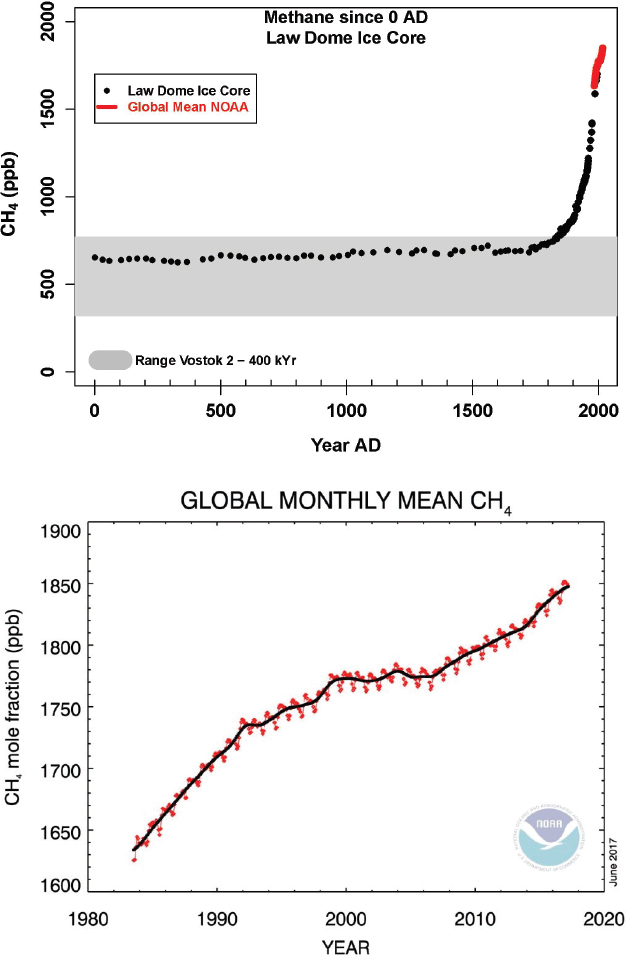
Current levels of methane in the atmosphere have been unprecedented over the past two millennia. As of December 2017, the global mean methane concentration was nearly triple that of preindustrial times (before 1750). Atmospheric observations show that methane levels rose sharply throughout the 20th century, leveled off around the
___________________
1 These percentages are from top-down estimates.
late 1990s, and have been steeply rising again since 2006 (Figure S.2). The underlying causes of these methane changes are not fully known.
MEASUREMENT APPROACHES
Measurements and emission estimates are made along a spectrum of spatial and temporal scales, from instantaneous measurements of methane emissions from individual emission sources to global assessments of annual methane emissions (Figure S.3; Chapter 3). There are two main approaches to estimating methane emissions. The bottom-up approach (typically used for emission inventory development) involves measuring and/or modeling emissions at the scale of individual methane emitters, such as petroleum and natural gas wells, landfills, and cattle farms, and then extrapolating those results to similar kinds of sources on regional and national scales. This approach involves use of emission factors, activity data, and process-based models. In contrast, the top-down approach estimates emissions using observations of atmospheric methane concentrations and models that account for atmospheric trans-
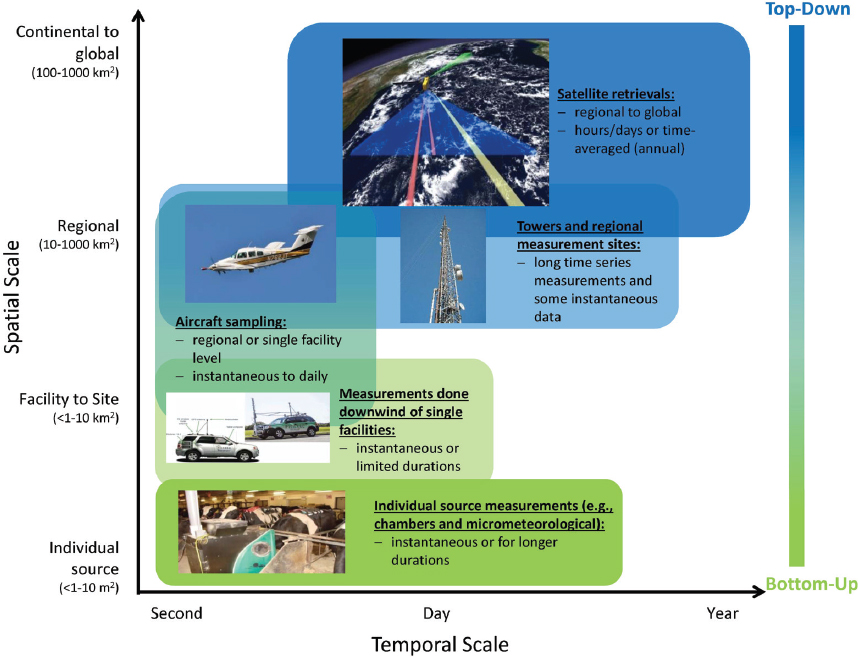
port from the emitter to an observation location (e.g., tall towers and aircraft). Because atmospheric concentration measurements are combined with modeled transport to determine the forcing (emissions), the resulting top-down estimates of regional- to global-scale emissions are also referred to as “inverse models” or “inversions.”
The distinction between top-down and bottom-up techniques is not always clearly defined. At intermediate spatial scales (e.g., total emissions from a large complex facility such as a natural gas processing plant, an animal feeding operation, or a large regional landfill), the emission estimation might be considered either top-down or bottom-up or both. Emissions from multiple sources or components within a facility may be aggregated like a top-down assessment. At the same time, the total facility emissions might be used to represent emissions from other similar facilities, like a bottom-up assessment.
Comparing estimates produced from top-down and bottom-up techniques has helped identify information gaps and research needs. In some cases, top-down estimates of emissions and bottom-up inventories have significantly differed, leading to reexamination of estimates from both approaches.
The National Academies of Sciences, Engineering, and Medicine established the Committee on Anthropogenic Methane Emissions in the United States in response to a request from the U.S. Environmental Protection Agency (EPA), U.S. Department of Energy (DOE), National Oceanic and Atmospheric Administration (NOAA), and the National Aeronautics and Space Administration (NASA). The Committee was charged with examining approaches to measuring, monitoring, presenting, and developing inventories of anthropogenic emissions of methane to the atmosphere (Box S.1).
The Committee’s goal for this report is to summarize the current state of understanding of methane emission sources and the measurement approaches, evaluate opportunities for methodological and inventory development improvements, and inform future research agendas of various U.S. agencies, including NOAA, the EPA, the DOE, NASA, the U.S. Department of Agriculture, and the National Science Foundation. Fi-
nally, the Committee believes that the recommendations in this report will enable the methane part of the U.S. Greenhouse Gas Inventory (GHGI)2 to truly be transparent, consistent, comparable, complete, accurate, and widely applicable to science needs and policy applications.
INVENTORIES AND CURRENT U.S. METHANE EMISSIONS
Emission trends resulting from human activities can be tracked over time by constructing inventories that link emissions to key economic sectors. Inventories are developed using a combination of activity data (e.g., the number of emitters) and emission factors (e.g., the amount of methane per emitter) and/or sophisticated models, at various spatial and temporal scales. Inventories are developed for specific purposes and, in combination with observations of GHGs in the atmosphere, help policymakers assess the effectiveness of new policy initiatives (Chapter 2).
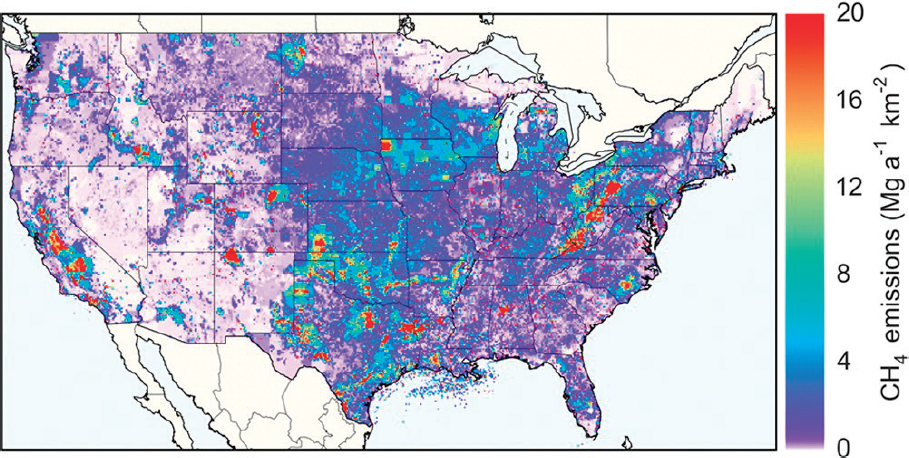
The GHGI is a national, annual inventory and is the main repository of emission information in the United States. The EPA is the lead agency for compiling emission data and coordinating development of the GHGI with input from other federal agencies, state agencies, research and academic institutions, nongovernmental organizations, industry trade associations and individual companies, and other experts. The GHGI is currently developed using methods from the 2006 Intergovernmental Panel on Climate Change (IPCC) Guidelines for National Greenhouse Gas Inventories (IPCC, 2006) and submitted annually to the United Nations Framework Convention on Climate Change (UNFCCC). These guidelines are highly standardized and carefully designed to be achievable by all nations of the world using tiered approaches. Other types of inventories have also been developed, such as state-level and gridded inventories with finer spatial and temporal resolution (e.g., 0.1° × 0.1° grid with monthly resolution) than the GHGI’s national annual resolution; see Figure S.4.3
According to the GHGI, the two largest source categories of U.S. anthropogenic methane emissions are enteric fermentation in domestic ruminant animals (such as cattle), and petroleum and natural gas systems (Figure S.5). Landfills, livestock manure management, and coal-mining operations are also significant sources. This report focuses on these predominant sources of U.S. anthropogenic emissions which are responsible for almost 94 percent of the total estimated U.S. anthropogenic methane emissions
___________________
2 The GHGI reports anthropogenic emissions of seven gases or classes of gases (CO2, CH4, N2O, hydrofluorocarbons, perfluorocarbons, SF6, and NF3), but the primary focus of this report is on the methane portion of the GHGI. In this report, when the Committee refers to the GHGI, it is referring to the methane portion.
3 0.1° × 0.1° is roughly 100 km2.
(excluding land use, land use change, and forestry4). Smaller U.S. sources—wastewater, rice cultivation, and other industrial and agricultural sources—are not discussed in detail in this report. In addition, some natural sources of methane such as wetlands and natural geological sources may be affected by human activities; these were not considered in detail by the Committee.
MEETING THE CHALLENGES OF CHARACTERIZING METHANE EMISSIONS
Recent advances in atmospheric observations and facility-scale measurements make it possible to significantly improve estimates of anthropogenic methane emissions. Top-down and bottom-up approaches provide complementary information about methane emissions (Table S.1). Top-down estimates include emissions from all sources (both natural and anthropogenic), but may have difficulty in attributing emissions to specific sources or source categories. In contrast, bottom-up methods provide information about the magnitudes and patterns of emissions from specific sources.
___________________
4 Methane emissions resulting from the use and conversion of land use categories in the United States, for example, managed peatlands, coastal wetlands, and forest fires.
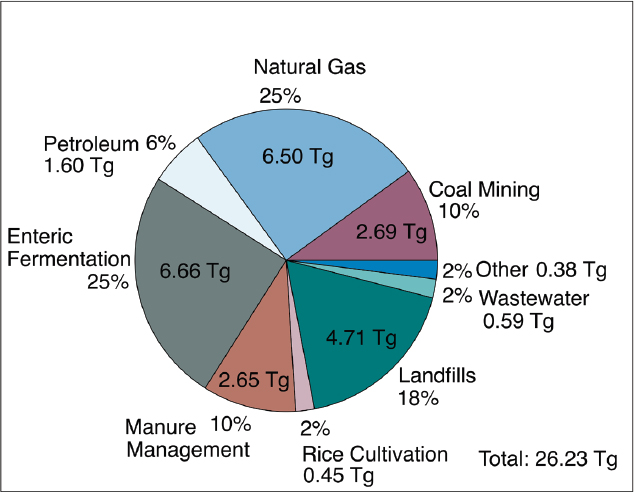
TABLE S.1 Comparison of Top-Down and Bottom-Up Approaches to Estimating Methane Emissions
| Top-Down Data | Bottom-Up Data and Inventories | |
|---|---|---|
| Spatial scale | Facility to global | Individual site level to global |
| Temporal scale | Instantaneous to annual or multiyear averages | Generally reported as annual averages for inventory purposes from limited time duration data collected at various temporal scales |
| Source attribution | Involves use of models and assumptions as well as molecular and isotopic tracers | Calculated from source-specific activity data |
| Potential for missing sources | Measurements reflect all sources that contribute to observed atmospheric concentrations | May not account for all sources in a given region |
However, bottom-up inventories of emissions may not account for all sources, and the methods may have uncertain or inaccurate activity data and emission factors. The measurements used in both top-down and bottom-up approaches can also be spatially and temporally sparse. For example, when aircraft are used to obtain data, the flights are typically limited to just a few days, and the measurements are generally done in the midday when the atmosphere is well mixed. These measurements will not capture ways that these emissions differ at other times of day, or in other seasons, which limits direct comparisons with annual methane inventories such as the GHGI.
Building a strong link between atmospheric measurements of methane concentrations and methane emission inventories has many benefits, including
- more accurate estimates of methane emissions,
- better attribution of emissions to specific processes/sources,
- discovery of missing sources or processes,
- detection of trends in sectoral emissions,
- improved confidence in the basic data that enter into decisions by companies and governments, and
- better capability to detect trends over time.
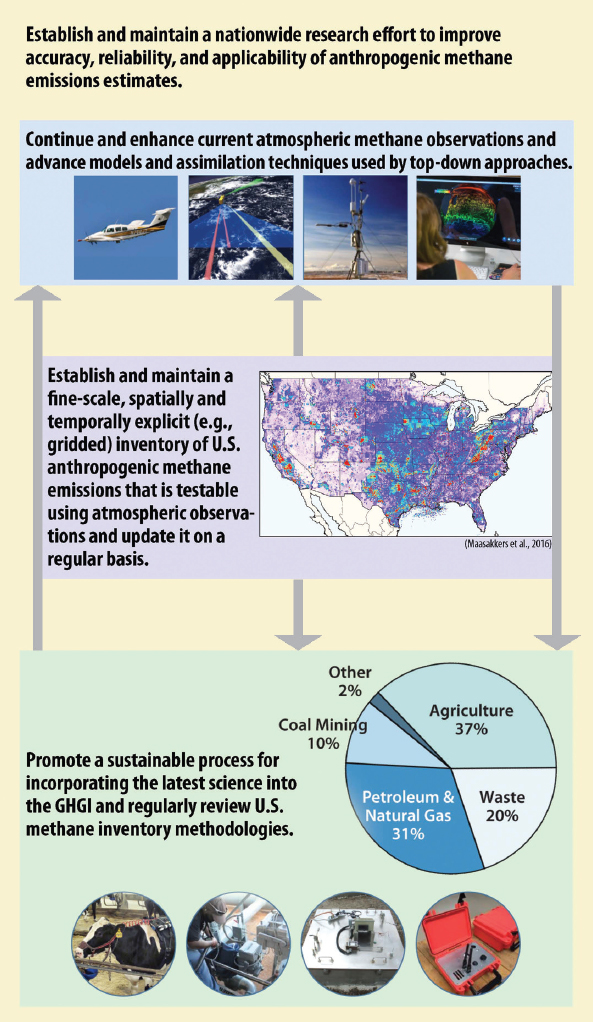
This interlinking of top-down and bottom-up approaches involves strengthening both approaches, as well as developing a mechanism to integrate across these approaches5 (Figure S.6).
Atmospheric Methane Observations and Modeling
Atmospheric observations are the foundation for understanding changes in methane concentrations. Long-term observations, together with atmospheric models that estimate methane emissions, are critical for detecting large-scale trends in methane emissions. Adequate observational coverage in space and over time is required to constrain emission estimates using inverse modeling at global, national, or regional scales. However, the current surface network is sparse and thus not able to capture the full spatial and temporal variability of methane emissions (Chapter 3). Until recently, there were only about 100 surface sites globally that measure atmospheric methane; many of these sites only measure weekly, with only a small number measuring continuously. New sites have been added, largely to support regional studies of major sources (e.g.,
___________________
5 The Committee identifies agencies to implement the recommendations where possible, but recognizes that the list it provides may not be exhaustive, and that the agencies should have the flexibility to parse out the tasks as they think will best serve the interests and missions of their agencies and the country.
urban areas, petroleum and natural gas basins). Many of the original surface network sites have been selected to represent the background atmospheric concentrations. Thus they are remote from strong local sources, meaning that urban and regional sources are inadequately resolved by inverse models.
Uncertainties in current top-down methane emission estimates at global and continental scales are increased by sparse surface observation networks that do not capture the full spatial variability in emissions. The addition of new continuous observation sites offers the opportunity to develop strategic linkages between top-down and bottom-up approaches intended to assess, improve, and support the bottom-up method, so that extrapolations inherent in bottom-up inventories can be trusted. Studies are needed to identify measurements to close observational gaps that result in current ambiguities of our methane budget (sources and sinks), including observation system simulation experiments and intensive field experiments (Chapter 4).
In addition to investing in comprehensive monitoring of atmospheric methane and associated species, improvements to our ability to accurately simulate these data in models should be undertaken. At all scales, uncertainties in top-down methane emission estimates arise due to uncertainties in atmospheric transport models. A major source of variability among different top-down estimates is modeled atmospheric transport, which can change the emission source apportionment among regions. In particular, it is challenging to use current global models with relatively coarse spatial resolution to represent in situ point measurements. Current global and regional atmospheric transport models being used for atmospheric inversions are likely unable to accurately represent small-scale processes. As a result, it is difficult for these models to accurately simulate observed methane at continental sites. Developing higher spatial and temporal resolution atmospheric transport models and approaches for evaluating these models would likely improve transportation simulations.
More accurate transport models will likely require more computationally intensive models with finer spatial and temporal resolution.
In addition, high-quality, long-term, multiscale surface- and space-based data records are necessary for quantifying and tracking changes in methane emissions on regional scales. The existing U.S. and global background methane concentration observational networks need to be continued, with expansion of measurements across multiple scales. Multiscale observational strategies (e.g., aircraft, surface, tower, and satellite remote sensing) supply complementary information and can provide emission flux estimates from the facility through the local and regional scales, which can be compared with gridded inventories.
One of the primary challenges in using top-down analyses to estimate emissions is the difficulty of attributing emissions to specific sources. Measuring a suite of tracer species can provide additional information on the attribution of emissions and observations and should be expanded. Related species used to obtain insight into underlying source processes can include carbon monoxide, ethane, and multiple substituted (clumped) methane isotopes (13CH4, CH3D, 14CH4) (Chapter 4).
Recommendation 1: The National Oceanic and Atmospheric Administration and the National Aeronautics and Space Administration should continue and enhance current atmospheric methane observations and advance models and assimilation techniques used by top-down approaches.
Fine-Scale Spatially and Temporally Resolved Gridded Methane Emission Inventories
The national, annual GHGI has been formulated to meet the reporting requirements of the UNFCCC and provides an adequate resolution for evaluating long-term national emission trends. However, the goals for measuring and monitoring methane in the United States are broader than the UNFCCC objectives for which the GHGI was originally developed.
The publicly available GHGI is used by diverse communities for a variety of scientific and policy purposes. As the most frequently updated comprehensive inventory of anthropogenic methane emissions in the United States, the GHGI has increasingly been used for purposes for which it was not initially designed, including comparisons with top-down estimates of methane emissions in specific regions at specific times, thus attempting to merge and compare information collected at different spatial and temporal scales.
It is very challenging to test the GHGI against top-down estimates (i.e., verify the GHGI) owing to its high degree of spatial (national) and temporal (annual) aggregation, and thus it can be used to address only a limited range of science questions and policy issues. In a country the size of the United States, with many climate regimes and multiple emission source types mixed on the landscape, it is impractical to provide a meaningful check on the national-scale GHGI using top-down atmospheric measurements. Hence, the GHGI as currently configured cannot be tested by independent means in terms of the total emissions. However, verifiability is the bedrock upon which inventories should be built if they are to be widely applicable to policy needs. A new, spatially disaggregated (gridded) GHGI, with temporal resolution consistent with the temporal resolution of top-down observations, would be verifiable at regional scales,
gaining accuracy and allowing for a wider range of applications beyond meeting the reporting requirement to the UNFCCC.
Finer-scale, gridded inventories of national methane emissions provide significant value to the scientific community to better characterize and compare inventories and test against top-down emission estimates. Further, gridded inventories have the potential to inform mitigation action at spatial scales relevant to policymakers and industry. Improvements in the GHGI and state-level inventories will also support improvements in finer-scale gridded inventories.
To be most useful, a gridded inventory should be consistent with the GHGI for integrated total emissions per source and have sufficient documentation to allow the scientific and policy communities interested in regional methane emissions to adapt the inventory to meet their needs. The spatial and temporal resolution should be at as fine a scale as possible (e.g., 0.1° × 0.1° or finer spatial resolution and monthly or finer temporal resolution), based on the data used to generate the inventory. Since some expected uses of the gridded inventory (e.g., comparison with top-down snapshots of diurnal emissions) require finer temporal resolution than the inventory would normally address, process-based field-validated models are also required to provide guidance on fine-scale temporal allocation of emissions.
Both the GHGI and the recommended gridded inventory should meet needs of different users and therefore should be viewed as complementary to jointly increase overall knowledge.
Recommendation 2: The U.S. Environmental Protection Agency in collaboration with the scientific research community, the U.S. Department of Energy, the National Oceanic and Atmospheric Administration, the U.S. Department of Agriculture, and the National Aeronautics and Space Administration should establish and maintain a fine-scale, spatially and temporally explicit (e.g., gridded) inventory of U.S. anthropogenic methane emissions that is testable using atmospheric observations and update it on a regular basis.
Methane Emission Inventory Development
Updating Inventory Approaches for Specific Sources
Targeted improvements to the GHGI (bottom-up approach) are needed, and as research evolves, there should be a sustainable process to incorporate the latest science into the GHGI. A significant source of uncertainty in estimating emissions
from various sectors is the scarcity of activity data. For example, there are numerous emission sources from petroleum and natural gas systems, yet relatively sparse activity data on which to develop estimates. In the agriculture sector, there is uncertainty about animal feed intake—particularly on pasture—and feed composition and a lack of data on the distribution of manure in different management systems. For landfills, activity data are uncertain for the mass of annual landfilled waste as well as emissions that may not be closely related to the mass of landfilled waste.
Inventory methodologies should be evolutionary to be consistent with the latest science and process-based models. However, as of 2018, IPCC Guidelines on inventory methodologies had not been updated since 2006.6 Thus, they predate the last decade of field measurements and modeling. For example, for petroleum and natural gas, many of the emission factors that are used in developing methane emission inventories rely on a comprehensive study conducted by the Gas Research Institute and the EPA in the 1990s. For manure management, most of the equations in the IPCC (2006) methodologies were developed using data that are now more than 30 years old. The current methodology for landfills relies on 20 to 40-year-old assumptions and excludes the two major drivers for emissions: site-specific climate and operational factors.
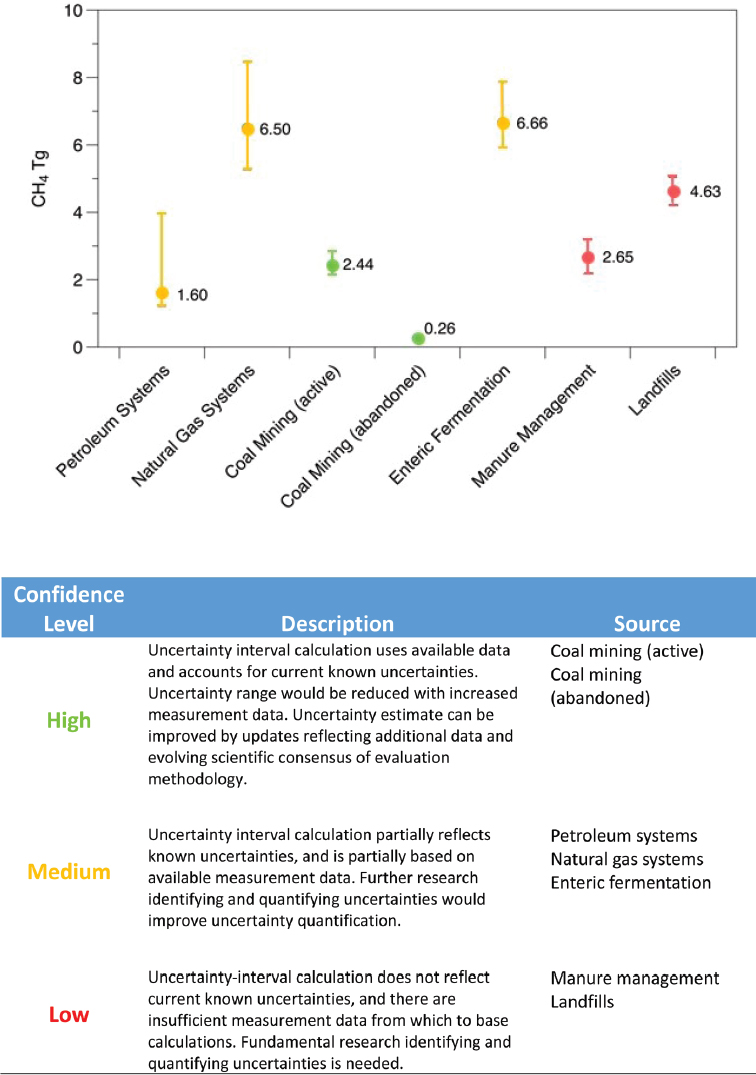
Updating of emission estimation methodologies should prioritize inventory categories with the greatest uncertainties. The research literature for individual source categories typically indicates larger uncertainties than those reported in the GHGI. The Committee evaluated the reliability of the uncertainty estimates reported in the GHGI (Figure S.7; Chapter 4).
Each source category has a wide range of uncertainties for methane emission estimates; sparse activity data and limited emission measurements are the primary reasons for uncertainties in most source categories. Reducing these uncertainties will require collecting and reporting activity and emission data in a consistent and comprehensive manner and will be challenging because of cost, time, and technical limitations.
Priority anthropogenic sources for future research on methodological and data improvements are petroleum and natural gas systems, enteric fermentation, manure management, and landfills because of these sources’ high uncertainties and/or overall high contribution to total anthropogenic U.S. methane emissions.
___________________
6 The IPCC is in the process of developing a report to refine the 2006 IPCC Guidelines. This report is expected to be released in 2019.
Missing (“Unaccounted-for”) Methane Emissions and High-Emitting Sources
With numerous possible sources of methane emissions, bottom-up inventories can overlook some sources. Such “unaccounted-for” sources can include (1) known sources that may not be fully accounted for in inventories and (2) previously unknown sources that have been unrecognized because of their scale, complexity of attribution, or other factors and are not currently incorporated in the GHGI. An example of the latter includes previously unrecognized microbial coal-bed methane from active mining in the Four Corners region. Examples of the former include sources in certain natural gas end-use sectors such as residential and commercial operations, electric power plants, refineries, and high-emitting sources. Identifying and quantifying unaccounted-for emissions through multiscale measurement campaigns is critical to addressing uncertainties in emission inventories and to improve understanding of methane emissions in general. Given that observations of unaccounted-for methane emissions are limited, any extrapolation to national totals needs to be done with caution.
High-emitting sources (also known as “fat tails” or “super-emitters”) are a small number of sites or equipment that dominate emissions and are a common element in many of the recent methane emission studies on natural gas. Some measurements of high emissions may be due to the size of the facility; however, the root causes of high-emitting sources are not well understood. Identifying and quantifying high-emitting sources remain major challenges. Incorporating high-emitting sources into the GHGI is also difficult because the GHGI is meant to represent annual average estimates of methane emissions, and high-emitting sources have significant temporal variability. For petroleum and natural gas, factors that cause certain subpopulations to become high emitters are not well known. Research is needed to gain a mechanistic understanding of high-emitting sources and establish appropriate estimation methods. Conducting campaigns in coordination with owners and operators of the facilities within the regions would help ensure the availability of contemporaneous information concerning operations.
A Process for Improving the GHGI
It can be a challenge to take the wealth of methane studies in the last decade and incorporate their results into the GHGI to improve the estimates. Additionally, the development of the Greenhouse Gas Reporting Program, a facility-level reporting program for larger GHG emitters from 41 industries across the United States, has provided a new source of emission information to improve the emission estimates for many key sectors.
In recent years, the EPA has periodically convened stakeholder webinars and workshops to discuss possible forthcoming changes to the methane GHGI, which provide an opportunity for any interested individual or stakeholder to offer feedback. In addition to these relatively informal workshops, an advisory group could help guide how new science should be incorporated into improving the methane portion of the Greenhouse Gas Inventory. Such an advisory group could be facilitated by the EPA and NOAA and composed of experts from academia, industry, policymaking, other federal agencies, and nongovernmental organizations. Its goal would be to facilitate timely improvements in activity data and enhance characterization of emission sources and quantities.
Such an advisory group could consider questions such as
- Is there sufficient new information available to justify updating an existing emission factor or activity data?
- What other types of research efforts may be necessary before including data in the methane inventory?
- Do the data reported using various aggregation levels, such as facility versus component level or information generated by the top-down networks, suggest that current methods should be updated?
- In general, will the new information reduce the uncertainty of the estimates?
Any changes to the GHGI resulting from these activities should be transparently described and clearly communicated to the public.
Recommendation 3: The U.S. Environmental Protection Agency, U.S. Department of Energy, National Oceanic and Atmospheric Administration, and U.S. Department of Agriculture should promote a sustainable process for incorporating the latest science into the U.S. Greenhouse Gas Inventory and regularly review U.S. methane inventory methodologies.
Research for Improving Characterization of Anthropogenic Methane Emissions
Improvements in the accuracy and precision of methane emission estimates will be maximized through the complementary use of both top-down and bottom-up measurements and linkage to field-validated process-based models at appropriate scales. While working toward this goal, consistency in measurement and modeling approaches and development of study protocols need to be transparent to the researchers involved in methane emission measurements. Furthermore, the methods
utilized for quantifying methane emissions, and the accuracy of those measurement methods, is not always clearly communicated to policymakers.
The complementary information provided by top-down and bottom-up methods offers the opportunity to combine their strengths in coordinated measurements. However, these coordinated measurements are challenging due to the different types of data they provide. Only a limited number of highly coordinated campaigns have been performed at square kilometer scales that utilize both types of methodological approaches, mainly in regions dominated by petroleum and natural gas emissions.
Coordinated, contemporaneous top-down and bottom-up measurement campaigns, conducted in a variety of source regions for anthropogenic methane emissions, are crucial for identifying knowledge gaps and prioritizing emission inventory improvements. Careful evaluation of such data for use in national methane inventories is necessary to ensure representativeness of annual average assessments.
When presenting results on methane emissions, clarity on the scope and spatial and temporal boundaries is essential to enable potential users of the data to interpret the results. Knowing the technical coverage (types of processes covered) informs understanding of the completeness and applicability of the results of a study. Clarity on the spatial and temporal resolution is important because emissions are not uniformly distributed across the United States or over time, and without clear understanding of the boundaries used for a study, there is a risk of misinterpretation of the results.
Recommendation 4: The United States should establish and maintain a nationwide research effort to improve accuracy, reliability, and applicability of anthropogenic methane emission estimates at scales ranging from individual facilities to gridded regional/national estimates.
Such a national research effort should include results from atmospheric observations, sustained spatial and temporal characterization of methane emissions for key sectors in the United States, and improvements in estimation techniques and validated process-based models. Results from such efforts could better support attribution of emissions to specific sectors or processes and trend detection.
The improved monitoring network (Recommendation 1) and recommended gridded national inventory (Recommendation 2) are necessary to conduct comparisons at the finest temporal and spatial scales that the data, models, and site access allow. The comparisons will enable stakeholders and the public to identify deficiencies in the gridded
inventory as well as the atmospheric observations, catalyzing Recommendation 3 for continual improvement in all aspects of methane inventory development. The improvements should be informed by a national research effort (Recommendation 4) for which the guiding goal should be (1) better quantification and attribution of methane emission rates and trends over time and (2) identification of knowledge gaps and guidance for resolving those gaps.
This page intentionally left blank.


