
CHAPTER ONE
Introduction
Methane is emitted to the atmosphere from diverse anthropogenic sources in many key U.S. economic sectors, including energy, agriculture, and waste. Understanding and managing methane emissions requires a broad monitoring, modeling, and regulatory approach, with economic, health, and safety co-benefits that go far beyond understanding the role of methane in the Earth’s climate system. This is a significant challenge; methane is readily transported, combusted as a fuel, chemically oxidized in the atmosphere, and biologically oxidized via both aerobic and anaerobic pathways.
WHY MONITOR, MEASURE, AND TRACK ATMOSPHERIC METHANE AND METHANE EMISSIONS?
The effects of increasing concentrations of global methane are diverse and profound. Understanding, quantifying, and tracking atmospheric methane and emissions of methane are essential for addressing concerns and informing decisions that affect the climate, economy, and human health and safety.
Climate Change
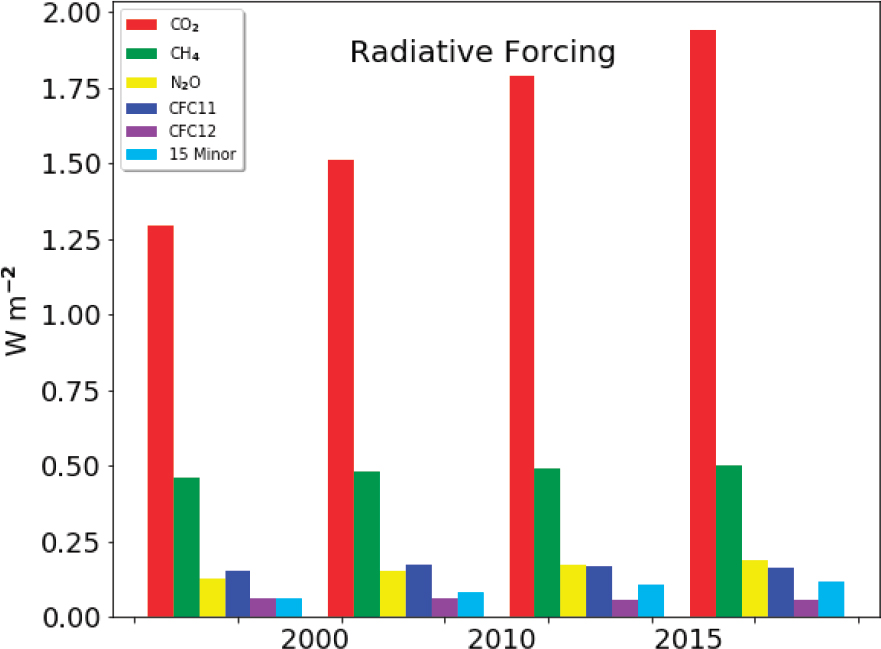
Global average temperatures have risen by 1.25°C (2.25°F) over the past century, with a significant contribution from increases in greenhouse gases (GHGs) and their associated radiative forcing (Hansen et al., 1997). While carbon dioxide is by far the dominant cause of this increase (Figure 1.1), methane also plays a significant role that is made more complex by the diversity of methane sources. Even though it has much lower atmospheric abundance than carbon dioxide, methane has a disproportionately large effect on global radiative forcing because it absorbs more energy per unit mass than carbon dioxide does, making it a powerful greenhouse gas. Although methane is a potent GHG, its relatively short lifetime in the atmosphere (9-10 years [Myhre et al., 2013]) compared to carbon dioxide means that reducing human-driven methane emissions now may reduce some near-term impacts of climate change. Furthermore, oxidation of methane provides almost half of the water vapor in the middle stratosphere, which acts as an important factor in the loss of stratospheric ozone, and as a source of radiative forcing of climate.
If GHG concentrations and associated global temperature continue to increase, widespread impacts on global climate are expected to occur, and some are already beginning to transpire (Cubasch et al., 2013; USGCRP, 2017). These impacts are expected to have broad implications for global food production, human health, and the habitability of coastal and arid regions. Being able to accurately quantify methane emissions and attribute emissions to specific sources is a critical component of addressing climate change.
Changes in the carbon cycle in response to anthropogenic methane emissions will likely be a reinforcing feedback that increases warming. The magnitude of the projected feedback is uncertain. There are many possible processes that can result in carbon cycle feedbacks that lead to both increases and reductions in warming. A warmer climate can lead to increased fires and droughts, including methane emissions from smoldering fires. Thawing frozen waterlogged soils in the Arctic will also lead to increases in methane (Isaksen et al., 2014). Many recent studies have explored the possible feedback between wetland methane emissions and climate change over the next century and have found the potential for significant increases as the climate warms (e.g., Zhang et al., 2017).
Climate Mitigation Policy
Accurate methane inventories enable policymakers to undertake science-based policy decisions and evaluate the effectiveness of mitigation policies. Because of methane’s short atmospheric lifetimes relative to carbon dioxide, it has been proposed as a target for emission reduction in order to prevent the worst effects of climate change. Reduction of methane emissions, along with reductions in black carbon emissions, could reduce global mean warming by about a half a degree by 2050, with additional benefits for air quality and agricultural productivity (Shindell et al., 2012). However, reductions in methane (and other short-lived climate forcers) have short-term benefits and are not significantly beneficial for limiting maximum warming over the long term (i.e., beyond 2050; Rogelj et al., 2014).
Human Health and Safety
Increases in global methane since 1800 are believed to have led to higher levels of global tropospheric (or ground-level) ozone worldwide (Fiore et al., 2008). This pollutant reduces air quality and increases respiratory illnesses and mortality (West et al., 2006). Higher levels of ozone also lead to increases in radiative forcing and may reduce crop yields (e.g., Myhre et al., 2013; Shindell et al., 2012; West et al., 2006). There is an approximately linear relation between anthropogenic methane emissions and tropospheric ozone such that for every teragram per year decrease in methane emissions, ozone was found to decrease by 11-15 ppt (Fiore et al., 2008). Protection of human health and safety are also provided by monitoring methane where concentrations can be flammable and dangerous (e.g., in mines and from landfill sites).
Economic Factors
Monitoring for site-specific methane emissions in the energy, agriculture, and waste sectors can inform practices and maintenance that reduce losses or enhance recovery of a valuable product. Measuring methane emissions in sectors with relatively high emissions can also help to identify where the installation of capture and utilization technologies could be advantageous. For example, the International Energy Agency estimates that 40-50 percent of the current global petroleum and natural gas methane emissions could be mitigated at positive net present values (IEA, 2017). Methane inventories and monitoring may improve petroleum and natural gas companies’ operational efficiency and support cost-effective mitigation actions to keep the product (natural gas) within the systems for eventual useful end-use purposes. Facility- or company-specific methane emission inventories are integral to corporate sustainability reporting. Methane emission inventories help assess the impact of mitigation strategies and may also help investors benchmark various companies and make informed investment and risk management decisions.
METHANE IN THE ATMOSPHERE
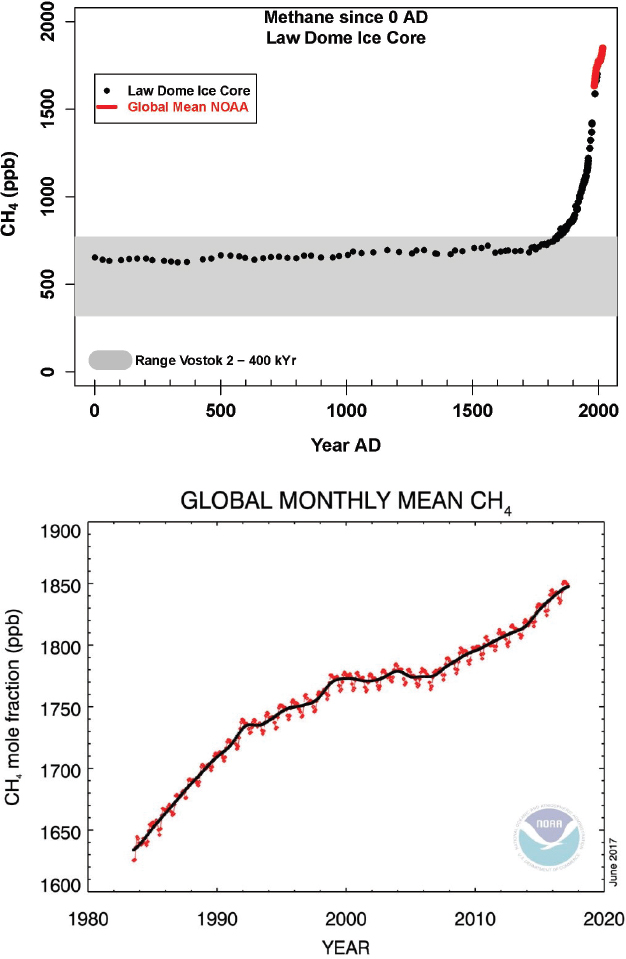
Analysis of air bubbles trapped in ice cores shows that current levels of methane in the atmosphere are unprecedented over the past two millennia (Loulergue et al., 2008). As of December 2017, the global mean methane concentration was nearly triple that of preindustrial times (before around 1750). Observations show that methane concentration levels rose sharply throughout the 20th century, then leveled off for a period of time beginning around 2000, and have again been steeply rising since 2006 (Figure 1.2). The underlying causes of these methane changes are not fully known. Global observations of the methane isotope 13CH4 suggest that the recent growth in global methane is dominated by microbial sources, such as wetlands or agriculture (rice and livestock), and waste (Nisbet et al., 2016; Schaefer et al., 2016). However, it is difficult to reconcile the idea that agriculture is behind the recent methane growth with data that show only modest increases in the global livestock population.1 A distinct possibility is that natural methane emissions are changing in response to global climate change, even though some studies based on space-based observations of inundated areas have suggested declines in wetland area (Poulter et al., 2017). Other studies suggest that at least some of the observed changes in the methane growth rate may be attributable to decreases in the abundance of hydroxyl radicals, which react with and break down methane, acting as the largest sink of atmospheric methane (Rigby et al., 2017; Turner et al., 2017). These studies have argued that isotope-
___________________
based data are not a strong constraint on the global methane budget, in conflict with Schwietzke et al. (2016).
METHANE INVENTORIES
The U. S. Greenhouse Gas Inventory (GHGI) is the official national GHG emission information for the United States, and therefore assessment of the methods to develop the GHGI2 is central to this report. The GHGI has been formulated to meet the reporting requirements of the United Nations Framework Convention on Climate Change and therefore the preparation of the GHGI follows the required protocols, which in turn are based on the three-tiered approaches of the Intergovernmental Panel on Climate Change (see Chapter 2). It is a bottom-up inventory, built by summing emissions from individual sources that are estimated using emission factors and activity counts. Emissions are reported at the national scale, rather than spatially distributed over the United States. The prescribed methods, particularly for non–carbon dioxide (CO2) gases such as methane, mostly predate the last decade of field measurements and modeling, a period during which understanding of methane emissions and sources has significantly advanced.
Other types of inventories have emerged recently, such as inventory reports summarizing emissions from certain major emitting sources under the Greenhouse Gas Reporting Program regulations, the spatially explicit (gridded) inventory for methane developed by Maasakkers et al. (2016) or for livestock emissions (Hristov et al., 2017), and a process-based inventory methodology for site-specific landfill emissions that has been applied to California (Spokas et al., 2011, 2015).
SOURCES OF METHANE EMISSIONS
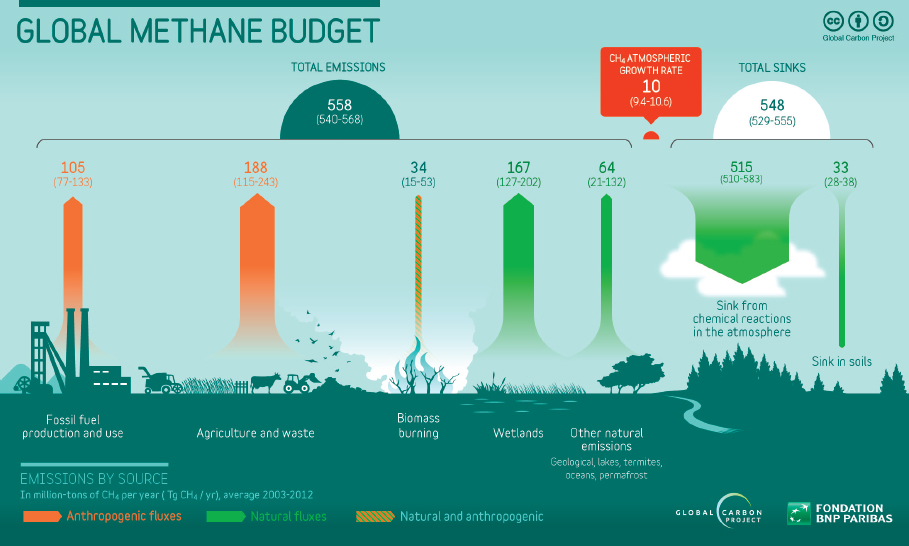
Current estimates place global annual emissions of methane at about 560 Tg methane yr–1 (Saunois et al., 2016), based in part on our best understanding of the global hydroxyl (OH) concentrations that determine removal rates from the atmosphere. Methane comes from numerous anthropogenic activities and natural processes (Figure 1.3), and notably, there is no single dominant source, but rather many significant sources. This configuration of sources forces a broader view of emissions for this gas, as opposed to many other significant GHGs whose anthropogenic sources tend to be dominated by a single source type such as from the combustion of fossil fuel.
___________________
2 The focus of this report is on the methane part of the GHGI. In this report, “GHGI”refers to the methane part of the inventory unless otherwise noted.
The U.S. methane budget (emissions and removal processes) cannot be considered in isolation from the global methane budget because U.S. emissions account for only about one-tenth of global emissions. Consequently, atmospheric methane abundance over the United States is significantly influenced by sources located outside of the United States, even though there may be large responses due to strong local emissions. The atmospheric residence time for methane is about a decade; hence emitted methane is redistributed globally, and methane emissions from the United States influence global concentrations.
About 60 percent of total global methane emissions are thought to be from anthropogenic sources and about 40 percent from natural sources3 (Saunois et al., 2016). Anthropogenic sources encompass a wide range of human activities, including food and energy production and waste disposal. Livestock (through fermentation processes in their digestive system that generate methane and manure management), rice cultivation, landfills, and sewage account for 55-57 percent of global anthropogenic
___________________
3 These percentages are from top-down estimates.
emissions. Emissions from production of fossil fuels, including petroleum, natural gas, and coal, are estimated to account for 32-34 percent (Saunois et al., 2016), with the remainder from biomass, biofuel burning, and minor industrial processes.
Natural Sources of Methane Emissions
The main natural sources of methane emissions globally are from wetlands, with small contributions from enteric fermentation4 in wild animals and insects, coastal oceans, and wildfires. About 10 percent of total methane emissions could come from geological sources, including seeps, hydrates, mud volcanoes, and geothermal systems (Etiope, 2015; Schwietzke et al., 2016). The relatively large contribution of methane from natural sources compels scientists to consider these sources when attributing methane measured via atmospheric samples to the various anthropogenic sources.
Wetlands and lakes are the largest and most uncertain natural sources of methane. For the United States (including Alaska; Chang et al., 2014; Potter et al., 2006), these emissions are estimated to be comparable to methane emissions from petroleum and natural gas use and production (Saunois et al., 2016) and are therefore not a negligible component of total U.S. methane emissions. Associated emissions are sensitive to saturated soil depth, as well as soil temperature and moisture, and lake depth, leading to significant seasonal and interannual variability in wetland emissions and to feedbacks between methane emissions and climate change. Wetland emissions are particularly difficult to quantify because they depend on both the details of microbial production and the distribution of wetlands. Although for some regions—such as the continental United States, Canada, and Europe—the distribution of wetlands may be well defined, for most of the world, the locations of wetlands are not well known. Recently, spaced-based observations of surface inundation have been used as a proxy for wetland locations (e.g., Poulter et al., 2017; Prigent et al., 2007); however, inundation may include water too deep for methane to reach the atmosphere before being consumed by microbes in the water column. Also, the inundation data likely miss shallow waters and areas where soil is saturated to the soil-air interface, the most methane-productive environments.
An important example of a potential feedback between climate and methane emissions is from permafrost thaw. Permafrost contains vast amounts of organic material that can decompose when thawed, resulting in the release of carbon (as either carbon dioxide or methane) to the atmosphere. Current understanding suggests that perma-
___________________
4 The term “enteric methane” refers to methane produced by microbial fermentation-related activities in the gastrointestinal tract of ruminant or nonruminant animals (for more information on these processes, see Hristov et al., 2013).
frost carbon emissions will increase slowly over the next century (Schuur et al., 2015). This could lead to increased methane emissions from this source, which would contribute to further climate warming and more permafrost thaw as a feedback. Currently, there is no observational evidence that indicates that methane emissions have increased as a result of climate change, at least for the North Slope of Alaska (Sweeney et al., 2016), despite rapid Arctic warming. Wetland and lake emissions can also be affected by human activities such as agriculture and development. For example, drainage or restoration of wetlands and construction of reservoirs can affect wetland emissions.
Currently, enteric methane emissions from wild ruminants (e.g., bison, deer, elk, moose, antelopes), in the United States are low, around 4.3 percent of the total enteric methane emissions. Before the European settlement of the West, however, emissions from wild ruminants (predominantly bison) may have been comparable to emission from the current cattle population in the United States (Hristov, 2012).
Anthropogenic Sources in the United States
This report focuses on U.S. anthropogenic emissions, excluding land use, land use change, and forestry (LULUCF5), specifically the predominant sources that emit almost 94 percent of the total estimated U.S. anthropogenic methane, including agriculture (enteric fermentation and manure management), energy (petroleum, gas, and coal mining), and waste (landfills) sectors. Methane emissions from LULUCF are not included in this report because according to the GHGI, LULUCF is also a relatively minor source (approximately 1.7 percent).
Enteric fermentation in domestic ruminants such as cattle, sheep, and goats accounts for over 25 percent of U.S. methane emissions, excluding LULUCF (EPA, 2017b; Figure 1.4). Methane emissions from natural gas and petroleum systems are responsible for 25 and 6 percent of total methane emissions, respectively. Management of livestock manure accounts for another 10 percent. Waste, which includes landfills and wastewater, accounts for 18 and 2 percent, respectively. Coal mining operations account for 10 percent of U.S. methane emissions. Emissions from rice cultivation contribute 2 percent, and the remaining 2 percent is due to other primarily industrial (e.g., petrochemical industry), agricultural (e.g., field burning of agricultural residues), and waste treatment processes (e.g., composting). Although rice cultivation is a significant source of methane emissions globally, it is a relatively minor source in the United
___________________
5 Methane emissions resulting from the use and conversion of land use categories in the United States, for example, managed peatlands, coastal wetlands, and forest fires.
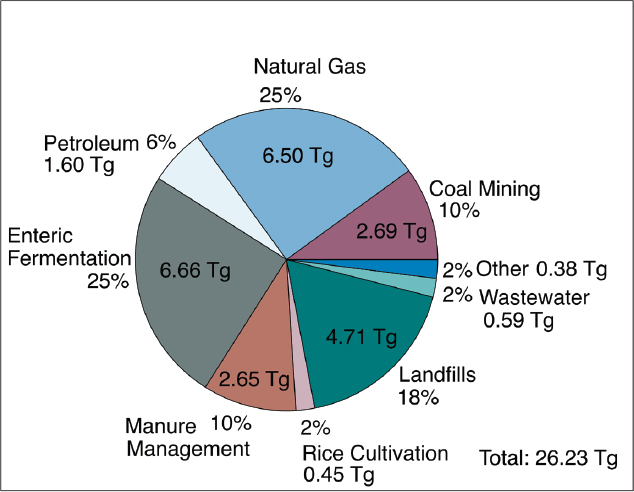
States, so was not covered in detail in this report. Wastewater is another relatively small source in the United States that was not addressed in detail here (for a brief discussion on these two sources, see Appendix C).
METHANE EMISSION ESTIMATION: THE TOP-DOWN AND BOTTOM-UP METHODOLOGIES AND MODELS
The bottom-up (or inventory development) approach involves measuring and/or modeling emissions at the scale of individual methane emitters, such as petroleum and gas wells, landfills, livestock operations, and developing representative emission factors (the estimated mean methane flux per emitter category) for the regional or national activity data (estimated emitter population) and then extrapolating the emissions to appropriate regional and national scales. In contrast, the top-down approach estimates emissions using observations of atmospheric methane concentration and models that account for transport from the emitter to the observation location. Because the atmospheric response (observations of methane concentration) is used
to determine the forcing (methane emissions), top-down techniques may also be referred to as “inverse models.”
Measurements and emission estimates occur along a spectrum of spatial and temporal scales, from global assessments of annual methane emissions to instantaneous measurements of methane emissions from individual emission sources. At scales in between (e.g., total emissions from a large complex facility such as a natural gas processing plant or an animal feeding operation), the measurements might be considered either top-down or bottom-up.
Top-down and bottom-up approaches each have strengths and limitations (Chapter 3). The bottom-up approach allows for direct quantification of known sources or facilities and attributes emissions to specific sources, but it requires a comprehensive accounting of activity data, accurate emission factors, and an adequate sample size to represent the scaled-up population. The very large number of sources, which may significantly vary over time and space, poses a fundamental challenge to assembling accurate regional or national emission inventories. In addition, lack of comprehensive access to sources may not be possible. Top-down approaches include contributions from all sources, including any unknown or underestimated sources, but conversely have difficulty in attributing emissions to particular processes or activities, in part because sources are often intermixed across the landscape and limitations of detection capabilities to individual sources or facilities.
Both top-down and bottom-up approaches to regional or national emission estimation involve the use of models as well as measurements, and these models (Box 1.1) can also introduce uncertainties. In the case of top-down measurements, atmospheric transport models are used to “invert” observed methane concentrations into emission estimates. In the case of bottom-up emission estimates, models are used in a variety of ways, including converting operational and other data on methane emission sources into methane emission estimates (engineering process models), converting methane measurements distant from a source to emission measurements (atmospheric dispersion models), and converting emission measurements on a sampled population to comprehensive facility, regional, national, or global emission estimates (statistical models). Chapter 2 and Chapter 4 directly address the statistical models used in U.S. Environmental Protection Agency (EPA) and other methane inventories, while Chapter 3 addresses top-down atmospheric and bottom-up (sectoral) approaches and models.6
___________________
6 Life-cycle analysis (LCA) models are used for generalized comparison of methane emissions from various societal and business practices. Because the LCA models are not directly applied to national inventory estimates, their detailed assessment is beyond the scope of this report.
Progress has been made in understanding methane emissions by using top-down and bottom-up techniques together. For example Miller et al. (2013) and Petron et al. (2014) found that in the petroleum, natural gas, and livestock categories, top-down methane emission estimates consistently exceeded bottom-up inventories by 50-200 percent or more. Discrepancies between top-down and bottom-up approaches have recently fueled discussion about how to improve inventory development as well as bottom-up and top-down measurement approaches. These discrepancies have also helped to identify information gaps and research needs (e.g., Bell et al., 2017; Brandt et al., 2014; Schwietzke et al., 2017; Zavala-Araiza et al., 2015; Zimmerle et al., 2016).
Table 1.1 shows a comparison between bottom-up and top-down estimates of contiguous U.S. methane emissions. Bottom-up estimates were compiled by the Global Carbon Project (Saunois et al., 2016) and include the GHGI (EPA, 2017b), Emissions Database for Global Atmospheric Research, and Greenhouse gas and Air pollutant Interactions and Synergies (Höglund-Isaksson, 2012) inventories. Top-down estimates
| Source | Time Period | Anthropogenic | Fossil Fuels | Agriculture + Waste | Natural | Total (Anthropogenic + Natural) |
|---|---|---|---|---|---|---|
| Bottom-Up Estimates | ||||||
| EDGAR 4.2FT | 2000-2010 | 26 | 10 | 15 | -- | -- |
| GAINSa | 2000-2010 | 26 | 8 | 16 | -- | -- |
| EPA GHGIb | 2015 | 26 (24-31) | 11 | 15 | -- | -- |
| Top-Down Estimates | ||||||
| Mean of global inversionsc | 2000-2010 | 30 (23-41) | 12 (7-18) | 18 (16-23) | 12 (7-21)d | 39 (30-63) |
| Miller et al., 2013 | 2007-2008 | 44 (±2) | -- | -- | 3e | 47 (±2) |
| Wecht et al., 2014a | 2004 (July-August only) | 30 (±1) | 10 (±1) | 20 (±1) | 7 (±1) | 37 (±1) |
| Turner et al., 2015 | 2009-2011 | 40-43 | 13-20 | 21-26 | 10-11 | 49-53 |
dIncludes wetland emissions and other natural sources.
e Prescribed using a wetland emission parameterization and not adjusted in the atmospheric inversion.
NOTES: Uncertainty ranges are in parentheses. Numbers may not add up due to rounding. EDGAR = Emissions Database for Global Atmospheric Research; GAINS = Greenhouse gas and Air Pollutant Interactions and Synergies; GHGI = U.S. Greenhouse Gas Inventory.
include multiple global inverse studies collected by the Global Carbon Project, along with several regional inverse modeling studies focused on the contiguous United States. The mean of the global inversion results for anthropogenic emissions is slightly higher than the bottom-up estimates. The inversion of Wecht et al. (2014a) agrees with the mean of the global inversions in its attribution of emissions to anthropogenic and natural sources, while the estimates of Miller et al. (2013) and Turner et al. (2015) fall in the high end of the range of global emissions for total U.S. emissions, and they are significantly higher for anthropogenic emissions. Miller et al. (2013) noted that emissions from petroleum and natural gas production could be underestimated in bottom-up inventories by a factor of 5 in the south central United States, while livestock emissions could be underestimated for the United States by a factor of 2. Turner et al. (2015) point out that source attribution is difficult and both fossil fuel and agricultural emissions could be underestimated by inventories. It is notable that the inversion of Miller et al. (2013) uses much lower natural emissions than the other inversions (~3 Tg methane yr–1) and these emissions are not adjusted in their inversion. On a national scale, natural emissions contribute significantly to total U.S. emissions, and the lack of knowledge about these emissions can affect top-down estimates of U.S. anthropogenic emissions.
THIS STUDY AND THE COMMITTEE’S APPROACH
At the request of the U.S. Department of Energy (DOE), EPA, the National Aeronautics and Space Administration (NASA), and the National Oceanic and Atmospheric Administration (NOAA), the National Academies of Sciences, Engineering, and Medicine established the Committee on Anthropogenic Methane Emissions in the United States. The Committee was charged with examining approaches to measuring, monitoring, presenting, and developing inventories of anthropogenic emissions of methane to the atmosphere (see Box 1.2 for full Statement of Task). A major focus of this report is to examine the range of inventory approaches and products and the associated data requirements to help federal agencies develop a set of inventory products with wider applications and improved accuracy and verifiability. The report recommends enhancements to inventory methods, data collection, and products, as needed for the broad application of the inventories to societal needs and for verifiability. Other important elements of the charge, such as research to address key uncertainties, enhanced observing networks, and remote sensing techniques, are also considered.
In addressing its task, the Committee met five times during early and mid-2017 to discuss the current understanding of U.S. anthropogenic methane emissions across dominant sectors, including key uncertainties and unmet research needs. The Com-
mittee also conducted an extensive review of the published literature on these topics, again with the aim of combining conclusions and recommendations related to the primary U.S. anthropogenic sources of methane emissions in a common language and framework. Two of the meetings, in March and May 2017, were centered around open public workshops that gathered extensive input from scientists across academia, federal and state agencies, industry, and nongovernmental organizations and included site visits to operating petroleum, gas, and agricultural facilities. Additional community and stakeholder input was gathered in a series of public webinars and in brief open sessions at meetings in January and July 2017.
The Committee’s goal for this report is to summarize the current state of understanding of methane emission sources and the measurement approaches, to evaluate opportunities for methodological and inventory development improvements, and to inform future research agendas of the United States, including NOAA, the EPA, the DOE, NASA, the U.S. Department of Agriculture, the National Science Foundation, and the National Institute of Standards and Technology. This information is also likely to be relevant to international agencies. This report could also inform future efforts to
develop emission inventories and regulatory approaches including assessment of emissions mitigation approaches. The Committee hopes the report helps scientists, policymakers, and science communicators more accurately convey the state of current understanding and relevance of future studies. Finally, the Committee believes that the recommendations in this report will enable the methane part of the GHGI to truly be transparent, consistent, comparable, complete, accurate, and widely applicable to science needs and policy applications.
REPORT ROADMAP
The report was written with a variety of audiences in mind, including funding agencies, regulatory agencies, climate policymakers and analysts, the research community, and the private sector. Chapter 2 synthesizes the current knowledge of methane emissions and inventory methods across all major methane-emitting human activities in the United States. Chapter 3 analyzes both top-down and bottom-up measurements, the models used to estimate emissions from top-down measurements, and compares top-down and bottom-up emission estimates and identifies strengths and weaknesses of each approach. Chapter 4 outlines the key uncertainties in estimating anthropogenic methane emissions and how these uncertainties can be reduced. Chapter 5 focuses on the presentation of methane emission data to facilitate comparisons among studies and to ensure that results are useful for policymaking. Chapter 6 concludes the report with the Committee’s overarching recommendations for meeting the challenges of characterizing methane emissions. The major sources of U.S. anthropogenic methane emissions (enteric fermentation, manure management, petroleum and natural gas, landfill, and coal mining) are discussed extensively in Chapters 2, 3, and 4 through the lens of the corresponding chapter topic (inventory development, measuring and monitoring, and uncertainties, respectively).


