


Below is the uncorrected machine-read text of this chapter, intended to provide our own search engines and external engines with highly rich, chapter-representative searchable text of each book. Because it is UNCORRECTED material, please consider the following text as a useful but insufficient proxy for the authoritative book pages.
41 This chapter provides guidance for assessing the ROI of TAM systems and practices. The guidance is intended to assist state and local agencies interested in evaluating planned or prior TAM investments. It presents a process for conducting a BCA for a TAM improvement (i.e., implementation of a new TAM system, an upgrade to an existing TAM system, or development and implementation of enhanced TAM business practices). The guidance in this chapter has been designed to be usable without reading the entire study findings; however, the ROI frame- work presented in Chapter 2 may be referenced to provide a more complete understanding of the concepts used. This chapter provides a series of calculation steps and a description of the analytical meth- ods involved in conducting ROI analysis. That said, the steps and methods are not meant to be followed rigidly. Situations will vary by agency, and context will affect the analystâs choices of methods and assumptions. Therefore, along with a general picture of ROI analysis, the guidance provides examples and options for decisions the analyst will need to make. This guidance can be applied by agencies that are implementing a new TAM system, upgrad- ing an existing TAM system, improving data collection methods within a TAM system, and incorporating changes in asset management practices. The overall framework is the same, but the inputs and estimation parameters will vary for each situation. The guidance also is intended for use in evaluating either an investment in a new (electronic) system or changes in C H A P T E R 4 ROI Calculation Guidance Terminology Sidebar ⢠Benefit-cost analysis (BCA), also called cost-benefit analysis (CBA), estimates the costs and benefits to society (agencies, drivers, residents, etc.) of a particular action, assigns dollar values to them, and compares the total costs to total benefits over a period of time. ⢠Economic impact analysis (EIA) examines the economic impacts of an invest- ment (e.g., a new road) or policy intervention (e.g., geographic-based tax incentives) on the local economy. Results usually are presented as changes in jobs, tax revenue, wages, or output. ⢠Return on investment (ROI) is an investment measure that compares the financial return of an investment relative to its cost. For publicly funded projects, ROI analysis is best understood as BCA, so the terms often are used interchangeably. The ROI measure can be used to summarize BCA results.
42 Return on Investment in Transportation Asset Management Systems and Practices agency practices. The guidance often refers to TAM systems for brevity, but the phrase should be interpreted as referring to both systems and practices. The guidance begins with a short introduction to the overall ROI methodology, and then addresses each of the seven structured steps common to estimating ROI for TAM investments: STEP 1 STEP 2 STEP 3 STEP 4 STEP 5 STEP 6 STEP 7 Define Purpose of Study Identify Likely Impacts Assess Available Data Conduct Analysis Establish Modeling Framework Collect Necessary Data Estimate ROI and Summarize Results ROI Methodology This guidance uses a benefit-cost approach that involves estimating costs and benefits over a set period of time (see Chapter 2 for discussion of the methodology underlying the ROI frame- work). BCA provides a way to evaluate the costs and benefits of a change or investmentâsuch as the introduction of a TAM systemâby considering the impacts of the TAM system and estimating a monetary value of those impacts. In basic terms, if the benefits are greater than the costs, the returns on the TAM investment are positive, and the improvement is considered to be a good investment. BCA is a well-established, comparative methodology for estimating the likely costs and ben- efits of an investment that incorporates the timing of changes over a projectâs life cycle and monetizing them (i.e., assigning a dollar value to them). In BCA, benefits and costs of an invest- ment are estimated by comparing two conditions or scenarios: a world with the investment and a world without the investment. Between the scenarios, estimates of the differences in benefits and costs are compared over a period of time to determine which is greater (benefits or costs), when, and by how much. All transportation BCAs begin by developing an understanding of the investment and how it will impact transportation assets, people, businesses, and public agencies. The impacts of a TAM investment are more complicated than those of traditional trans- portation infrastructure investments. Infrastructure projects, such as new bridges or road- ways, are meant to improve travel for users (e.g., facilitate faster, cheaper, or more reliable trips). By contrast, a TAM investment is intended to improve the working practices of the public agency that obtains and uses it. New or improved asset management systems, data collection systems, practices, or methods can change the way the agency works and make it more efficient. Greater efficiency allows the agency to better manage its assets so that the overall quality of the transportation system improves, leading to better overall perfor- mance (e.g., faster travel, less congestion, etc.). Thus, a TAM investment can generate mea- surable benefits for both the agency and roadway users. Measurable benefits may even apply to entities that do not use the assets but benefit indirectly from the improved movement of goods and people (e.g., from reduced emissions related to less congestion, from improved traffic on other, nearby roads, etc.). Calculating a BCA requires that all the costs of an investment be estimated over a spec- ified time period. These costs include initial costs (e.g., planning and design costs, and purchase costs) and ongoing agency costs. Similarly, the benefits of the investment over the analysis time period are estimated, including benefits to the implementing agency (e.g., more efficient use of staff time or reductions in backlogged work), transportation asset users (e.g., lower vehicle operating costs due to better roadway conditions or reductions in temporary delays and rerouting due to maintenance activities) and potentially, the general public(e.g., emissions and noise). These costs and benefits are discounted to reflect the time
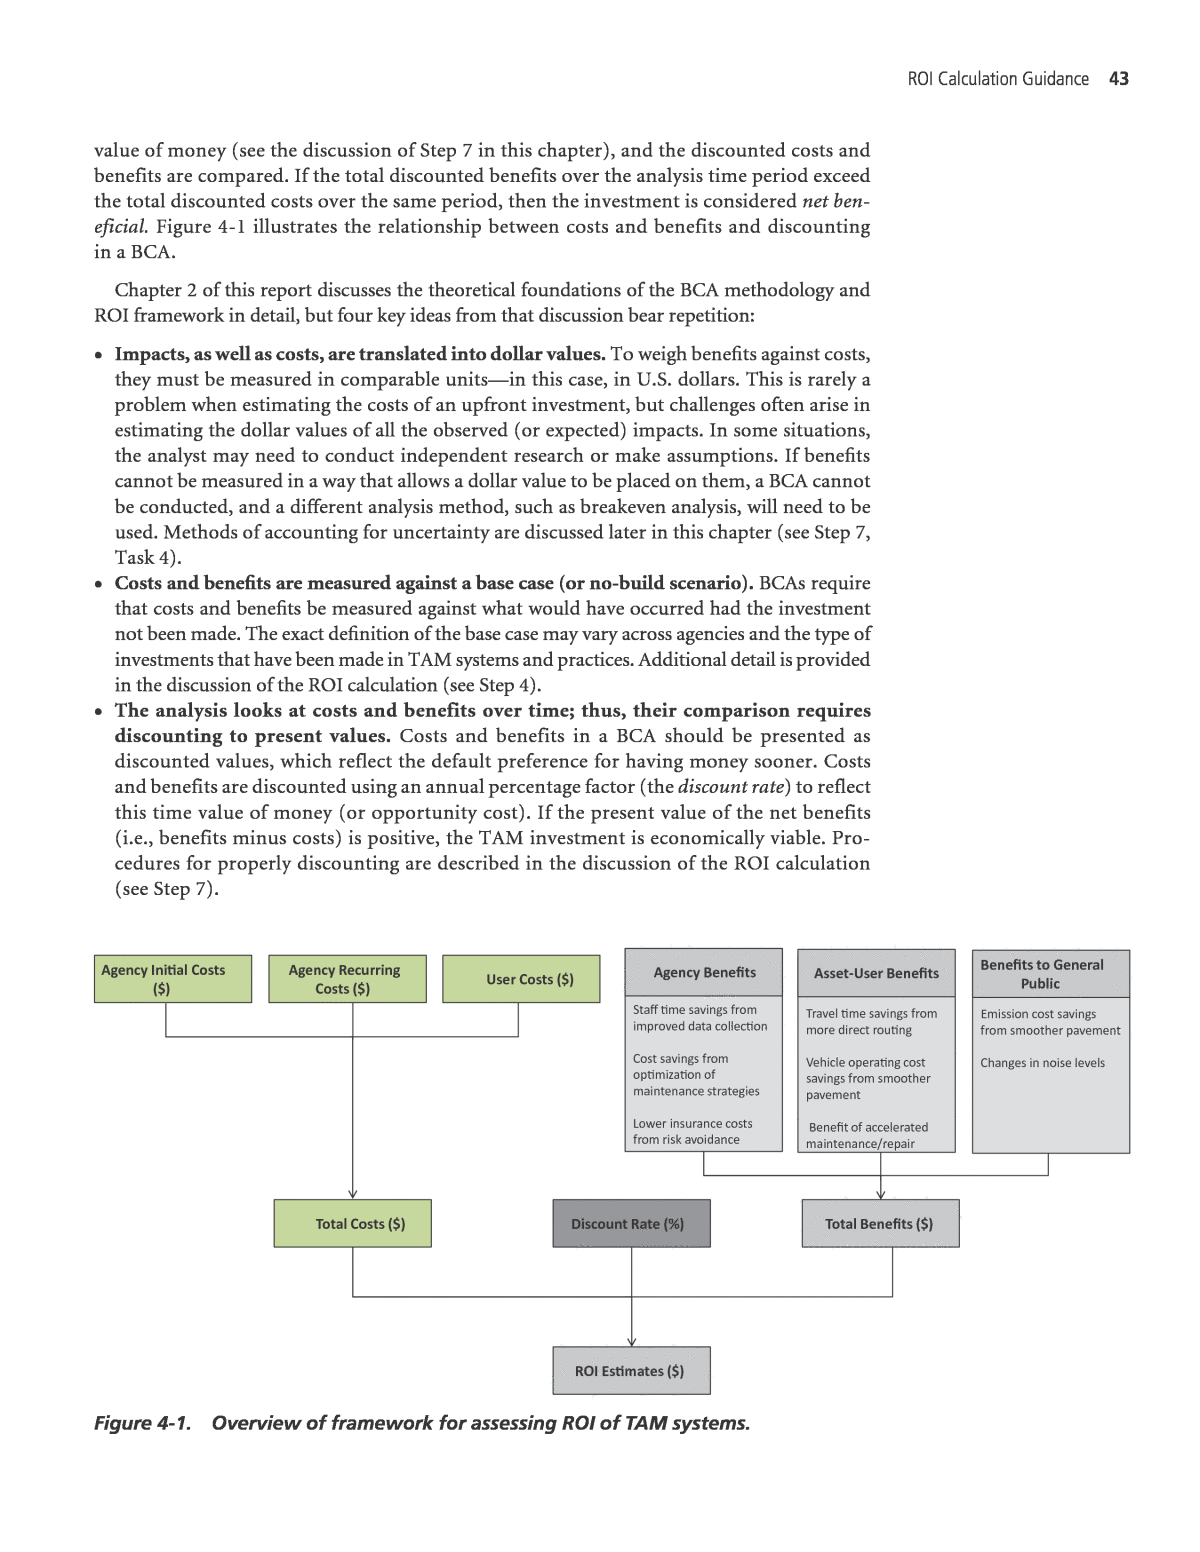
ROI Calculation Guidance 43 value of money (see the discussion of Step 7 in this chapter), and the discounted costs and benefits are compared. If the total discounted benefits over the analysis time period exceed the total discounted costs over the same period, then the investment is considered net ben- eficial. Figure 4-1 illustrates the relationship between costs and benefits and discounting in a BCA. Chapter 2 of this report discusses the theoretical foundations of the BCA methodology and ROI framework in detail, but four key ideas from that discussion bear repetition: ⢠Impacts, as well as costs, are translated into dollar values. To weigh benefits against costs, they must be measured in comparable unitsâin this case, in U.S. dollars. This is rarely a problem when estimating the costs of an upfront investment, but challenges often arise in estimating the dollar values of all the observed (or expected) impacts. In some situations, the analyst may need to conduct independent research or make assumptions. If benefits cannot be measured in a way that allows a dollar value to be placed on them, a BCA cannot be conducted, and a different analysis method, such as breakeven analysis, will need to be used. Methods of accounting for uncertainty are discussed later in this chapter (see Step 7, Task 4). ⢠Costs and benefits are measured against a base case (or no-build scenario). BCAs require that costs and benefits be measured against what would have occurred had the investment not been made. The exact definition of the base case may vary across agencies and the type of investments that have been made in TAM systems and practices. Additional detail is provided in the discussion of the ROI calculation (see Step 4). ⢠The analysis looks at costs and benefits over time; thus, their comparison requires discounting to present values. Costs and benefits in a BCA should be presented as discounted values, which reflect the default preference for having money sooner. Costs and benefits are discounted using an annual percentage factor (the discount rate) to reflect this time value of money (or opportunity cost). If the present value of the net benefits (i.e., benefits minus costs) is positive, the TAM investment is economically viable. Pro- cedures for properly discounting are described in the discussion of the ROI calculation (see Step 7). User Costs ($)Agency RecurringCosts ($) Agency Initial Costs ($) Total Costs ($) Discount Rate (%) Total Beneï¬ts ($) ROI Estimates ($) Staï¬ time savings from improved data collection Cost savings from optimization of maintenance strategies Lower insurance costs from risk avoidance Agency Beneï¬ts Emission cost savings from smoother pavement Changes in noise levels Travel time savings from more direct routing Vehicle operating cost savings from smoother pavement Beneï¬t of accelerated maintenance/repair Asset-User Beneï¬ts Beneï¬ts to General Public Figure 4-1. Overview of framework for assessing ROI of TAM systems.
44 Return on Investment in Transportation Asset Management Systems and Practices ⢠Only direct effects are considered. TAM investments can have direct impacts on agencies and asset users (e.g., reductions in staff time and maintenance expenditures, avoided increases in vehicle operating costs and travel time, and reductions in emissions and noise). Indirect effects, such as changes in economic activity due to improved transportation, are a function of the direct effects and are not included in the ROI calculation. State agencies are in different stages of incorporating asset management practices and systems for their transportation infrastructure. This variation will impact the types and amounts of ben- efits each agency would receive from adopting any new TAM practice or system. Those agencies that have already adopted many TAM approaches and systems may realize comparatively fewer additional benefits than an agency that is just beginning to incorporate TAM into its practices and systems. The steps for calculating the ROI are described further below. Step 1: Define the Purpose of the Study and the Scope of TAM Investment Step 1, Task 1: Define the Purpose of the Study Before beginning the analysis, it is helpful to frame the focus of the study. The purpose of the TAM investment can affect decisions and options that are confronted later in the analysis, such as the level of effort to expend in estimating key variables or whether to attempt to estimate benefits for all beneficiaries (i.e., to users or the general public, in addition to the agency). Being clear about these issues up front will help in conducting the analysis efficiently. Moreover, the purpose of the study can determine how the results of the analysis will be used, who will read or use the results, and how much time and effort will be available to conduct it. Questions to consider include: ⢠Will the analysis be used to justify TAM investments already made and in place, or will it be used to justify a new investment? The answer to this question determines whether to do a prospective or retrospective analysis. ⢠Who is the primary audience for the analysis? The agency? Public officials? The general public? Are there multiple audiences? If the primary audience is agency staff, an analysis of agency savings may be enough (although it may be helpful to capture user impacts and broader societal impacts regardless of the audience). If the target audience includes other public officials and the general public, additional effort may be appropriate to estimate user and broader societal impacts where feasible. ⢠What resources are available for conducting the analysis? If resources and time are lim- ited, it may be necessary to do a very high-level analysis based on the experience of other agencies. ⢠Has a similar analysis been conducted before? If a previous analysis of similar investments has been done, it may be possible to leverage data or analysis from the earlier study or studies for the new effort. ⢠Is the agency adopting TAM practices without implementing a TAM system (or vice versa)? Will systems be integrated later? If TAM practices or systems will be implemented in phases, information from the first experience can help when estimating STEP 1 STEP 2 STEP 3 STEP 4 STEP 5 STEP 6 STEP 7 Define Purpose of Study Identify Likely Impacts Assess Available Data Conduct Analysis Establish Modeling Framework Collect Necessary Data Estimate ROI and Summarize Results
ROI Calculation Guidance 45 and tracking the benefits of the next. In other words, carefully tracked changes to the agencyâs costs and activities based on an initial TAM effort can inform expectations for later improvements. Answering these questions early in the process helps ensure that the analysis focuses on the agencyâs primary needs and key audience. Step 1, Task 2: Describe the Scope of the TAM Investment Next, background information must be collected, including details on the investment. Much of this information can be gathered from internal planning and procurement documents. Ques- tions to consider include: ⢠When is the investment expected to take place, and over what time period? ⢠What assets will be covered? ⢠Does the investment upgrade an existing TAM system? If so, â What is the nature of the improvement/upgrade? â Will new assets (e.g., new asset types or an expansion of the systemâs geographic coverage) be included? ⢠How long is the system expected to be in place before it will require a major upgrade? For Modeling Refinement The scope and sophistication of a TAM system affects the magnitude of its poten- tial benefits. The inputs used to estimate the benefits of the TAM system may be scaled to reflect the specific characteristics and context of the system. Such inputs may include: ⢠Percentage of assets covered, ⢠Number of potential treatments, ⢠Functions incorporated, and ⢠Other factors. Collecting this information at beginning of the analysis facilitates completion of later steps in the analysis. Figure 4-2 presents a TAM investment classification checklist that can be used to help refine the approach at the beginning of the analysis and throughout the process. The goal of the analysis dictates the type of analysis. An analysis on an investment that has already been made, with impacts that have already occurred, is a retrospective analysis. An analy- sis for an investment or action that is yet to occur is a prospective analysis. Many of the same analytical tools can be used for both types of analysis, but there are some differences, which are noted later in this guidance. The main purpose of the investment helps determine which beneficiaries should be included in the analysis (i.e., agency, asset users, and/or the broader community) and which can be con- sidered optional. The type of the investment can be tied to likely sources of data that will be needed for the analysis. Specifying the assets covered and the geographic area will help refine the analysis. Speci- fying these details early in the process will make later steps easier.
46 Return on Investment in Transportation Asset Management Systems and Practices Step 2: Identify Likely Impacts Step 2 results in a preliminary identification of the impacts expected from the investment. This step also sets the stage by identifying the areas of focus needed to assess the availability of data in Step 3. TAM system investments can lead to direct impacts on several groups: (1) the agencies that implement them, (2) users of the transportation assets being managed, and (3) the general public. Each impact can lead directly to one or more benefits; for example, changes in how and when asset inspections are conducted can lead to agency staff cost savings, more data, and other benefits. All of these impacts can be considered, depending on data availability and the purpose of the study. Much research on TAM benefits has focused on agency benefits, mostly in the form of agency cost savings. (Other potential agency benefits include enhanced agency reputation and reduced chances of catastrophic failure.) These benefits can include reductions in outlays and increases in staff productivity. As discussed in Step 4, simulation models can be used to estimate another agency benefit, reductions in the asset management backlog. The ROI analysis should begin by focusing on agency benefits, as they capture much of the benefits of improved TAM systems and practices. Other potential benefits from improved internal processes, may be harder to quantify, but they are still important. For example, the adoption of TAM practices and systems may lead to efficiencies that are indirectly related to use of the TAM system (e.g., reduced data entry and/or processing because of better organized data and systems, time savings for staff in other areas or departments given improved integration of asset data across multiple systems). These STEP 1 STEP 2 STEP 3 STEP 4 STEP 5 STEP 6 STEP 7 Define Purpose of Study Identify Likely Impacts Assess Available Data Conduct Analysis Establish Modeling Framework Collect Necessary Data Estimate ROI and Summarize Results Goal of Analysis Justify TAM investment already made and in place Make the case for a new investment Stated Purpose of Investment Better/more efficient use of agency resources Better management of asset condition or serviceable life Improved travel conditions Other Type of Investment (new/upgrade) Install/implement new system Upgrade/expand existing system Adopt enhanced system management practices Assets Covered Pavement Bridges Other Geographic Area _______________________________________________ Figure 4-2. TAM investment classification checklist.
ROI Calculation Guidance 47 less direct benefits may not be immediately apparent; it can be helpful to revisit how the TAM may improve agency effectiveness multiple times, and gather input from staff in other offices. Some ROI analyses will need to include a further analysis of user benefits and broader com- munity benefits generated by improvements in the transportation assets. In many situations, the estimated benefits to the transportation agency will be large enough to cover the costs associated with the TAM investment, so the ROI analysis can be completed without the additional steps of estimating user and community benefits. If these benefits are not explicitly modeled, they can be noted as additional benefits that were not estimated (see Step 7, Task 2). Step 2 involves making a list of the impacts from the TAM system implementation or upgrade, or from the improved use of a TAM system (e.g., improved data collection methods within a TAM, and incorporation of changes in asset management practices). To create a thorough list, multiple sources can be consulted, such as: ⢠Documentation and brochures from TAM software providers; ⢠Interviews with agency personnel, including those who have been involved in planning and budgeting for the TAM, managing current asset data collection, overseeing asset manage- ment maintenance and improvement, and others who may have insight into likely changes in agency operations; ⢠Experiences of other agencies (e.g., as summarized in the literature review in Appendix A of this guidebook) that have experience with TAM systems or are currently developing estimates of performance or impact in this rapidly developing field. The list of impacts of TAM investments should be detailed enough to help identify data needed to complete the ROI analysis (see text box for examples of potential impacts organized by entity or asset affected). The impacts relevant for the study will determine the data needed for estimating benefits. Each impact identified should include notes on whether it is likely to affect the state of trans- portation asset quality or transportation system performance. For example, a new TAM system may cause an agency to prioritize maintenance efforts differently, which would lead to a change in overall roadway level of service or the average pavement life cycle. This, in turn would impact Impacts, Benefits, and Disbenefits Although these terms often are used interchangeably, this guidance differentiates between impacts, benefits, and disbenefits. ⢠Impacts are changes that occur as a result of adopting a TAM system or processes (e.g., greater staff interaction and more frequent asset inspections). Impacts may be positive or negative. Whereas some impacts may be measurable, others may be difficult to measure and monetize. ⢠Benefits are impacts that have a positive, often measurable, value to the agency, assets, users of the assets, or the broader community (e.g., financial savings, time savings, increased productivity, faster travel times, reduced emissions, or avoided delays). ⢠Disbenefits are impacts that have a negative, measurable value (e.g., mainte- nance delays for roadway users). Benefits and disbenefits can be seen as distinct subsets of impacts.
48 Return on Investment in Transportation Asset Management Systems and Practices the overall transportation system. In addition, the TAM system may allow the agency to monitor roadway conditions and report needed data with fewer staff, allowing for staff attrition and lower overall staff costs over several years. Such a change would generate cost savings for the agency, but not necessarily impact the transportation system. Some of these impacts can be monetized and treated as benefits in the ROI analysis. Impacts that cannot be monetized can be described and documented at the end of the analysis (see Step 7, Task 2). Step 3: Assess Available Data Step 3 consists of reviewing the expected impacts identified in Step 2 and assessing the availability of the data needed to estimate them. This step reveals gaps in the data available for carrying out the analysis. At this point, it may be valuable to refer back to the information gathered in Step 1 regarding the studyâs primary purpose and scope. If the studyâs main purpose is to justify a previous investment in a TAM system, and resources are limited, then estimating the agency benefits may be enough, and the analysis can focus on in-house data. Conversely, if the study will be used to justify a new STEP 1 STEP 2 STEP 3 STEP 4 STEP 5 STEP 6 STEP 7 Define Purpose of Study Identify Likely Impacts Assess Available Data Conduct Analysis Establish Modeling Framework Collect Necessary Data Estimate ROI and Summarize Results Potential Impacts of TAM Investments Transportation Agency ⢠Reduced work backlog; ⢠Improved decision-making in allocating resources; ⢠Increased staff efficiency; ⢠Reduced expenditures (data collection, lower insurance costs, etc.); ⢠Enhanced reputation and public trust through information sharing; ⢠Reduced chances of catastrophic failure; and ⢠Improved data integration across offices/other systems.* Assets ⢠Improved asset condition; and ⢠Longer life expectancy. Users and General Public ⢠Improved travel efficiency; ⢠Reduced accidents; ⢠Fewer negative impacts (e.g., work zone delays); and ⢠Potential for increased economic activity along improved transportation assets. * Among the impacts to the transportation agency, enhanced reputation and public trust, and reduced chances of catastrophic failure are unlikely to be quantifiable or monetized.
ROI Calculation Guidance 49 investment and may be viewed by a wider audience, the analysis may be helped by including esti- mates of user benefits. In this case, if the in-house information is limited, it may be necessary to perform additional, outside research to identify proxies to supplement the in-house data. Both prospective and retrospective evaluations involve estimating the impact of the TAM. ⢠Prospective evaluations will require the following: â Data on current conditions of agency operations, transportation assets, and the transporta- tion system performance; and â Projections of future user benefits, agency costs, and asset conditions under both the base case (in which the transportation system goes forward without the TAM system or practices in place) and the investment case (in which the TAM system or practices are put in place). ⢠Retrospective evaluations will require the following: â Data on observable conditions before and after the TAM improvement; â Data on actual agency expenditures before and after the TAM improvement; and â Estimates of historical user benefits, agency costs, and asset conditions for the base case (i.e., what would have occurred had the TAM improvement not been made). The review of the study purpose, beneficiary groups, and data needed to estimate the benefits will determine the data priorities. ⢠For estimating agency benefits, minimum data needs will likely be: â Agency expenditure for maintaining assets, and â Asset conditions. ⢠For estimating user or broader community benefits, minimum data needs will likely be: â Agency expenditure for maintaining assets, â Asset conditions, and â Transportation system use and performance. Investment Cost Data Critical to the ROI evaluation is the collection of data on the initial and ongoing costs of the investment. If the relevant costs are not available, then the analysis cannot be con- ducted. These costs include initial implementation costs as well as related recurring expenses incurred by the agency during the life of the TAM system or new processes. As shown in Figure 4-3, these costs include agency expenditures after the initial investment and while benefits accrue. Figure 4-3. Timing of costs and benefits.
50 Return on Investment in Transportation Asset Management Systems and Practices Capital costs, which include the costs for purchasing and implementing a TAM system, often are the easiest costs to collect. In addition to the costs of purchasing any software, information should be collected on any planned upgrades, licensing fees, ongoing technical assistance, and any other costs the productâs provider would charge. Information on staff costs associated with the TAM system implementation, operations, and maintenance also will be needed. These staff costs include costs for system planning before the new system or practices are put in place, staff costs associated with overseeing the TAM system or new practices, as well as staff costs associated with running and managing the new system or practices. Costs for agency staff training on the system or on new practices also should be collected, and include any costs to pay for instructors as well as the staff time spent in training. Many staff costs will be expressed as a percentage of work time for existing staff members, although new positions may be created in some situations. Once information has been gathered on the total staff time necessary, the hours can be multiplied by an average wage rate calculated from agency payroll or from publicly available sources on industry averages (see text box on potential costs). Potential sources of cost data include: ⢠Agency financial reports; ⢠Internal planning documents; ⢠Supplier brochures and other materials; ⢠Interviews with department staff; and ⢠Resources in this guidebook, including the TAM literature review (Appendix A), case studies (Chapter 3), and pilot (Appendix F). Agency Operations To estimate agency benefits, information is needed on the processes, practices, and staff involved in operating the legacy TAM system or practices. This information should include: ⢠Number of staff involved in operating the legacy system or following the TAM practices; ⢠Staff time dedicated to collecting data for legacy system; Potential Costs of TAM Systems and Practices Non-recurring Costs ⢠Hardware and software purchase; ⢠Installation of hardware and software; ⢠Staff training for using TAM software; and ⢠Decommissioning TAM system. Recurring Costs ⢠Operation, maintenance, and repair of transportation assets and user vehicles; ⢠Maintenance and updates (renewals) of TAM software; ⢠Software licensing fees; ⢠Ongoing technical assistance; and ⢠Data collection and analysis.
ROI Calculation Guidance 51 ⢠Frequency of use for legacy system; ⢠Maintenance and rehabilitation practices; ⢠Worker safety statistics; ⢠Measures of staff work productivity (e.g., number of FTE positions per mile of assets managed, monitored, or reviewed); ⢠Assets covered (e.g., type, number, size); and ⢠Average annual work done on assets, including maintenance, measurement, and track- ing, etc. Potential sources of this information are similar to those for cost data and include: ⢠Internal planning documents; ⢠Vendor/supplier brochures and other materials; ⢠Interviews with department staff; ⢠Resources in this guidebook, including the TAM literature review (Appendix A), case studies (Chapter 3), and pilot (Appendix F). Testing the Guidance Lesson 1 Benefits from improved procedures and practices are important, even if they are hard to quantify. A state DOT expects to see savings from reduced procurement costs once it implements the TAM system and procedures to track culverts and closed drainage systems. Until now, problems with these systems usually have been identified when DOT staff are in the field for other reasons, such as preparing to begin a repaving project. If a looming culvert problem is discovered at that time, it is almost always too late to combine the culvert repair or replace- ment with the paving project and the culvert treatment usually requires a separate procurement process. The new TAM system will facilitate bundling some procurements, thus saving administrative costs. Even though the DOT canât yet quantify these savings, the consensus on their likelihood provides further support for investing in the system and also helps refine its specifications. Asset Conditions To estimate benefits to users and the broader community, as well as the effectiveness of the TAM system on the quality of the agencyâs transportation assets, it will be necessary to collect information on asset conditions. Common metrics used to measure asset conditions include: ⢠Asset age or remaining service life, ⢠Asset condition, and ⢠LOS ratings. It is suggested to use metrics that are commonly available and adopted for the agency. Data also can be found in the Highway Performance Monitoring System (HPMS) and the National Bridge Inventory (NBI).
52 Return on Investment in Transportation Asset Management Systems and Practices Transportation System Use and Performance To estimate user benefits and benefits to the broader community, information also will be needed on transportation system performance and usage, such as the following: ⢠Traffic volumes affected by the ROI investment. Data may come from the TAM system, inter- nal agency sources, or an outside source. Ideally, the data need to be distributed by trip pur- pose (personal and business), time of day (peak and off-peak), and/or vehicle type (cars and trucks), if possible. The geographic area and assets included should be precisely defined. ⢠Measures of transportation system performance (e.g., travel times, average vehicle speed, level of service, and crash or incident rates), which may come from the TAM system, internal agency data, or an outside source. ⢠Other characteristics of the transportation system that might affect generalized travel costs or travel demand, such as the length of a detour in the case of a bridge failure. These data will likely be available in the TAM system, but outside models and sources may also need to be consulted. Access to much of this information will typically be available through existing agency systems or travel demand models. Other Data Some analyses may need additional data that do not easily fall into any of the above categories. For example, for a retrospective analysis on the impact of a TAM system already in place, the analysis would benefit from incorporating historical weather data for the time periods being Available âOutsideâ Tools ⢠Highway Economic Requirements SystemâState Version (HERS-ST). This tool allows a state to use its Highway Performance Monitoring System (HPMS) data to estimate future conditions under various scenarios. It is a state version of the FHWA HERS model, which FHWA uses to report future highway needs to Congress as part of the biennial Conditions and Performance Report. HERS-ST assesses the relationship between investments in the highway system and the conditions, performance, and user costs of the highway system. ⢠National Bridge Investment Analysis System (NBIAS). This tool determines repair, maintenance, rehabilitation, functional improvement, and investment needs for bridges. The tool uses data on the condition of bridges from the National Bridge Inventory (NBI) database, and forecasts the improvements and investments needed to achieve a certain level of performance. The NBIAS simulates the allocation of a certain budget to the bridge inventory to maximize user benefits and minimize agency costs. The analyst can conduct various simulations to compare the results of various budget alternatives. ⢠NCHRP Project 20-100 ROI Calculator (ROI Tool). A spreadsheet-based tool devel- oped for this NCHRP project, the ROI Tool allows users to summarize data from different simulation tools (either their own TAM systems or outside tools such as NBIAS). The calculator also includes factors and procedures from HERS-ST to estimate user benefits for pavement projects. It does not estimate user benefits for bridge projects. See Chapter 5 in this guidebook for instructions on how to use the ROI Tool.
ROI Calculation Guidance 53 examined. Other characteristics, such as historical information on detour lengths and any changes on average detours, also can be used to help estimate additional impacts on users. Most analyses will also need to make use of internal tools that can simulate the effects of dif- ferent investment scenarios on assets or transportation network performance. Step 3 also should include identification of available internal tools. These will be used to help establish the modeling approach in Step 4. If internal tools are not available, outside tools (e.g., HERS-ST and NBIAS) can be used to estimate impacts on roads and bridges. Once the existence and locations of the necessary data have been established, the data needs to be reviewed to identify any major gaps. If significant data gaps exist, it may still be possible to conduct a rough analysis using proxies from other agenciesâ experiences to fill the gaps. Step 4: Establish Modeling Framework and Choose Analytical Method Once the purpose and scope of the project and the availability of needed data and tools have been assessed, it is possible to begin building the foundation for estimating impacts. Step 4 involves defining the investment case and base case, choosing the appropriate analytical method for quantifying impacts, and establishing key parameters. Step 4, Task 1: Define Investment Case First, the investment case should be defined. This is done by specifying what the investment will be, including its scope and capacity, and determining the likely improvements that will occur once the change has been made. Defining the investment case includes identifying which assets the new system(s) and practice(s) will cover and specifying the components of the TAM system(s) to be purchased along with the related procedures to be implemented. The extent to which the agencyâs maintenance decisions will adhere to TAM system recommendations also needs to be considered. Some of this information may have been collected in Step 1 with the TAM classification checklist. Questions to consider when defining the investment case include: ⢠What percentage of agency assets will be covered by the TAM system or practices? ⢠What percentage of agency needs will be addressed through the new TAM system or practices? ⢠What asset management approach will be used (e.g., worst first, most cost-effective), and how does the approach differ from existing approaches? ⢠How many potential treatments will be considered? ⢠What is the annual target budget for the assets? ⢠What percentage of the agencyâs budget will be impacted by the TAM recommendations? ⢠How will agency operations change over time? Step 4, Task 2: Define the Base Case The base case also must be defined. The base case encompasses the conditions that would prevail if the agency does not invest in the TAM system. STEP 1 STEP 2 STEP 3 STEP 4 STEP 5 STEP 6 STEP 7 Define Purpose of Study Identify Likely Impacts Assess Available Data Conduct Analysis Establish Modeling Framework Collect Necessary Data Estimate ROI and Summarize Results
54 Return on Investment in Transportation Asset Management Systems and Practices The base case should be a realistic scenario, reflecting what the agency will actually do if it does not make the TAM investment being analyzed. For example, continued use of the legacy system and existing methods should be assumed only if this scenario is realistic; otherwise, some other system purchase costs should be assumed. It is not reasonable to assume that assets will not be maintained in the absence of a new TAM system or practices. Assumptions will be needed about the likely costs of maintaining, or perhaps upgrading, existing systems and practices, along with any potential benefits that might arise (e.g., from upgrades) in the absence of the TAM invest- ment. It may also be necessary to consider if overall funding will be declining in the base case. If overall funding is declining, investment in a new TAM system or practices may not improve the overall condition of all agency assets; rather, it may reduce or slow an overall decline in the assetsâ condition as compared to the base case. In defining the base case, the analyst should consider all assets and processes that the TAM system could affect. Questions to ask to help define the base case include: ⢠What existing methods and processes for managing assets are likely to change with the new/upgraded TAM system? ⢠Are any data collection systems likely to change with the new/upgraded TAM system, and if so, how? ⢠What current decision-making procedures could change with the new TAM system? Once the base case is clear, the investment case can be defined in contrast to it, using infor- mation gathered in Steps 1 and 2, in which details of the investment were specified and likely impacts were identified. If multiple systems or practices are being implemented during the period of analysis, the potential exists for multiple, overlapping impacts. For example, an interim bridge system could be followed in 2 years by a more robust system. When conducting a ROI analysis in such a situation, the benefits of the two investments need to be separated as much as possible. Alternatively, the analysis could cover both investments (costs and benefits) together. Step 4, Task 3: Establish Which Benefits to Include in the Analysis â Agency, User, Area/Community Once the base case and the investment case have been defined, the next task is to determine which benefits to include in the analysis. The relevant benefits will be related to the desired results of the TAM system (see text box on the potential benefits of TAM systems). The most commonly estimated benefits include staff time savings, reduced asset management backlog, and other agency cost savings. For many analyses, the residual value of improved assets can be one of the largest benefits, in part because of the comparatively long lifespan of transporta- tion assets. TAM systems produce direct and indirect effects. Direct effects are impacts on project stake- holders (typically transportation agencies, asset users, and members of the community) and relate directly to the implementation or improvement to the TAM system. Examples of direct effects include changes in staff time needed to complete tasks due to having the TAM system; changes in expenditures on repairs/rehabilitation based on information from the TAM; and so forth. Indirect effects are impacts on stakeholders that are triggered by the direct effects. An indirect effect could be changes in economic activity reflecting additional economic develop- ment in an area where a bridge was improved. Indirect effects should not be included in the ROI analysis because they may lead to double counting. All of the benefits suggested in this guidance result from direct effects.
ROI Calculation Guidance 55 Step 4, Task 4: Choose the Analytical Method for Quantifying Impacts The next task focuses on choosing the best method for quantifying the impacts of the TAM investment (i.e., how the situation differs due to the introduction of the TAM investment). Additional details on each of these methods and estimation techniques, including a discussion of their strengths and weaknesses, can be found in Chapter 2. ⢠Simulation. Simulations model the âwhat-ifsâ of a future situation (scenario). They can be used to estimate the effects of TAM actions by simulating the asset conditions and agency costs under the base case and investment case. For a retrospective analysis, the implemented TAM system can be used to estimate what would have occurred without that system being in place. Depending on the policies and procedures in place before the system, an analyst can use historical data from before the systemâs implementa- tion to model what would have occurred without the system or procedure changes. Analysts also can project forward the same activities and impacts. This approach can be used to test various scenarios and estimate what would have occurred without the investment. Depending on the system, simulations can be run based on a smaller budget, on fewer activities, or on a different mix of activities. Simulation examples are included in the case studies summarized in Chapter 3. For a prospective analysis (e.g., for a future TAM investment or an upgrade to an existing one), running simulations may still be possible using existing in-house systems or by gaining permission to use the system of another agency to test scenarios. An example is provided in the pilot test summarized in Appendix F of this guidebook. If the scope of an existing TAM system is being expanded, either to cover a greater percent- age of assets or to add different types of assets, simulations can be run using different param- eters or inputs (such as a larger budget) to reflect the appropriate scenarios. Potential Benefits of TAM Systems Transportation Agency Savings ⢠Reduced asset management backlog, ⢠Staff time savings from improved data accessibility, ⢠Cost savings from optimizing investment strategies, ⢠Avoided outlays for legacy systems, ⢠Improved worker safety, ⢠Reduced travel costs into the field, and ⢠Increased residual value (remaining asset value at end of the analysis period). User Savings ⢠Lower vehicle operating costs (reduced wear and tear and reduced fuel consumption) from smoother pavements and more direct routing, ⢠Travel time savings, and ⢠Safety benefits. General Public Savings ⢠Emissions cost savings from smoother pavements and more direct routing, and ⢠Reductions in noise levels.
56 Return on Investment in Transportation Asset Management Systems and Practices ⢠Benefit transfer. Benefit transfer approaches use empirical value estimates from a previous study in the organization or from other studies with similar contexts. Findings from previous research on TAM investments and their returns may include data that can be used to supplement, or be used in place of, other data. If data from previous sig- nificant policy or process changes are available, that data may be used as a proxy. The analyst will need to make assumptions about how closely the impacts of the upgrade will mirror the impacts of the initial investment, and subject those assumptions to a sensitivity analysis at the summary stage (see Step 7, Task 4). The case studies in Chapter 3 include information that may be used for benefit transfer purposes. ⢠Time series. A time series analysis can examine system-wide conditions or expenditures before and after implementation. This approach makes it possible to estimate the impacts of an investment or actions that have already been implemented. Multiple data points are needed for the periods before and after implementation of the TAM system or practice improvements that are being examined. Chapter 3 includes a case study that uses time series analysis. If an agency is considering an upgrade to an existing TAM system, historical data from before and after the initial implementation can be used to approximate the benefits. The ana- lyst will need to make assumptions about how closely the upgrade will mirror the impacts of the initial investment. These assumptions should be part of a sensitivity analysis at the sum- mary stage (see Step 7, Task 4). ⢠Expert assessment. In the absence of observed data or tools to simulate the base case and investment case, the analyst can consult with subject matter experts or agency personnel with expertise in asset management. The key variables for the impacts identified in Step 2 can be estimated through facilitated discussions, surveys, or interviews with these experts. ⢠Controlled field experiments. Agencies can conduct controlled field experiments to exam- ine performance differences (using measurable indicators) with and without the TAM system or changed practices. Typically, such experiments are designed to assess a specific process or asset (e.g., implementing the change on a portion of the assets, then examining the results and making adjustments as part of a phased implementation). An example of this approach would be a state that âtestsâ a newly developed culvert inventory system for a year in one part of the state before making final refinements and implementing the inventory system state-wide. For this approach to succeed, the controlled experiments must be set up before the TAM improvements are implemented. Additionally, because they require time and resources to implement and to analyze results, controlled field experiments may delay the full implementation of the new or upgraded TAM. Table 4-1 lists the methods that can be used for retrospective and prospective analyses. The analyst should reference the TAM Investment Classification Checklist when selecting the analytical method for quantifying impacts (see Step 1 and Figure 4-2). Prospective Analysis Retrospective Analysis Simulation Benefit transfer Expert assessment Simulation Benefit transfer Time series Expert assessment Controlled field experiments Table 4-1. Method and estimation technique options for prospective and retrospective analyses.
ROI Calculation Guidance 57 If the goal is to: ⢠Justify TAM investment already made and in place, a retrospective analysis will be needed. ⢠Make the case for a new investment, a prospective analysis will be conducted. If the stated purpose of investment is: ⢠Better or more efficient use of agency resources or better management of asset level of service and serviceable life, it may not be necessary to estimate benefits to asset users or the broader community. ⢠Improved travel conditions, it will be necessary to estimate benefits for transportation system users. Step 4, Task 5: Establish Key Modeling Parameters In completing this task, the analyst defines the most important assumptions, or parameters, used in estimating the ROI. This section of the guidebook briefly describes these parameters: ⢠Timeframe for analysis, meaning the years for which the analyst is considering impacts. The timeframe should be long enough to include benefits resulting from improved conditions due to the TAM investment. Although BCAs for transportation investments typically include 20 to 30 years of expected benefits, TAM BCAs can cover 5 or 10 years. A BCA for a new or upgraded TAM system covering a much longer period risks greater uncertainty, as projections become less reliable the farther out in time they go. ⢠Timing of ramp-up in benefits, which accounts for lower benefits during the period immedi- ately after implementation due to lower productivity as staff are trained and the TAM system is rolled out. ⢠External factors impacting benefits over time, which can include long-term policy shifts and major regional demographic or economic shifts that come into play during the analysis timeframe. If any such factors are identified, they should be incorporated into the analysis, usually by adding additional escalation factors, shifting the timing of benefits, or using other adjustment methods, where reasonable. Testing the Guidance Lesson 2 Even an incomplete review of benefits can be useful. A New England state agency that tested the TAM ROI guidance had identified a range of likely benefits from a planned culverts and closed drainage systems tracking system. The agency had little readily available impact data and little time to search for it; but staff did have ready access to information on recent culvert/closed drainage failures that had required emergency actions and had significant impacts (e.g., closing a major roadway through town for an after- noon). It was relatively easy to gather these data, make high level estimates of the costs of the failures, and then calculate the likely benefits of avoiding similar situations in the future. These benefits alone were estimated to be greater than the investment costs for the basic versions of the systems being considered, easily making the case for the investment. Additional details about this example are included in Appendix F.
58 Return on Investment in Transportation Asset Management Systems and Practices ⢠Economic variables, which include: â Inflation rates reflecting the trend toward higher prices over time. If future costs and ben- efits are expressed in nominal dollars, these can be converted to real dollars using price indexes, which are available for many products and services. Options range from broad indexes, such as the Gross Domestic Product (GDP) chain deflator, to intermediate indexes, such as the Consumer Price Index (CPI), to narrow indexes for a specific cost, such as high- way construction or resurfacing costs. â Discount rates making values from different years comparable. Higher discount rates result in total lower present values. For transportation investments requesting federal TIGER funding, applicants are directed to present results using 7% and 3% discount rates. Some states have their own guidance on discount rates. â Economic values, allowing for the monetization of impacts (e.g., hours saved and crashes avoided). If an agency has recommended monetization values (e.g., for the value of time and crashes), those should be used for consistency in the ROI analysis. Otherwise, ana- lysts can refer to federal guides for BCAs on transportation projects such as U.S.DOTâs TIGER BCA Resource Guide (See information at https://www.transportation.gov/sites/ dot.gov/files/docs/Tiger_Benefit-Cost_Analysis_%28BCA%29_Resource_Guide_1.pdf). To estimate the value of reduced emissions from variations in average vehicle speeds and fuel consumption independently of an outside tool (such as the one developed for this guidance), the analyst can use EPAâs MOtor Vehicle Emission Simulator (MOVES). Addi- tional information on MOVES can be found at https://www.epa.gov/moves/moves2014a- latest-version-motor-vehicle-emission-simulator-moves. ⢠Factor for TAM sophistication, which comes into play when it is necessary to scale the level of impacts to match the level of sophistication of the TAM system. For example, benefits that have been estimated for a more sophisticated TAM system may need to be reduced for a less sophisticated system that is being implemented. Aspects of the TAM system to con- sider include: the portion of assets covered; complexity of information included in the TAM system; whether the system will be phased in (e.g., a new system for organizing information which first relies on old data before new data collection is completed); the number of metrics being used and their alignment with agency needs; and how methods of data collection and decision-making processes may change. More information about each of these parameters can be found in the discussion of the ROI framework in Chapter 2. Testing the Guidance Lesson 3 Timing matters in more ways than one. While seeking to estimate future repair and replacement needs, a state agency testing the TAM ROI guidance couldnât comfortably assume straight-line pro- jections for later years. Investments in transportation infrastructure had been uneven over the decades, with a significant portion of the assets built during the 1970s. Thus, a disproportionate amount of the stateâs roads, culverts, and closed drainage systems would be reaching the end of their natural life cycles at the same time. Depending on how the historical data lined up with most facilitiesâ life cycles, the department might over- or under-estimate average needs going forward.
ROI Calculation Guidance 59 Step 5: Collect Necessary Data During Step 5, the analyst collects all the data that have been identified for the analysis. Usually this will entail compiling existing data from multiple sources rather than undertaking collection of original data from the field. This step may take the longest to complete. For both the base case and the investment case, it will be necessary to collect the agency infor- mation identified in Step 3. If the analysis purpose requires estimating user benefits, it will also be necessary to collect data on asset conditions and transportation performance. If a retrospec- tive analysis is to be performed, data will be needed from multiple time periods, both before and after the TAM implementation. If key data points are missing, several approaches can be taken to fill the data gaps: ⢠If data are available for a limited number of years, it may be possible to interpolate or extrapo- late information from the available data for the years needed. ⢠If no data are available for a specific input, analysts can consult the case studies prepared for this project (see Chapter 3), the pilot testing (see Appendix F), or the research literature (see Appendix A) for appropriate assumptions. ⢠Examination of past investments or policy changes may also yield usable estimates if the impacts under those situations are suitable as proxies for the impacts of the TAM investment being analyzed. STEP 1 STEP 2 STEP 3 STEP 4 STEP 5 STEP 6 STEP 7 Define Purpose of Study Identify Likely Impacts Assess Available Data Conduct Analysis Establish Modeling Framework Collect Necessary Data Estimate ROI and Summarize Results Testing the Guidance Lesson 4 Donât be afraid to use ranges for data inputs. Staff from a state agency that tested the guidance didnât want to use a single value to represent the average amount of years between inspections; this approach was not intuitive enough for them and their audience. Instead, they preferred to assume that 90% of the culverts and closed drainage systems would be inspected every 10 years, and the remaining 10% would be inspected every 20 years. Step 6: Conduct Analysis Step 6 involves conducting the analysis defined in Step 4. The exact methods and assumptions used in the estimation of benefits (likely impacts) in Step 2 will depend on the characteristics of the TAM systems being evaluated, the context in which they are deployed, and data availability. STEP 1 STEP 2 STEP 3 STEP 4 STEP 5 STEP 6 STEP 7 Define Purpose of Study Identify Likely Impacts Assess Available Data Conduct Analysis Establish Modeling Framework Collect Necessary Data Estimate ROI and Summarize Results
60 Return on Investment in Transportation Asset Management Systems and Practices The type of analysis will vary depending on the method used, but they all share the goal of esti- mating impacts (and putting dollar values to those impacts) that are due to the new or improved TAM system. Estimating Agency Benefits Most agency benefits will take the form of agency cost savings, either as reduced outlays or increases in productivity. These benefits should be estimated as the difference between agency costs for an activity such as staff time, trips into the field, and so forth in the base case, and agency costs for the same activity in the investment case. When estimating these impacts, it is important to consider that the agency can experience them in multiple ways. For example, a TAM implementation or upgrade may allow the agency to accomplish a specific number or complexity of tasks with less effort or cost. Alternatively, increased staff efficiency may allow the agency to accomplish more tasks with the same effort or cost. If the investment case involves creation of new activities or responsibilities, the new activities and responsibilities should be treated as dis-savings or incremental costs, and they need to be balanced by the value of the benefits associated with the TAM implementation or upgrade. With respect to potential labor cost savings from a TAM investment, many (perhaps most) agencies may see no direct reduction in costs, as employees may be re-assigned to other activi- ties. It may be harder to collect data on labor productivities than on staff salaries, but the full value of labor productivity gains from the investment should be counted as a benefit. Rather than comparing staff salaries or hours as undifferentiated blocks of time, the analyst should estimate the hours (or percentages of staff time) expended on a specific set of activities for both the base case and the investment case. These hours can then be multiplied by an hourly labor rate to determine a more nuanced sense of the impacts of the investment. Estimating Asset Impacts Decreases in asset management backlog may be the largest benefits of improved TAM sys- tems and practices, as highlighted in the case studies (see Chapter 3). To estimate the impacts on assets and work backlog, a simulation model can be run using an in-house TAM system or other tools like spreadsheet calculators or decision trees. The analyst also may use external models, like HERS-ST and NBIAS. Figure 4-4 shows the relationship of these models to the project benefits. Project Beneï¬ts Agency Cost Savings Asset Impacts Internal TAM Systems and Tools External Models Figure 4-4. Relationship between project benefits, agency cost savings, asset impacts, and the use of tools and models for BCA.
ROI Calculation Guidance 61 Estimating User and Broader Area / Community Impacts Once agency impacts and changes in asset conditions have been estimated, user and broader community benefits can be estimated if they are expected to contribute to the overall benefits of the TAM investment. The estimation of user benefits will require the use of algorithms built into in-house TAM systems, existing software products (such as HERS-ST), or the NCHRP Project 20-100 ROI Calculator (ROI Tool). The ROI Tool can help summarize data gathered from various in-house or outside simulation tools. It includes factors and procedures to esti- mate user benefits for pavement projects, but not for bridge projects. In this guidebook, Chap- ter 5 describes how to use the ROI Tool. This spreadsheet-based tool will need to be used in combination with intermediate output on asset conditions and usage generated by the simulation tools. Step 7: Estimate ROI and Summarize Results In the final step, the BCA metrics are calculated to determine the rate of return on the invest- ment. Figure 4-5 presents a visual representation of the framework used for conducting the ROI analysis. Step 7, Task 1: Calculate ROI Metrics Begin by calculating total costs and benefits over the pre-selected analysis timeframe. Then calculate metrics to summarize the results of the ROI analysis. The ROI framework presented in Chapter 2 of this guidebook describes the concepts and procedures for calculating ROI metrics in more detail, but the basic procedure is as follows: 1. Enter values for costs and benefits for each year of the analysis and monetize benefits that are not already in dollars using the valuation metrics identified when determining the key modeling parameters (Step 4, Task 4). Include only the direct costs and benefits of the TAM investments. If the cost figures cover several different years and include inflation, adjust all the values to a common (base) year. 2. Tabulate the benefits and costs for each scenario for the period of years of the analysis. 3. Calculate the present value (PV) of the benefit stream and the cost stream for each scenario by discounting. If the analyst is working in a commercially available spreadsheet, an embed- ded function can usually be used. For example, in Microsoft Excel, the NPV function can be used, with ârateâ representing the discount rate being used, and values 1 through x represent- ing the benefits or costs for each period. A discount rate should be used when determining the key modeling parameters. 4. Calculate the incremental benefits, which are the additional benefits from using the TAM system. To find the incremental benefits of the TAM investment, subtract the PV of base case benefits from the PV of investment case benefits. 5. Determine the incremental costs of the TAM investment. Incremental costs are the additional costs of implementing and managing the TAM system. Subtract the PV of base case costs from the PV of investment case costs. STEP 1 STEP 2 STEP 3 STEP 4 STEP 5 STEP 6 STEP 7 Define Purpose of Study Identify Likely Impacts Assess Available Data Conduct Analysis Establish Modeling Framework Collect Necessary Data Estimate ROI and Summarize Results
62 Return on Investment in Transportation Asset Management Systems and Practices 6. Calculate the ROI metrics. Several measures are available for summarizing the results. All of the measures compare the benefits and costs estimated over the TAM investment life cycle. The interpretation and use of the measures will vary, but all provide a summary of whether or not the investment is worthwhile. â NPV is calculated as the PV of the benefits (i.e., the entire stream of benefits discounted to the present) minus the PV of the costs (including initial capital costs and ongoing main- tenance and operating costs discounted to the present). â B/C ratio is calculated as the PV of the benefits divided by the PV of the costs. â IRR is the discount rate at which benefits and costs break even (are equal). If the IRR is greater than the discount rate used for the ROI analysis, then the TAM investment is eco- nomically viable. â Payback period is the number of years it takes for the net benefits (benefits minus costs) to equal or pay back, the initial investment costs. Calculate the payback period by counting the number of years it takes for net benefits to equal the investment costs of implementing the TAM system. A payback period that exceeds the expected lifetime of the TAM system is not economically viable. 7. Assess whether the BCA justifies the TAM investment. B1 B2 B3 Bn PV of Investment Case Beneï¬ts Discount to Present Value B1 B2 B3 Bn PV of Base Case Beneï¬ts Discount to Present Value Investment Case Base Case C1 C2 C3 Cn PV of Investment Case Costs Discount to Present Value C1 C2 C3 Cn PV of Base Case Costs Discount to Present Value PV of Investment Case Beneï¬ts PV of Base Case Beneï¬ts PV of Incremental Beneï¬ts = - PV of Investment Case Costs PV of Base Case Costs PV of Incremental Costs = - PV of Incremental Beneï¬ts PV of Incremental Costs PV of Net Beneï¬ts (NPV) = - Figure 4-5. Overview of the ROI analysis.
ROI Calculation Guidance 63 Step 7, Task 2: Describe Qualitative Benefits An attempt should also be made to account for benefits that cannot be measured in monetary terms. Examples of such qualitative benefits include: ⢠More efficient decision-making, ⢠Increased service to the public, ⢠Improved accountability and public trust, ⢠Reduced failure risks for critical assets, ⢠Longer life expectancy of assets, ⢠Increased economic development along improved transportation assets, ⢠Reduced congestion, lower noise levels, and fewer emissions from more efficient travel, and ⢠Improved data quality. Testing the Guidance Lesson 5 Donât underestimate the value of qualitative benefits. While testing the guidance in the case studies, agency staff identified multiple qualitative benefits, some of which had not been considered before. By the end of the process, staff were able to articulate potentially significant benefits in addition to the likely avoidance of catastrophic failures (which alone was likely to generate savings greater than the cost of implementing the TAM system). These benefits included reduced procurement costs, lessons learned during implementation that could be applied to potential future systems or upgrades covering other assets (e.g., for signs or guardrails), and the opportunity for greater consistency in standards across the agencyâs various districts. Moreover, these additional benefits could appeal to a larger group of stakeholders, potentially leading to broader support for the investment. Some of these benefits may be quantifiable (measurable), but cannot be monetized (assigned a dollar value). Others cannot be measured at all. Yet, these benefits may be significant, and they should be noted in the analysis. After estimating the benefits that can be monetized, analysts are advised to revisit Step 2, in which likely impacts were identified, and also to review any notes taken during the analysis in order to prepare a list of benefits that cannot be monetized. The most important of these qualita- tive benefits should be summarized and included in the final summary of results. Step 7, Task 3: Preliminary Review of Results for Errors and Unintended Biases Estimating the ROI of TAM investments is a complex analysis, with lots of opportunities for error and unintended biases. After completing the above calculations, it is important to review the preliminary results for reasonableness. For example, a B/C ratio of 300 is not very reasonable, whereas one of 3.5 may be. Ideally, the preliminary results will be reviewed with other analysts or experts familiar with the project. Alternatively, the analyst can compare the preliminary results against the findings in the literature from this study, the case studies presented in Chapter 3 of this guidebook, and
64 Return on Investment in Transportation Asset Management Systems and Practices the pilot presented in Appendix F. Completing a preliminary review helps facilitate correction of small errors and recognition of unintended biases, which leads to greater confidence in the findings of the final analysis. Step 7, Task 4: Account for Uncertainty All analyses, especially those forecasting future impacts, are estimates and only as good as the data used in their calculations. ROI estimation is subject to considerable uncertainty. Whether the ROI evaluation is prospective or retrospective, at least one state of the world cannot be observed. Therefore, the analysis necessarily implies some form of prognostication or forecast- ing. Given the necessary uncertainty underlying all projected estimates, an effective ROI analysis will examine the key inputs and assumptions that have been used and seek to explain the impact that variations in those inputs will have on overall results. One or more of the analyses discussed in this section should be conducted to account for uncertainty. If benefits could not be quantified, then conduct a threshold or breakeven analysis. If benefits could be estimated, then conduct a sensitivity or scenario analysis. Sensitivity analysis can be conducted when it is valuable to know the relative importance of a particular input or assumption on the final results. Scenario analyses are useful when specific possible scenarios of interest to one or more stakeholders can be modeled. ⢠Threshold or breakeven analysis. Although TAM system and practice costs usually can be estimated with some certainty, analysts often cannot comfortably estimate the value of the associated benefits. In these situations, a breakeven analysis can be useful. The costs are esti- mated, and then the analysts attempt to calculate how effective the investment must be in order for the value of the benefits to be at least as great as the costs (i.e., at what point does the investment break even in terms of the benefits accrued). One approach is to estimate how large the total agency savings or reductions in backlog must be for them to at least equal costs, and then examine multiple possible distributions of these benefits across several categories (e.g., increased staff efficiency in terms of time saved, reduced travel costs into the field, fewer accidents in the field). The analyst also can apportion the total benefits across agency savings and usersâ benefits. For example, for an investment that is expected to cost $5 million over 10 years, the analyst can consider the likelihood that, over the same time period, agency savings would total at least $3 million and user benefits at least $3 million. ⢠Scenario analysis. Another common approach is to vary multiple inputs at the same time under different scenarios. If enough information is available about possible specific situations, the scenarios can be modeled. Often, high case and low case scenarios are created to bracket the central estimate. The values of several variables (or all assumptions of variables) can then be changed in the same direction to generate optimistic and pessimistic scenarios. Inputs to consider varying in a scenario analysis include: â Rates for asset deterioration, â Treatment effectiveness, â Weather conditions, â User volume, â Data quality, and â Adherence to recommendations of TAM system. As with a sensitivity analysis, the inputs should be varied based on the best available, rea- sonable, estimates. The results of the various scenarios, including how much they differ from the main estimates, should be reported with the final results.
ROI Calculation Guidance 65 ⢠âWhat-ifâ analysis. This type of analysis is closely related to scenario analysis. A what-if analysis estimates the impact of a single event on the value of assumptions used in the ROI analysis. The analyst first determines the magnitude of the event, and then the effect on the value of the variables. For example, it is possible to determine the impact of an increase (or decrease) in fuel prices on vehicle operating costs. The higher (or lower) vehicle operating costs are then used to determine the impact on the NPV of the TAM investment. Care should be taken to consider how a particular event may affect multiple inputs. For example, a general increase in the demand for TAM systems could lead to higher upfront purchasing costs, higher licensing fees, and higher technical support expenses. Alternatively, a shift in long-term freight movements to a portion of the area being studied could increase both the rate of asset deterioration and potential time savings (through efficient planning for the increased freight traffic on those assets using the TAM system). Step 7, Task 5: Presentation and Interpretation of Results Once all the analyses have been completed, results are summarized for presentation. All the summary ROI metrics should be organized together. Suggestions for preparing this summary include: ⢠Who will read the final ROI report? What is their degree of familiarity with TAM systems, ROI analysis, and economic analysis in general? What are they most interested in knowing? The summary should place key information close to the beginning and make it easy to find. If the report will be read by a fairly broad audience, presenting important information in multiple forms (i.e., incorporating graphics or tables along with the text) can be helpful. ⢠Present the summary metrics in a table, and include short phrases to describe the important qualitative benefits that could not be monetized. This format helps to keep important qualita- tive benefits in front of the reader so that they are more likely to be considered together with benefits that have been monetized. Significant qualitative benefits also should be described in the text, together with the other findings. ⢠Depending on the audience for the final report, the analyst may include additional non- monetary benefits, such as gallons of fuel saved, total fuel cost savings, tons of greenhouse gases reduced, or FTE savings in staff. For example, an investment in data collection auto- mation may not reduce overall agency staff or total agency costs, but it may result in more output (e.g., more assets being assessed). Other potential metrics for estimating the impact of TAM systems and practices on asset conditions include remaining asset service life, asset condition, and traffic-weighted average asset condition by category (e.g., good/fair/poor). ⢠Note critical assumptions and the most significant uncertainties soon after the ROI metrics. If the analysis results depend on inputs drawn from studies on other agenciesâ experience that have been scaled up or down to reflect notable differences in circumstancesâor if they depend on estimates from agency officials with limited experience in the TAM systems being evaluatedâreaders should be made aware of this when considering the results. Noting critical assumptions and uncertainties is particularly important when estimating returns on invest- ments for which relatively little research exists. ⢠Summarize the findings of scenario or what-if analyses soon after noting the key assumptions. These findings, together with the key assumptions, help the reportâs readers better understand the likely range of returns on the TAM investment.
