
12
Health, Economic Status, and Aging in High-Income Countries
Jinkook Lee1and James P. Smith2
INTRODUCTION
The world is aging at rapid rates and will clearly continue to do so far into the future. With this population aging comes several challenges and opportunities in maintaining decent income flows, good health, and affordable health care into a longer set of retirement years and in doing so within affordable budgets. These goals will certainly require policy adjustments in many countries to provide decent income support and good health during older ages. An important resource for designing these policy adjustments are cross-country panel data that illustrate in principle the consequences of different policies adopted in different countries. Based on significant and ongoing investments over the last few decades, we have such data now in the Health and Retirement Study (HRS) around the world surveys.3
In this paper, we use harmonized panel data from high-income countries that are part of the HRS around the world surveys to describe levels and changes in health status and health behaviors for populations across these countries at middle age and older ages. For the high-income countries that are our focus in this paper, population aging due to declining fertility and improving mortality has taken place alongside very different trends across countries and across groups within countries in improved health behaviors, education, and income growth. We document significant varia-
___________________
1 University of Southern California and RAND Corporation.
2 Senior Economist, RAND Corporation.
3 See https://micda.psc.isr.umich.edu/networks/hrsiss.html [April 2018].
tion in both health outcomes and behaviors across this set of high-income countries. Such variation provides the opportunity to investigate reasons underlying cross-country differences in health outcomes, a continuation of the body of work that started with the England–United States studies in this network (Banks et al., 2006). Part of our discussion is also devoted to suggesting ways in which the underlying data in the HRS network can and should be improved. One focus of that discussion deals with the introduction of biomarker data into the network, a process now under way.
The remainder of this paper is divided into five sections. The second section documents harmonized HRS data that will be used in our research and the operational definition of variables in the analysis. The third summarizes levels and trends in two salient measures of health levels and trends in our set of high-income countries: mortality and disease prevalence. The fourth section summarizes a parallel set of results on health behaviors over time and across countries, while the fifth reports our findings on early-life influences on later-life health in these surveys. The final section highlights our major conclusions.
DATA
In this paper, we use data from high-income countries in the HRS around the world surveys. These surveys represent a set of harmonized, multidisciplinary, longitudinal, and nationally representative aging datasets that have evolved in the last 25 years to document changing health, economic status, and family relations of middle-aged and older populations in many countries. These datasets were explicitly designed in a harmonized way to monitor impacts of new health and retirement policies affecting older cohorts’ incentives to continue working or to exit the labor market, to access health care services and/or the related welfare provisions, and to achieve adequate income from retirement savings (Dobrescu and Smith, 2016).
The new set of surveys begins with the HRS in the United States, where the key innovation—adopted subsequently by all other surveys in the network—was to break with the almost universal tradition of other panel surveys on aging, which focused almost entirely on a single life domain—say, economics or health—and were administered mostly by a single academic discipline. But the separation of these life domains was based on the false idea that the domains are independent of each other and that understanding behaviors in one domain can be achieved without knowing much about the others. A major strength of HRS was that it recognized early on that all life domains are interrelated, and it implemented that idea successfully into its modules. HRS is a biennial survey that started in 1992 and includes refresher cohorts every 6 years.
A coherent network of harmonized panel datasets can help study behavioral reactions to changes in public policy (e.g., changes in health care utilization and its implications for health status in the wake of a health care reform; changes in the retirement age and the level of savings preceding a pension reform). In doing so, one can understand not only how individuals respond to their socioeconomic environment (including institutions and policy measures) but also how the aging process unfolds in different cultures, societies, and policy environments over time. The advantage of having this set of international countries with harmonized data is that individual countries have adopted different changes in policies at different times; these differences serve as the backbone for analyzing the central exogenous changes in policies dealing with population aging.
Besides the U.S. HRS, the HRS network of high-income countries includes the English Longitudinal Survey of Ageing (ELSA), conducted in England since 2002; the Survey of Health, Ageing and Retirement in Europe (SHARE) with its coverage of continental European countries conducted since 2004; the Irish Longitudinal Study of Ageing (TILDA) in the Republic of Ireland; the Scottish (Hagis) and Northern Ireland (Nicola) studies in 2016, the Mexican Health and Aging Study (MHAS) in Mexico in 2001: the Korean Longitudinal Study of Aging (KLoSA) in South Korea starting in 2006, and the Japanese Study on Aging and Retirement (JSTAR) in Japan starting in 2007.
Since this paper examines patterns both at a moment in time and in changes over time, we limited ourselves to those high-income country HRS-style surveys that existed in 2006 and that had a 2012 wave, with the exception of JSTAR, which started in 2007 and had a 2013 wave. This dual-year requirement on survey fielding dates meant we could not use surveys from the Republic of Ireland, Northern Ireland, Scotland, and Mexico in this paper. In addition, the specific SHARE countries that are included here had to have a 2006 wave. These SHARE countries are Austria, Belgium, Czech Republic, Denmark, France, Germany, Italy, Netherlands, Spain, Sweden, and Switzerland. Low- and middle-income countries are the subject of another paper in this volume and are not included in our paper.
Our analysis uses the Gateway to Global Aging Data (g2aging.org), a data and information platform developed to facilitate cross-country analyses using the HRS network of surveys. The Gateway has compiled and indexed metadata (i.e., data specifying the content and flow of the questionnaires), as well as other relevant information, such as information about samples, from all available waves of 12 surveys in the HRS network, representing 40 countries. These metadata enable users to quickly attain concordant information across surveys and across waves of individual surveys. The Gateway also provides harmonized data files that can be used for analyses across countries and over time. The complexity of survey design and the
challenges of longitudinal linkages result in significant costs to construct suitable datasets for international investigations. The harmonized data files have been built to significantly reduce such costs and to eliminate errors.4
We use the harmonized measures available from the Gateway to examine cross-country differences in health and health behaviors. The harmonized variables drawn from the study-specific harmonized datasets include several demographic measures. Five doctor-diagnosed diseases as reported by respondents are included as health indicators: diabetes, heart conditions, stroke, hypertension, and cancer. Indicators for several health behaviors are also included: ever smoked, currently smoke, currently drink and amount, exercise, and obesity. Obesity is categorized as having a body mass index (BMI) of 30 or greater, based on height and weight, which are either self-reported or measured, depending on the study. Further details of variable definitions are available from the codebooks of the harmonized data files.
HEALTH STATUS IN THE HRS HIGH-INCOME COUNTRIES
Mortality
Trends in post–World War II mortality, especially at middle and older ages, in high-income industrial countries are well known (Preston et al., 2010). These trends are illustrated in Table 12-1 for selected countries that fall within our focus for the period 1950–2015, as revealed in the Berkeley Mortality Database. More concretely, Table 12-1 shows life expectancy at age 50 by country, starting in 1950–1959, for men and women separately and at selective 10-year intervals in the decades thereafter. The high-income countries in our set of countries that are not shown in this table exhibit similar secular trends. The final three rows for men and for women in the table document changes in life expectancy at age 50 during the 1950–1999 and 1999–2015 decades and during the full 65-year period covered by the table (1950–2015).
Over this 65-year period, secular trends in life expectancy at age 50 are very positive indeed, with a significant expansion in life expectancy in all countries for men and women alike. This increase in life expectancy at age 50 is as high as 12.5 years for Japanese women and as little as 4.5 years for Danish men. Life expectancy growth at age 50 in the United States is clearly
___________________
4 For our analysis, we used the harmonized data files built from individual-level data from six HRS-network surveys. This analysis uses data from the RAND HRS Version P, Harmonized MHAS Version A Beta.3, Harmonized ELSA Version D, Harmonized SHARE Version C.2, Harmonized KLoSA Version B, and Harmonized JSTAR Version B. We use harmonized measures available from Gateway to examine cross-country differences in health and health behaviors.
TABLE 12-1 Life Expectancy at Age 50 by Calendar-Year Periods and Country
| Year | U.S. | Belgium | Denmark | France | Ireland | Italy | Japan | Netherlands | Spain | UK |
|---|---|---|---|---|---|---|---|---|---|---|
| Male | ||||||||||
| 1950–1959 | 22.9 | 23.0 | 25.3 | 22.6 | 23.3 | 23.9 | 21.9 | 25.8 | 23.3 | 22.4 |
| 1990–1999 | 27.0 | 26.7 | 26.0 | 27.5 | 25.7 | 27.7 | 29.0 | 27.0 | 28.0 | 26.6 |
| 2000–2009 | 28.7 | 28.6 | 28.0 | 29.4 | 28.7 | 30.1 | 30.7 | 29.0 | 29.6 | 29.1 |
| 2010–2015 | 29.9 | 30.1 | 29.8 | 30.9 | 30.8 | 31.3 | 31.7 | 30.7 | 31.2 | 30.9 |
| ∆ 1950–1999 | 4.1 | 3.7 | 0.7 | 4.9 | 2.4 | 3.8 | 7.1 | 1.2 | 4.7 | 4.2 |
| ∆ 1999–2015 | 2.9 | 3.3 | 3.8 | 3.4 | 5.1 | 3.6 | 2.7 | 3.7 | 3.2 | 4.3 |
| ∆ 1950–2015 | 7.0 | 7.1 | 4.5 | 8.3 | 7.5 | 7.4 | 9.8 | 4.9 | 7.9 | 8.5 |
| Female | ||||||||||
| 1950–1959 | 27.3 | 26.6 | 27.0 | 27.0 | 25.5 | 26.7 | 25.1 | 27.6 | 26.6 | 26.8 |
| 1990–1999 | 31.6 | 32.1 | 30.2 | 33.8 | 30.2 | 33.0 | 34.5 | 32.1 | 33.5 | 31.0 |
| 2000–2009 | 32.4 | 33.3 | 31.6 | 35.3 | 32.6 | 34.8 | 36.8 | 33.0 | 35.1 | 32.7 |
| 2010–2015 | 33.5 | 34.3 | 33.2 | 36.4 | 34.1 | 35.5 | 37.6 | 34.1 | 36.3 | 34.0 |
| ∆ 1950–1999 | 4.3 | 5.5 | 3.2 | 6.8 | 5.8 | 6.3 | 9.4 | 4.5 | 6.9 | 4.2 |
| ∆ 1999–2015 | 1.9 | 2.2 | 3.0 | 2.6 | 2.9 | 2.5 | 3.1 | 2.0 | 2.8 | 3.0 |
| ∆ 1950–2015 | 6.2 | 7.7 | 6.2 | 9.4 | 8.7 | 8.8 | 12.5 | 6.5 | 9.7 | 7.2 |
below the average of the other high-income countries, with especially slow improvements so far in the 21st century.
The increase in American male life expectancy at age 50 is about 7 years, with the only two countries in our table below that number being Denmark and the Netherlands. With the exception of the United States and the United Kingdom, secular trends in remaining years of life at age 50 are actually even higher for women than for men. Japan stands out above all the rest of the countries with an increase in life expectancy of 9.8 years for men and 13.5 years for women. But our most important conclusion on mortality is that Americans generally experienced the smallest life expectancy gains among these high-income countries, especially in recent years.
Disease Prevalence in the HRS Surveys
Population aging carries with it many challenges and opportunities. One of the most basic is maintaining and financing good health status into older ages and over calendar time. To highlight the variation across countries and over time, Table 12-2 summarizes separately for women and men self-reports of disease prevalence at any time during life (“ever”) for diabetes, cancer, high blood pressure, heart disease, and stroke, for calendar years 2006 and 2012. Two age groups are presented in Table 12-2: the young old, who are ages 55–65, and the older old, who are ages 66+. To conserve space in the table, we have aggregated the SHARE countries into the Central, Eastern, Northern, and Southern Europe groupings defined in the notes to Table 12-2.
Using self-reports of disease as the metric, Table 12-2 shows that American males in both age groups always rank first in highest self-reports of all diseases, in both 2006 and 2012, and American women are mostly number 1 as well (Banks et al., 2006; Avendano et al., 2009). In addition, the very general tendency for all countries is for reported disease prevalence to be higher in calendar year 2012 compared to 2006, with the United States once again tending to lead the way in increases observed over time. Among those ages 55–65, reported disease prevalence tends to be somewhat higher among men compared to women, with the glaring exception of cancer, where the rates are higher among women compared to men.
Table 12-2 also documents substantial variation across countries in reported disease prevalence among our set of high-income countries, both in levels of self-reported disease and in changes over time. Following the United States, the countries in Eastern Europe (Czech Republic) rank a solid second place in reported disease prevalence, with England in third place and Central and Northern Europe performing best in health outcomes. Our two high-income countries in Asia—Korea and Japan—tend to have lower
disease prevalence than the United States and the European countries in the table. Age distribution differences within our broad age groups play a very limited role in explaining the differences across countries. Age differences within these age groups are very small and cannot account for prevalence differences across countries or changes over time.5 Compared to mortality as the health index, America ranks worse when self-reported disease prevalence is our measure. This is because America provides better (albeit more expensive) health care to those who are ill (Banks et al., 2010) and, as we will show below, undiagnosed disease is lower in America compared to the other countries.
In addition to cross-country differences in health status, we are interested in measures of the social gradient in health status within and across these high-income countries. We measure the social gradient using education and wealth as an alternative measure of socioeconomic status (SES). In all countries, education is divided into three groups by an individual’s years of schooling: 0–11 years of schooling, 12–15 years of schooling, or 16 or more years of schooling.6 Household wealth is also divided into three terciles: bottom third, middle third, and upper third. Because our central message does not differ much by gender or by our two age groups, we present in our tables the combined male and female data for the 55–65 age group. Due to space constraints, we also only present tables for the education gradient and discuss the wealth gradient results in the text.
Table 12-3 presents self-reported disease prevalence for three education groups for those ages 55–65, in calendar years 2006 and 2012. For assessing the social gradient in disease, education has the advantage that pathways from health to education are limited to the earlier years of life because schooling is completed by the mid-twenties if not earlier. In contrast, the evidence is that there are strong feedbacks from health shocks to lower wealth (Smith, 2004).
The data in Table 12-3 allow us to compute the education health gradient as the difference in prevalence of lowest education group minus prevalence of highest education group. We prefer to use this absolute
___________________
5 The one exception is Japan in the age 66+ group, in which the mean age is less than that in that age group for other countries. This exception is because the Japanese survey is limited to those under age 76. But even in this case, the lower disease prevalence in Japan is not primarily due to this age restriction.
6 This harmonized measure for educational attainment is based on the 1997 International Standard Classification of Education (ISCED-97) codes. Less than lower-secondary education ranges from no education up to 11 years of education and includes ISCED codes 0 and 1. Upper-secondary and vocational training ranges from 12 to 15 years of education and includes ISCED codes 2, 3, and 4. Tertiary education represents 16 or more years of education and includes ISCED codes 5 and 6. See UNESCO International Standard Classification of Education, ISCED 1997. Available: http://www.uis.unesco.org/Library/Documents/isced97-en.pd [April 2018].
TABLE 12-2 Self-Reported Health Status by Country/Region, Gender, and Age Group, 2006 and 2012
| Diabetes | Cancer | Hypertension | Heart Disease | Stroke | ||||||
|---|---|---|---|---|---|---|---|---|---|---|
| 2006 | 2012 | 2006 | 2012 | 2006 | 2012 | 2006 | 2012 | 2006 | 2012 | |
| Men Ages 55–65 | ||||||||||
| Central Europe | 10.9 | 13.6 | 4.2 | 5.8 | 34.5 | 37.4 | 13.4 | 12.0 | 4.1 | 3.9 |
| Eastern Europe | 16.5 | 19.1 | 4.0 | 4.4 | 46.2 | 53.8 | 13.5 | 14.5 | 3.4 | 6.5 |
| Northern Europe | 8.8 | 9.4 | 6.4 | 5.5 | 31.0 | 35.3 | 12.8 | 9.5 | 4.1 | 4.0 |
| Southern Europe | 12.1 | 13.8 | 4.2 | 5.4 | 35.5 | 41.9 | 10.7 | 10.0 | 3.4 | 3.2 |
| Japan | 12.4 | 15.6 | 2.9 | 4.4 | 28.0 | 36.8 | 7.3 | 8.8 | 1.8 | 2.9 |
| Korea | 14.3 | 14.3 | 2.4 | 3.2 | 24.6 | 28.9 | 4.6 | 5.4 | 3.9 | 4.3 |
| England | 9.4 | 11.0 | 4.3 | 5.0 | 40.4 | 38.2 | 12.7 | 14.3 | 3.0 | 2.5 |
| USA | 17.8 | 20.5 | 7.5 | 8.1 | 47.8 | 53.1 | 17.7 | 18.8 | 5.4 | 4.6 |
| Women Ages 55–65 | ||||||||||
| Central Europe | 8.6 | 9.7 | 8.6 | 9.6 | 35.7 | 36.0 | 7.3 | 6.8 | 2.7 | 4.0 |
| Eastern Europe | 9.5 | 14.1 | 6.6 | 7.4 | 41.4 | 46.7 | 6.4 | 8.7 | 1.9 | 2.6 |
| Northern Europe | 6.1 | 6.6 | 9.3 | 10.3 | 31.7 | 31.8 | 7.7 | 5.8 | 2.6 | 3.0 |
| Southern Europe | 10.8 | 9.8 | 6.4 | 6.1 | 39.0 | 38.1 | 6.7 | 5.4 | 1.5 | 1.9 |
| Japan | 4.6 | 7.5 | 3.7 | 3.8 | 25.7 | 25.7 | 5.8 | 6.1 | 1.9 | 1.4 |
| Korea | 12.1 | 12.4 | 3.5 | 5.5 | 31.0 | 31.5 | 4.8 | 4.9 | 3.0 | 2.9 |
| England | 5.3 | 7.6 | 8.1 | 9.2 | 36.1 | 33.2 | 11.4 | 12.4 | 1.5 | 1.7 |
| USA | 16.0 | 18.2 | 10.3 | 11.5 | 45.5 | 47.0 | 12.8 | 14.1 | 4.0 | 4.3 |
| Men Ages 66+ | ||||||||||
| Central Europe | 15.9 | 19.6 | 10.4 | 15.0 | 44.5 | 51.0 | 27.4 | 27.7 | 9.9 | 9.8 |
| Eastern Europe | 19.1 | 29.8 | 5.4 | 8.7 | 49.7 | 64.4 | 26.6 | 28.0 | 9.0 | 10.9 |
| Northern Europe | 14.4 | 15.7 | 12.8 | 14.4 | 44.3 | 48.9 | 29.4 | 24.4 | 10.9 | 11.4 |
| Southern Europe | 19.9 | 24.3 | 6.0 | 9.0 | 50.1 | 61.0 | 22.5 | 26.5 | 6.7 | 8.6 |
| Japan | 15.7 | 19.0 | 5.7 | 10.0 | 37.2 | 48.0 | 19.7 | 18.6 | 8.2 | 9.2 |
| Korea | 15.3 | 21.3 | 3.7 | 7.0 | 35.5 | 45.4 | 7.2 | 11.1 | 7.9 | 9.3 |
| England | 14.6 | 16.2 | 11.1 | 14.0 | 49.9 | 52.9 | 27.5 | 28.9 | 8.7 | 8.8 |
| USA | 22.8 | 27.5 | 21.1 | 23.6 | 58.8 | 67.4 | 37.0 | 38.1 | 11.7 | 12.7 |
| Women Ages 66+ | ||||||||||
| Central Europe | 16.6 | 16.3 | 8.8 | 13.6 | 50.7 | 54.8 | 20.8 | 21.7 | 8.4 | 9.2 |
| Eastern Europe | 21.4 | 26.5 | 4.4 | 9.9 | 56.6 | 68.9 | 20.2 | 25.2 | 9.4 | 11.6 |
| Northern Europe | 11.6 | 11.7 | 14.5 | 15.0 | 45.5 | 52.1 | 23.4 | 19.6 | 8.6 | 9.3 |
| Southern Europe | 20.3 | 23.2 | 6.0 | 9.2 | 58.3 | 66.1 | 19.3 | 23.6 | 5.1 | 7.3 |
| Japan | 9.9 | 10.3 | 5.7 | 5.4 | 41.6 | 48.4 | 14.8 | 14.2 | 4.4 | 5.6 |
| Korea | 16.6 | 22.2 | 2.2 | 4.9 | 42.1 | 54.7 | 8.2 | 12.1 | 4.5 | 6.4 |
| England | 10.3 | 13.5 | 9.5 | 13.6 | 54.2 | 53.2 | 23.3 | 26.0 | 8.0 | 7.3 |
| USA | 18.2 | 23.5 | 17.2 | 19.6 | 63.0 | 68.1 | 26.8 | 28.6 | 10.2 | 10.6 |
NOTES: Data under 2006 are for calendar 2006 except that Japan data are for calendar 2007. Data under 2012 are calendar 2012 except that Japan data are for calendar 2011.
Central Europe: Austria, Belgium, France, Germany, the Netherlands, Switzerland.
Eastern Europe: Czech Republic.
Northern Europe: Denmark, Sweden.
Southern Europe: Italy, Spain.
SOURCES: Data are from RAND HRS, Harmonized ELSA, Harmonized SHARE, Harmonized JSTAR, Harmonized KLoSA.
TABLE 12-3 Health Status by Country/Region, Education Level, and Age Group, 2006 and 2012
| Diabetes | Cancer | Hypertension | Heart Disease | Stroke | ||||||
|---|---|---|---|---|---|---|---|---|---|---|
| 2006 | 2012 | 2006 | 2012 | 2006 | 2012 | 2006 | 2012 | 2006 | 2012 | |
| 0–11 Years of Education, Ages 55–65 | ||||||||||
| Central Europe | 13.1 | 13.9 | 5.5 | 7.3 | 36.6 | 38.0 | 11.4 | 12.1 | 3.7 | 4.5 |
| Eastern Europe | 12.9 | 23.4 | 4.4 | 6.5 | 51.1 | 53.3 | 12.0 | 16.8 | 2.5 | 4.6 |
| Northern Europe | 9.8 | 10.7 | 8.1 | 8.4 | 36.6 | 35.0 | 12.9 | 8.8 | 3.9 | 3.6 |
| Southern Europe | 12.9 | 13.8 | 5.3 | 5.8 | 39.2 | 43.9 | 9.3 | 8.9 | 2.4 | 3.3 |
| Japan | 13.1 | 18.0 | 2.5 | 3.4 | 27.9 | 44.7 | 6.6 | 6.4 | 3.5 | 3.9 |
| Korea | 14.4 | 15.0 | 3.2 | 4.6 | 28.3 | 33.9 | 5.3 | 6.2 | 3.7 | 4.5 |
| England | 9.4 | 10.9 | 6.1 | 7.4 | 42.0 | 38.4 | 12.2 | 13.6 | 2.7 | 3.1 |
| USA | 27.6 | 31.3 | 7.5 | 9.0 | 56.2 | 60.8 | 19.1 | 21.2 | 7.8 | 9.4 |
| 12–15 Years of Education, Ages 55–65 | ||||||||||
| Central Europe | 7.9 | 10.7 | 6.4 | 7.5 | 35.1 | 37.4 | 9.9 | 7.6 | 3.0 | 3.2 |
| Eastern Europe | 13.5 | 15.1 | 5.7 | 6.4 | 40.7 | 50.2 | 8.3 | 9.7 | 2.0 | 4.6 |
| Northern Europe | 5.5 | 7.4 | 8.1 | 8.3 | 27.6 | 35.0 | 8.4 | 6.5 | 2.8 | 3.5 |
| Southern Europe | 9.3 | 8.9 | 6.9 | 5.9 | 35.9 | 32.8 | 7.5 | 6.3 | 2.9 | 1.3 |
| Japan | 9.0 | 10.2 | 3.0 | 4.0 | 26.9 | 29.0 | 7.4 | 7.5 | 1.6 | 1.3 |
| Korea | 11.9 | 11.8 | 2.3 | 4.6 | 27.9 | 27.1 | 3.4 | 4.2 | 3.8 | 3.1 |
| England | 6.8 | 9.9 | 5.7 | 7.0 | 37.2 | 37.4 | 12.0 | 14.6 | 2.4 | 2.0 |
| USA | 16.3 | 19.2 | 8.7 | 10.2 | 48.1 | 52.2 | 16.6 | 17.5 | 4.9 | 4.3 |
| 16+ Years of Education, Ages 55–65 | ||||||||||
| Central Europe | 7.0 | 8.5 | 8.5 | 8.8 | 32.1 | 32.6 | 8.6 | 7.5 | 3.6 | 4.2 |
| Eastern Europe | 10.5 | 9.9 | 6.1 | 3.4 | 39.6 | 42.7 | 11.8 | 9.6 | 5.1 | 2.3 |
| Northern Europe | 5.6 | 4.4 | 6.6 | 6.3 | 26.0 | 27.1 | 6.3 | 8.0 | 2.7 | 3.3 |
| Southern Europe | 1.0 | 5.3 | 2.1 | 4.5 | 22.7 | 34.4 | 2.9 | 3.5 | 0.0 | 0.6 |
| Japan | 7.4 | 12.4 | 4.8 | 4.9 | 26.9 | 31.1 | 4.9 | 7.7 | 0.5 | 4.0 |
| Korea | 8.2 | 11.9 | 3.1 | 2.5 | 24.2 | 26.4 | 3.7 | 4.1 | 1.2 | 2.2 |
| England | 5.0 | 6.6 | 7.0 | 6.6 | 34.2 | 30.6 | 10.8 | 12.1 | 0.9 | 1.1 |
| USA | 12.5 | 15.3 | 10.2 | 9.6 | 38.7 | 42.5 | 10.4 | 12.7 | 2.7 | 2.9 |
NOTES: Data under 2006 are for calendar 2006 except that Japan data are for calendar 2007. Data under 2012 are calendar 2012 except that Japan data are for calendar 2011.
Central Europe: Austria, Belgium, France, Germany, the Netherlands, Switzerland.
Eastern Europe: Czech Republic.
Northern Europe: Denmark, Sweden.
Southern Europe: Italy, Spain.
SOURCES: Data are from RAND HRS, Harmonized ELSA, Harmonized SHARE, Harmonized JSTAR, Harmonized KLoSA.
gradient rather than relative gradient (i.e., dividing this difference by the lowest-education group’s prevalence) since with relatively low prevalences, relative gradients are quite misleading. If we start again with the United States, we observe a very sharp negative education gradient in all diseases listed in Table 12-3 except for cancer, the equal-opportunity killer. This absolute-disease-difference gradient for other diseases appears to be higher in the United States than in the other sets of countries listed in Table 12-3. To illustrate, the U.S. absolute education gradient is 15.1 percentage points in 2006, whereas only one other region in the table registers a double-digit difference. However, in the other countries, the same pattern of higher disease prevalence among the less educated still prevails, again for all diseases except cancer.
Using wealth terciles as the marker for SES, we observe a very similar pattern to that just discussed for education: a very negative disease prevalence gradient by wealth levels for all countries and for all diseases but cancer, with the United States having the most negative disease social gradient. Again, the absolute difference in diabetes prevalences between the lowest and highest wealth tercile is 15 percentage points in the United States, compared with just single-digit differences in all other high-income countries. The wealth tables are available from the authors on request.
Biomarker Health Measures in the HRS Network
One of the most challenging aspects of the HRS around the world surveys has been to incorporate biomarkers into the surveys, rather than simply relying on self-reports as we have discussed to this point. Even with completely accurate self-reports to the standard type of disease question, “Did a doctor ever diagnose you with x?”, self-reports as measures for “ever have had disease x” have several glaring deficiencies. These include the widespread and changing prevalence of undiagnosed disease, the ability to control a diagnosed disease putting someone under the established threshold, and measures of disease severity; all three of these factors vary significantly across and within high-income countries.
We illustrate this point in Table 12-4, which lists relevant components for hypertension for four of the countries in our HRS high-income country network: England, Germany, Ireland, and the United States. We selected hypertension since it is the most common biomarker that is currently often measured in the HRS network. This table provides a two-by-two data stratification of hypertension data by two hypertension measures: measured blood pressure above and below the common diagnosis threshold7 and
___________________
7 Respondent is measured hypertensive if respondent has a measured systolic blood pressure of 140 or greater, or a diastolic blood pressure of 90 or greater.
TABLE 12-4 Proportion of Measured and Self-Reported Hypertension by Country, Age, and Gender, 2012
| Measured Blood Pressure | Self-Reported Hypertension | Germany | Ireland | England | USA | Germany | Ireland | England | USA |
|---|---|---|---|---|---|---|---|---|---|
| Men Ages 55–65 | Women Ages 55–65 | ||||||||
| Hypertensive | a. Diagnosed | 33.4 | 19.4 | 16.4 | 20.8 | 24.2 | 14.7 | 12.2 | 13.9 |
| b. Undiagnosed | 26.0 | 29.4 | 14.9 | 10.7 | 22.7 | 18.6 | 12.7 | 8.4 | |
| Not Hypertensive | c. Diagnosed | 15.2 | 14.8 | 21.3 | 31.8 | 11.0 | 18.1 | 20.3 | 31.6 |
| d. Undiagnosed | 25.4 | 36.5 | 47.3 | 36.7 | 42.1 | 48.6 | 54.8 | 46.2 | |
| Total diagnosed hypertension (a+c) | 48.6 | 34.2 | 37.7 | 52.6 | 35.2 | 32.8 | 32.5 | 45.5 | |
| Total hypertensives (a+b+c) | 74.6 | 63.6 | 52.7 | 63.3 | 57.9 | 51.4 | 45.2 | 53.9 | |
| % Undiagnosed among hypertensives | 34.8 | 46.2 | 28.3 | 16.9 | 39.2 | 36.2 | 28.1 | 15.6 | |
| % Undiagnosed among total population | 26.0 | 29.4 | 14.9 | 10.7 | 22.7 | 18.6 | 12.7 | 8.4 | |
| Men Ages 66+ | Women Ages 66+ | ||||||||
| Hypertensive | a. Diagnosed | 40.5 | 27.8 | 20.2 | 26.0 | 46.3 | 30.9 | 23.1 | 24.9 |
| b. Undiagnosed | 25.9 | 26.4 | 15.1 | 8.9 | 19.9 | 20.7 | 14.4 | 7.9 | |
| Not Hypertensive | c. Diagnosed | 17.9 | 18.1 | 31.5 | 40.3 | 20.8 | 22.0 | 28.5 | 42.2 |
| d. Undiagnosed | 15.8 | 27.7 | 33.2 | 24.8 | 13.1 | 26.4 | 34.1 | 25.0 | |
| Total diagnosed hypertension (a+c) | 58.4 | 45.9 | 51.7 | 66.3 | 67.1 | 52.9 | 51.5 | 67.1 | |
| Total hypertensives (a+b+c) | 84.2 | 72.3 | 66.9 | 75.2 | 86.9 | 73.6 | 66.0 | 75.0 | |
| % Undiagnosed among hypertensives | 30.7 | 36.5 | 22.6 | 11.9 | 22.9 | 28.1 | 21.8 | 10.6 | |
| % Undiagnosed among total population | 25.9 | 26.4 | 15.1 | 8.9 | 19.9 | 20.7 | 14.4 | 7.9 | |
self-report of ever having been diagnosed by a doctor as having hypertension. Beneath this two-by-two categorization, we include rows that indicate fraction of the population that has self-reported being hypertensive and the fraction that is hypertensive either by diagnosis or by survey measurement. Finally, we include rows at the bottom of the table documenting the percentage of all hypertensives who are undiagnosed and the fraction of the total population in the relevant age groups who are diagnosed.
Table 12-4 provides separate estimates by two age groups (55–65 and 66+) and by gender. Self-reported hypertension (i.e., positive response to the “ever diagnosed” question) provides an incomplete and often misleading picture. Using men ages 55–65 to illustrate, “ever-diagnosed” hypertension gives U.S. men much higher rates of hypertension than men in the same age group in other countries. Self-reported hypertension in this age group is 53 percent among U.S. men compared to 49 percent among German men and 38 and 34 percent among English men and Irish men. If instead we examine the more complete hypertension rates in this age group that includes the undiagnosed (the “total hypertensives” row in the upper section of Table 12-4), Germany now easily leads the way with 75 percent hypertensive compared to 63 percent in both Ireland and the United States and 53 percent in England.
Undiagnosed hypertension is prevalent in all countries (especially in Germany and Ireland) both as a fraction of all hypertensives and as a fraction of total age group. American men in the 55–65 age group have the lowest fraction of undiagnosed hypertension relative to both the population (11%) and all hypertensives (17%). The flip side is that many people who had previously been diagnosed by a doctor as hypertensive have measured blood pressure levels now below the established diagnosis thresholds, an indication that they are exercising good control of their hypertension. We find similar patterns for women ages 55–65 and for both genders in those 65+.
These concepts, which require both testing for hypertension and self-reports of ever diagnosed, are important in evaluating the health of populations as well as in making comparisons across countries. The extent of undiagnosed disease and the ability to control hypertension after it gets too high are equally important as indicators of the health care system as is the extent of the disease. Most importantly, as we said at the beginning of this section, hypertension is just one example of the need for biomarkers. A set of tables parallel to Table 12-4 could be constructed for all salient diseases of middle and old age including diabetes, cancer, and heart disease.
There is recognition within the HRS high-income countries of a high value of biomarker data to supplement self-reports. There is also the current reality that most of the studies in the high-income HRS network do not
now contain such biomarker data available to researchers.8,9 The reason is the equally recognized high cost of collecting biomarker data in population-based longitudinal surveys at the national level, whether by direct measurement, such as measuring hypertension, or even more costly by collecting and assaying blood through either dry blood spots or venous blood. Compared to self-reports, collecting biomarkers is much more expensive, especially with the eventual necessity of doing repeated measurement. The sensible response to this by the HRS around the world surveys has been to collect biomarkers at a reduced periodicity relative to the normal self-report frequency (for example every other wave), especially for younger respondents in the survey, for whom biomarkers do not change as rapidly over time. Another recent response by the Mexican and Chinese surveys has been to reduce the periodicity of the main survey to achieve sustainable long-term costs. The other surveys in the network are attempting to collect relevant biomarker data, so the situation is about to improve a great deal with respect to having biomarkers in the high-income HRS around the world surveys.
HEALTH BEHAVIORS ACROSS COUNTRY AND YEAR
Before discussing international differences in health behaviors, we first examine long-term changes in these behaviors in the United States. Table 12-5 documents long-term changes in key health behaviors by education over time for non-Hispanic Whites between ages 40 and 64. The behaviors are current smoking, obesity, vigorous exercise, height in inches, and percentage without any health insurance. The first four behaviors are obtained from waves of the National Health and Nutrition Examination Survey (NHANES) and update results obtained by Goldman and Smith (2011), while health insurance data are obtained from the National Health Interview Survey (NHIS). The data are stratified into three education groups: low (0–11 years of schooling), middle (12 years of schooling), and high (13 or more years of schooling).
The best news in health behaviors is the significant long-term decline in smoking, but even for smoking the low-education group did not participate, as their smoking rates have been rising. Moreover, the pace of the American smoking decline has clearly slowed for all education groups since 2002. In contrast, the worst news on the behavior front is a substantial rise in obesity that characterizes all education groups. Obesity has continued to rise unabated in recent decades. The vigorous exercise questions refer to
___________________
8 The high-income countries that do not currently measure hypertension are all SHARE countries except Germany, plus Japan and Korea. The countries that do not measure other biomarkers are all SHARE countries, Japan, and Korea.
9 The large low-income countries in the HRS network of studies are doing a better job collecting biomarker data. Brazil (ELSIE), China (CHARLS), India (LASI), and Indonesia (IFLS) all collect biomarker data.
TABLE 12-5 Health Behaviors by Education and Year, USA Non-Hispanic Whites, Ages 40–64, Education
| Low | Middle | High | All | |
|---|---|---|---|---|
| A. Current Smoking (%) | ||||
| ∆ 1976–2002 | 10.9 | –4.4 | –15.0 | –11.4 |
| 4.0 | –0.1 | 1.2 | –0.3 | |
| ∆ 2002–2014 | 14.9 | –4.5 | –13.8 | –11.7 |
| B. Obesity (% obese) | ||||
| ∆ 1976–2002 | 21.4 | 17.6 | 15.7 | 14.8 |
| ∆ 2002–2014 | 2.6 | 7.6 | 8.7 | 7.4 |
| ∆ 1976–2002 | 24.0 | 25.2 | 24.4 | 22.2 |
| C. Vigorous Exercise (%) | ||||
| ∆ 1976–2002 | 3.0 | 11.0 | 27.8 | 21.2 |
| ∆ 2002–2014 | 10.8 | 14.7 | –5.6 | 1.8 |
| ∆ 1976–2002 | 13.8 | 25.7 | 22.2 | 22.9 |
| D. Height (inches) | ||||
| ∆ 1976–2002 | 0.5 | 1.2 | 0.7 | 1.2 |
| ∆ 2002–2014 | 0.6 | –0.4 | –0.4 | –0.2 |
| ∆ 1976–2002 | 1.1 | 0.3 | 0.3 | 1.0 |
| E. Without Health Insurance (%) | ||||
| ∆ 1980–2012 | 13.9 | 7.9 | 0.6 | 4.1 |
| ∆ 2012–2015 | –12.7 | –6.2 | –2.0 | –5.6 |
| ∆ 1980–2015 | 1.2 | 1.7 | –1.4 | –1.5 |
SOURCES: Smoking, obesity, exercise, and height data obtained from various waves of NHANES. Health insurance data are from various waves of NHIS.
both recreation and work, and unfortunately the exact question changes somewhat between the surveys. But the general trend, which is documented as well in other studies, is that the groups with more education conduct more vigorous exercise. There has been no real change in height over time for any of the education groups, so the apparent health-protective effect of height is not likely to be a significant factor.
The final factor we examine is the fraction of this age group in the American population without any health insurance. The data show two distinct trends, especially for the less educated. Between 1980 and 2012, the fraction of the population ages 40–64 without health insurance was
increasing, especially for the less educated, for whom the fraction without insurance rose by about 14 percentage points. With the passage of the Affordable Care Act, that trend reversed with a significant increase in health insurance in the population—an increase that largely reversed the decline that had taken place in the previous three decades.
Table 12-6 documents well-established salient health behaviors (ever and current smoking, binge drinking, vigorous exercise, and obesity) using our high-income set of HRS around the world surveys. “Smoke Ever” is the percentage answering “yes” to a question of whether the respondent had ever smoked tobacco, while “Smoke Now” is the percentage currently smoking tobacco. The format of Table 12-6 parallels that of Table 12-2 as it highlights prevalence of these behaviors in 2006 and 2012 for men and women in two age groups: 55–65 and 66+.
Though all these surveys aim to measure the same behaviors, it is important to remember that there are some differences in the way the questions were asked. To illustrate, the category of “Smoke Ever” in general indicates whether the respondent ever regularly smoked, but the particular formulation of the question varies somewhat across the surveys.10 Similarly, the concept of “smoked now” in general indicates if the respondent currently smokes.11 The questions across the surveys vary in which forms of tobacco are referred to as being smoked, but cigarettes are always included and the meaning of the word “ever” with some surveys allows short periods of smoking in the past to count as a negative response to the category. While these differences certainly do exist and should be kept in mind, we believe that the smoking data can be safely interpreted as evidence for real smoking differences across countries and over time.
Comparing the data for “Smoke Ever” and “Smoke Now” provides an indication of long-term changes in smoking over time. Among men, current smoking (“Smoke Now”) rates are lowest in Northern Europe, England, and the United States, where the long-term secular smoking decline is also continuing between the years 2006 and 2012. Current smoking rates for males are at their lowest in America, England, and Northern Europe and are much higher in the two high-income Asian countries, Korea and Japan. Those two countries are characterized by the largest differences in gender
___________________
10 SHARE asks if respondent smoked cigarettes, cigars, cigarillos, or a pipe daily for a period of at least 1 year. ELSA asks if respondent ever smoked cigarettes. HRS asks if respondent ever smoked cigarettes (more than 100 in lifetime and does not include pipes or cigars). KLoSA asks if respondent smoked more than 5 packs (100) cigarettes in total. JSTAR asks if respondent regularly smokes or did so in the past.
11 SHARE asks if the respondent smokes at the present time. ELSA asks if the respondent currently smokes cigarettes at all. HRS asks if the respondent smokes cigarettes now. KLoSA asks if the respondent smokes cigarettes now. JSTAR asks if the respondent regularly smokes or did so in the past.
TABLE 12-6 Health Behaviors by Country Group, Age, and Gender, 2006 and 2012
| Smoke Ever | Smoke Now | Binge Drink | Vigorous Exercise 1+/wk | Obese | ||||||
|---|---|---|---|---|---|---|---|---|---|---|
| 2006 | 2012 | 2006 | 2012 | 2006 | 2012 | 2006 | 2012 | 2006 | 2012 | |
| Men Ages 55–65 (%) | ||||||||||
| Central Europe | 66.0 | 64.7 | 25.6 | 26.6 | 10.3 | 8.4 | 60.4 | 61.2 | 19.2 | 22.6 |
| Eastern Europe | 60.3 | 60.5 | 30.1 | 34.8 | 10.3 | 24.0 | 53.1 | 53.1 | 28.5 | 30.9 |
| Northern Europe | 62.5 | 60.4 | 21.1 | 19.0 | 6.8 | 11.8 | 61.1 | 73.9 | 15.9 | 19.3 |
| Southern Europe | 64.8 | 62.1 | 28.6 | 26.7 | 11.4 | 4.3 | 46.0 | 44.6 | 21.4 | 18.4 |
| Japan | 79.9 | 79.3 | 38.5 | 35.1 | 4.5 | 2.8 | — | — | 2.8 | 3.5 |
| Korea | 62.4 | 72.8 | 41.3 | 42.7 | 32.6 | 35.6 | 43.7 | 41.6 | 0.7 | 0.9 |
| England | 69.4 | 65.3 | 17.5 | 16.6 | 29.4 | 13.2 | 35.8 | 39.0 | 29.5 | 33.4 |
| USA | 66.8 | 60.3 | 21.0 | 19.5 | 5.5 | 6.2 | 43.9 | 50.9 | 33.7 | 36.3 |
| Women Ages 55–65 (%) | ||||||||||
| Central Europe | 39.0 | 47.7 | 17.0 | 22.5 | 5.2 | 4.4 | 55.2 | 55.3 | 19.1 | 22.1 |
| Eastern Europe | 46.9 | 46.5 | 26.7 | 30.7 | 6.0 | 12.4 | 40.6 | 37.2 | 26.9 | 30.4 |
| Northern Europe | 57.9 | 60.1 | 25.6 | 19.7 | 7.0 | 6.9 | 51.7 | 63.7 | 15.4 | 16.3 |
| Southern Europe | 30.8 | 38.1 | 15.2 | 18.5 | 5.9 | 2.3 | 42.1 | 39.5 | 22.9 | 17.9 |
| Japan | 16.3 | 21.2 | 9.6 | 9.3 | 1.7 | 1.8 | — | — | 1.8 | 2.5 |
| Korea | 3.0 | 4.0 | 2.6 | 2.5 | 2.4 | 4.6 | 39.3 | 38.0 | 3.4 | 2.2 |
| England | 58.9 | 56.7 | 18.9 | 16.8 | 18.9 | 10.7 | 30.9 | 30.0 | 31.8 | 36.5 |
| USA | 51.6 | 49.3 | 17.3 | 15.2 | 1.3 | 1.8 | 31.4 | 37.8 | 37.0 | 39.7 |
| Men Ages 66+ (%) | ||||||||||
| Central Europe | 59.4 | 63.1 | 12.2 | 13.4 | 5.2 | 4.3 | 41.5 | 43.9 | 15.8 | 18.4 |
| Eastern Europe | 52.5 | 51.6 | 12.8 | 18.9 | 5.0 | 14.7 | 31.5 | 33.9 | 20.5 | 26.7 |
| Northern Europe | 61.5 | 61.5 | 12.8 | 13.8 | 4.5 | 4.7 | 45.0 | 55.0 | 12.3 | 13.7 |
| Southern Europe | 60.7 | 58.6 | 14.5 | 13.5 | 9.9 | 3.8 | 33.8 | 31.4 | 18.5 | 17.2 |
| Japan | 76.8 | 71.5 | 23.5 | 17.6 | 2.7 | 3.0 | — | — | 1.2 | 2.4 |
| Korea | 56.1 | 62.5 | 30.2 | 25.9 | 23.8 | 29.0 | 39.0 | 41.9 | 0.9 | 0.7 |
| England | 75.5 | 75.9 | 11.1 | 8.9 | 13.4 | 6.9 | 23.2 | 26.1 | 24.4 | 26.8 |
| USA | 71.7 | 69.1 | 9.6 | 10.2 | 2.2 | 2.2 | 33.7 | 36.8 | 24.5 | 28.0 |
| Women Ages 66+ (%) | ||||||||||
| Central Europe | 19.3 | 26.7 | 6.9 | 8.6 | 2.3 | 2.4 | 31.4 | 31.5 | 16.7 | 19.7 |
| Eastern Europe | 21.5 | 27.7 | 9.2 | 12.6 | 3.5 | 6.7 | 23.1 | 22.3 | 21.0 | 27.3 |
| Northern Europe | 44.1 | 47.1 | 14.1 | 12.5 | 2.6 | 2.9 | 33.5 | 45.6 | 13.3 | 14.9 |
| Southern Europe | 13.8 | 17.6 | 5.3 | 5.4 | 3.5 | 1.1 | 19.5 | 19.2 | 21.1 | 20.9 |
| Japan | 11.9 | 11.6 | 4.9 | 4.8 | 0.2 | 0.9 | — | — | 1.1 | 3.2 |
| Korea | 5.2 | 4.7 | 4.1 | 2.7 | 2.0 | 3.1 | 23.1 | 25.6 | 2.3 | 1.7 |
| England | 53.6 | 58.1 | 10.0 | 9.1 | 7.5 | 3.5 | 13.8 | 16.8 | 30.1 | 32.0 |
| USA | 46.3 | 48.1 | 8.5 | 8.5 | 0.3 | 0.5 | 20.1 | 27.7 | 25.1 | 28.6 |
NOTES: Data under 2006 are for calendar 2006 except that Japan data are for calendar 2007.
Data under 2012 are calendar 2012 except that Japan data are for calendar 2011.
Central Europe: Austria, Belgium, France, Germany, the Netherlands, Switzerland.
Eastern Europe: Czech Republic.
Northern Europe: Denmark, Sweden.
Southern Europe: Italy, Spain.
SOURCES: Data are from RAND HRS, Harmonized ELSA, Harmonized SHARE, Harmonized JSTAR, Harmonized KLoSA.
smoking because female smoking is almost nonexistent there, whereas male smoking is the highest among the listed high-income countries. Female smoking has risen over time in Southern Europe and the United States. Current smoking rates tend to be significantly lower among those ages 66 and older compared to those ages 55–65, a difference that most likely indicates prior health problems with smoking in the older group.
The second health behavior examined is binge drinking. The definition of “binge drinking” is gender specific; for a man it means five or more drinks at a single occasion, whereas for a woman it means four or more drinks at a single occasion. Those thresholds are applied to the specific questions asked in each survey. Once again, there are operational differences among our surveys on how binge drinking is defined, and these are larger differences than those for smoking.12
The two outliers among these high-income countries that make them simply not comparable in drinking to the other countries are England and South Korea. To illustrate, the U.S. HRS question basically asks for the average number of drinks per day on days the respondent drank, whereas the English ELSA question asks for number of drinks on the day you drank the most. Thus, English respondents would appear to drink more, even if they drank the same as U.S. respondents on average. Similarly, by asking for the maximum amount for each type of alcohol consumed, the South Korean question is not directly comparable to the other HRS-network survey questions.
In Table 12-6, the “Vigorous Exercise 1+/wk” column indicates the percentage of respondents who participated in vigorous exercise one or more times per week. Again, there are significant variations among the HRS high-income countries in how “vigorous exercise” is defined. Variation occurs in what activities are included in exercise (only sports, more activities than sports, heavy housework, respondent’s job).13 However, the
___________________
12 SHARE asks in last 3 months, on days respondent drank, about how many drinks did respondent have. ELSA asks, during the last 7 days how many measures of spirits/glasses of wine/pints of beer, lager or cider did respondent have, then sums all 3 types and divides by the number days (out of the last 7) respondent had an alcoholic drink. HRS asks in last 3 months on days respondent drank, about how many drinks did respondent have. KLoSA asks how many glasses of soju/beer/makgeolli/whisky and other liquors/wine respondent drank at a time, with each type being asked separately. We used the type with the most drinks in the analysis for this report. JSTAR asks how much respondent drank of beer/sake/distilled spirit/wine/other on average per occasion (sum of 3 types).
13 SHARE asks about vigorous physical activity, such as sports, heavy housework, or a job that involves physical labor (more than once a week/once a week). ELSA asks about sports or activities that are vigorous (more than once a week/once a week). HRS asks how often respondent takes part in sports or activities that are vigorous, such as running or jogging, swimming, cycling, aerobics or gym workout, tennis, or digging with a spade or shovel (more than once a week/once a week). KLoSA asks how often respondent works out per week (any value of 1 or greater). No vigorous exercise questions are asked in JSTAR.
problems in comparisons of exercise across countries go beyond the specific questions. In a recent paper, Kapteyn et al. (forthcoming) demonstrate using accelerometers that answers to standard exercise questions are very subjective, with the meaning of “vigorous” varying significantly across countries. Thus, standard self-evaluated exercise questions by themselves are not of much use, and this variability becomes instead a call to the surveys to include objective exercise measures.
“Obese” in Table 12-6 is defined in the conventional way as a BMI of 30 or more and thus is the most straightforward of the health behaviors and is comparable across the surveys and across waves. Japan and Korea stand out with very low levels of obesity for both men and women in both 2006 and 2012, compared to all the other sets of countries in Table 12-6. These low obesity levels, especially in older ages, generally get first-level credit for the good health and low levels of mortality in those two countries. Once again, the United States ranks highest in terms of percentages of obesity among both men and women, and U.S. obesity levels have clearly increased over time. U.S. levels of obesity exceed those of England among ages 55–64, but the reverse is true for those ages 66 and older (Banks et al., 2006, 2010). Within continental Europe, the countries of Northern Europe rank best (lowest percentages) in obesity level, followed by the countries of Central and Southern Europe, with the highest levels of obesity occurring in Eastern Europe.
Given the central role of obesity in health outcomes and its variability among countries and over time, Figure 12-1 plots age-adjusted percentages of obese men and women in many high-income countries, for calendar years 1975 and 2012, using World Health Organization data. The United States had by far the highest obesity rate in 2012 but also the largest percentage-point increase in obesity of these countries, with the U.S. obesity rate almost tripling over this period. The United Kingdom stands next in line in obesity levels and increases over time, but it is no match for the United States. Not surprisingly the two Asian countries have very low levels of obesity and also exhibited virtually no increase over time. In the remaining high-income countries, the percentage increase in the population fraction who are obese matches the increase over time in the United States, but since they started at much lower levels in 1975, 40 years later they still are well below U.S. rates.
In addition to obesity, the other central long-term factor that matters for health outcomes is trends in education, with higher education having been shown to be positively associated with improved health (Goldman and Smith, 2011). Figure 12-2 documents cross-national trends by plotting the fraction of those ages 25–34 and the fraction of those ages 55–64 with tertiary education in 2015. Since education is a cohort variable and does not change much after age 25, this graph is essentially plotting education increases by country over a 30-year period. Japan and Korea have the
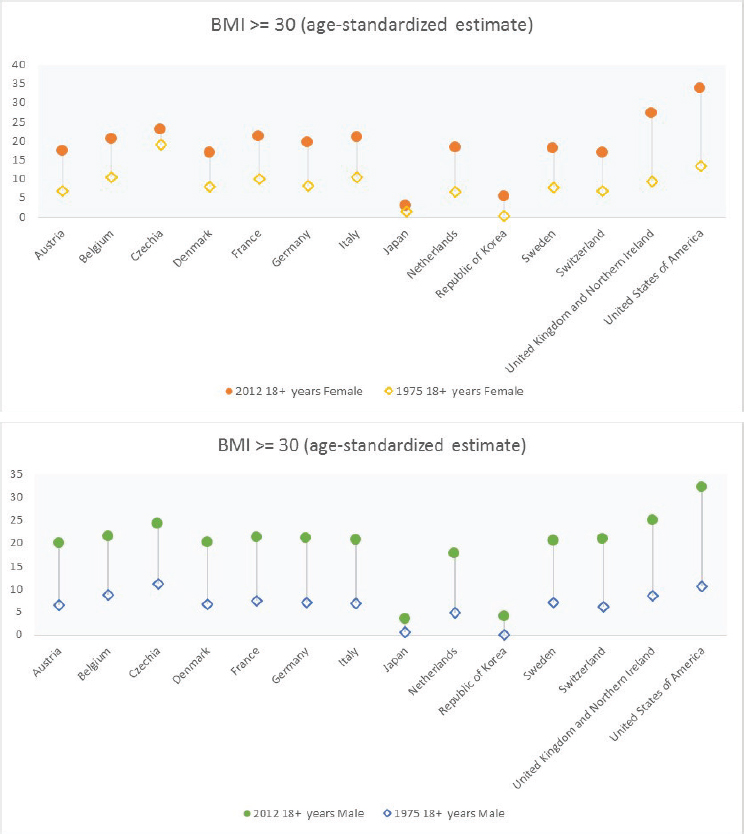
SOURCE: Data are from the World Health Organization.
most impressive time-series experience, and these two countries now rank at the top of this education ladder. In sharp contrast, the United States, which ranked at the top of the education ladder among those ages 55–64, showed very little improvement in education over time and now lies back in the pack among those ages 25–34. Improvements in education over time were also small for Germany, Israel, Estonia, and Finland. The central role that education has played in health improvements over time has important implications for the ranking of countries by their health status.
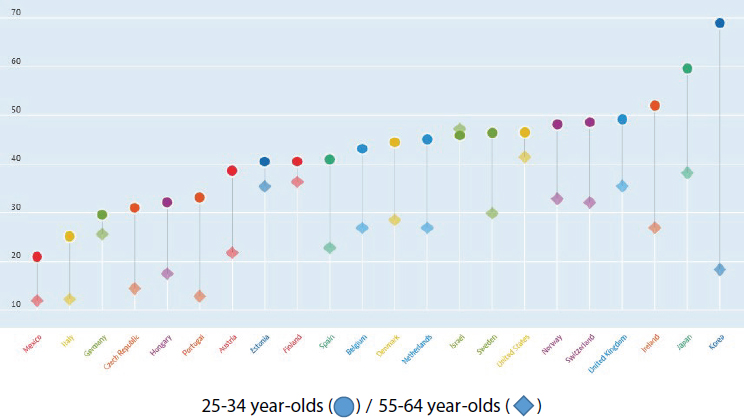
SOURCE: Data are from the OECD chart: Population with tertiary education, ages 25–34, percentage in same age group, annual, 2015. Available: https://data.oecd.org/eduatt/population-with-tertiary-education.htm [April 2018].
The lack of comparability in some health behaviors across the set of high-income countries in the HRS network does raise a question of what can and should be done about the current situation. One response is that questions should be made the same, but that creates the problem that the individual studies will no longer be time series consistent in their own question set over time. This would clearly create a lot of problems for within-country analysis. An alternative strategy that should be explored is to add to each survey a common question that allows researchers to create a correspondence between each survey’s legacy question(s) and the common question. This correspondence could be used to increase comparability.
To assess the pattern of health behaviors across education groups within countries, Table 12-7 displays three health behaviors—current smoking, binge drinking, and obesity—for our set of high-income countries in 2006 and 2012 among those ages 55–64. In the United States, there are very strong negative gradients with increased education in all three behaviors; smoking, binge drinking, and obesity are all highest among those with 0–11 years of schooling. With the exception of drinking, a similar negative gradient is found in England. We found no such gradients in either of our Asian countries (Korea and Japan) and no smoking gradient in Southern Europe. The negative obesity gradient with education characterizes all the parts of continental Europe displayed in Table 12-7. We found similar patterns
TABLE 12-7 Health Behavior by Country/Region, Education Level, and Age Group, 2006 and 2012
| Smoke Now | Binge Drink | Obese | ||||
|---|---|---|---|---|---|---|
| 2006 | 2012 | 2006 | 2012 | 2006 | 2012 | |
| 0–11 Years of Education, Ages 55–65 (%) | ||||||
| Central Europe | 19.3 | 26.1 | 8.3 | 6.6 | 22.9 | 27.0 |
| Eastern Europe | 28.1 | 42.8 | 7.8 | 16.0 | 32.7 | 35.9 |
| Northern Europe | 27.0 | 25.1 | 7.6 | 11.8 | 20.4 | 22.2 |
| Southern Europe | 20.4 | 22.6 | 8.2 | 3.7 | 24.9 | 21.0 |
| Japan | 26.3 | 29.2 | 1.6 | 0.8 | 1.4 | 6.0 |
| Korea | 19.4 | 19.3 | 13.9 | 16.4 | 2.7 | 2.0 |
| England | 25.9 | 21.7 | 21.4 | 11.7 | 37.2 | 44.0 |
| USA | 31.3 | 28.5 | 7.2 | 5.5 | 41.6 | 45.4 |
| 12–15 Years of Education, Ages 55–65 (%) | ||||||
| Central Europe | 23.0 | 25.5 | 7.7 | 6.4 | 17.9 | 20.9 |
| Eastern Europe | 31.1 | 31.6 | 7.0 | 18.6 | 24.5 | 29.6 |
| Northern Europe | 20.4 | 18.0 | 6.1 | 7.4 | 12.2 | 16.7 |
| Southern Europe | 25.3 | 23.4 | 8.0 | 3.0 | 16.1 | 14.0 |
| Japan | 28.6 | 19.5 | 4.2 | 2.1 | 2.5 | 2.7 |
| Korea | 27.4 | 25.3 | 24.3 | 22.8 | 1.1 | 1.3 |
| England | 15.4 | 16.9 | 25.5 | 12.3 | 29.9 | 36.7 |
| USA | 20.9 | 20.6 | 3.1 | 4.8 | 37.7 | 41.0 |
| 16+ Years of Education, Ages 55–65 (%) | ||||||
| Central Europe | 21.7 | 19.0 | 6.1 | 5.5 | 14.6 | 15.9 |
| Eastern Europe | 19.2 | 18.9 | 9.7 | 15.1 | 28.2 | 25.4 |
| Northern Europe | 21.1 | 13.3 | 7.1 | 9.0 | 10.7 | 11.9 |
| Southern Europe | 21.6 | 20.8 | 12.0 | 1.4 | 11.3 | 11.0 |
| Japan | 29.3 | 28.7 | 3.3 | 3.7 | 3.6 | 1.7 |
| Korea | 24.8 | 26.4 | 23.4 | 25.3 | 0.0 | 0.0 |
| England | 8.9 | 8.2 | 28.1 | 10.2 | 21.1 | 23.3 |
| USA | 9.1 | 7.7 | 1.8 | 2.0 | 27.7 | 31.1 |
NOTES: Data under 2006 are for calendar 2006 except that Japan data are for calendar 2007.
Data under 2012 are calendar 2012 except that Japan data are for calendar 2011.
Central Europe: Austria, Belgium, France, Germany, the Netherlands, Switzerland.
Eastern Europe: Czech Republic.
Northern Europe: Denmark, Sweden.
Southern Europe: Italy, Spain.
Binge drinking is defined according to National Institute on Alcoholism and Alcohol Abuse guidelines: Men having 5+ drinks and women having 4+ drinks at a time. HRS, SHARE, JSTAR binge drinking captures an average number of drinks per occasion, while KLoSA and ELSA capture a maximum number of drinks consumed per occasion.
SOURCES: Data are from RAND HRS, Harmonized ELSA, Harmonized SHARE, Harmonized JSTAR, Harmonized KLoSA.
of health behaviors when wealth terciles are used to define the SES gradient. Among potential reasons for the improvement in secular mortality at age 50, the well-documented reduction in smoking over time is almost always assigned a central role (Preston et al., 2010). The slower pace of mortality gains in Denmark, the Netherlands, and the United States has been attributed to the relative increase in levels of female smoking and, for the first two countries, the nonprovision of medical care to the sick elderly (Glei at al., 2010). Increases in education levels in the population are another factor often pointed to in improving health in general and mortality in particular (Goldman and Smith, 2011). As we demonstrate in this paper, secular increases in education in recent decades have been smaller in the United States than in other high-income countries, consistent with the patterns of mortality increases documented in Table 12-2.
This largely good news concerning sustained long-term positive trends in middle-age life expectancy for the United States received an abrupt shock due to recent papers by Anne Case and Angus Deaton (Case and Deaton, 2015, 2017; Montez and Hayward, 2014). In their papers, Case and Deaton documented that mortality among less-educated middle-aged and younger adult non-Hispanic Whites had actually started to increase, a sharp reversal in U.S. secular trends from prior decades. The exact causes of this abrupt mortality change are not yet fully known, but the general deterioration in economic, social, and family life for these middle-age, less-educated non-Hispanic Whites appears to be the most likely reason.
The question we ask is whether this abrupt Case-Deaton change has affected the attitudes and behaviors of current respondents in the HRS surveys. To do so, we examine answers over time to a regular question in the HRS modules asked of younger HRS respondents about whether they expect to live to age 75.14 The answers for survey years between 1992 and 2014 for three education groups (0–11 years, 12–15 years, and 16+ years of education) are contained in Table 12-8.
___________________
14 In addition to HRS, life expectancy questions are also asked in ELSA, SHARE, KLoSA, and JSTAR. Those other surveys show no such deterioration over time.
TABLE 12-8 Men’s Self-Reported Mean Probability of Living to Age 75, by Education Fraction That Expects to Live to Age 75
| Respondent Age | 1992 Mean | 1994 Mean | 1996 Mean | 1998 Mean | 2000 Mean | 2002 Mean | 2004 Mean | 2006 Mean | 2008 Mean | 2010 Mean | 2012 Mean | 2014 Mean |
|---|---|---|---|---|---|---|---|---|---|---|---|---|
| 0–11 Years of Education | ||||||||||||
| 57–59 | 56.7 | 55.9 | 57.5 | 56.1 | 60.8 | 52.8 | 52.9 | 44.4 | 46.4 | 48.5 | 47.8 | 48.2 |
| 60–62 | 54.7 | 58.7 | 56.5 | 59.0 | 56.1 | 52.5 | 51.1 | 54.2 | 53.6 | 47.5 | 39.6 | 37.6 |
| 12–15 Years of Education | ||||||||||||
| 57–59 | 60.1 | 61.8 | 63.7 | 62.6 | 65.0 | 60.4 | 59.5 | 57.1 | 59.6 | 56.9 | 55.2 | 56.9 |
| 60–62 | 65.2 | 62.9 | 62.7 | 63.6 | 66.2 | 65.4 | 60.6 | 57.2 | 60.0 | 55.4 | 58.4 | 58.3 |
| 16+ Years of Education | ||||||||||||
| 57–59 | 67.5 | 67.7 | 69.8 | 68.5 | 70.3 | 71.5 | 67.3 | 68.4 | 70.6 | 67.9 | 65.9 | 66.7 |
| 60–62 | 69.5 | 69.8 | 71.7 | 70.4 | 70.0 | 69.2 | 69.1 | 68.0 | 70.5 | 66.2 | 66.8 | 66.3 |
SOURCE: Data are from RAND HRS.
The data indicate that current less-educated younger respondents in the HRS are now expressing that they expect to live fewer years in the future than their similarly aged counterparts expected when they were the same age, at the time HRS began. To illustrate, in HRS’s initial year of 1992, among those ages 57–59 with 0–11 years of schooling, 57 percent expected to live to age 75. The comparable number for the same demographic group in 2014 was 48 percent, a decline that started around the year 2000. If instead we take the highest education group in the table—those with at least a college education—the comparable numbers were 68 percent in 1992 and 67 percent in 2014. The general pattern is easy to summarize: longer life expectancies for the more educated and a growing disparity in life expectancies by education.
The value of such data in the HRS set of surveys is possibly twofold. The first is that we can confirm that the Case-Deaton documentation of mortality trends is now built into the expectations of respondents and should be shaping their future behaviors in savings behavior and wealth decumulation, at a minimum. Improvements in health of these birth cohorts should also then be reflected in these life expectancy questions in future HRS waves. Second, and perhaps more important, we can use HRS-type data to model the changes in remaining years of life, thereby documenting the possible causes of the decline in life expectancy in these groups.
There are certainly legitimate concerns about the use of subjective probability data for this analysis and reasons for caution in its application. For example, these data are known to be characterized by considerable heaping at values of 0, 50, and 100 percent, and there remains some dispute about the precise nature of the mortality trends (Sasson, 2016). However, these subjective probabilities of future life expectancy have been shown to predict future mortality and to also predict future changes in behaviors such as retirement and social security claiming (Hurd, 2009). If the recent subjective probability data in the HRS can be further validated, it would become a valuable tool for analysis of the causes and consequences of these important recent mortality trends.
EARLY LIFE EFFECTS ON LATER LIFE OUTCOMES
A growing literature has demonstrated that there are strong influences of events in childhood and adult life before age 50 on later life paths and levels of health (Caspi et al., 1998; Currie, 2009; Goodman et al., 2011; Hayward and Gorman, 2004; Smith and Smith, 2010). These robust findings highlight a potential limitation of studies, such as the HRS around the world surveys that often begin around age 50. Many of the key determinants of later-life age transitions in health take place at much younger ages.
The existence of specific physical and especially mental health diseases in earlier life needs to be identified alongside a list of events and relationships that are associated with these illnesses. In response to this concern, several of the HRS surveys including ELSA, SHARE, and HRS (in process) have added material on early life. The most extensive surveys consist of life history modules, which have been very important and successful additions. In particular, the life history module in SHARE, which is called SHARE LIFE and was fielded as the third wave of SHARE, documented the interactions of respondents in all SHARE countries with the rich and varied history of the respondent’s country at the individual and state levels. These SHARE life histories included impacts of World War II (Kesternich et al., 2014), the political transitions made by many of these European countries, economic recessions and depressions, and changes in the availability of schools and the economic and education status of parents. At the individual level, the histories include information about the circumstances in parental households and in schools. The SHARE surveys are planning on including life histories in their future new countries in SHARE.
Once again, in these early-life diseases the United States leads the way among the HRS-network high-income countries, with higher reported levels of these childhood illnesses than the other countries report. England places a solid second. The general reporting of childhood psychological problems in these surveys indicates that childhood psychological problems have actually been increasing over time and present large challenges to individuals’ adult health and economic status throughout their subsequent adult lives. These problems have been particularly severe in the United States but are not confined to the United States (Goodman et al., 2011; Smith and Smith, 2010).
CONCLUSIONS
In this paper, we summarized information available from the high-income countries that are participating in the network of HRS around the world surveys. The data point to several salient facts about the aging process in these countries. First, there is significant variation in health status outcomes among these countries, with the United States ranking poorly both in terms of current health status and in changes in health status over time. Following the United States, countries of Eastern Europe rank second in terms of disease prevalence, England is in third place, and Central and Northern Europe are performing the best in terms of health outcomes. We also find a strong social gradient in health status by our two markers of SES—years of education and terciles of wealth—with apparently stronger gradients in the United States compared to the other high-income countries.
We also examined health behaviors that might underlie these health status differences and changes in health levels over time. Not all the
health behavior measures are comparable across these high-income HRS-network surveys. Among those that are comparable, the best news comes from the decline in smoking for all but the least educated group. In the United States, at least, the decline in smoking has slowed considerably in the last decade. With the exception of the Asian countries (Korea and Japan), the worst news is the continuing rise without interruption in levels of obesity in these high-income countries.
There is great variety in trends in these high-income countries in another trait associated with good health: years of education. The increase in education levels over time has continued unabated in many of the high-income countries, especially in Asia, but decidedly not in the United States. The latter condition no doubt contributes to the lack of much improvement in health in the United States. We also find that younger cohorts in the current U.S. HRS datasets are already anticipating shorter remaining years of life, a reflection of the now well-documented Case-Deaton effect. With appropriate new modules, the HRS network of surveys will become an important vehicle for analyses of the reasons for the increase in mortality of less-educated Americans, as well as for predicting and tracking the behavioral adjustments they are making to this new reality.
REFERENCES
Avendano, M., Glymour, M., Banks, J., and Mackenbach, J.P. (2009). Health disadvantage in U.S. adults aged 50 to 74 years: A comparison of the health of rich and poor Americans with that of Europeans. American Journal of Public Health, 99(3), 540–548.
Banks, J., Marmot, M., Oldfield, Z., and Smith, J.P. (2006). Disease and disadvantage in the United States and in England. Journal of the American Medical Association, 295(17), 2037–2045.
Banks, J., Muriel, A., and Smith, J.P. (2010). Disease prevalence, disease incidence, and mortality in the United States and in England. Demography, 47(Suppl), S211–S231.
Case, A., and Deaton, A. (2015). Rising mortality and mortality in midlife among white non-Hispanic Americans in the 21st century. Proceedings of the National Academy of Sciences of the United States of America, 112(49), 15078–15083. doi: 10.1073/pnas.1518393112.
Case, A., and Deaton, A. (2017, March 20). Mortality and Morbidity in the 21st Century. Brookings Papers on Economic Activity. Available: https://www.brookings.edu/wp-content/uploads/2017/08/casetextsp17bpea.pdf [April 2018].
Caspi, A., Moffitt, T.E., Wright, B.R.E., and Suva, P.A. (1998). Early failure in the labor market: Childhood and adolescent predictors of unemployment in the transition to adulthood. American Sociological Review, 63(3), 424–451.
Currie, J. (2009). Healthy, wealthy, and wise? Socioeconomic status, poor health in childhood, and human capital development. Journal of Economic Literature, 47(1), 87–122.
Dobrescu, L.I., and Smith, J.P. (2016). The HRS around the world surveys. In J. Piggott and A. Woodword (Eds.), Economics of Population Ageing Handbook (vol. B, part V, Ch. 17, pp. 993–1018). Amsterdam, Netherlands: Elsevier.
Glei, D., Mesle, F., and Vallin, J. (2010). Diverging trends in life expectancy at age 50; A look at causes of death. In E. Crimmins, S. Preston, and B. Cohen (Eds.), International Differences in Mortality at Older Ages—Dimensions and Sources (pp. 17–67). Washington, DC: The National Academies Press.
Goldman, D., and Smith, J.P. (2011). The increasing value of education to health. Social Science and Medicine, 72(10), 1728–1737.
Goodman, A., Joyce, R., and Smith, J.P. (2011). The long shadow cast by childhood physical and mental problems on adult life. Proceedings of the National Academy of Sciences of the United States of America, 1108(15), 6032–6037.
Hayward, M.D., and Gorman, B.K. (2004). The long arm of childhood: The influence of early-life social conditions on men’s mortality. Demography, 41, 87–107.
Hurd, M.D. (2009). Subjective probabilities in household surveys. Annual Review of Economics, 1, 543–562. doi: 10.1146/annurev.economics.050708.142955.
Kapteyn, A., Banks, J., Hamer, M., Smith, J.P., Steptoe, A., Van Soest, A., and Saw, H.W. (forthcoming). What they say and what they do: Comparing physical activity across U.S., England, and the Netherlands. Journal of Epidemiology and Community Health.
Kesternich, I., Siflinger, B., Smith, J.P., and Winter, J. (2014). The effects of World War II on economic and health outcomes across Europe. The Review of Economics and Statistics, 96(1), 103–118.
Montez, J.K., and Hayward, M. (2014). Cumulative childhood adversity, educational attainment, and active life expectancy among U.S. adults. Demography, 51(2), 413–435.
Preston, S., Glei, D., Wilmoth, J.R. (2010). Contribution of smoking to international differences in life expectancy. In E. Crimmins, S. Preston, and B. Cohen (Eds.), International Differences in Mortality at Older Ages—Dimensions and Sources (pp. 105–131). Washington, DC: The National Academies Press.
Sasson, I. (2016). Diverging trends in cause-specific mortality and life years lost by educational attainment: Evidence from United States Vital Statistics Data, 1990–2010. PLoS One 11(10). doi: 10.1371/journal.pone.0163412.
Smith, J.P. (2004). Unraveling the SES–health connection. Population and Development Review Supplement: Aging, Health and Public Policy, 30, 108–132.
Smith, J.P., and Smith, G.C. (2010). Long-term economic costs of psychological problems during childhood. Social Science and Medicine, 71(1), 110–115.


