
Appendix E
Coal Mining in the United States
HISTORICAL PERSPECTIVE
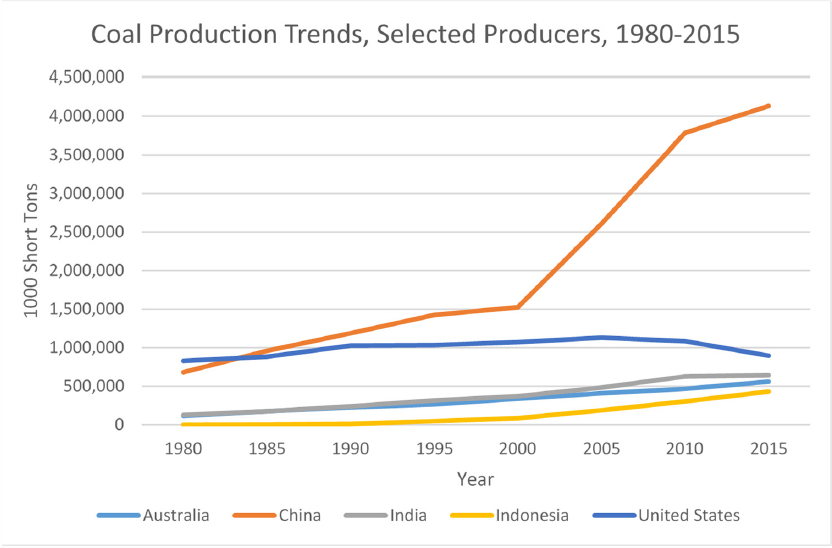
Coal is widely distributed around the world and the United States has approximately 21 percent of the world’s coal resources (EIA, 2014). The coal industry in the United States is mature, tracing its origin to the first commercial exploitation of coal in the Manakin area, near Richmond, Virginia, in 1701. By 1760, most of the colonies knew about the existence of coal fields within their borders, but very little had been done to exploit them (Lasson, 1972). Anthracite coal mining started around 1775 in northeastern Pennsylvania and, by the late 1700s, coal was mined in Mount Washington, in Pittsburgh. Soon thereafter, coal mining started in Ohio, Illinois, and other states.
From this modest beginning, U.S. coal mining grew enormously to 26 states and nearly a billion tons of production per year by 2000 (see Figure E-1). Anthracite coal production reached its highest level (more than 100 million tons) in 1917. By 1987, anthracite coal production dropped to about 5 million tons, and only about 600,000 tons were produced from mining anthracite seams.
The health and safety regulations of the coal mining industry by the states were introduced almost a century after the start of mining in Pennsylvania, with the enactment of the Pennsylvania [Anthracite] Mine Inspection Act in 1869 (for anthracite coal) and the Pennsylvania Mine Inspection Act in 1877 (for bituminous coal). Mining laws also were proposed in several other states, for example, Illinois in 1872 and Ohio in 1874. Regarding federal health and safety legislation, the Federal Coal Mine Inspection Act was enacted in 1941 and the Federal Coal Mine Safety Act was enacted in 1952. The passage of the Federal Coal Mine Health and Safety Act of 1969 represented a significant departure from tradition in that the enforcement of federal health and safety standards were to be performed by an agency of the federal government, the Mine Safety and Health Administration (MSHA), regardless of the extent and quality of the state programs. The Federal Mine Safety and Health Act was enacted in 1977 and the Mine Improvement and New Emergency Response Act was enacted in 2006.
At the federal level, mine health and safety research was conducted initially by the U.S. Geological Survey and later by the U.S. Bureau of Mines, from the time when the bureau was created in 1910 to 1995 when it was abolished. From 1997 onwards, the National Institute for Occupational Safety and Health has been the federal agency with research responsibility.
PRODUCTION
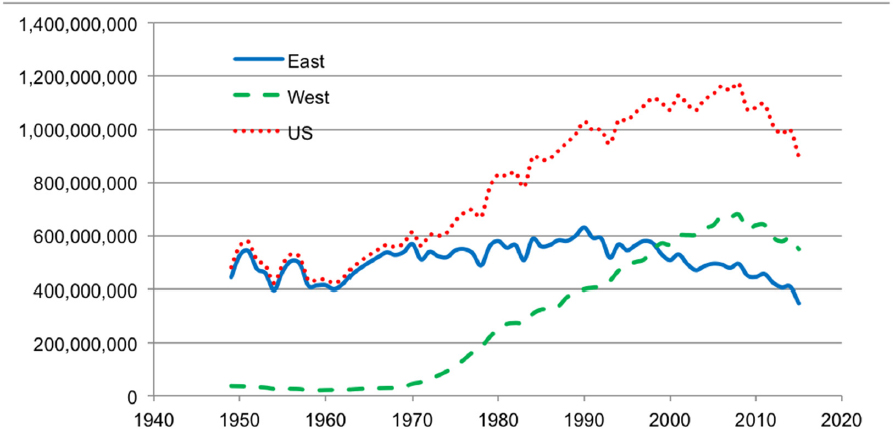
In 2017, coal was mined in 25 states, both east and west of the Mississippi River. While U.S. production has been rising from about 1960, the production from areas west of the Mississippi exhibited steep growth from the 1970s (Figure E-2). Coal production reached a high of 1,172 million tons in 2008. The production in 2016 was the lowest in recent years, 728 million tons (EIA, 2017).
Historically, the dominant production by state occurred in Kentucky, West Virginia, Pennsylvania, Illinois, Indiana, and Ohio in the eastern United States and in Colorado, Utah, North Dakota, Texas, and, more recently, Wyoming and Montana, in the west. Production from eastern states exhibited a decline that began in the 1990s and grew steeper after the turn of the century.
DISTRIBUTION OF PRODUCTION BY RANK OF COAL
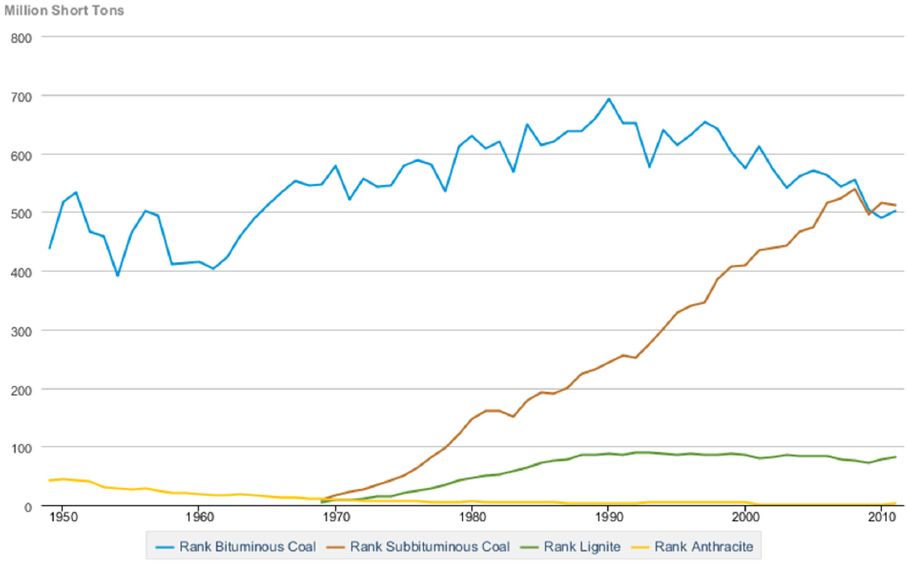
Depending on the duration, temperature, and pressure that the vegetative matter had been subjected to during the coalification process, the rank of mined coal is classified into ranks (categories) of anthracite (97 to 86 percent carbon), bituminous (85 to 46 percent carbon), subbituminous (45 to 34 percent carbon), and lignite (33 to 25 percent carbon). The distribution of U.S. coal production by rank is shown in Figure E-3. Although mines in northeastern Pennsylvania at one time produced about 100 million tons of anthracite coal per year, at the present time, there is very little anthracite coal production. Lignite is mostly produced in Texas and North Dakota and accounts for about 10 percent of coal production. With increasing production from states west of the Mississippi, the production of subbituminous coal has increased greatly and at present just exceeds the production of bituminous coal. Because of their lower energy content, subbituminous and lignite coals represent a smaller proportion of energy production, relative to bituminous coal.
DISTRIBUTION OF PRODUCTION BY METHOD OF MINING
The two major methods of mining coal are surface mining and underground mining. A generalized schematic illustration of the two methods is shown in Figure E-4.
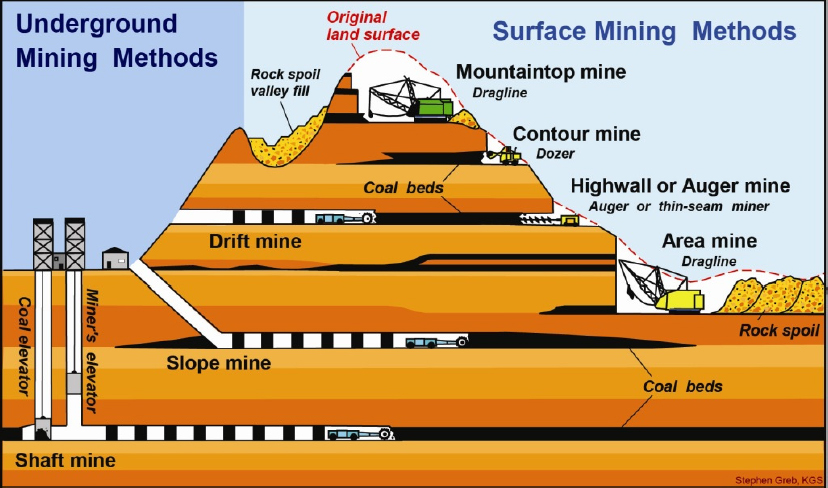
In surface mining, soil and rock over the coal seam are removed to expose the coal seam. After the coal seam is fragmented and removed, the void can be filled with the previously removed rock and topped with soil and revegetated. The activities of drilling, blasting, loading, and hauling all require detailed planning and design for a safe operation. Depending on the conditions of the coal deposit, a variety of surface mining methods can be used, with regard to type of equipment and how it is deployed for removing the overlying materials and the coal seam.
Where surface mining is not feasible, underground mining of the coal seam is generally conducted. The coal is accessed by suitable openings from the surface (referred to as shafts, slopes, or drifts). From these openings, the seam is developed through a network of roadways (referred to as entries and cross-cuts) separated by blocks of coal pillars. The pillars may be extracted in sequence at a predetermined time.
The infrastructure required for transporting miners, supplies, and mined coal, and for supplying ventilating air and utilities (such as power and water), is a major aspect of mine planning and design to ensure a safe operation. In contrast to surface mining, underground mining is conducted in a confined geologic medium and presents a number of unique challenges arising from factors such as strata pressure, gas liberation, and airborne dust. Often, when mining thin coal seams, the section of strata that is mined can include portions of roof, floor, or both to ensure adequate head room for miners and equipment. In some cases, the coal seam itself will contain partings of shale or clay materials, veins, or dykes, which are mined along with coal.
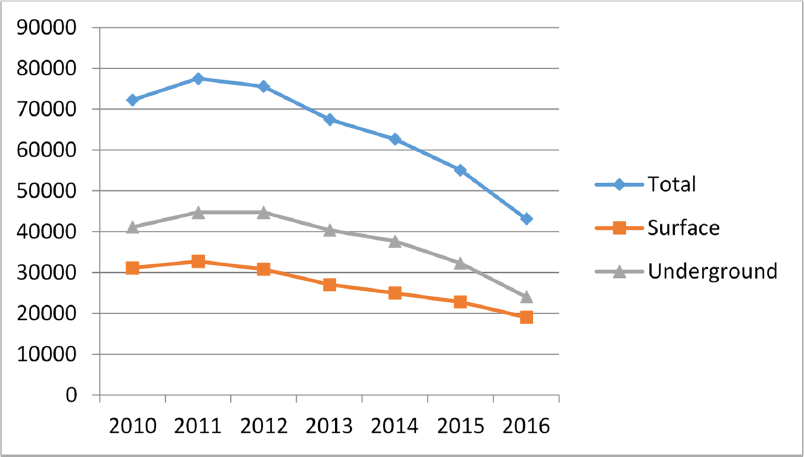
Surface mining’s share of coal production in the United Stateswas about 66 percent in 2015. In absolute terms, the surface coal production in 2015 was 589 million tons, representing greater than a fourfold increase relative to the 139 million tons production in 1950 (EIA, 2012; NMA, 2017). As shown in Figure E-5, in recent years, the decline in production appears to have been similar for the surface and underground sectors.
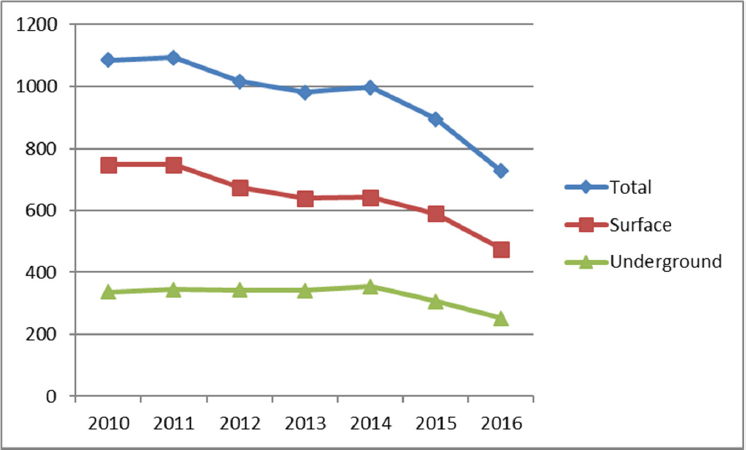
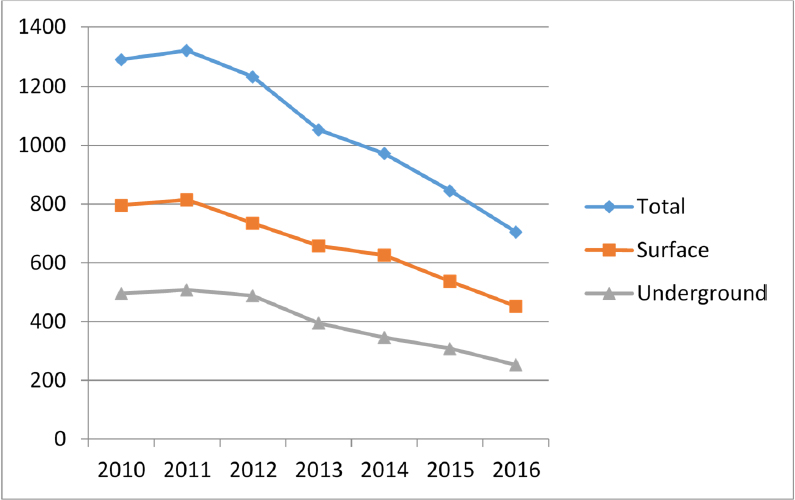
NUMBER OF MINES AND EMPLOYMENT
The trends toward increased surface mining, increased production and productivity using new technology, consolidation of the mining companies, and closure of smaller operations have contributed over the years to a continuous decline in the number of mines and the number of miners employed in those mines. Variations in those statistics are affected by variations in the geologic aspects of coal deposits in different locations in the United States, coal quality, and differences in mining conditions. Those factors also affect the selection of mining methods and their implementation. Historically, the states of Kentucky, West Virginia, Virginia, and Pennsylvania accounted for a large number of small underground and surface mines, while accounting for a small percent of the total production.
In 1980, coal production was 830 million tons, the total number of coal mines was greater than 5,200 (with underground mines numbering more than 2,400 and surface mines more than 2,800), and the total employment in coal mining was about 215,000. In 2005, coal production was more than 1,100 million tons (33 percent higher than in 1980), with 70 percent fewer mines (1,600 mines total, 650 underground mines, and 950 surface mines) and with 50 percent fewer miners (105,000) (MSHA, 2017a). Recent data on number of mines and the number of miners employed in these mines are shown in Figures E-6 and E-7, respectively, for the years 2010 to 2016. The figures show a more dramatic drop in both the number of mines and employment.
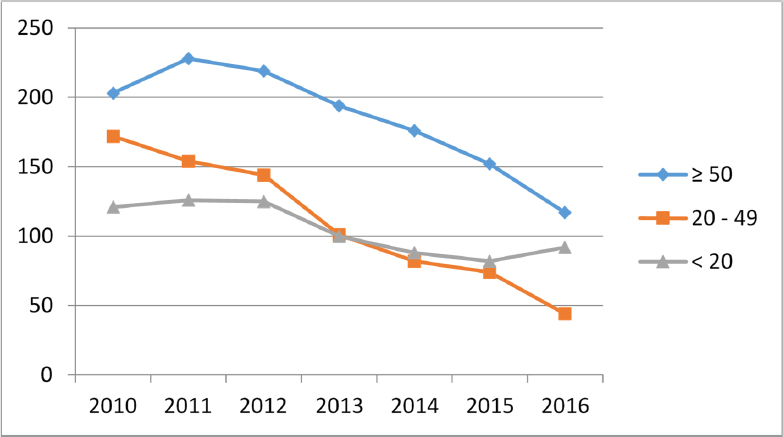
NUMBER OF SMALL UNDERGROUND MINES
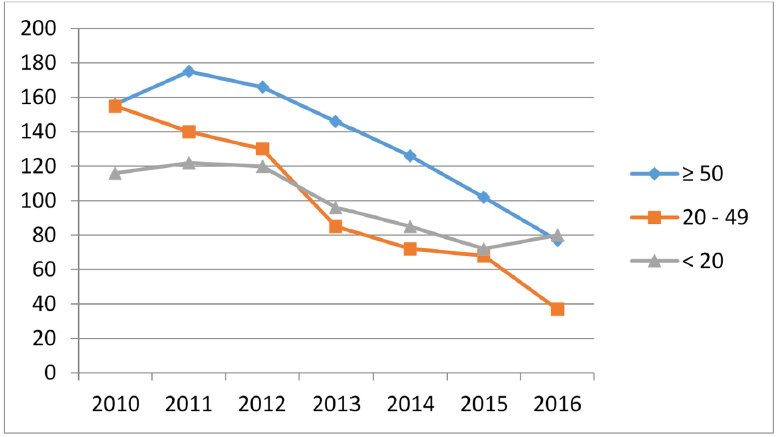
Mention has been made of the large number of small mines in the states of Kentucky, West Virginia, Virginia, and Pennsylvania. Figures E-8 and E-9 show the distributions of underground coal mines in the United States by the number of miners employed (more than 50 miners, 20-49 miners, and fewer than 20 miners), and in the four states combined.
SUMMARY
In considering issues concerning the coal industry in the United States, it is important to recognize the diverse and variable nature of the industry in terms of the location of the major operations, distributions of coal production by regions and mining methods, mine size, number of mines, and numbers of miners.
REFERENCES
EIA (U.S. Energy Information Administration). 2012. Annual Energy Review 2011. Table 7.2 Coal Production, 1949-2011 (Million Short Tons) [online]. Available at https://www.eia.gov/totalenergy/data/annual/showtext.php?t=ptb0702 (accessed December 22, 2017).
EIA. 2014. Coal Recoverable Reserves 2014 [online]. Available at https://www.eia.gov/beta/international/rankings/#?cy=2014&aid=6&pid=1 (accessed December 22, 2017).
EIA. 2016. International Energy Statistics [online]. Available at https://www.eia.gov/beta/international/data/broswer (accessed May 15, 2018).
EIA. 2017. U.S. Coal Production by State, 2005-2016 (Thousand Short Tons). National Mining Association [online]. Available at https://nma.org/wp-content/uploads/2016/11/coal_production_by_state_2016p.pdf (accessed July 10, 2017).
KGS (Kentucky Geological Survey). 2018. Coal Mining [online]. Available at http://www.uky.edu/KGS/coal/coal-mining.php# (accessed May 16, 2018).
Kolstad, C. D. 2017. What Is Killing the U.S. Coal Industry? Stanford Institute for Economic Policy Research Policy Brief May 2017 [online]. Available at https://siepr.stanford.edu/research/publications/what-killing-us-coal-industry (accessed July 10, 2017).
Lasson, K. 1972. A history of Appalachian coal mines. In Legal Problems of Coal Mine Reclamation: A Study in Maryland, Ohio, Pennsylvania and West Virginia. Washington, DC: U.S. Government Printing Office, pp. 3-18 [online]. Available at http://scholarworks.law.ubalt.edu/all_fac/794/ (accessed November 17, 2017).
MSHA (Mine Safety and Health Administration). 2017a. Coal Mining Data: Average Number of Employees at Coal Mines in the United States, by Primary Activity, 1978-2007 [online]. Available at https://arlweb.msha.gov/STATS/PART50/WQ/1978/wq78cl03.asp (accessed November 17, 2017).
MSHA. 2017b. Employment/Production Data Set. Online. Available at https://arlweb.msha.gov/OpenGovernmentData/OGIMSHA.asp (accessed November 17, 2017).
NMA (National Mining Association). 2017. U.S. Coal Production Trends, 1980-2016 (Million Short Tons). Available at https://nma.org/wp-content/uploads/2017/06/us_coal_production_trends_2016-2.pdf (accessed December 22, 2017).


