
CHAPTER 5
TOOLS FOR DECISION MAKING
INTRODUCTION
This chapter examines the response trade-off decision-making tools that were introduced briefly in Chapter 1. These decision-making tools are often used to compare and assess the benefits and drawbacks of various oil spill response options, and ultimately, they rely on an understanding of the fate of oil in the environment (see Chapter 2), the toxicity of dispersants and dispersed oil (see Chapter 3), and the potential human health consequences (see Chapter 4).
The response options considered for marine spills include surface and/or subsea dispersant, mechanical recovery, in situ burning, shoreline clean-up, protective booming, and natural attenuation. Often these response options are used in combination to effectively mount a comprehensive spill response.
“As the potential use of dispersants is expanded into nearshore, estuarine, and perhaps even freshwater systems, the trade-offs become even more complex” (NRC, 2005). While this is a true statement, the primary focus of dispersant use will continue to be for offshore oil spills in the marine environment where dilution can play a large part in mitigating potential negative effects. Although this chapter focuses on offshore marine environments, work has also been done on the use of dispersants in nearshore and coastal locations, and it is possible that there will be special cases where dispersant use could be valuable.
As discussed in Chapter 3, the toxicity of oil to marine organisms depends on the exposure of organisms to oil and the water-soluble compounds from the oil. The extent of toxicity depends on the exposure route, the concentration of the oil, and the duration of exposure. Water-soluble chemical compounds like aromatic hydrocarbons (components of crude oils) are typically more highly toxic to marine organisms (Di Toro et al., 2007) than are low-solubility compounds (e.g., most alkanes and cycloalkanes).
When dispersants are applied to treat floating oil, small oil droplets are dispersed into the upper water column. Surface oils will rapidly dilute if water depth allows (Bejarano et al., 2013). Marine organisms living within a few meters of the sea surface will therefore experience an increased exposure to oil (Singer et al., 1998), with the toxicity depending on the exposure duration (Bejarano
et al., 2014b; Sterling et al., 2003). In the case of subsurface spills like a blowout or pipeline leak, dispersants may be injected at the seafloor. This will increase oil concentrations near the source but tend to decrease them further afield, especially at the surface. Marine organisms in the lower water column will be exposed to an initial increase of water-soluble oil compounds that will dilute in the water column over time (Lee et al., 2013a).
Dispersant application involves a trade-off between decreasing the risk to the surface and shoreline habitat and increasing the risk beneath the surface. The optimal trade-off must account for various factors, including the type of oil spilled, the spill volume, the weather and sea state, the water depth, the degree of turbulence, and the relative abundance and life stages of organisms (NRC, 2005).
Chemical dispersants may increase the risk of toxicity to subsurface organisms by increasing bioavailability of the oil. The reader is referred to Chapter 3 for a detailed discussion of oil and dispersed oil toxicity. However, it is important to note that at the 1:20 dispersant-to-oil ratio (DOR) recommended for use during response operations, the dispersants currently approved for use are far less acutely toxic than oil is. Toxicity of chemically dispersed oil is primarily due to the oil itself and its enhanced bioavailability (Lee et al., 2015).
As discussed, dispersants are considered a potential response tool in many countries. Different decision-making processes are used to determine whether to proceed with dispersant application, but, typically, a list of dispersants that may be applied is developed along with an approval process for their actual use. See Chapter 7 for further discussion.
DECISION-MAKING TOOLS
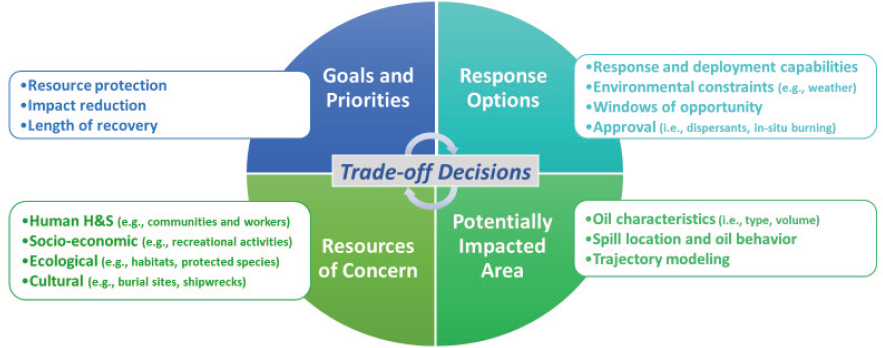
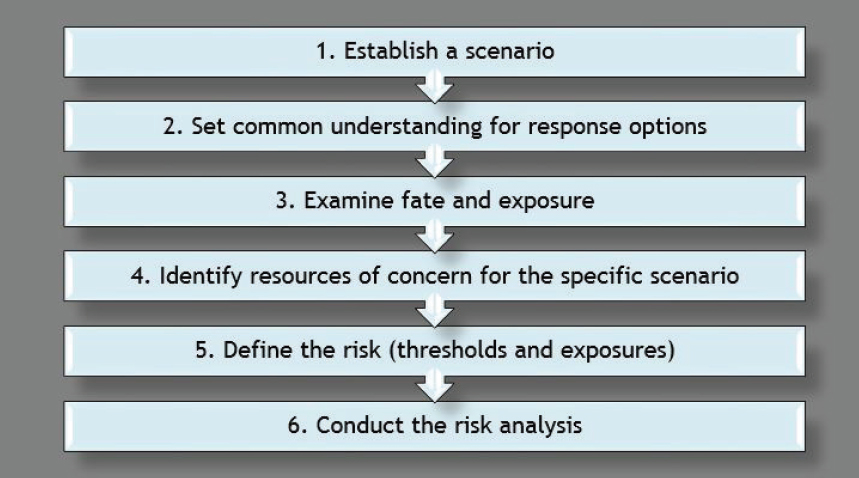
As previously discussed, making the best decision possible during an oil spill incident requires a balanced consideration of the potential environmental consequences of the spill under a natural recovery scenario versus the consequences associated with each response strategy. In any spill response, the first priority is the protection of human life, and the Federal On-Scene Coordinator and Area Contingency Plans place the highest priority on decisions that may affect response worker health and safety or public health (in the case of a nearshore release). Once immediate worker and public health and safety considerations are addressed, the next priority is to develop a response based on the best combination of response strategies that most effectively reduces environmental consequences, offers the greatest resource protection, or promotes faster recovery. However, determining the preferred response approach requires a time-sensitive evaluation of multiple factors (see Figure 5.1).
Critical to informing response decisions is the identification of resources that are at risk to adverse effects. Special consideration is given to resources within the area of potential effects that are of socioeconomic, ecological, cultural, or archaeological significance, and, in particular, to those resources that are protected under U.S. federal laws or comparable regulatory requirements around the world. In the United States, for example, these resources include species listed under the Endangered Species Act, designated Essential Fish Habitat under Section 305(b) of the Magnuson–Stevens Fishery Conservation and Management Act, and archaeological sites recognized under Section 106 of the National Historic Preservation Act.
For ecological resources, trade-off decisions were originally made based on such key factors as length of recovery from potential effects, but emphasis is shifting toward the use of ecosystem services: that is, the goods and services supplied to humans by natural resources (see the Ecosystem Services section at the end of this chapter). In the case of length of recovery, habitats or animals that are anticipated to experience slow recoveries to baseline conditions are generally given greater protection, and thus a greater weight in trade-off decisions. Recovery rates are resource-specific but are usually expected to be longer for resources that have slow growth rates, long life spans, and
low reproductive output. With an emphasis placed on recovery, protection is generally assigned to entire populations rather than individuals, with the exception of protected species. In the case of ecosystem services, emphasis is placed both on the contributions of ecological systems to humans and on the results in response option selection that is guided by restoration of the most valuable resources.
In 2000, IPIECA (formerly the International Petroleum Industry Environmental Conservation Association) published a report titled Choosing Spill Response Options to Minimize Damage: Net Environmental Benefit Analysis (IPIECA, 2000). The report highlighted the importance of “close cooperation between industry and national administrations . . . to ensure the maximum degree of coordination and understanding.” Furthermore, the report emphasized that when all involved parties work together, there is a greater likelihood of mitigating potential damages to the ecosystem.
This report was the original guiding document for using the Net Environmental Benefit Analysis (NEBA) concept for oil spill response decision making, and it has since been revised (IPIECA-IOGP, 2015). While the understanding of the science of dispersant use has evolved in the past decade, there are still gaps. Therefore, NEBA-based approaches should clearly identify information gaps that exist at the time the process has commenced.
In the past two decades, three decision-making tools have evolved to help implement the NEBA concept (see Box 5.1):
- Consensus Ecological Risk Assessment (CERA)
- Spill Impact Mitigation Assessment (SIMA)
- Comparative Risk Assessment (CRA)
These tools can bring together elements of various regulations, policies, and current state of the science into an overall decision-making framework for oil spill response. The tools are not limited to application in a particular regulatory regime or natural system (e.g., marine, estuarine, or freshwater environments), but they can be adapted to a wide range of scenarios.
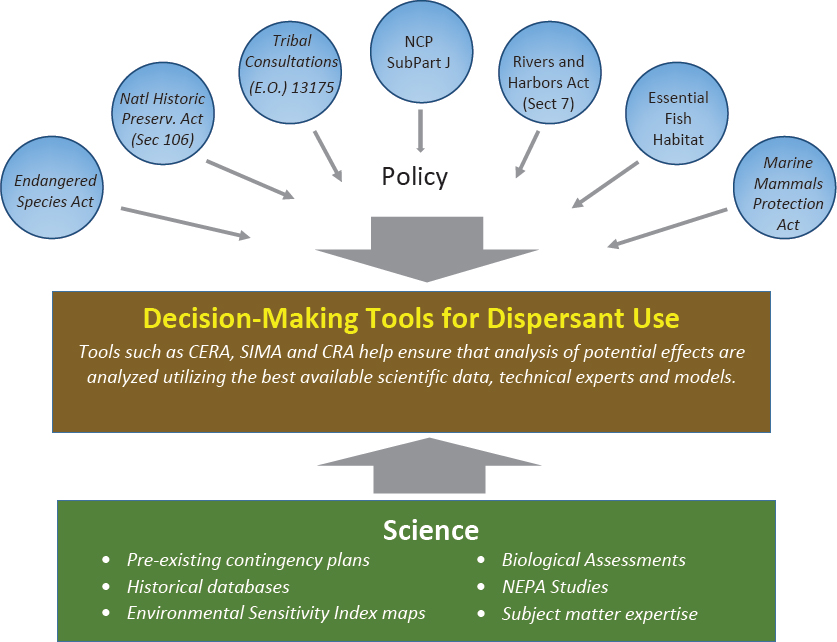
Integrated models play an important role in each of these decision-making tools, as is explained later in this chapter. A basic representation of typical inputs to these decision-making tools is presented in Figure 5.2.
INTEGRATED MODELS
Several possibilities exist with respect to informing the oil spill response decision-making process as it pertains to possible and actual effects. One option to quantify dispersant trade-offs is to use laboratory or field experiments, although this approach faces steep challenges in replicating the complexity and individualist nature of a real spill. A second option may be to rely on experience from past spills, but these rarely include comprehensive, high-quality observations and, additionally, may be different from the spill being considered in important ways. Another option is to wait until the spill happens and monitor key indicators in the field during the event. This route has many potential pitfalls, one of the most important being the difficulty in getting sufficient monitoring equipment in the right place at the right time. Furthermore, real-time monitoring cannot itself forecast future effects and does not support the exploration of “what-if” scenarios. Given these limitations, integrated models are routinely used—especially in contingency planning—to quantify the trade-offs involved in dispersant usage.
As a tool to guide decision makers evaluating trade-offs, integrated models provide a number of advantages. Models incorporate many of the processes of importance and can provide a “big picture” view of the fates and effects of a spill in many different formats. From the perspective of “fates,” integrated models have the ability to handle different oils, gas ratios, and flow rates as well as ocean and atmospheric conditions. Some models can factor in the removal or diversion of oil by skimmers, booming, burning, etc. From the perspective of “effects,” a few of the models use their calculated 4-D (x, y, z, and t) concentration fields of oil pseudo-components coupled with toxicity thresholds and spatial distributions of important biota to calculate mortality and recovery rates. Another benefit of integrated models is that they can be used to quantify and understand the sensitivity of the results to changes and uncertainties in inputs and sub-model formulations and the effectiveness of the various response options. Sensitivity studies are especially helpful in establishing confidence limits and focusing future research on topics that will best improve our understand-
ing of spill effects. Finally, a model can provide a forecast that reflects changes in weather, flow rate, and response alternatives.
As briefly mentioned, it is difficult to make trade-off decisions using field observations during an ongoing spill. The most important reason is that observations made during actual spills are almost always limited because the vast majority of efforts expended during a spill are focused on ensuring human safety, containing the oil (including source control), and minimizing the overall environmental damage. These activities will typically have priority over monitoring, and this often results in restrictions on scientists trying to gain access to key resources or critical locations (e.g., the wellhead in a blowout). Additionally, there are rarely opportunities during a real spill to conduct robust sensitivity studies. For example, during a blowout being treated with subsea dispersant injection (SSDI), it would be informative to turn SSDI on and off under comparable conditions to assess its effectiveness. However, on-scene responders, as well as other stakeholders, may be unwilling to interrupt this response option if they believe it is reducing volatile organic compounds to safer levels. There were periods during the Deepwater Horizon (DWH) oil spill when SSDI was reduced substantially for operational reasons; determining the effect of this action was difficult to assess, however, because the interruptions were too short, the observations too sparse, and the environment too dynamic.
Similarly, using results from lab experiments to guide trade-off decisions poses some limitations. First and foremost is the issue of complexity. The natural world contains countless processes that are difficult to simulate in a lab setting, effectively limiting the applicability of laboratory results
to predict real-world outcomes. Another issue with relying solely on experimental results is the notion of “scale.” Even the largest lab facilities are typically orders of magnitude smaller than the environment in which an actual oil spill occurs. This constraint bounds the comprehensiveness of experimental testing, which has implications in the universality and accuracy of the models that are based on them. This is especially important in the study of such critical processes as deep ocean oil and gas droplet formation and evolution as oil travels from the subsurface, high-pressure environment to the surface.
Large-scale field studies, such as DeepSpill (Johansen et al., 2003), have provided important information regarding the behavior of gas and oil released at depth. Like all studies, however, its scope was limited, and in the case of this experiment, it did not include an oil spill treatment process such as SSDI. It is unlikely that a future deep-sea oil release field experiment involving SSDI would be permitted to allow shoreline oiling, although such a study design would provide valuable insights on the fate and effects of untreated oil versus subsea dispersed oil in this environment. If such a comprehensive study was successfully executed, the results would be best used to improve models rather than to expect that the experimental results could be directly applied to the next spill.
Integrated models also have limitations. Some of the complex processes resident in the environment are poorly understood and their interactions may be even less so. Mathematically describing the behavior of oil in the environment through an integrated model and subsequently validating its results is difficult largely as a result of the lack of definitive observations taken during historical spills. On a positive note, however, integrated models are composed of sub-models simulating the major processes, and these sub-models have typically been validated. Nevertheless, results from even the best integrated model should be viewed with caution and results with uncertainty bounds should always be presented to decision makers, a point reinforced by ASTM F2067-13 (ASTM, 2013b). Unfortunately, the American Society for Testing and Materials does not provide guidelines on how to construct such bounds, which is not surprising given the complexity and lack of research in this topic with regard to integrated models.
Errors and uncertainty in modeling stem from two general sources commonly referred to as aleatory and epistemic. Aleatory uncertainty originates from variability in key model inputs such as wind or current forcing, oil flow rate, etc. Quantifying some forms of aleatory uncertainty is fairly straightforward when historical observations are available and the model is run in a “hindcast” mode, an approach that is commonly used in strategic (contingency) planning by using Monte Carlo simulations. Aleatory uncertainty due to wind could be included in tactical (real-time) forecasts by utilizing the standard ensemble wind model forecast products, but this would require running the model 30 or more times. To the committee’s knowledge this has not been done.
Epistemic error arises from uncertainty in our understanding of the underlying physical, chemical, biological, etc., processes. Epistemic error is generally less well studied and more difficult to quantify than is aleatory error. Ideally, an integrated model could estimate the epistemic error by changing sub-model formulations, or at least by running sensitivity studies to understand the impact of uncertainty in the various sub-models on key model outputs. Similarly, an integrated modeler would ideally perform sensitivity studies to understand how changes in key model inputs (aleatory errors) affect important model metrics. French-McCay et al. (2018b) has recently studied the impact of droplet size on fates, and this work shows that uncertainty in droplet size models can have a substantial impact on calculated effects. In other words, the uncertainty in calculated fates coming from the uncertainty in just one sub-model (droplet size) can be substantial and could potentially alter the decision to use SSDI in a blowout.
Finally, it should be pointed out that integrated models often provide poor forecasts when used in an actual spill, particularly as the forecast time horizon increases (e.g., a forecast at 2 days will generally have a smaller error than a forecast at 1 week). It is not uncommon to see integrated models asked to provide a tactical forecast many days in advance even though the confidence
bounds in the underlying weather and current forecasts are huge. A closer look at failed forecasts often reveals that there is nothing wrong with the integrated model; rather, the problem is with the input of winds and/or currents, which are generally derived from numerical models. As a case in point, Cooper et al. (2016) looked at operational current forecasts in the deepwater Gulf of Mexico based on state-of-the-art real-time measurements and models and found weak correlations: that is, r2 values of only about 0.4 were obtained for a 2-day forecast horizon. Notably, a numerical model outperformed two seasoned experts. On the other hand, this same current model can provide very accurate hindcasts. As a result of this, it may be said with some confidence that the uncertainty bounds on integrated model results for strategic (contingency) planning will be much smaller than the bounds for tactical forecasts for most sites around the world. In other words, the inability of an integrated model to accurately forecast spill fates days in advance during an actual spill should not be taken as proof that the model cannot be trusted to develop a reasonable contingency plan.
Even if the uncertainty in integrated models was thoroughly studied and quantified, there would still be a major challenge: ensuring that decision makers take adequate account of this added information. The reality is that most major decisions in actual spills are not done with quantitative methods that could explicitly account for uncertainty statistics. Instead, decisions are usually made by professional judgment with some attention paid to average (expected value) model results.
In summary, optimizing the strategic (planning stage) and tactical (real-time) response to an oil spill scenario requires an understanding of the trade-offs of the response alternatives. It is doubtful that optimal decisions can be based solely on the existing observational database or previous experience. Thus, a well-validated and well-understood integrated model run by a knowledgeable operator can be an essential tool for the decision maker looking to choose an appropriate response strategy. The model results will have substantial uncertainty and it is desirable to quantify those, but the present state of doing so is rudimentary at best, and effective communication of uncertainty remains a challenge in providing information for decision makers (Bostrom et al., 2015a). It is essential for end users of these models (e.g., spill response decision makers) to understand the limitations and errors within these models when using this type of tool to select incident-specific response options.
The next section defines what we consider to be an integrated model. Some of the more commonly used integrated models are summarized with a discussion of their origin, scope, previous real-world applications, and validation. Two of those models will be used in Chapter 6 to evaluate the trade-offs involved in dispersant use.
Overview and Comparison of Integrated Models
Figure 5.3 shows the major modules that would be involved in a complete oil spill modeling system, which includes the four modules in the yellow ovals:
- Blowout module (where appropriate), which would, at a minimum, calculate the droplet size distribution and simulate the buoyant plume. It could consider formation of hydrates and dirty (see Chapter 2) bubbles. The blowout module would be bypassed in the case of a surface oil release. Output from the blowout module would consist of 4-D snapshots of hydrocarbon pseudo-component concentrations that feed into the physical fate module.
- Physical fate module, which would track the hydrocarbons until they reach their ultimate fate. It would include such physical transformations as surface spreading, dispersion, advection, and entrainment. It would also include such weathering processes as dissolution, evaporation, photooxidation, biodegradation, etc. The ultimate product of a fates module is 4-D snapshots of concentrations of the hydrocarbon pseudo-components in the ocean.
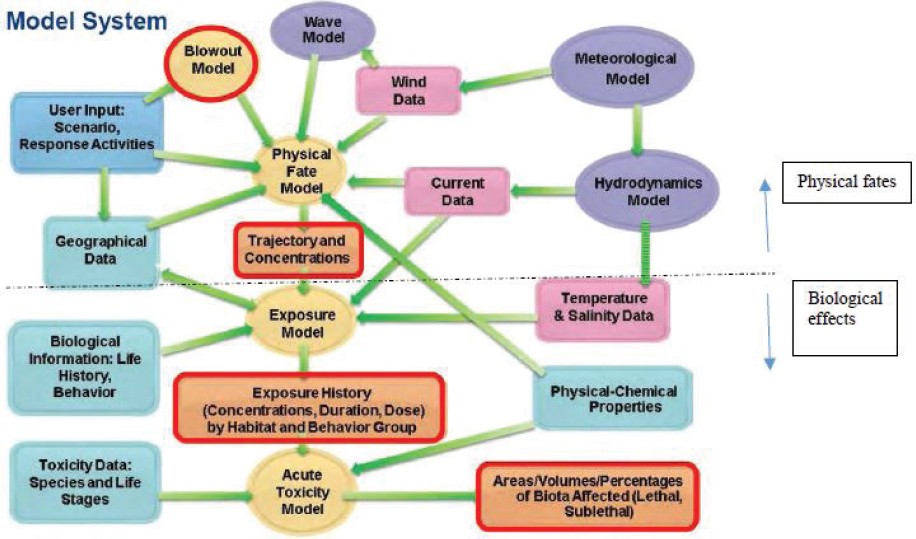
- Exposure module, which calculates the exposure duration of important biota to the 4-D concentration fields.
- Toxicity module, which estimates the acute and chronic effects on the biota based on thresholds, toxic units, or some other metric.
Integrated models require considerable input data; these are indicated by the compartments colored blue, purple, and magenta in Figure 5.3. The primary products from the modules of the integrated model are shown in orange.
Table 5.1 summarizes several of the more widely used integrated models as well as the Texas A&M Oilspill Calculator (TAMOC) model. Part A of the table covers fates while part B covers effects. Each row describes a major process while each cell briefly describes the methodology. In the case of fates, many of these are fairly standard sub-models so the methodology description is limited to a few key words. Standard, well-documented sub-models are not as typical for effects; hence, these are described in greater detail.
Table 5.1 is intended as a summary of the models and does not capture many subtleties and may leave out some capabilities. Because a comprehensive review of all oil spill models is outside the scope of this report, the interested reader is referred to Bejarano et al. (2013) for a high-level overview of several other models or to the references in the second row of the table.
SIMAP/OILMAP and OSCAR are commercial models that have been used to estimate both fates and effects. The NOAA GNOME/ADIOS2 model is the most comprehensive publicly avail-
TABLE 5.1A Summary of Fates Incorporated in Several Representative Integrated Models
| Sub-model | RPS ASA SIMAP/OILMAP DEEP | SINTEF OSCAR/DREAM | NOAA GNOME/ADIOS2 | TAMOC |
|---|---|---|---|---|
| Overall model | French-McCay (2003); French-McCay et al. (2018a); Spaulding et al. (2017) | Reed and Hetland (2002) | Barker et al. (2018) | Dissanayake et al. (2015); Gros et al. (2017); Socolofsky et al. (2015) |
| Droplet model | Equilibrium model, Li et al. (2017) | Equilibrium model, Johansen et al. (2013) | Specified by user; have used Johansen et al. (2013) | VDROP-J, Zhao et al. (2014a) |
| Plume model | Integral plume, Spaulding et al. (2017) | Integral plume, Johansen (2000) | TAMOC, Socolofsky et al. (2015) | Integral plume, Dissanayake et al. (2018) |
| Hydrates | Not included | Johansen et al. (2000) | TAMOC, Socolofsky et al. (2015) | Dissanayake et al. (2015); Socolofsky et al. (2015) |
| Dissolution | Raoult’s Law, French-McCay et al. (2015) | Reed et al. (2001) | Stevens et al. (2015); Thibodeaux and Overton (2014) | Real-fluid fugacity and modified Henry’s Law, Gros et al. (2016, 2017) |
| Biodegradation | 1st order decay, French-McCay et al. (2015); Spaulding et al. (2017) | 1st order decay, Brakstad and Faksness (2000) | 1st order decay with droplet size dependence, Thrift-Viveros et al. (2015) | 1st order decay but not used in Gros et al. (2017) |
| Evaporation | Raoult’s Law, French-McCay et al. (2015) | Raoult’s Law, MacKay et al. (1980) | Jones (1997) | Raoult’s Law, Drozd et al. (2015), and Gros et al. (2017) |
| Photooxidation | 1st order half-life based on seasonal mean UV in water column, French-McCay et al. (2018a) | Included through usage of weathering data of oils exposed to sunlight. | None | None |
| Entrainment | Adaptation of Delvigne and Sweeney (1988) with updated droplet size model. Li et al. (2016, 2017b) | Mass flux: Delvigne and Sweeney (1988); Droplets: Johansen et al. (2015) | Update of Delvigne and Sweeney (1988), see Barker et al. (2018) | None |
| Particle interaction and deposition | Interaction rate based on particle concentration. French-McCay (2004); French-McCay et al. (2015) | Dissolved particles can interact with nepheloid layer and transfer to the sediment: Reed et al. (1995) | Payne et al. (1987) | None |
| Advection | 3.5% of wind + background current, French-McCay (2004) | 3.5% of wind + background | User specified windage factor + background current added using 2nd order Runge-Kutta, Barker et al. (2018) | None |
| Spreading | French-McCay (2004); Hoult (1972) | Fannelop and Waldman (1972) | Initial: Fay-Hoult, then Richardson-scaled turbulence, with Langmuir correction, Barker et al. (2018) | None |
| Emulsification | French-McCay (2004); MacKay and Zagorski (1982) | Daling et al. (1990) | MacKay and Zagorski model (1982) or Lehr (2017) | None |
| Dispersion Horizontal | Randomized (Bear and Verruijt, 1987) dispersive velocity which are scaled using Okubo (1971). Scaling can be a function of vertical layer. | Random walk, Okubo (1974); Reed and Hetland (2002); Reed et al. (1995) | Random walk, Barker et al. (2018) | None |
| Dispersion Vertical | Randomized (Bear and Verruijt, 1987) dispersive velocity which are scaled using Okubo (1971). Scaling is a function of vertical layer. | Ichiye (1967) | Random walk in two zones: Mixed layer and sub-mixed layer, Barker et al. (2018) | None |
| Droplet rise (above plume) | Modified Stoke’s Law, White (2005) | Johansen (2000) | Modified Stoke’s Law, White (2005) | Empirical equations from Clift et al. (1978) |
| Response | Skimmers, burning, surface dispersant, SSDI, French-McCay (2004); French-McCay et al. (2018a) | Skimmers, surface dispersant, SSDI, Reed et al. (1999) | Skimming, burning, dispersants, Barker et al. (2018) | None |
TABLE 5.1B Summary of Effects Incorporated in Several Representative Integrated Models
| Sub-model | RPS ASA SIMAP | OSCAR/ERA Acute |
|---|---|---|
| Exposure | Concentrations of whole oil and its components, as well as temperature, experienced by biota over time and space are tracked using Lagrangian elements assigned to behavior classes that move or remain stationary within habitats occupied by the organism types represented. Exposure is summarized as water volume or area where concentrations exceed ecological risk thresholds. In more detailed studies, the exposure history is evaluated to assess toxicity. (French-McCay, 2003, 2009, 2011, 2016) | Total hydrocarbon concentration (THC) is considered over four environmental compartments: surface, water column, seafloor, and shoreline. These are discretized in the horizontal domain on a grid of uniform size. Libre et al. (2018) used squares of 10 km. |
| Toxicity | Aquatic toxicity—A Toxic Units approach is used to account for the additive effects of the soluble and semi-soluble hydrocarbons dissolved from oil. LC50s for each hydrocarbon are estimated using the critical (lethal) body burden approach based on the toxicity model for narcotic effects. Mortality is a function of duration of exposure, i.e., the longer the duration of exposure, the lower the effects concentration (i.e., LC50). (French et al., 1996; French-McCay, 2002, 2009) Sediment toxicity—The equilibrium partitioning model is used to calculate dissolved concentrations of hydrocarbons in pore water from sedimented oil. The aquatic toxicity model is applied to pore water concentration estimates. (French-McCay, 2003, 2004, 2009; French et al., 1996) Wildlife—A portion of the wildlife in the area swept by oil slick over a threshold thickness is assumed to die, based on probability of encounter with the slick (based on behavior and habitats occupied) multiplied by the probability of mortality once oiled (based on dose-response data). (French-McCay, 2009, 2016) Habitats—Area of each habitat type exposed to oil over threshold thickness for effects (based on literature studies of effects thresholds). |
General strategy: Impact = P[exposure] × P[lethality] × Population Frac. Surface water—Considers only physical contact with oil with the fraction of the valued ecosystem component (VEC) suffering mortality being a function of the fraction of the total surface covered by the VEC, the exposure time of the VEC to oil thicker than a threshold (2 µm for birds, 10 µm for marine mammals), the probability of encountering an area with surface oil, and the probability of lethal effects given oil encounter. The two later quantities are based on previous studies. Shoreline—Considers the National Oceanic and Atmospheric Administration’s Environmental Sensitivity Index along with the average thickness of the oil, a patchiness factor, tidal range, length of shoreline, and slope of shoreline. Impact thresholds used in Libre et al. (2018) are 1 mm for vegetation and 0.1 mm for invertebrates living in the intertidal zone. Water column—Only considers egg and larvae. Calculates lethality using total hydrocarbon concentration and a species sensitivity distribution (SSD) curve parameterized using a LC5 of 58 ppb. Seafloor—For biota residing on the seafloor, lethality is calculated just as in the water column (see previous description). For biota residing in the sediment, concentration of THC in sediment is calculated through partitioning coefficient theory with lethality inferred from SSD curve. |
| Biomass density | Biomass density—Biological densities by life stage are developed based on sampling results, stock assessments, and life history information related to behavior and distribution. The densities are multiplied by volume or area affected to estimate numbers or biomass killed or otherwise affected. (French-McCay, 2003, 2004, 2009, 2011) | Biomass density—The density of valued ecosystem components are established in each vertical compartment and each grid using a monthly average. |
| Population level effects | Population models are used to estimate the number of years each species and life stage would have lived otherwise if not killed by the spill. Production foregone is estimate for fish and invertebrate species where growth models are developed. (French-McCay, 2003, 2009) | None |
| Biota recovery | For wildlife, fish, and invertebrate populations, recovery is typically assumed to occur once the individuals killed by the spill would have died anyway. For species where density-dependent population models are developed, recovery time is modeled as time until the population recovers to within 1% of the pre-spill condition. For habitats, recovery time is based on literature observations of productivity over time. (French-McCay, 2003, 2009) | Surface—Lag time for species breeding on shoreline depends on fraction breeding in contaminated sites. Restitution time depends on population loss and a discrete logistic growth model using a species-specific reproductive rate. Shoreline—Lag time based on three shoreline types. Restitution time is based on historical data for each Environmental Sensitivity Index where lethality has been exceeded. Water column—Restitution time considers critical threshold of fish population, above which recruitment is considered independent of spawning stock size. Also considers large mortality of larvae normally found in non-oiled environment. Sea floor—Lag time set to 1 year. Considers rate of decrease of THC, which is a function of bottom type. |
| Ecosystem-wide effects | Lost production (growth) of lower trophic level plants and animals (not explicitly modeled as individual species) is integrated in space and over time. Losses at higher trophic levels are estimated using a food web model and trophic transfer efficiencies. | None |
NOTE: GNOME/ADIOS2 and TAMOC models do not contain effects sub-models and are therefore excluded from this table.
able model. Historically, GNOME has been used by NOAA, other government agencies, and private companies to serve as the core model for CERAs and SIMAs for surface oil spill releases. GNOME does include levels of concern derived from consensus ERAs and tracks over space and time whole oil concentrations on which to make assessments of potential effects (Mearns et al., 2001, 2003).
The TAMOC model focuses on the fate of oil from a subsurface blowout to the sea surface covering module 1 and part of module 2 of the four modules listed earlier in this section. However, these modules may be the most critical in determining the fate of oil from a blowout. While TAMOC is more narrowly focused than SIMAP/OILMAP, it uses more advanced algorithms for these processes. A closer look at Table 5.1A shows that none of the models directly include the coast, seafloor, or atmosphere. A truly complete integrated model of all oil fates and effects would incorporate these spatial regions.
TAMOC represents an important class of models that can be used in conjunction with the more comprehensive models like SIMAP/OILMAP. The latter models are time consuming to run, which inhibits their use as a tool in sensitivity studies or in studying new scenarios. Alternatively, models like TAMOC can be more readily run for different water depths, oil types, DORs, etc. Thus, one way to look at a new scenario (e.g., different water depth, distance from shore, oil type, gas-to-oil ratio [GOR], etc.) is to run the TAMOC model for the new scenario and then view the results from the perspective of SIMAP/OILMAP.
Socolofsky et al. (2015) compared 5 integrated models for 14 scenarios of a continuous 20,000 barrels (bbl) per day blowout. The models included SIMAP, OSCAR, and a predecessor of TAMOC. The scenarios considered two water depths (500 and 2,000 m), two GORs (500 and 2,000 std ft3/bbl), two DORs (0 and 2%), and two horizontal current regimes (5 and 30 cm/s). Because of the importance of droplet size, all the modelers used the same droplet distribution for several of the cases. In several other cases, the modelers used their preferred droplet model. Models were compared by looking at four metrics, the most important being the mass of oil entering the intrusion layer and the downstream distance to the center of surfacing oil. Important conclusions were:
- There is a consensus of the models that the addition of subsea dispersant moves the surfacing oil downstream by an order of magnitude and results in far less oil reaching the surface.
- For a dispersed oil, a decrease in droplet size of ~25% can increase the volume of oil in the intrusion layer by a similar amount, but it causes much larger changes in the downstream surfacing distance (five times). This suggests that the present uncertainty in droplet models (up to two times, as described in Chapter 2) will affect the assessment of SSDI effectiveness substantially.
There are considerable discrepancies between the models for many of the metrics, and some critics of models have used this to question the credibility of all models. While the individual models have varying histories of development and validation, the two most validated and widely used (OSCAR and OILMAP Deep) produce fairly consistent metrics when they use the same droplet sizes. For example, Figure 11 of Socolofsky et al. (2015) shows that the distance from the release point to the downstream center of the surfacing oil compares to within two times for the majority of cases where a common droplet size was used.
THE CERA APPROACH
The integration of the NEBA concept into oil spill response planning in the United States increased in the mid-1990s when the U.S. Coast Guard (USCG) developed an approach to evaluate the ecological effects from various response options, which included input from several state and federal agencies. The effort was spurred by an article on the application of ecological risk analysis in dispersant use (Aurand, 1995), which outlined the essential elements of CERA. The USCG document, titled Developing Consensus Ecological Risk Assessments: Environmental Protection in Oil Spill Response Planning: A Guidebook, was later published in 2000, after a 4-year interagency development period (Aurand et al., 2000).
While this USCG CERA approach is nearly two decades old, its recommendation for using a blend of both common sense and consensus development as well as quantifiable scientific information remains a valid framework for response selection and continues to be used by industry and agencies. A detailed discussion of the CERA process was presented in the last National Research Council (NRC) dispersant report (see NRC, 2005, pp. 35-45).
The CERA process comprises three main phases: (I) problem formulation, (II) analysis, and (III) risk characterization, and it is intended to be conducted in a workshop setting that involves members of industry, operational response experts, response decision makers, scientists, and local resource experts. CERA participation has typically involved between 25 to 50 workshop participants but has varied. In Phase I, problem formulation, participants formulate a scenario for analysis, determine the relevant resources of concern and associated assessment thresholds, and they develop a conceptual model that directs subsequent analysis. In Phase II, analysis, the participants evaluate exposure, ecological effects, and recovery by customizing standard templates and simple analytical tools, like the risk square and a risk ranking matrix, for the specific spill scenario under consideration.
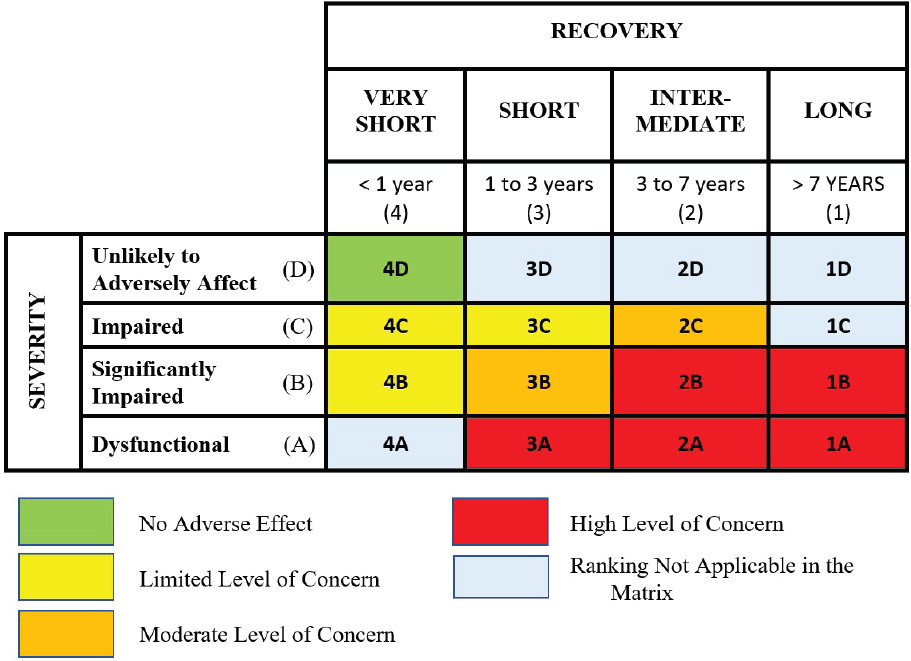
The risk square (see Figure 5.4) was incorporated in the CERA process because of its common use in other types of environmental assessments by the U.S. Environmental Protection Agency (MMS, 1989). It is a means to examine environmental risk by considering both the percent of a resource that is affected by a perturbation (in this case, an oil spill) and the anticipated time of recovery for a given resource. In the CERA method, a 4×4 matrix is frequently used, but during a given CERA workshop, participants customize this risk matrix by adding more columns or rows to provide greater resolution on either axis. Additionally, the length of recovery can be defined during the CERA process for a given scenario, depending on the anticipated recovery time for local resources. In one CERA (Aurand and Coelho, 2003), the slowest recovery period was defined as “> 25 years” due to coral structures in the region that, if harmed, could take a substantial amount of time to recover. Once the size of the matrix is set and the increments on each axis are customized for a given CERA, participants then color-code the risk square to qualitatively assign levels of concern. The flexibility in the CERA process allows participants to modify levels of concern, based on local expert input and stakeholder engagement, for the spill scenario under consideration. This aids the evaluation process of response option comparison later in the analysis.
The customization of templates during the analytical phase is an important step in developing consensus among CERA participants and helps ensure a common understanding of which resources are considered “important” in the local area and of how each response option will be appropriately deployed. During the workshops, the participants then use the risk square to evaluate the resource subcategories for each response option by assessing what percentage of each resource will likely be impacted and how long its recovery will take.
In Phase III, risk characterization, participants compare the overall environmental risks and benefits of each response option to those associated with natural recovery (i.e., baseline). The completed risk ranking matrix (see Figure 5.5) is the key to the CERA analysis as it enables compari-
sons between response options and within particular habitats or resource groups. Figure 5.5 depicts conceptually how various resources of concern might respond when exposed to a response option. This figure depicts decisions from a recent CERA conducted in Hawaii, where CERA discussions were focused on potential surface dispersant application and relied on GNOME for oil trajectory and oil budgets (Walker et al., 2018b).
In the CERA, it is recognized that, in addition to the stress caused by the spilled oil, each response option may also be a source of ecosystem stress. The mechanisms that cause the stress vary as can the magnitude of stress resulting from each option. Seven “hazards” have been identified and represent the potential exposure pathways that connect the stressors (including natural attenuation) to the resources of concern. In summary, the hazards include:
- Air pollution;
- Aquatic toxicity;
- Physical trauma (i.e., mechanical impact from people, boats, etc.);
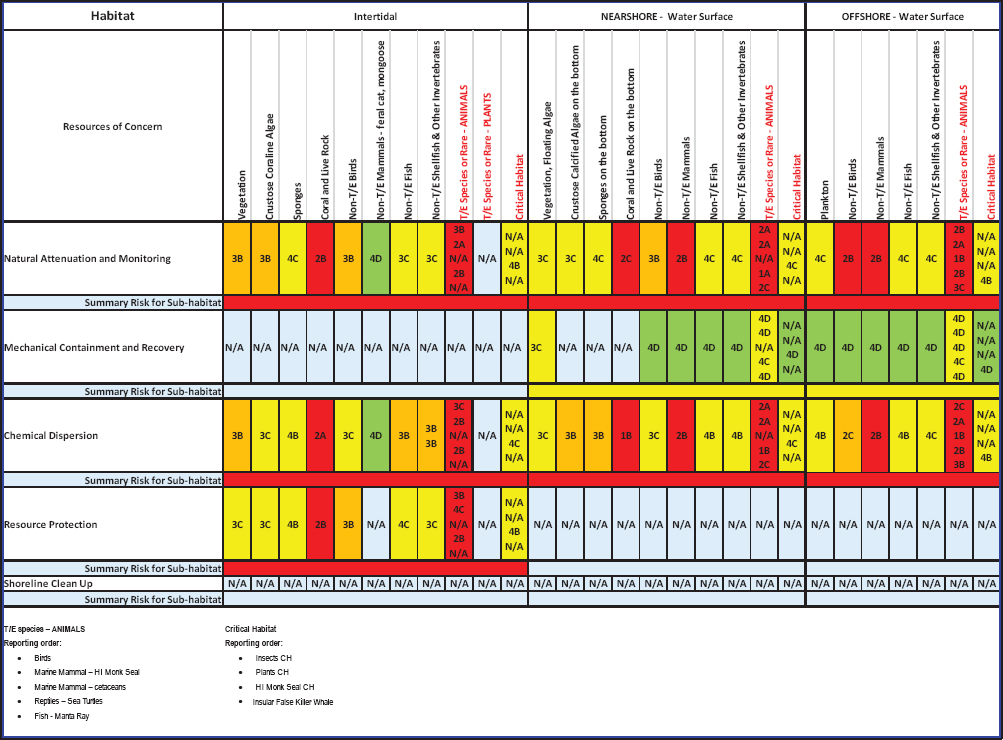
- Oiling or smothering;
- Thermal (i.e., heat exposure from ISB);
- Oil-contaminated waste materials transfer and disposal; and
- Indirect (refers to a secondary effect such as ingestion of contaminated food)” (Coelho et al., 2015).
The CERA process uses natural attenuation (also referred to as the no response option) as the baseline for the analysis. In addition, CERA assesses “levels of concern” on resource categories, habitats, and population assemblages, not on impacts to individual species. However, some protected species may drive a decision regarding how to best protect a given resource or habitat. The USCG guidelines (Aurand et al., 2000) provide a more detailed discussion of the CERA method, and the individual steps involved in conducting a CERA. A simple depiction is provided in Figure 5.6. Dozens of CERAs have been conducted for contingency planning purposes, and case studies are presented in the next chapter. Recent CERAs have been adapted to include socioeconomic and human health factors (e.g., Walker et al., 2016).
THE SIMA APPROACH
After the DWH oil spill there was a renewed effort to further refine the process of spill response decision making that could be applied globally in both industrialized and remote areas. Although the USCG had already developed the CERA process for contingency planning purposes, many believed that it could not be realistically applied at the onset of a spill response, nor tactically during an ongoing event. Simply put, the time, cost, and logistics coordination to achieve a consensus-based approach for contingency planning, while appropriate for contingency planning, was believed by many to be too constraining when faced with an actual spill. Acknowledging these limitations and recognizing that CERA may not be appropriate in other regions of the world, IPIECA and
the International Association of Oil & Gas Producers (IOGP) (IPIECA-IOGP, 2015) released an updated document titled Response Strategy Development Using Net Environmental Benefit Analysis. Although both IPIECA documents (2000 and 2015 versions) stressed the importance of making trade-off analyses of response options versus consequences, neither report presented a method to consistently apply a process.
In 2016, IPIECA, IOGP, and the American Petroleum Institute (API) worked together to develop a new method for studying risk in oil spill response that could address challenges in scoring and more readily facilitate stakeholder concurrence in past CERAs. The publication, Guidelines on Implementing Spill Impact Mitigation Assessment (IPIECA-API-IOGP, 2017), provided the strategy for analyzing oil spill effects and facilitating response option selection. As part of the refinement and communication process in developing SIMA, this framework was evaluated in workshops in North America (Clean Gulf Conference Workshop on SIMA organized by API/IOGP/IPIECA—October 21, 2016), Europe, and Asia-Pacific (IPIECA workshop in Perth, Australia—November 30-December 1, 2017; IPIECA workshop in Singapore—December 5, 2017; AMSA workshop in Newcastle, Australia—August 6-9, 2018). In addition, two SIMAs were completed in exploration blocks in Eastern Canada in 2017 (Coelho et al., 2017a; Slaughter et al., 2017).
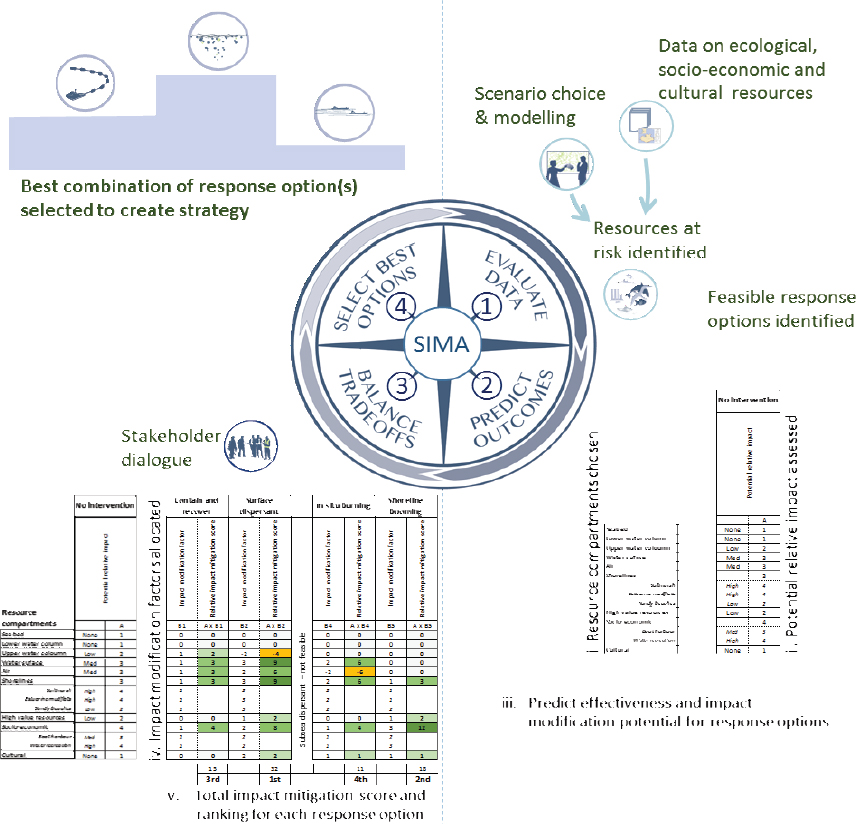
Like CERA, the SIMA tool uses a structured framework for evaluating response options. It involves four steps:
Step 1. Compile and evaluate data
NEBA analysis considers the characteristics of the spilled oil and the transformations it may be subjected to as it weathers and spreads, which may determine the magnitude of environmental, biological, and socioeconomic impacts (Daling et al., 2014). Data linked directly to planning scenarios under consideration primarily include oil properties, oil spill trajectory modeling, environmental sensitivity maps, and identification of appropriate response options for that particular site.
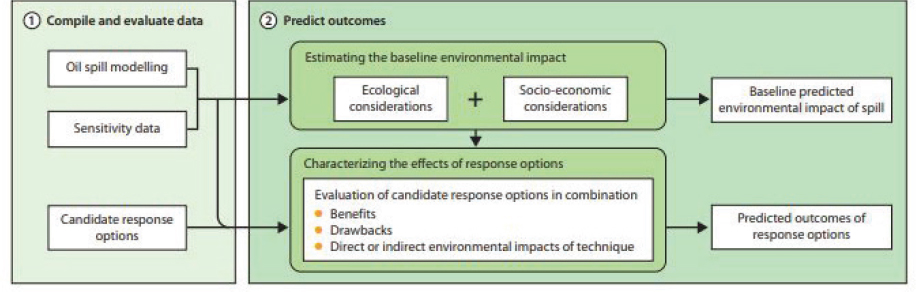
Step 2. Predict outcomes
The data obtained in Step 1 are reviewed and assessed by the planners and responders. Figure 5.7 summarizes the tasks in Step 2 and how they interact with Step 1. SIMA includes an evaluation of the potential effect of a baseline scenario where no response actions are taken, which covers the time scale needed for the oil to be naturally attenuated (IPIECA-IOGP, 2015).
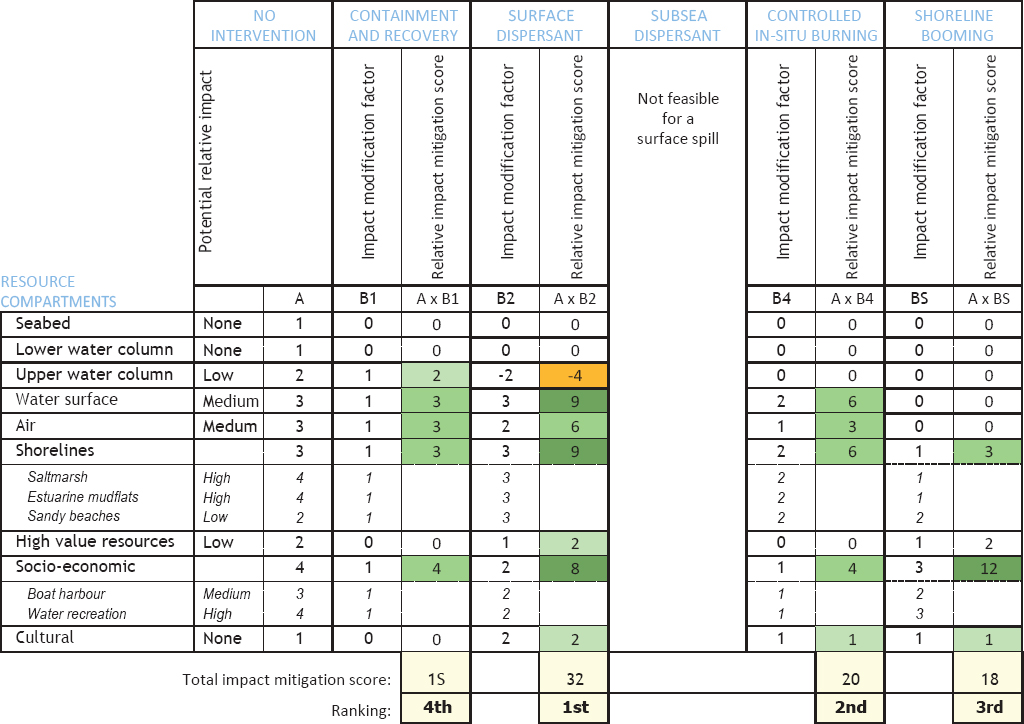
The effects of the response options are characterized and evaluated after baseline establishment. Combined interactions of multiple response technologies at this stage must be considered. During Step 2, the user develops a table of resources versus response options (see Figure 5.8).
Step 3. Balance trade-offs and reach consensus
This step requires a range of stakeholders to reach consensus on the relative priority of the environmentally sensitive resources and to understand the trade-offs associated with available response technologies (ASTM, 2013a; IPIECA-IOGP, 2015). Two trade-off aspects are balanced in this step (i.e., protection and response and the benefits and drawbacks of selected response options). For the former, this priority may be influenced by the ease of protection and response; recovery times; and the importance for subsistence, economic value, and seasonal changes (IPIECA-IOGP, 2015).
Step 4. Select the best options
Following evaluation of all data, expert opinions, and identified trade-offs, the final step is focused on the selection of the optimum response strategy for both the planning scenario and the prevailing spill conditions. Prior to a spill, response strategies may be identified for various planning scenarios. During a spill, the deployment and adjustment of response capacities may be needed. After spills, the process supports the decisions about when response endpoints have been satisfied by continuing monitoring of response effectiveness and evolving conditions (IPIECA-IOGP, 2015).
A visual framework depicting the pathways of decision making is provided in Figure 5.9.
COMPARATIVE RISK ANALYSIS
A CRA seeks to compare the benefits and consequences (effects/impacts on biota) of various response options. In many ways, it can be considered an evolutionary step of NEBA, one that takes advantage of recent advances in biological modeling technology to remove some of the subjectivity out of preceding frameworks. To date, there has been only one attempt at a CRA. It focused on a DWH-like blowout in the deep water of the Gulf of Mexico (Bock et al., 2018; French-McCay et al., 2018a; Walker et al., 2018a) and was extended to examine the sensitivity of the fates to changes in site location (including depth) and droplet size (French-McCay and Crowley, 2018). As a newly developed framework, a key rationale of the CRA is that it attempts to reduce uncertainties introduced through the use of integrated models, whose predicted results may not reflect actual occurrences in the environment, by comparing the relative risks and benefits of various response options.
At the core of a CRA is an integrated model that is capable of simulating both the fates and the effects of a spill. In the case of the CRA study by French-McCay et al., the SIMAP/OILMAP DEEP models were used, but the methodology could be employed, of course, with other models such as the OSCAR/ERA-Acute model (Libre et al., 2018). The fate component of SIMAP has been around for several decades and has evolved in terms of complexity. The basic output from the fate component is a 4-D concentration map of hydrocarbon constituents. The 4-D fields of concentrations from the fate component is used to estimate hydrocarbon effects on important biota. Given our incomplete understanding of ecosystems, modeling biological effects even for a few important species, groups, or habitats is challenging.
Perhaps the most difficult and potentially controversial task is the final step, which involves weighting the relative importance of the species under consideration. Bock et al. (2018) described a method they developed, which used elements of a SIMA/CERA. In the context of an SSDI application, they concluded that SSDI provided more benefits than costs and that the trade-off analysis was insensitive to the weighting of their important species. In other words, the positive effects of using SSDI overpowered the negative consequences regardless of how one valued the biota affected by the spill. These results will be explored more thoroughly in Chapter 6 in the case of comparing SSDI to other response options.
ECOSYSTEM SERVICES
As described by the NRC (2013), ecosystem services (ES) are the goods and services supplied to humans by natural resources. Examples of economically important ES in the Gulf of Mexico include commercial fish and flood control (due to wetlands). Less quantifiable ES include climate regulation and water purification. The idea of an ecosystem services analysis (ESA) was introduced in the early 1980s (Ehrlich and Mooney, 1983), and it has continued to slowly evolve. By far the most ambitious ESA was started by the United Nations in 2000 to evaluate present and future conditions of major ecosystems and to estimate the consequences of ecosystem change to humans (Millennium Ecosystem Assessment, 2005).
Applying an ES approach requires two major components: (1) reasonable models of important physical and biological systems for the region of interest, and (2) economic models (what economists refer to as “production functions”) that convert the physical and biological effects into a monetary value. In its simplest conceptual form, the physical/biological models would track the consequence of an oil spill on the local ecosystem services (e.g., fish populations) and quantify those in terms of a 4-D series of some important metric (e.g., tons of fish). This output would factor into the production function to calculate an economic effect.
The NRC (2013) explored conceptually the use of an ESA to estimate the damage of the DWH spill as an alternative to the traditional methods used in a Natural Resource Damage Assessment. They
concluded that an ESA could theoretically improve the fairness of financial compensation to human victims and more efficiently guide restoration of the most valuable resources. That said, the report noted the many obstacles that inhibit an ESA, notably the inability to accurately model the effect of an oil spill on important ecosystems and to quantify those effects from a financial standpoint.
In this context, it is apparent that the application of ES principles to the assessment tools (i.e., CERA, SIMA, and CRA as it matures), rather than using “length of recovery” of a particular species, is a natural next step in their evolution. While an ESA may not be appropriate for response option analysis during small oil spills, it is reasonable to expect that an ESA might become a valuable tool for dispersant-use decision making at larger, offshore oil spills.
FINDINGS AND RECOMMENDATIONS
Finding: The objective of the Net Environmental Benefit Analysis (NEBA) process is to conduct an evaluation that will allow spill responders and stakeholders to evaluate the trade-offs involved with the various response options and choose the option(s) that will result in a reduction of potential adverse impacts and/or the best overall recovery of the ecological, socioeconomic, and cultural resources of concern, while satisfying the primary goal of minimizing immediate risks to response workers and public health and safety.
Recommendation: Decisions should be based on a balanced evaluation of consequences not driven by specific individuals, species, or economic interests.
Recommendation: Greater efforts should be taken to expand and highlight the effects on human health and safety in the decision-making tools.
Finding: All three decision-making tools—Consensus Ecological Risk Assessment (CERA), Spill Impact Mitigation Assessment (SIMA), and Comparative Risk Assessment (CRA)—have value and can be used in support of contingency plan development, strategic planning during the initial stages of a spill response, or tactical execution during the active phase of a response.
Recommendation: Decision makers should further evaluate surface and subsea spill scenarios using NEBA tools (i.e., CERA, SIMA, or CRA) to better define the range of conditions (e.g., oil type, sea state, depth, location, resources at risk) where dispersant use may be an appropriate and/or feasible response option for reducing floating oil.
Recommendation: The NEBA tools (CERA, SIMA, and CRA) should be expanded to consistently address the health of response personnel, community health, and socioeconomic considerations (e.g., beach closures). Furthermore, these tools should be used to gain stakeholder input on local or regional priorities, to expand awareness, and to gain trust in the decision-making process.
Finding: The complexity of the interactions among fates and effects can be best addressed using numerical models. However, expert opinions used in the CERA and SIMA processes provide valuable insight into many trade-off decisions, and this risk communication process allows for consensus by all stakeholders.
Recommendation: Response decision making should seek to become more quantitative to improve evaluation of the ecosystem services of the whole impacted region.
Finding: The NEBA process is best achieved by using a blend of information provided by numerical models and stakeholder input.
Finding: Integrated models that calculate the fates, as well as effects, of an oil spill are now available, and most of the sub-models upon which they are based have been validated.
Recommendation: A controlled field experiment or spills of opportunity should be used to collect comprehensive field observations for validating the entire integrated model.
Recommendation: Integrated models should be used to evaluate and optimize combinations of response options.
Finding: Integrated models are routinely used in tactical and strategic oil spill planning, usually with limited insight into their uncertainty bounds.
Finding: It is important for end users of numerical models to understand that even the best models have uncertainties.
Recommendation: Systematic studies of the uncertainty bounds in integrated models are needed, and methods should be developed to include these bounds as a routine model product. Tools are also needed to help decision makers quantitatively account for this uncertainty in a consistent manner.


