


Below is the uncorrected machine-read text of this chapter, intended to provide our own search engines and external engines with highly rich, chapter-representative searchable text of each book. Because it is UNCORRECTED material, please consider the following text as a useful but insufficient proxy for the authoritative book pages.
8 Construction and maintenance projects on two-lane two-way highways require a strategy to provide acceptable transportation service to road users while accommodating construction/ maintenance operations. Strategies that can be considered include 1L2W operation, detour, diversion, and use of shoulders. The focus of this synthesis is on 1L2W operations. Guidance for selecting a proper strategy as well as designing the geometric features of TTC zones are provided in NCHRP Report 581 (Mahoney et al. 2007). This chapter presents the findings from the litera- ture review of issues and research related to 1L2W operations. TTC Zone The goal of designing a TTC zone before implementation is to ensure the safety of roadway workers and drivers, as well as traffic mobility and accessibility of the roadway being repaired. TTC zones consist of four areas (shown in Figure 2-1) including (FHWA 2009): ⢠Advance Warning Area: road users are informed about the upcoming work zone or incident area, ⢠Transition Area: road users are redirected using tapers, ⢠Activity Area: area where work activity takes place, and ⢠Termination Area: road users are redirected to their normal path. Figure 2-1 does not show a 1L2W section; however, the components of TTC zones shown in the figure are applicable to 1L2W operations. Types of 1L2W Operations Alternating one-way movement can be accomplished by using methods including human flaggers, human flaggers with advance flaggers, flag transfer, self-managed control, AFADs, TTCSs, and pilot car operations. Each of these methods is described below. Human Flaggers In human flagger control method, traffic may be controlled either by a single flagger (also called flag person) or by a flagger at each end of the one-lane section. If a one-lane section is short enough that a flagger can see one end to the other, a single flagger can control the traffic (FHWA 2009). In a single flagger case, the flagger should be stationed on the shoulder opposite the construction or work space, or in a position where good visibility and traffic control can be maintained at all times. If a one-lane section is so long that a single flagger cannot see the full length of the road, traffic should be controlled by a flagger at each end of the section (FHWA 2009). In such a case, all flaggers should be able to communicate to coordinate the control of traffic. Communication can be through oral, electronic, or manual signals. Figure 2-2 shows the C H A P T E R 2 Literature Review
Literature Review 9 Figure 2-1. Components of TTC zones (FHWA 2009).
10 Practices in One-Lane Traffic Control on a Two-Lane Rural Highway Notes: 1. For rural roadways, suggested spacing of advance warning signs (A, B, and C) is 500 feet. 2. See Figure 2-3 for the meaning of the symbols. Figure 2-2. Typical application for flagger control adopted from the MUTCD (FHWA 2009).
Literature Review 11 MUTCD typical application for flagger control in 1L2W operations. Meanings of symbols used in the typical application are listed in Figure 2-3. The human flagger method is often used for short duration operations (up to one hour) and short-term stationary operations (daytime work performed within a single daylight period) (Finley et al. 2014). If the flagger station is illuminated, the human flagger method can also be used for nighttime works. Various aspects of the human flagger control method including flaggersâ gestures, signals, position, and training have been studied since the 1940s (Richards et al. 1980, Pigman and Agent 1988, Caltrans 2014b). Flaggersâ exposure to traffic, lack of escape zones, standing in shadow areas, and lack of proper sight distance, among other issues, raise concerns over worker safety. In order to improve safety in 1L2W TTC zones with human flagger control, various devices such as portable rumble strips (PRSs) and portable changeable message signs (PCMSs) have been used. These devices are intended to inform drivers of a TTC zone ahead, in which they may be required to stop. Human Flaggers with Advance Flaggers Advance flaggers are sometimes used in addition to flaggers at each end of the one-lane section. When traffic volumes increase unexpectedly, traffic queues might extend beyond the initial advance warning sign. In such cases, advance flaggers are used. Also, when sight distance from the approaching vehicle and back of the queue is insufficient, advance flaggers are considered. When traffic queues extend beyond the initial advance warning sign or sight distance from the approaching vehicle to the back of queue is less than 675 feet, the Oregon Department of Trans- portation (ODOT) requires advance flagger deployment (ODOT 2016b). Figure 2-3. Meanings of symbols used in the MUTCD (FHWA 2009).
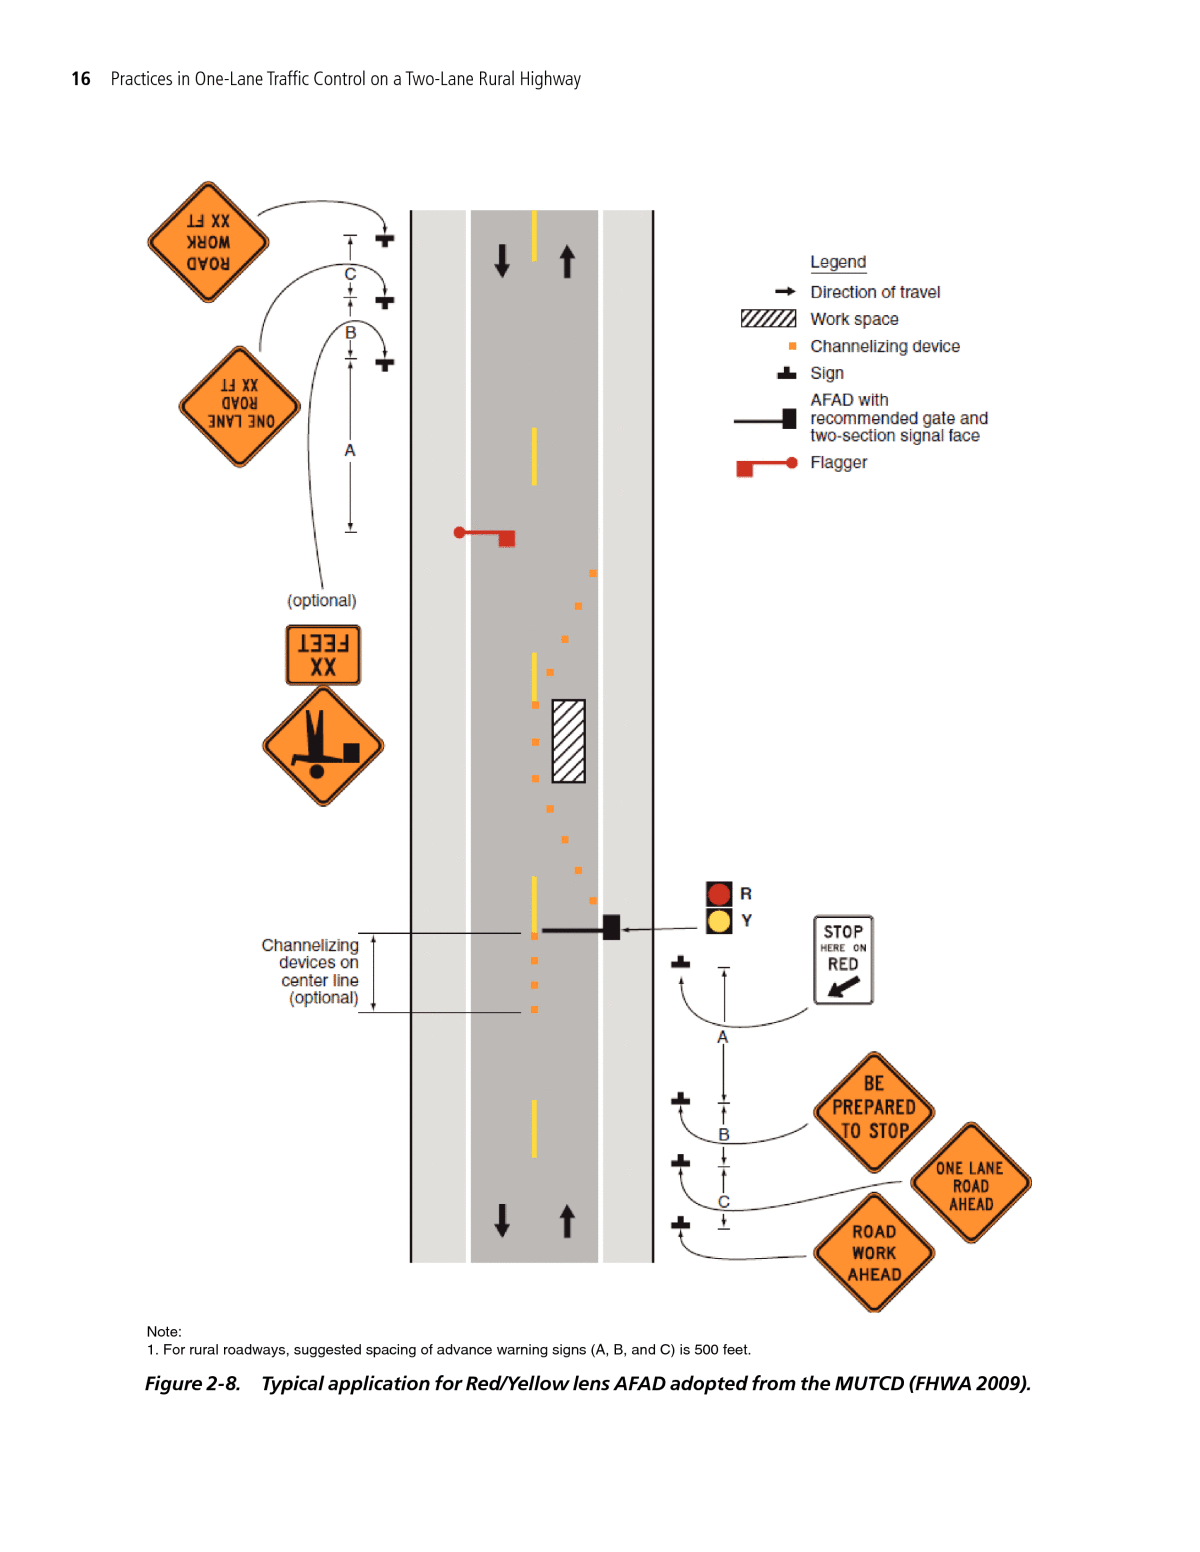
12 Practices in One-Lane Traffic Control on a Two-Lane Rural Highway Flag Transfer The flag transfer method is carried out by asking the driver of the last vehicle proceeding into the one-lane section to transfer a red flag (or another token) to the flagger at the other end (FHWA 2009). Upon receiving the flag, the flagger at the other end knows that traffic can be permitted to move in the other direction. The flag transfer method provides a means of com- munication between flaggers. This method should be employed only when the one-lane section is relatively short, usually less than 1 mile in length (FHWA 2009). Self-Managed Control In self-managed control, YIELD or STOP signs are used to regulate traffic in 1L2W operations. A yield or stop method can be used for 1L2W operations when traffic volume is low and the open side is visible to the driver who must yield or stop for a distance equal to the safe-passing sight distance (FHWA 2009). In self-managed control, vehicles on the closed side should yield to or stop for oncoming traffic on the open side. Figure 2-4 shows the MUTCD typical application for self-managed control in 1L2W operations. AFADs AFADs are portable traffic control devices used by flagging personnel to control traffic during 1L2W operations. AFADs do not eliminate the need for flaggers; however, they enhance flagger safety. AFADs lower flaggersâ exposure to traffic by allowing the flaggers to operate the devices remotely. In 2004, FHWA approved the use of AFADs (FHWA 2005b) and later the provisions were included in the MUTCD (FHWA 2009). Two types of AFADs are available, (1) STOP/SLOW AFAD and (2) Red/Yellow lens AFAD. The STOP/SLOW AFAD uses a remotely controlled assembly that displays a STOP sign to stop traffic and a SLOW sign to allow traffic to proceed (Figure 2-5). The Red/Yellow lens AFAD uses illumi- nated circular lenses, which alternately display red to stop traffic and flashing yellow to allow traffic to proceed (Figure 2-6). The MUTCD typical applications for use of STOP/SLOW and Red/Yellow lens AFADs are presented in Figure 2-7 and Figure 2-8, respectively. In 2005, FHWA reported experiments with STOP/SLOW AFADs in the United States (FHWA 2005a). The Illinois Department of Transportation (IDOT) first started to use AFADs in 1991. During the IDOT experiment, only two drivers did not comply with traffic rules (total num- ber of motorists was not reported). The FHWA report also described four experiments with Red/Yellow lens AFADs in Ohio, Missouri, Wisconsin, and Alaska. In a 2-year study in Ohio, no crashes occurred and favorable performance and usability were reported. The Missouri Depart- ment of Transportation (MoDOT) used one human flagger at one end of the TTC zone and an AFAD at the opposite end. The AFAD showed a positive benefit/cost ratio ranging from 1.15 to 2.5; how- ever, several drivers did not stop at the AFAD end due to paying attention to the human flagger at the other side. During the Wisconsin Department of Transportation (WisDOT) experiment, remote flaggers successfully controlled traffic and no crashes were recorded. The Alaska Depart- ment of Transportation and Public Facilities (ADOT&PF) experiment was also successful, with no reported problems. The FHWA report lacks detailed discussions and does not provide comprehensive conclusions due to the paucity of information. In 1996, FHWA granted permission to the Minnesota Department of Transportation (MnDOT) to experiment with AFADs (MnDOT 2005). AFADs were tested in five TTC zones (two TTC zones in 1996 and three TTC zones in 1997), and drivers were surveyed. Of the drivers surveyed, 84% expected to see a flagger controlling traffic; 15% of the respondents stated they were con- fused by seeing a mechanical device; and 23% of the drivers stated that if the flagger had not
Literature Review 13 Notes: 1. For rural roadways, suggested spacing of advance warning signs (A, B, and C) is 500 feet. 2. See Figure 2-3 for the meaning of the symbols. Figure 2-4. Typical application for self-managed yield control adopted from the MUTCD (FHWA 2009).
14 Practices in One-Lane Traffic Control on a Two-Lane Rural Highway (a) Stop Phase (b) Proceed Phase Figure 2-5. An example of a STOP/SLOW AFAD (Finley et al. 2015). (a) Stop Phase (b) Proceed Phase Figure 2-6. An example of a Red/Yellow lens AFAD (Courtesy: Melisa Finley, TTI).
Literature Review 15 Note: 1. For rural roadways, suggested spacing of advance warning signs (A, B, and C) is 500 feet. Figure 2-7. Typical application for STOP/SLOW AFAD adopted from the MUTCD (FHWA 2009).
16 Practices in One-Lane Traffic Control on a Two-Lane Rural Highway Note: 1. For rural roadways, suggested spacing of advance warning signs (A, B, and C) is 500 feet. Figure 2-8. Typical application for Red/Yellow lens AFAD adopted from the MUTCD (FHWA 2009).
Literature Review 17 been near the equipment, they would have stopped and then proceeded as if it were a standard STOP sign. In 1999, MnDOT modified testing conditions and conducted field evaluation of the AFADs at four locations. Driversâ behaviors were recorded on video for 15 hours. Results of the analysis indicated that 313 queues were stopped during the analysis period, and five drivers did not comply with the AFADs. These violations did not result in a crash, nor did the violations put workers or users at risk. Although MnDOT started to use AFADs in the 1990s, their use did not gain popularity. Since AFADs are used in short-term 1L2W operations, the additional effort to set up and take down the devices has led MnDOT to the use of traditional flagging control in many cases (Terhaar 2014). Field studies in Minnesota indicated that a human flagger operation required 40 minutes to set up and take down, while AFADs required 80 minutes (Terhaar 2014). The Virginia Department of Transportation (VDOT) evaluated the effectiveness of AFADs deployed during late 2005 and 2006 (Cottrell 2006). During January and February 2006, AFADs were deployed nine times in Grayson County for a total of 59 hours of operation. The sites were secondary and frontage roads with average daily traffic (ADT) ranging from 100 to 1,600 vehicles per day (vpd). The first deployment had no problems, the second deployment had three viola- tions, the third deployment had two violations, and the fourth deployment had one violation. The violations were assumed to be due to driversâ misunderstanding of the WAIT ON STOPâ GO ON SLOW sign. Drivers stopped at the sign and proceeded without waiting for the GO ON SLOW sign. During the next five deployments, workers covered up the GO ON SLOW sign, and only one driver did not comply with the AFAD. AFADs were used four times in August 2006 on secondary roads for a total of 36 hours. Although the GO ON SLOW sign was not covered, all drivers complied with the AFADs. The staff assumed that the earlier misunderstanding was due to the novelty of AFADs. In general, deployments of AFADs in Virginia were successful. In 2009, researchers at the Texas A&M Transportation Institute (TTI) interviewed 21 state DOTs to evaluate the state of the practice with respect to AFADs (Finley et al. 2012). It was found that 16 organizations had used or planned to use AFADs. Most of the organizations were using either STOP/SLOW or Red/Yellow lens AFADs. Four DOTs including IDOT, MnDOT, Ohio DOT, and WisDOT had purchased or tested AFADs, but they were no longer using them. In another five states, although AFADs were allowed, AFADs were not being used. Reasons stated for not using AFADs included the following: ⢠Moving AFADs from site to site was difficult, ⢠AFADs were expensive, ⢠TTCSs were used instead, and ⢠There were problems with remote controls and charging AFADs. The Texas Department of Transportation (TxDOT) investigated the effectiveness of AFADs using a motoristsâ survey and field data analysis (Finley et al. 2012). Researchers conducted sur- veys in two phases with 750 participants to evaluate driversâ understanding of both STOP/SLOW and Red/Yellow lens AFADs (Finley et al. 2012, Trout et al. 2013). Field studies during the sum- mers of 2010 and 2011 were also conducted to evaluate the operational and safety effectiveness of AFADs (Finley 2013, Finley et al. 2012). TxDOT submitted a request to FHWA to experiment with the alternative supplemental signing not approved in the MUTCD and received FHWA approval on June 1, 2011. Results of the projects are as follows: ⢠STOP/SLOW AFAD survey: Due to concerns about driversâ misunderstanding of the WAIT ON STOPâGO ON SLOW sign, 13 different experimental signs were developed and evalu- ated. In Phase 1, participants were surveyed about all 13 experimental signs; in Phase 2, three experimental signs along with the WAIT ON STOP and WAIT ON STOPâGO ON SLOW signs were selected for further evaluation. When participants were asked about the WAIT ON
18 Practices in One-Lane Traffic Control on a Two-Lane Rural Highway STOP and WAIT ON STOPâGO ON SLOW signs, 23% and 31% of the drivers, respec- tively, stated they would act like they would at a standard STOP sign (stop and then proceed). The proportions of the drivers that would stop and proceed using the three experimental signs were 8%, 14%, and 16%. Based on the study findings, researchers recommended use of a gate arm with STOP/SLOW AFADs to ensure that drivers do not proceed until the SLOW sign appears. ⢠Red/Yellow lens AFAD survey: Researchers explored driversâ understanding of different stop (red), transition (steady yellow), and proceed (flashing yellow) phases. The Red/Yellow lens AFAD in the survey was equipped with a gate arm. Results of the analysis indicated that most of the participants had a clear understanding of the red signal with the gate arm down. How- ever, the majority of drivers could not distinguish between the steady yellow and flashing yellow signals. Only 10% of the participants thought that a steady yellow signal with gate arm up was warning them to stop. Researchers concluded that the use of the gate arm was critical in helping drivers understand the Red/Yellow lens AFAD. ⢠Field data evaluation: During the summer of 2010, researchers evaluated three methods: (1) flagger with a STOP/SLOW paddle, (2) STOP/SLOW AFAD with a WAIT ON STOP sign, and (3) Red/Yellow lens AFAD with a STOP HERE ON RED sign and a gate arm. During the summer of 2011, researchers evaluated STOP/SLOW AFADs with various signs with or without a gate arm. Results indicated that the highest violation rate was for the STOP/SLOW AFAD with a WAIT ON STOP sign and no gate arm, with 6.7 violations per 100 stop cycles, which was significantly higher that the violation rate of the Red/Yellow lens AFAD (2.2 vio- lations per 100 stop cycles). When a gate arm was added to the STOP/SLOW AFAD, the violation rate dropped to 4.0 per 100 stop cycles, which was not statistically different from the Red/Yellow lens AFAD. When a gate arm was used with the STOP/SLOW AFAD, various supplemental signs did not significantly affect the violation rate. There were zero violations when a human flagger control was deployed, whereas in all AFAD alternatives some drivers did not comply with the traffic control. TTCSs TTCSs can be portable (pedestal-mounted or trailer-mounted as shown in Figure 2-9) or on fixed support. For long-term projects and activities during nighttime hours, TTCSs are prefer- able to flaggers (FHWA 2009). Figure 2-10 shows the MUTCD typical application for the TTCSs Figure 2-9. Example of a TTCS (Finley et al. 2015).
Literature Review 19 Notes: 1. For rural roadways, suggested spacing of advance warning signs (A, B, and C) is 500 feet. 2. See Figure 2-3 for the meaning of the symbols. Figure 2-10. Typical application for TTCSs adopted from the MUTCD (FHWA 2009). in 1L2W TTC zones. When a TTCS is used, flaggers can be removed from the transition areas providing advantages such as the following (Daniels et al. 2000a): ⢠Better communication with motorists: drivers are familiar with traffic signals and have a clearer understanding of them in comparison to the human flagger control method, ⢠Increased workforce productivity: flaggers can perform other tasks, and ⢠Improved flagger safety: flaggers are not at risk of being struck by vehicles.
20 Practices in One-Lane Traffic Control on a Two-Lane Rural Highway Using TTCSs for controlling traffic at 1L2W TTC zones can potentially reduce flagger labor costs. In the late 1980s, Ullman et al. explored TTCS deployment as an alternative to human flag- ger control (Ullman et al. 1987). Field data evaluation indicated that a pre-timed TTCS yielded considerable savings in flagger labor costs without significantly increasing vehicle delays. However, TTC zone safety issues arose since occasionally drivers did not comply with the TTCS. In the late 1990s, Daniels et al. investigated the applicability and feasibility of the TTCSs on 1L2W operations in Texas (Daniels et al. 2000b). A cost-benefit analysis indicated that if TTCS equipment was used 8 to 10 days per month, investment could be returned after 2 years and savings in the subsequent years could be expected. Recently, Finley et al. evaluated various traffic control methods on 1L2W rural highways in Ohio and found that if a pair of TTCSs was used 36 days per year, a return on investment would be achieved in about 9 years (Finley et al. 2015). Several studies have explored driver compliance with the TTCS method. Samoail and Yousif analyzed field data obtained from four 1L2W TTC zones in the Greater Manchester urban area in England and found that between 11% and 30% of the drivers did not comply with TTCSs (Samoail and Yousif 1998). In 2014, another study (Yousif et al. 2014) explored six different 1L2W TTC zones in the Greater Manchester urban area and reported that, on average, 11.3% of the drivers violated the red lights. Finley et al. conducted field studies in Ohio and reported 47.1 violations per 100 stop cycles (Finley et al. 2015). The authors stated that the violation rate in Ohio was much higher than the violation rate in Texas (14.9 violations per 100 stop cycles). Of the violations in Ohio, 99% occurred at the end of the green phase and were either ⢠Vehicles stopped in the previous cycle that were going to be stopped again or ⢠Vehicles approaching at higher rates of speed. TTCSs can be operated in pre-timed, actuated, and manual modes. In pre-timed operation, phase times, cycle length, and phase plan are predetermined and fixed. The pre-timed mode can be most effective when traffic conditions vary only slightly. For actuated operation, detection is provided to help determine signal splits. Duration of the phases is not fixed, and cycle length may vary from cycle to cycle. Actuated signal controls tend to be more efficient in comparison to pre- timed signal control. TTCSs can also be operated manually by a crew member. Manual mode can be desirable when traffic volumes are highly variable, pre-timed or actuated control systems fail, or an unusual procedure is required. Al-Kaisy and Kerestes evaluated four different 1L2W control methods including pre-timed, fixed queue, saturation operation, and adaptive strategies (Al-Kaisy and Kerestes 2006). In the adaptive mode, vehicles approaching the back of queues were detected, and the signal green phases were adjusted accordingly. It was found that for an approximately 820-foot-long (250-meter-long) TTC zone, the adaptive mode reduced average vehicle delay by 53% in comparison to the pre-timed mode. Alterawi and Yousif developed a micro-simulation model for pre-timed and actuated TTCSs in 1L2W TTC zones on urban networks (Alterawi and Yousif 2014). For a study case, an actuated TTCS was shown to reduce average vehicle delay by 11% and 25% in comparison to another actuated TTCS (with higher minimum green and lower maximum green times) and a pre-timed TTCS, respectively. Clearance (All-Red) phases of the TTCSs are determined based on the length of the one-lane section. Long one-lane sections require long clearance phases resulting in long cycle lengths. Few studies have explored the optimum length of the one-lane sections on two-way highways. Ceder examined the optimum length of a TTC zone by developing a mathematical program to minimize total operational and delay costs (Ceder 2000). Various traffic volume combinations were tested, and results indicated that with higher traffic volumes, optimal section lengths were shorter. Sen- sitivity analysis showed that optimum section length was sensitive to wage changes at low traffic volumes and insensitive otherwise. Schonfeld and Chien evaluated the effects of longer TTC zones and cycle times in increasing user delay and reducing total maintenance time and costs (Schonfeld and Chien 1999). The authors assumed steady traffic demand and developed a mathematical
Literature Review 21 program to optimize TTC zone length and TTCSs on 1L2W sections by minimizing total agency and user costs. Chen and Schonfeld then extended the previous study by introducing accident costs and traffic distributions (Chen and Schonfeld 2004). The authors developed a mathematical program to determine TTC zone lengths, work durations, starting times, pausing times (if any), and control-cycle times for 1L2W TTC zones. Optimum lengths and schedules were found to be sensitive to input parameters such as TTC zone set up cost, idling time cost, and work duration. The effectiveness of temporary rumble strips with TTCSs has been investigated in the litera- ture. In 1999, the Kansas Department of Transportation (KDOT) evaluated a removable orange rumble strip at a signal-controlled 1L2W bridge in rural Kansas (Meyer 2000). The test site was a two-lane highway bridge with an ADT of 1,440 vpd and a posted speed limit of 30 miles per hour (mph) in the TTC zone and 65 mph elsewhere. Speed data were collected at six loca- tions upstream of the closed-lane section and, to remove the effects of platooning, records with 5 seconds or more headway were considered in the analysis. Results showed that rumble strips significantly reduced mean speeds and 85th percentile speeds for both passenger cars and trucks. Sun et al. conducted a field study on a signal-controlled 1L2W operation in Missouri (Sun et al. 2011). The field site was a bridge located on Route 17 with a posted speed limit of 50 mph. The speed limit was reduced to 40 mph through the TTC zone. Results of the analysis indicated that deployment of rumble strips increased the number of vehicles that braked by more than 10%, reduced average speed up to 3.7 mph, increased speed compliance of the brak- ing vehicles by 2.9%, and increased the number of lane crossovers by 8.79%. Researchers also evaluated two different rumble strip configurations: (1) rumble strips deployed perpendicular to the road and (2) rumble strips deployed at an angle (approximately 60°) to the centerline of the road. No significant differences were found between the two configurations in braking and speed reductions; however, the perpendicular deployment significantly increased the number of lane crossovers. Pilot Car Operations The pilot car method uses a pilot vehicle to lead a queue of vehicles through a one-lane section (FHWA 2009). The pilot car method can be used to maintain vehicle speeds, guide drivers through a work site, and consequently improve safety within a one-lane section; these effects make the pilot car method appropriate for long distance and/or complex one-lane sections. Figure 2-11 shows an example of a pilot vehicle. When a pilot car is used to control a 1L2W operation, the MUTCD requires that a flagger shall be stationed on the approach to the one-lane section until the pilot vehicle is available (FHWA 2009). The MUTCD is silent about the combined use of TTCSs and a pilot car to control 1L2W operations; however, it does not prohibit such a combined traffic control. FHWA provided an interpretation (FHWA 2010) for the use of a TTCS with a pilot car and stated that such a com- bination is allowed if a flagger is stationed on each approach. The use of flagger is required due to the following reasons: ⢠When a pilot car is used, usually the one-lane section is lengthy, and thus the waiting time for queued vehicles is long. The presence of a flagger can assure drivers that the TTC zone is active; ⢠Drivers encountering long red phases with no flagger at a TTCS might get impatient and decide to proceed into the TTC zone; and ⢠In cases of noncompliant drivers that enter the TTC zone, a flagger can alert the pilot car and the work crew. The pilot car method has been successful in maintaining safe vehicle speed and guiding drivers especially in TTC zones with low traffic volumes and few side roads. An ODOT safety audit
22 Practices in One-Lane Traffic Control on a Two-Lane Rural Highway reported that in 2013, pilot cars were most effective when ADT was low (e.g., ADT less than 2,000 vpd) and there were minimal side roads (ODOT 2013). In TTC zones with higher traffic volumes (e.g., ADT more than 3,500 vpd) or in TTC zones with several side roads and cross traffic and distances of more than 1 to 2 miles between flaggers, the pilot car method was not successful in minimizing traffic delay. Debnath et al. conducted a field study to examine the effectiveness of pilot car operations in Australia (Debnath et al. 2014). Data for five consecutive days were collected at a TTC zone with a posted speed limit of 40 km/h (25 mph). A pilot car was available during the daytime hours of 3 days. Results of the analysis revealed that when a pilot car was present, average vehicle speed was significantly lower than without the presence of a pilot car. Also, the pilot car presence decreased the proportion of vehicles exceeding the speed limit. Replacing flaggers with TTCSs during pilot car operations can potentially improve flaggersâ safety and reduce operational costs. To investigate this, TxDOT submitted a request to FHWA to experiment with the use of TTCSs and pilot cars with and without flaggers (Carlson et al. 2015). Upon FHWA approval, a field study was performed in May and October of 2013 to evaluate driv- ersâ compliance with the TTCSs and pilot cars with and without flaggers. Results of the study indi- cated that 2.7% and 2.3% of drivers did not comply with the 1L2W traffic control method with and without flaggers, respectively (Finley and Theiss 2017). There was no significant difference between violations of the two studied conditions. In another study, Schrock et al. evaluated the use of TTCSs and pilot car with and without flaggers in the state of Kansas (Schrock et al. 2016b). Different cases were analyzed: flagging only, TTCS and pilot car with flagger, and TTCS and pilot car without flagger. Results showed that in terms of average total wait time, average queue length, and average green interval time, all three cases provided similar operational efficiency. However, the TTCS and pilot car with flagger case resulted in significantly lower violations in comparison to the no flagger case. Red light running violations under the flagger only, TTCS and pilot car with flagger, and TTCS and pilot car without flagger cases were 1.1%, 1.3%, and 3.1%, respectively. The pilot car method is often employed in long TTC zones and, consequently, stopped vehicles could wait for a relatively long time. Informing drivers about their expected wait time might help drivers to be patient and thus improve the safety of the TTC zone. KDOT and Kansas State Figure 2-11. Example of a PILOT CAR FOLLOW ME sign mounted on the rear of an official safety vehicle (Courtesy: MoDOT Highway Safety and Traffic Division).
Literature Review 23 University conducted a three-phase study to identify the most cost-effective method of informing drivers of delay time when approaching a 1L2W TTC zone with a pilot car (Hobson 2012, Rys and Jacob 2009, Rys et al. 2012). Out of six different notification systems, a countdown timer displayed on an approach sign was selected on the basis of measures such as cost, effectiveness, and ease of deployment (Rys et al. 2012). Then, a prototype was developed and tested in October 2008. The prototype system worked well, and KDOT continues to evaluate the system (Hobson 2012). Schrock et al. investigated the appropriate TTC zone length, traffic volume, pilot carâs round- trip time, and signal timings when pilot cars are used with TTCSs in Kansas (Schrock et al. 2016a). Saturation headway and start-up lost time were calculated by collecting field data over a 4-week period at four 1L2W TTC zones. The authors developed equations to calculate various measures including the length of the TTC zone, maximum feasible green interval, and round- trip time of the pilot car. Results showed that for maximum delay threshold of 15 minutes and maximum pilot car speed of 40 mph, TTCSs with the pilot car would fail at and above approxi- mately 7,083 vpd, and there would be no feasible length of the TTC zone. In order to enhance pilot car operations in 1L2W operations, KDOT investigated the effec- tiveness of a traffic warning sign named the Emergency Flasher Traffic Control Device (EFTCD) (Bai and Li 2009, Bai and Li 2011). The EFTCD required drivers to turn on their emergency flashers when stopped at 1L2W TTC zones to alert following vehicles approaching the TTC zone. Vehiclesâ speed with and without EFTCD were recorded on three 1L2W sections on rural highways with posted speed limits of 55 mph and 65 mph. Speed detection devices were located 550 and 450 feet upstream of the flagger stations in the 65 mph and 55 mph TTC zones, respec- tively. Results of the analysis showed that the proposed EFTCD reduced average vehicle speeds by 11.4% and 7.1% in the 65 mph and 55 mph TTC zones, respectively. The researchers also conducted a survey study to evaluate driversâ opinions of the EFTCD. Results indicated that 60% of the surveyed drivers thought that the EFTCD was an indication of a necessity for speed reduction, and 82% of the drivers recommended the use of the EFTCD in 1L2W TTC zones. PCMSs have been used with pilot car operations to control traffic in 1L2W TTC zones. Bai et al. (Bai et al. 2011) conducted field data evaluation and driver surveys to investigate the effectiveness of text, graphic-aided, and graphic PCMSs in reducing vehicle speed in a 1L2W TTC zone in Kansas. A pilot car and two flaggers (one flagger at each end) were controlling traffic in the TTC zone. The text PCMSs showed âWORKZONE AHEAD SLOWDOWNâ and âFLAGGER AHD PREP TO STOPâ messages, and the graphic PCMSs displayed two graphics similar to the MUTCD W20-7 and W21-1 signs. Graphic-aided PCMSs displayed both text and graphic messages. Results showed that when the text, graphic-aided, and graphic PCMSs were used, average vehicle speeds were decreased by 13%, 10%, and 17%, respectively. Findings of the driver survey indicated that the majority of drivers preferred PCMSs displaying graphics. Traffic Analysis A traffic analysis is needed for designing the layout and operation plans of 1L2W TTC zones. Traffic analysis can help transportation organizations to better understand site conditions, select suitable TTC methods, and save the trouble of dealing with unsatisfactory traffic conditions. There are currently few guidelines for 1L2W TTC zone traffic analysis, but studies on this topic provide some approaches that can be used in practice. The Highway Capacity Manual (HCM) provides definitions and calculation procedures for determining roadway and intersection capacity and delay (TRB 2010). In terms of TTC zones, the most recent edition of the HCM provides limited guidance. Several freeway TTC zone con- figurations are considered, but there are no considerations of 1L2W TTC zone configurations.
24 Practices in One-Lane Traffic Control on a Two-Lane Rural Highway The 6th edition of the HCM has updated the TTC zone capacity section, incorporating NCHRP Project 03-107, âWork Zone Capacity Methods for the Highway Capacity Manual,â research achievements. Additional details regarding traffic analysis in 1L2W operations are included in Appendix A. Treatments for Side Roads and Driveways The MUTCD describes signs on crossroads and driveways within TTC zones. An advance warning sign should be used on a crossroad or a major (high-volume) driveway where traffic can enter a TTC zone from the crossroad or the driveway (FHWA 2009). A Guide to Urban Work Zone Temporary Traffic Control provided several mitigation strategies regarding driveway or land access issues caused by temporary work on traveled way (Datta et al. 2016). The measures include the following: ⢠Use a flagger when facilitating alternate traffic or when roadside accesses are closed for a short period, ⢠Prohibit turning movement, ⢠Use alternate access where feasible, ⢠Use self-regulating traffic control devices for low-volume roads, and ⢠Use advance warning for lane closure and turn prohibition. Although Datta et al. did not specify the types of TTC zone operations, most of the listed measures are feasible for 1L2W TTC zone operations (2016). TTI researchers carried out a survey among different TxDOT districts (Finley et al. 2014) and found that all the respondent districts used human flagger control for access point traffic control in 1L2W operations. Almost one-quarter (22%) of the respondents also used barricades and cones to close low-volume access points. The top factor considered for the selection of access point traffic control measures was the demand or traffic volume coming from the access point (74%). Some districts used certain thresholds to determine whether a flagger was needed, but the thresholds varied widely. Main road demand and number of access points were the second and third most considered factors. In the survey, 17% of the respondents stated that if the main road volume was low, flaggers may not be used. One respondent mentioned that if the main road demand was over 15,000 vpd and there were concerns with the number of access points and/or access point demand, they consider completely closing the main road and providing a detour via another route. Some districts tried to use flaggers at all access points. TTC zone lengths were reduced by some districts when they tried to minimize the number of access points within a one- lane closure zone. TTC zone length and duration also influenced the decision to use a flagger at an access point. Apart from flaggers, sometimes pilot vehicles were used to guide traffic from access points. Some difficulties met in access point traffic control include the following: ⢠Distracted motorists and motorist inattention (43%); ⢠Not enough flaggers, making it hard to cover all access points (22%); ⢠Lack of an indication of what action motorists need to take at access points (9%); ⢠Access points located too close to traffic signals, resulting in vehicles getting backed up at access point (4%); and ⢠Motorists exiting from the access point and coming into the TTC zone the wrong way (4%). Apart from flagging and TTCSs, there are several devices that can be used in access point traf- fic control, as mentioned in the report by TTI researchers (Finley et al. 2014): ⢠A push-button device, which is similar to an electronic gate-opener where a driver from an access point needs to push a button to gain access to the main road;
Literature Review 25 ⢠A modified STOP sign device with yellow light-emitting diode (LED) arrows indicating the allowed direction of travel; ⢠A hybrid signal device with solid red indicating âstop,â flashing yellow indicating âproceed with caution,â and yellow arrow indicating âprepare to stopâ; and ⢠A blank-out sign device with solid red and red circle/slash for both left- and right-turn arrows indicating, âstop,â and flashing red and left- or right-turn arrow without red circle/slash indi- cating left- or right-turn permitted with caution. Additional discussions about hybrid signal and blank-out sign devices are presented in Chapter 4. Equipment to Augment Manual Flagging There are various types of equipment to augment manual flagging in 1L2W TTC zones. STOP/SLOW paddles are used to enhance the visibility of flagging commands while portable stop bars can be utilized to mark the limits of a TTC zone. Equipment such as flagger mirrors are also used to enhance the vision of flaggers. In general, these types of equipment are used to help strengthen TTC zone traffic control and improve flagger safety. STOP/SLOW Paddles The MUTCD states that the STOP/SLOW paddle should be the primary and preferred hand- signaling device because the STOP/SLOW paddle gives road users more positive guidance than red flags (FHWA 2009). MUTCD also provides detailed guidance on the use of STOP/SLOW paddles: ⢠The STOP/SLOW paddle should be fabricated from light semi-rigid material and optimally placed on a tall, rigid staff; ⢠Lights can be installed on the STOP/SLOW paddle to improve its visibility, but the color, number, shape, and flashing rate of the light need to follow corresponding standards; and ⢠Procedures for flaggers to follow when using the STOP/SLOW paddle are also included in detail. During the Strategic Highway Research Program (SHRP) Maintenance Work Zone Safety Project, several devices were designed, developed, and tested in TTC zones (Stout et al. 1993). A flashing STOP/SLOW paddle (FSSP) and a PRS were tested in 1L2W TTC zones and success- fully passed the evaluation stage. An FSSP is similar to a standard flagger paddle with two lights mounted above and below the STOP message and is intended to increase the conspicuity of the flagger/paddle system. As part of the SHRP program, FSSP was tested in a 1L2W operation with human flagger control in Texas. Field speed study aimed to determine driversâ responses to the FSSP. Vehicle speeds at the flagger station and two upstream locations were recorded. Results of the analysis showed that the device did not significantly affect the average vehicle speed upstream of the TTC zone. The effectiveness of FSSP could not be evaluated at the flagger station due to a small sample size; however, workers believed that the device was useful in alerting oncoming drivers and enabling a flagger to see whether the other flagger was stopping or slowing traffic. During the SHRP program, PRS was tested in a 1L2W zone in Ohio, and it was shown that use of the PRS reduced average vehicle speeds and increased driver recognition of TTC zone signing. Schrock et al. evaluated four types of paddles including a passive paddle, a paddle with LED edge lighting, a paddle with LED-lighted words âSTOPâ and âSLOW,â and a paddle with two flashing LED arrays (Schrock et al. 2009). The paddlesâ batteries were tested by keeping the lights on until they ran out of power for examination of usability and feasibility in TTC zones. In addi- tion to field studies, focus group meetings were also held to obtain information directly from users to help evaluate the paddles. It was found that technology-enhanced STOP/SLOW paddles have potential for increasing the conspicuity of flaggers, even under bright daylight conditions.
26 Practices in One-Lane Traffic Control on a Two-Lane Rural Highway The tests were carried out during daytime, so nighttime evaluation was not a part of the study, but Schrock et al. suggested that a nighttime evaluation could show both the potential of the devices as well as help refine strategies for their use that maximize safety. Portable Stop Bars Stop bars or stop lines are often used at stop-controlled or signal-controlled intersections to mark points at which drivers should stop before crossing the pedestrian crosswalk or entering the intersections. Stop bars are usually painted on the pavement for intersections. When used at TTC zones, stop bars can help communicate the flaggersâ message to stop approaching drivers (Ullman et al. 1987). However, painted stop bars are not practical for minor TTC zone opera- tions or short-term operations, as they cost labor to install and remove and leave scratches on pavement. A reusable, temporary stop bar can fit the needs of short-term TTC zones. Ullman et al. used a stop bar made of rubber and consisting of six interlocking sections. When placed on the pavement, the stop bar was 12 inches wide and 10 feet long. In field tests for the study, the rubber temporary stop bar reduced the variability of driversâ stopping locations. The temporary stop bar, due to its light weight, was not very stable when large trucks traveled over it, but this problem could be solved by using adhesive to mount the stop bar to the pavement. Mirrors Flagger mirrors are mounted on flagpoles or flaggersâ hard hats to enable flaggers to view the environment behind them. Studies on flagger mirrors are limited, but Stevens, Jr., et al. carried out an evaluation of the effectiveness of different types of plane and convex mirrors (Stevens Jr. et al. 2009). Fields of view, object magnifications, and human factor considerations were the per- formance measures used in the study for the comparison of mirrors. One helmet-mounted and five flagpole-mounted mirrors were studied with the help of computer-aided design drawings and field tests. Results showed that although convex mirrors offer larger fields of vision, plane mirrors performed as well as convex mirrors when mounted on a helmet. The helmet-mounted mirror was found to be the best option for flaggers. It is difficult for a flagger to view the flagpole- mounted mirror and keep an eye on the traffic in front of them. Stevens, Jr., et al. also suggested that mirrors should always be used in conjunction with appropriate traffic control plans and additional safety treatments such as physical barriers. Flagger Apparel Chapter 6E of the MUTCD provides a standard that requires flaggers to wear high-visibility safety apparel: The apparel needs to meet the Performance Class 2 or 3 requirements of the ANSI/ISEA 107â2004 pub- lication entitled âAmerican National Standard for High-Visibility Apparel and Headwearâ and labeled as meeting the ANSI 107-2004 standard performance for Class 2 or 3 risk exposure. The apparel background (outer) material color shall be fluorescent orange-red, fluorescent yellow-green, or a combination of the two as defined in the ANSI standard. The retroreflective material shall be orange, yellow, white, silver, yellow- green, or a fluorescent version of these colors, and shall be visible at a minimum distance of 1,000 feet. The retroreflective safety apparel shall be designed to clearly identify the wearer as a person. The newest American National Standard for High-Visibility Apparel and Accessories (ANSI/SEA 107-2015) has updated the requirements for high-visibility apparel and accessories; thus, future work zone manual flagging practices should follow the ANSI 107-2015 standard. The ANSI 107-2015 standard added a new âTypeâ structure, classifying garments into five types: ⢠Type âOâ for off-road use; ⢠Type âRâ for roadway use;
Literature Review 27 ⢠Type âPâ for fire, police, and emergency medical services (EMS) personnel use; ⢠Supplemental items including garments with legs and gaiters; and ⢠Accessories including gloves, arm or leg bands, and headwear. In the ANSI 107-2015 standard, up to 72-inch square of compliant background material and up to 22-inch square of compliant retroreflective material can be covered by logos, identification panels, or lettering without subtracting the covered amount from minimum totals, as required in previous editions of the standard (3M 2016). Schrock et al. evaluated four types of flagger vests using a focus group study. The evaluated vests were (1) a Class II fluorescent yellow safety vest with reflective striping, (2) a Class II fluo- rescent yellow safety vest with reflective and orange striping, (3) a fluorescent yellow mesh safety vest with LED lights and reflective striping, and (4) a fluorescent yellow safety vest with LED lights and reflective and orange striping (Schrock et al. 2009). Photos of the evaluated vests are shown in Figure 2-12. All participants were asked to list the vests they received or used for TTC zones and evaluate and rank the vests. The standard fluorescent yellow vest with reflective and orange striping was ranked the highest in all four categories: usability (1.50), conspicuity (1.71), durability (1.50), and preferred (1.43). The participants were concerned about the usability, durability, and washability of vests with LED, and thus they did not receive higher rankings. Night Flagging In comparison to daytime work, nighttime maintenance and construction have the advan- tage of easier occupying of the work area with less impact on traffic flow. However, the dis- advantages of nighttime maintenance and construction are that they pose more risk to drivers and roadway workers due to visibility limitations, lighting conditions, a higher percentage of impaired drivers, and other nighttime-related human factor issues. In 43% of TTC zones, poor lighting conditions were the major contributing factor to nighttime accidents; while in 21% of TTC zones, factors related to safety garments were the major contributing factor to nighttime accidents (Arditi et al. 2005). For transportation organizations, it is important to improve worker visibility and the lighting conditions of the TTC zone during nighttime maintenance and construction. For nighttime flagging, flagger apparel should meet the Performance Class 3 requirements (FHWA 2009). Guidelines for design and operation of nighttime traffic control are provided in NCHRP Report 476 (Bryden and Mace 2002). A typical application for nighttime 1L2W opera- tion using the flagger control method is shown in Figure 2-13. The MUTCD requires illumination for flagger stations at night, but does not provide specific standards or guidelines on nighttime flagger station lighting (FHWA 2009): Except in emergency situations, flagger stations shall be preceded by an advance warning sign or signs. Except in emergency situations, flagger stations shall be illuminated at night. NCHRP Report 498 presents illumination guidelines for nighttime highway work. The guide- lines present three illumination requirement categories with suggested target illumination values. For general illumination in the work zone, NCHRP Report 498 recommends Category I (illumina- tion of 54 lux or 5 foot-candles), primarily from a safety perspective, in areas of crew presence or movement (Ellis et al. 2003). Various types of temporary lighting systems are available including portable light plant towers, balloon lighting, roadway luminaires mounted on temporary poles, and factory- installed lights on equipment (ATSSA 2013b). Conventional light plants used metal halide;
28 Practices in One-Lane Traffic Control on a Two-Lane Rural Highway (a) fluorescent yellow with reflective trim (b) fluorescent yellow with reflective and orange trim (c) yellow mesh with LED lights and reflective trim (d) fluorescent yellow with LED lights and reflective and orange trim Figure 2-12. Safety vests evaluated (Schrock et al. 2009). however, new technologies such as LED, halogen, and compact fluorescent lamps have been introduced. LED has instant restrike time, while start-up time in metal halide lamps is slow (Creed et al. 2013). In practice, light towers are the main lighting system used for illuminating flaggers, and there is a lack of guidance on flagger station illumination. Gambatese and Rajendran point out that previous research on flagger lighting was in a lab-based setting that simulates actual roadway conditions, but that field-based studies of flagger station lighting are critical because of the pos- sible impacts of illumination on flaggers and motorists (Gambatese and Rajendran 2010). Three
Literature Review 29 Figure 2-13. Typical application for nighttime flagging (Bryden and Mace 2002).
30 Practices in One-Lane Traffic Control on a Two-Lane Rural Highway types of light equipment including a 12-V spotlight, a 12-V high-intensity discharge (HID) floodlight, and a light tower with a 2,000 W output were evaluated by Gambatese and Rajendran. Outcome measures used by the researchers were the following: ⢠Illumination of the flagger, ⢠Illumination of the flagging area, ⢠Driver glare from the light equipment, ⢠Flagger glare from the light equipment, ⢠Operability of the light equipment, ⢠Maneuverability of the light equipment, and ⢠Effect of site features on use and effectiveness of the light equipment. At the test sites, passing motorists and flaggers were asked to provide ratings of the illumina- tion performance of the selected lighting equipment on the flagging area and flaggers, as well as the amount of discomfort or glare produced by the lighting equipment. Results showed that 12-V spotlight and 12-V HID floodlight performed satisfactorily in illuminating the flagger and the flagging area, while the light tower performed even better than the spotlight and floodlight. Flaggers felt unsafe using 12-V lighting equipment due to the limited amount of light produced by the 12-V systems. The disadvantage of using a light tower was the distracting glare produced by the system according to the comments of interviewed motorists. Flaggers also complained about the uncomfortable glare from the light tower. Gambatese and Rajendran (2010) also found that project sites containing a greater number and intensity of surrounding artificial lights require lights with greater output. Project site fea- tures and flagging operations can affect the quality of flagger illumination, and these character- istics need to be considered when selecting and setting up lighting equipment. Gambatese and Rajendran carried out another study and evaluated four different types of light equipmentâa light tower, 12-V spotlight, 12-V HID floodlight, and balloon lights (Gambatese and Rajendran 2012). The levels of illumination, uniformity, and visibility were evaluated. Forty-four different configurations of light equipment were created with different combinations of lamp output, offset angle, and luminaire height. Field tests were performed with settings of two nighttime lighting environments: natural light- ing (i.e., from moon and stars) only and natural lighting with additional background artificial lighting nearby, representing rural and urban/suburban TTC zone conditions, respectively. A test grid was marked on the pavement to measure illuminance of the flagging area. A light meter and a laptop computer were used to collect illumination data from each grid point. Ratings were given to outcome measures using a scale of 1 to 5 (1 = highest, 5 = lowest) based on review of test data and recommended values from previous literature. An average rating was then calculated for each outcome measure. Results showed that a light tower with 2,000 W output, zero degree offset angle, and raised to a height of 20 feet ranked the highest among the four types of equipment. However, when considering ease of use, mobility, and cost as extra measures, a 12-V spotlight with zero degree offset angle raised to a height of 10 feet ranked the highest. Smaller light systems were found to be easier to operate and transport, inexpensive, and more applicable to short-term flagging operations and operations that need to be relocated frequently. Highly ranked configurations were typically those at zero degree offset with luminaires elevated to 10 feet or higher. Con- figurations with higher luminaire heights and lamp outputs from 250 to 2,000 W may perform better depending on roadway setting, duration of flagging operation, and amount of artificial background lighting.
Literature Review 31 Enhanced/Electronic Advance Signing The MUTCD provides detailed standard and guidance on signing for highway TTC zones (FHWA 2009). Apart from the general regulatory, warning, and guide signs, the MUTCD also provides standards and guidance on enhanced/electronic signing options such as PCMSs. PCMSs have the flexibility to display a variety of messages and the ability to display real-time information in advance of the point where actions must be taken. PCMSs are applied in many traffic management situations where advance warning and information are useful. The major purpose of using a PCMS in TTC zones is to advise road users of unexpected situ- ations. Components of a PCMS should include a message sign, control systems, a power source, and mounting and transporting equipment. The front face of the sign should be covered with a protective material. Detailed guidance and standards about the use of PCMSs such as color, brightness, visibility, volume of message, and display techniques are also provided in the MUTCD. Guidance for the Use of Portable Changeable Message Signs in Work Zones provides details on the design, message, placement, and cost of PCMSs (FHWA 2013). Three applications of PCMSs in TTC zones, including speed management, inattentive driving, and demand management, are also introduced. There are multiple design alternatives to choose from for a PCMS, including light-emitting technology (LED, flip-disk, fiber-optic, or hybrid), sign size, matrix type (full, continuous line, or modular/character matrix), controls/message programming (remote or on site), mounting (trailer-mounted or truck-mounted), and power (solar, battery, or generator). In terms of message, Guidance for the Use of Portable Changeable Message Signs in Work Zones gives several suggestions about content, length, character size, phasing, and required reading time (FHWA 2013). In terms of PCMS placement, it is suggested that PCMSs should be placed on the shoulder or median that is closest to the lane to which the message applies, preferably with guardrails or barriers. PCMSs should be rotated 3 degrees toward the road- way to reduce glare. PCMSs should be placed after initial TTC zone warning signs, but in advance of the TTC zone, without blocking or obstructing other warning signs. PCMSs should be legible and readable and should always be well maintained so that the whole message can be conveyed. Initial costs of PCMSs vary based on size, matrix type, power options, remote control ability, and any additional features. However, cost throughout operation and maintenance should also be considered when selecting a PCMS (FHWA 2013). Application of PCMSs for speed management is mostly carried out in these situations (FHWA 2013): ⢠High incidence of speeding drivers; ⢠High speed variance between vehicles; ⢠High incidence of rear-end crashes; and ⢠TTC zone design that includes a pattern change, lane closure, or flagging operation, as these would tend to increase speed variance within the TTC zone. To address the issue of inattentive driving, PCMSs are often applied in these situations (FHWA 2013): ⢠Long TTC zones (1 mile or longer); ⢠TTC zones within/around which unexpected queues form; and ⢠TTC zones with anticipated or observed turns, lane changes, and travel choices that are confusing or easy to miss.
32 Practices in One-Lane Traffic Control on a Two-Lane Rural Highway For demand management, PCMSs are mostly applied in these situations (FHWA 2013): ⢠Heavily traveled TTC zones (in which traffic volume exceeds roadway capacity considering construction) and ⢠TTC zones within which queues form often and/or cause major delays to traffic or construc- tion schedules. Considering the features of 1L2W TTC zones, PCMSs can be applied in 1L2W operations. The primary benefit of using PCMSs is that they can notify and warn drivers to be prepared for TTC zone operations, thus improving the safety of motorists and workers in TTC zones. Also, direct- ing traffic to alternate routes can help improve overall traffic efficiency in and around TTC zones. A number of studies have evaluated the effectiveness of PCMSs by looking at driversâ reactions to different types of signs, including static signs and PCMSs showing different messages (Brewer et al. 2006, Trout et al. 2010, Bai et al. 2010, Bai and Li 2011). Field tests or laptop-based surveys were used. Conclusions from these studies were the following: ⢠PCMSs displaying an approaching driverâs speed show considerable potential for reducing speeds and improving TTC zone speed limit compliance. However, drivers tend to maintain their original speed if there are no indications of active work or change of cross section. ⢠Speed limits posted on PCMSs should be realistic and should be confined as much as possible to specific areas where active work is taking place (Brewer et al. 2006). Researchers recommended the use of electronic speed limit signs with white LEDs instead of orange LEDs to improve the management of short-term TTC zone speed limits. Only nonwhite text displays are generally available with current PCMS technology. Therefore, PCMSs with speed limit information used at short-term TTC zones can only be a supplement to posted regulatory speed limit signs (Trout et al. 2010). A temporary traffic sign (TTS) (W20-1, âRoad Work Aheadâ) was more effective in reducing passenger car and semitrailer speeds than a PCMS showing âSlow Down, Drive Safelyâ (Bai et al. 2010). When a TTS and PCMS were used together, having the PCMS on reduced truck speeds significantly compared with having the PCMS off. Graphic-aided and graphic PCMSs were effective in reducing vehicle speeds upstream of 1L2W TTC zones. Driver survey results indicated that a majority of drivers preferred to have graphics displayed on PCMSs in TTC zones (Bai and Li 2011). End-of-Queue Warning According to FHWA, rear-end crashes (running into the rear of a slowing or stopped vehicle) are the most common type of TTC zone crashes (FHWA 2014). End-of-queue warning systems are used in TTC zones to warn drivers of approaching end-of-queue stopped or slowing traffic to reduce the number and severity of rear-end crashes and avoid drivers being surprised by stopped or slowing traffic. The systems usually consist of detectors upstream of TTC zones. When slow or stopped traffic is detected, a warning is triggered on a PCMS. Typical components of an end-of-queue system are PCMSs, detectors, and a server. More detectors can help the system to obtain more accurate data and give faster notifications. For urban areas, detectors are spaced 0.5 mile to 1 mile apart, while wider spacing is used in rural areas. Cameras can also enhance the monitoring ability of the system. The system can also be implemented where the queue lengths are known or predictable, with static signs and flashing beacons. End-of-queue warning systems have been used on freeways; however, these systems can be utilized in 1L2W operations as well.
Literature Review 33 Evaluation of Different Methods Several studies have evaluated different 1L2W traffic control methods. In 1987, Ullman et al. examined flagger, self-managed yield sign, and TTCSs in 1L2W TTC zones (Ullman et al. 1987). TTCSs were tested at three TTC zones on rural highways in Texas. Average annual daily traffic (AADT) at Sites 1, 2, and 3 were 600, 2,400, and 10,000 vpd, and the lengths of the TTC zones were 600, 2,600, and 1,100 feet, respectively. Results of the analysis showed at Site 1, average vehicle delay with the TTCS was significantly higher than with the human flagger control case. A human flagger and TTCSs at Site 3 resulted in similar average vehicle delays. It was concluded that at low traffic volumes, human flagger control provides better services to drivers in com- parison to a pre-timed TTCS. At higher traffic volumes, a pre-timed TTCS and human flagger control provide comparable service to drivers. When a TTCS was used, violation rates at Sites 1, 2, and 3 were 0, 0.005, and 0.004 respectively. For the self-managed YIELD sign control method, researchers analyzed various factors affecting driversâ gap acceptance and determined the condi- tions under which traffic will operate effectively. Figure 2-14 shows the proposed graph for determining maximum hourly volumes as a func- tion of the closure length. Drivers in the closed-lane approach were assumed to yield to traffic in the open lane. Ifie and Hinze explored the effectiveness of flagger, flagger assisted by a flashing red light, and STOP sign methods using limited field data near Cle Elum, Washington (Ifie and Hinze 1988). Data such as vehicle speed, queue length, and driversâ compliance were recorded on a two-lane, two-way rural highway near Cle Elum, Washington. ADT at the site was 1,950 vpd, and the length of lane closure was approximately 820 feet. Results of the analysis indicated that 50%, 75.4%, and 7.1% of the vehicles experienced no delay in flagger, flagger assisted with flashing red signal, and STOP sign methods, respectively. Average delays in flagger, flagger assisted with flashing red signal, and STOP sign methods, were 27, 22, and 72 seconds, respectively. In the human flagger method, two motorists did not comply, while in the flagger assisted by flashing red light method, all motorists complied with the control method. The STOP sign showed some Figure 2-14. Maximum hourly volumes as a function of the closure length for the self-managed yield sign method (Ullman et al. 1987).
34 Practices in One-Lane Traffic Control on a Two-Lane Rural Highway potential for effectively controlling traffic; however, the study authors stated that more data were required to make any conclusion. Recently, TTI researchers evaluated various 1L2W traffic control methods using field studies in Ohio (Finley et al. 2015). During the summer of 2014, researchers evaluated control methods including human flagger control, a Red/Yellow lens AFAD with two flaggers (one flagger at each end), a Red/Yellow lens AFAD with one flagger in the middle of the TTC zone, and pre-timed TTCSs at both ends. Information to assess driversâ compliance as well as vehicle delays was recorded at 15 1L2W TTC zones. AADT ranged between 520 to 9,230 vpd, and the lengths of the lane closures ranged between 700 and 3,430 feet. Results indicated that violation rates for flagger, AFADs with two flaggers, AFADs with one flagger, and TTCS methods were 0.1, 0.0, 0.5, and 47.1 violations per 100 stop cycles, respectively. The violation rate for the TTCS was significantly higher than for other methods. Ninety-nine percent of these violations occurred at the end of the proceed phase and involved either vehicles traveling at high speeds or vehicles that were stopped during the previous cycle and were going to be stopped again. TTI researchers also performed cost/benefit analysis for flagger, AFADs, and TTCS meth- ods (Finley et al. 2015). The safety impacts of traffic control methods were not quantified due to the unavailability of crash modification factors. For the human flagger control method, researchers assumed $18.00 per hour per person or $36.00 per hour per maintenance opera- tion with flaggers. For Red/Yellow lens AFADs, researchers received cost estimates rang- ing between $19,500 and $27,500 per pair ($23,500 per pair on average). An initial cost of $70,000 per pair of TTCSs was assumed. Costs of training, signs, maintenance, and extra setup and removal times were considered in the analysis. For AFADs with one flagger used for 28 days per year, a return on investment could be realized after 10 years. With a usage of 36 days per year, return on investment could be achieved in about 9 years for a TTCS. The research team concluded that AFADs are suitable for short-term operations (a few hours up to 1 day). For work with longer durations, TTCSs become more suitable. For roadways with high traffic volumes, TTCSs are preferred. Proper Method Selection Various factors need to be considered in selecting an appropriate method to control traffic in 1L2W TTC zones. Frick determined factors to be considered including the type of work, loca- tion, type of roadway, speed and density of traffic, the length of closure, time of day, and the environment of the area in the vicinity of the proposed project (Frick 1972). In 1981, Summersgill explored various methods such as no priority, signed priority (STOP signs), and TTCSs (both pre-timed and actuated) for controlling traffic in 1L2W TTC zones (Summersgill 1981). A simulation model was developed to determine capacity and average vehicle delay of the traffic control methods for a range of site lengths and traffic flows. Using the simulation model results, delay/flow and capacity/flow curves were developed. The study recommended selecting an appropriate method using the developed curves combined with an assessment of required visibility. In 1983, Michalopoulos and Plum investigated STOP sign, TTCS, and human flagger con- trol methods at 1L2W TTC zones (Michalopoulos and Plum 1983). Using a micro-simulation model, capacity and performance tables and figures were developed. The researchers performed a comparative analysis between STOP sign and TTCS methods. Figure 2-15 shows the proposed curves that can be used to determine the appropriate method (STOP sign or TTCS), which results in lower total vehicle delay during a design hour. Recommendations include using safety, visibility, and capacity factors in selecting an appropriate control method.
Literature Review 35 Summary A comprehensive literature review of U.S. and international sources was conducted to pro- vide background information on 1L2W traffic control practices and procedures. The literature review indicates that the human flagger control method has been widely deployed in 1L2W operations. Flaggers provide efficient traffic control in 1L2W TTC zones; however, flaggersâ exposure to traffic and lack of escape zones, flaggers standing in shadow areas, and the potential for lack of proper sight distance for drivers and flaggers in 1L2W TTC zones raises concerns about flagger safety. To improve flagger safety in 1L2W TTC zones, devices such as PRSs and PCMSs have been used. These devices are intended to inform drivers of a TTC zone ahead where they may be required to stop. Comprehensive evaluations of advance flaggers, flag transfer, and self-managed control methods do not exist in the literature. Several studies have evaluated the effectiveness of AFADs in 1L2W operations. Although some studies report noncompliant drivers, AFADs reduce flaggersâ exposure to traffic and improve safety. TTCSs and pilot cars are extensively studied in the literature. Pilot car operations are effective in maintaining safe vehicle speeds and guiding motorists through complex TTC zones. TTCSs were shown to provide safety benefits and operational flexibility in work zone traffic control. Figure 2-15. Selecting an appropriate method at 1L2W zones (Michalopoulos and Plum 1983).
