
3
Measurement and Analysis of Sustainable Diets from Production to Consumption
In Session 2, moderated by Diego Rose, Tulane University, New Orleans, Louisiana, speakers considered the challenges and opportunities entailed in measuring diet and measuring and modeling the human and environmental health impacts of dietary change and other sustainable diet strategies. Highlights of the presentations are provided in Box 3-1.
MAPPING FOOD SUPPLY AND DEMAND: DATA INPUTS, METRICS, AND MEASURES
Ashkan Afshin, Institute for Health Metrics and Evaluation (IHME), University of Washington, Seattle, provided an overview of the methods being used by the Global Burden of Disease (GBD) project to address common challenges to collecting and analyzing dietary data. Because the challenges are similar to those faced when analyzing health systems, he explained, much of what GBD researchers have been doing over the past decade is essentially applying lessons learned about the health system to the food system. Generally, he elaborated, they have been systematically identifying all relevant data sources and then harmonizing those data across the various sources and correcting for known biases, estimating all quantities of interest and the associated uncertainty and communicating the uncertainty level for each quantity to the public and policy makers, ensuring internal consistency in the data, and harnessing new data sources and new data processing methods to improve and update existing estimates.
Comparing and Combining Dietary Data from Different Sources
According to Afshin, a key challenge with dietary data is that they are limited and scattered. Not all of the data are in the public domain, and what data are available are inconsistent across countries, as well as across sources within countries. Moreover, there are no links between agricultural and nutrition and health data. In other words, Afshin said, there is no food systems approach in the data collection.
The range of data on which GBD relies, Afshin continued, includes food availability data from the United Nations (UN) Food and Agriculture Organization (FAO), data on sales and purchases from Euromonitor, data on household expenditures on food from household budget surveys, dietary consumption data from both 24-hour dietary recalls and food frequency questionnaires, and biomarker data (e.g., to assess daily sodium intake). He observed that each of these types of data has both limitations and strengths. In fact, he said, one lesson IHME has learned over the years is that no single data source is perfect. To illustrate, he noted that food availability data have excellent coverage over time and across geography, but they do not reveal anything about consumption, such as age or sex patterns. On the other hand, dietary recall data are good in terms of providing data on age and sex patterns of consumption, but there is no good geographic representation of those data. And, Afshin added, there are limited nationally representative 24-hour dietary recall surveys that show trends over time. He explained that although sales data can be helpful for understanding consumption, they are generally not of good quality in low- and middle-income countries, they only help to understand recent trends in consumption, and reveal nothing about age or sex patterns. Finally, he noted, the limitation of biomarker data is that they are so sparse.
Again using lessons learned from health system analyses, Afshin reported, GBD researchers have been trying to combine these various sources of data, adjust for known biases, and make the data as comparable as possible. He explained how in past cycles of GBD, conventional statistical models were used to make the data comparable by first matching data by location, age group, sex, and time period, and then estimating relationships among the data in locations where there were enough data to do so and applying those relationships to other locations. More recently, he added, in the last round of GBD, the researchers tried some more advanced techniques involving machine learning and artificial intelligence to characterize relationships among the data. He noted that these novel methods significantly improved the estimation process. To illustrate, he described how the researchers modeled intake based on availability data by age, sex, and GBD super region (all countries are categorized into seven super regions, based on location), and then used those same data to train two different
machine-learning methods to predict intakes based on data not yet seen and assess what is known as the out-of-sample predictive validity. He reported that for vegetable-related data, compared with an out-of-sample correlation of 0.45 for the conventional statistical model, both machine-learning methods significantly improved out-of-sample performance, with correlation coefficients of 0.95 and 0.92, respectively. The same performance comparison was carried out for all food groups included in GBD, as well as all nutrients. For many food groups or nutrients, the machine-learning models’ out-of-sample correlations were around 0.80, Afshin said.
Afshin went on to explain that, after being made comparable, the data are combined to generate a single estimate of dietary consumption, again by age, sex, location, and year. This is done using a statistical method known as spatiotemporal Gaussian process regression to generate country-level estimates of intake (e.g., red meat in grams/day). Afshin added that this process is updated annually to include new data. He noted that, because high-quality consumption data were not available, the researchers’ dietary estimates in earlier years (before 2000) were informed mainly by FAO food availability data and scattered data from household budget and dietary consumption surveys. In more recent years, however, their dietary intake estimates have been informed by more data from household budget and dietary consumption surveys. Again, Afshin noted, this single estimate, which represents the mean intake of each dietary factor, is generated for all dietary factors included in GBD by age, sex, location, and year.
Once this process has been carried out, Afshin continued, mean intakes in each country can be compared with recommended intakes. For example, as shown in Figure 3-1, fruit intake in much of the world is below the recommended level, whereas for the same sex and age group (males aged 45 to 49 in this example), red meat intake in many countries is above the recommended level. For nuts and fruits, Afshin reported, there is a huge gap at the global level between current consumption and recommended intake. The same is true of specific nutrients, such as omega-3 fatty acids, with the exception of Japan and other high-income Asia Pacific countries.
According to Afshin, in addition to comparing current and recommended intakes, GBD dietary data can be used to evaluate and answer other questions, such as how people replace different food items. For example, one of the most recommended replacements with respect to fatty acid intake is to replace saturated fat with polyunsaturated fat. In reality, however, people do not make that replacement, Afshin said; instead, they replace saturated fat with carbohydrates. Epidemiological evidence, he added, shows that saturated fat and carbohydrates are equally harmful.
Because not everyone consumes dietary factors at the mean level, Afshin continued, the next step is to estimate the distribution of usual intake for
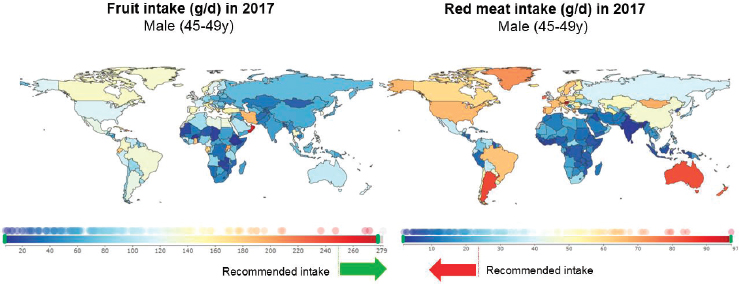
NOTE: Measurements of fruit and red meat intake are both in grams/day (g/d) and both for males aged 45 to 49, based on Global Burden of Disease modeling.
SOURCE: Presented by Ashkan Afshin on August 1, 2018.
each dietary factor. Usual intake, as opposed to 1-day intake, corrects for daily within person variation, he explained.
Other Challenges to Analyzing Dietary Data
Afshin went on to observe that, in addition to comparing and combining dietary data from different sources, there are other challenges to measuring the human diet. He briefly mentioned a few of these, beginning with how diet should be defined. Should it be defined in terms of nutrients, food, or dietary patterns? Should absolute intake or diet composition be measured? According to Afshin, different approaches and measures have different advantages and disadvantages and different implications for estimating health effects. He noted that, although GBD’s focus has traditionally been on health effects, the implications differ for potential environmental impacts as well.
Afshin went on to cite as another challenge that the definition of dietary factors varies across studies. He gave the example of the definition of “whole grain,” which varies widely across studies, encompassing different categories of food items (e.g., breakfast cereals, brown rice, brown rice flour, buckwheat, nonwhite bread, and oats in one study, versus added bran, added wheat germ, brown rice, brown rice flour, buckwheat, bulgur, oats, popcorn, and psyllium in another). In Afshin’s opinion, whole grain is perhaps one of the most challenging food groups to define. In addition, fruit, which may seem straightforward, is in fact a highly heterogeneous food group, with different fruits having different nutrient profiles, and
therefore different health and environmental impacts. Moreover, Afshin observed, people have very strong opinions about what should be considered a fruit. For example, he pointed out, some people think cucumbers, tomatoes, and eggplant are fruits, while others do not. With nuts too, he continued, some people argue for a botanical definition, yet peanuts, which are a legume, not a tree nut, are lumped together with tree nuts in the nut food group because they have identical nutrient profiles. He explained that GBD’s approach to handling this challenge is to extract data at the food item level wherever such data exist and then use coding to regroup food items as necessary, depending on how the data will be used.
Afshin identified serving size as yet another challenge, particularly for food questionnaire data. He noted that a common question on food questionnaires is the number of servings an individual consumes, adding that while it might be straightforward to convert an apple serving to grams using the U.S. Department of Agriculture’s (USDA’s) Food Composition Database (in which one apple is 182 grams), converting a serving size of broccoli into grams depends on whether the broccoli is cooked or uncooked and on how it is consumed. Thus, he cautioned, many assumptions must be made, and for some food items, such as a pat of butter, serving size must be determined arbitrarily. He cited as another serving size challenge that defined serving size varies across studies, even in the same country. For example, a serving of salmon may be defined as 3 to 4 ounces in one study but as one can or half of a fillet in others.
Final Remarks
To summarize, Afshin highlighted five key lessons learned by GBD. First, dietary data are far from being optimal. Second, despite these limitations, multiple lines of evidence show that diet is an important risk factor for the health of people and the planet. Third, echoing one of Fanzo’s key messages, Afshin said, “We cannot wait for perfect data in order to make decisions. Decisions have to be made now.” Fourth, as part of GBD, methods have been developed for making the best use of current dietary data to characterize the human diet and to inform decision making. Finally, Afshin asserted that new data sources and new data processing methods should be harnessed as they become available to improve and update existing dietary estimates, something GBD does through its annual updating.
DIETARY PATTERNS LINK HUMAN HEALTH AND THE ENVIRONMENT
David Tilman, University of Minnesota, Saint Paul, began by reporting that, based on the World Health Organization’s (WHO’s) analyses of
disease burden, it is now known that the dietary transition currently under way around the world is highly associated with declining health, especially in relation to noncommunicable diseases. Of the top 12 risks to health, he elaborated, 7 are diet-related worldwide (WHO, 2009), and 8 are in the United States (Holland, 2018). WHO projects that by 2030, noncommunicable diseases, such as diabetes, heart disease, and stroke, will account for the globally dominant disease burden (Aleksandrowicz et al., 2016).
Modern food systems are also a major cause of harm to the environment, Tilman observed, with an estimated 30 percent of global greenhouse gas (GHG) emissions coming from agricultural food production, including both crops and livestock (Aleksandrowicz et al., 2016). He called attention to two additional environmental impacts of agriculture. First, he noted that agriculture is a major cause of pollution in lakes, rivers, groundwater, and oceans (i.e., eutrophication). He pointed to the dead zone in the Gulf of Mexico as just one example. Every river in the world that drains a substantial agricultural area also has a dead zone, he added, signaling pollution of regional groundwater and harm to the quality of drinking water (Diaz and Rosenberg, 2008). He mentioned that people who live downwind of fertilized agricultural fields suffer health harms as well from exposure to fine particulate matter (PM2.5 particles) (World Bank and IHME, 2016). The second environmental impact of agriculture beyond GHG emissions, according to Tilman, is that it is responsible for land loss that represents the major threat of extinction for species on Earth. Many ecologists would assert, he stated, that eutrophication and extinction are co-equal partners with climate change as threats to the long-term sustainability of the support systems on which humanity depends.
Tilman went on to discuss each of these three environmental impacts—GHG emissions, eutrophication, and land loss—in greater detail, while also emphasizing their links, via diet, with human health.
Food and Greenhouse Gas Emissions
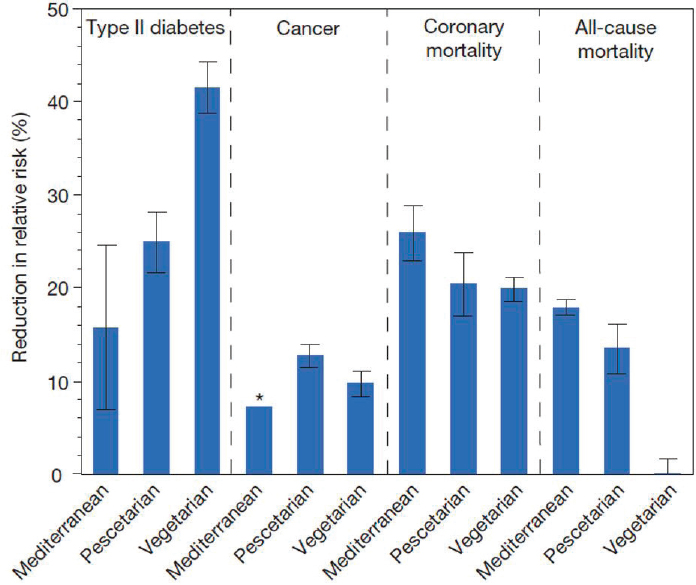
Turning first to GHG emissions, Tilman cited evidence indicating clear differences in contributions to GHG emissions among different foods. He noted that plant-based products, for example, are responsible for relatively low GHG emissions (see Figure 3-2). He added that although GHG emissions attributable to various foods are plotted per kilocalorie in Figure 3-2, the same observations apply per USDA serving size and, for foods that contain protein, per gram of protein (Tilman and Clark, 2014). Thus, not only are diets with reduced amounts of red meat associated with reductions in diabetes, cancers, heart disease, and all-cause mortality compared with a typical westernized diet (see Figure 3-3), but they also are associated with lower amounts of GHG emissions (see Figure 3-4). “Adoption of these diets
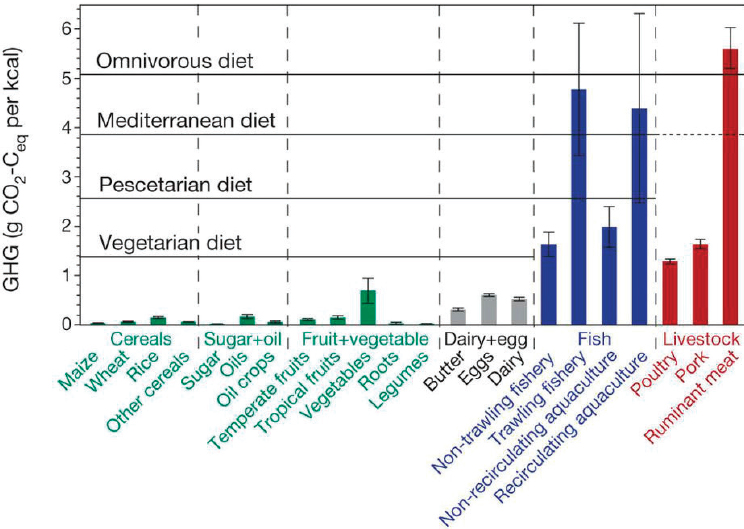
NOTE: GHG is measured in grams of carbon dioxide (CO2)-equivalent per kilocalorie (kcal).
SOURCES: Presented by David Tilman on August 1, 2018, modified from Tilman and Clark, 2014.
around the world could have huge implications,” Tilman argued (Tilman and Clark, 2014).
Tilman went on to state that by 2050, if current dietary trends toward consumption of more meat, more calories, and more empty calories continue, equivalent global carbon dioxide (CO2) emissions from crop production are expected to increase by about 2 gigatons (Gt) per year when measured in terms of the mass of carbon (C) (Tilman and Clark, 2014). He added that this figure is equivalent to increased annual global emissions of about 7.5 Gt of CO2, a little more than what is currently emitted by all transportation worldwide. “But if people adopted Mediterranean, pescetarian, or vegetarian diets,” he argued, “we could have … lower emissions in 2050 from agricultural food production than we have right now from it. Diet can be a big lever.” He pointed out, however, that while diet is a big lever, it is not the only lever for addressing sustainable diets, and he then turned to how crops are grown and the precision and efficiency of fertilizer and irrigation.
SOURCES: Presented by David Tilman on August 1, 2018, modified from Tilman and Clark, 2014.
Food and Eutrophication
According to Tilman, the eutrophication impacts of agriculture, especially nitrogen pollution of surface water, lakes, rivers, and streams, could increase by 70 percent or more over the next 50 years (Tilman et al., 2001). He noted that other researchers have put forth estimates of 100 percent or more. He remarked that people often think of maize as having a very high eutrophication effect, with leftover nutrients from the corn being grown in the United States draining down the Mississippi River and creating the dead zone in the Gulf of Mexico. Yet, he asserted, “this is nothing compared to beef.” He explained that the eutrophication potential of ruminant meat (per calorie) is much greater than that of maize because it takes about 15 kilograms of protein from grains to make 1 kilogram of edible beef protein. Thus, similar to the pattern depicted in Figure 3-2 with respect to GHGs, plant-based diets also have lower per capita eutrophication effects (Tilman and Clark, 2014).
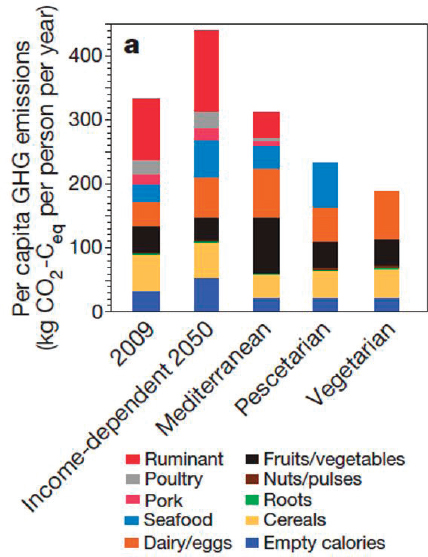
NOTE: GHG is measured in grams of carbon dioxide (CO2)-equivalent per kilocalorie per person per year.
SOURCES: Presented by David Tilman on August 1, 2018, modified from Tilman and Clark, 2014.
Another way to visualize the relationship between diet and eutrophication, Tilman continued, is to plot eutrophication impact against the relative risk of health impact. Again, he remarked, for unprocessed foods there is a clear relationship between the two: a linear change in food group–associated health impacts is associated with an exponential change in food group–associated eutrophication impact. For example, according to the data he shared, not only do whole grains pose the lowest relative mortality risk, but they also have among the smallest eutrophication impacts (Clark, 2018), and a dietary change that would reduce overall relative mortality risk from 1.5 to 0.85 would, on average, cause a 100-fold reduction in eutrophication impact. Tilman interpreted these results to mean that the dietary changes with “personally huge health impacts have even greater environmental impacts.”
But again, Tilman observed, diet is not the only lever. He mentioned the large body of research demonstrating how agricultural yields can be
retained with the use of roughly 20 percent less fertilizer if the fertilizer is applied more precisely—in other words, the right amount at the right time for a crop. To illustrate, he noted that crop yields (tons of protein per hectacre per year) in France, Germany, Italy, and Mexico increased from 1950 through 2009 even though nitrogen use (i.e., fertilization per hectacre) declined because of both new farm policies and higher fertilizer costs (FAO, 2009).
Food and Extinction of Species
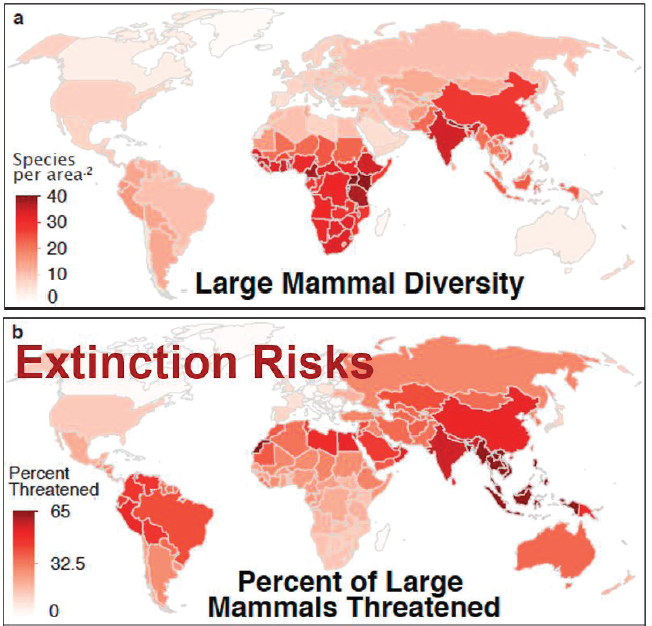
An analysis by the International Union for Conservation of Nature (IUCN) of all mammal and bird species worldwide, Tilman continued, found that the single greatest factor threatening species with extinction is land clearing, particularly land cleared for agriculture. The next-greatest threat, he reported, is logging, most of which is occurring in tropical countries; after being logged, such lands often become pastures or croplands. He identified direct hunting for food as the third-greatest threat to species extinction worldwide (Tilman et al., 2017).
Tilman went on to observe that most of the Earth’s remaining large mammals (i.e., larger than 10 kilograms, a bit larger than a small dog) inhabit the southern part of Asia, tropical Asia, and tropical Africa (see Figure 3-5). He added that the percentage of large mammals in sub-Saharan Africa that is threatened with extinction is relatively low compared with the percentage in southern Asia—as great as 60 to 85 percent (Tilman et al., 2017).
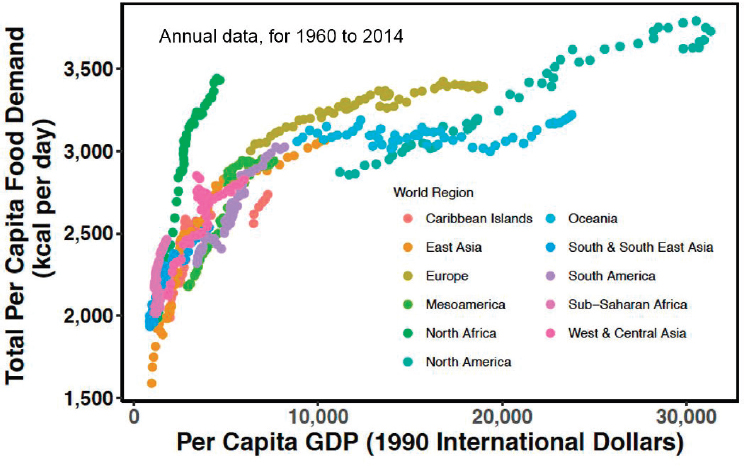
“But we have a world that is growing,” Tilman continued. According to the United Nations, there will be 1.7 billion more people living in sub-Saharan Africa in the next 50 years. This is also an area with rapidly growing economies, he observed, with people purchasing and consuming more food as their incomes rise. In fact, this trend occurs globally, with calories per day increasing as income rises (Tilman et al., 2017) (see Figure 3-6). Demand for meat shows a similar pattern. Tilman again mentioned that it takes about 15 kilograms of grain protein to produce 1 kilogram of edible beef and about 4 kilograms of grain protein to produce 1 kilogram of edible chicken. Thus, he noted, about 8,000 calories of crops must be grown per person per day to provide the approximately 3,500 calories of food that are brought into the home daily (per capita) and the 2,500 to 3,000 calories actually consumed (again, per capita) in a wealthy nation. According to Tilman, the net effect of the growing global population, taken together with the income-dependent dietary shift toward more calories—more meat calories in particular—and more crops to support production of those calories, will be about a 70 to 100 percent increase in global food production over the next 50 years. Based on the impact of this increased
SOURCES: Presented by David Tilman on August 1, 2018, modified from Tilman et al., 2017.
agricultural production on land clearing predicted by Tilman and colleagues (2017), the extinction risk for large mammals will double in Asia, dramatically increase in sub-Saharan Africa, and increase markedly in South America during this time period.
“The good news is that diet can help prevent some of this,” Tilman stated. Conversion of tropical ecosystems into cropland could be prevented, he argued, if people adopted more plant-based diets relative to today’s trends. For example, he suggested, about 600 million hectares of land could be saved if everyone converted to a vegetarian diet, and slightly less for a pescetarian diet (about 550 million hectares) or Mediterranean diet (about 450 million hectares) (Tilman and Clark, 2014). He pointed out that 600 million hectares is about two-thirds of the area of the United States and asserted that preventing that much land from being destroyed would have a major biodiversity benefit.
SOURCES: Presented by David Tilman on August 1, 2018, modified from Tilman et al., 2011.
In addition to diet, Tilman emphasized the powerful role of trade in preserving land that serves as a natural ecosystem. In fact, he suggested, if done to minimize future land clearing, exports of crops from nations with higher yields to those with lower yields might prevent about as much land clearing as could be forestalled by dietary shifts (Tilman et al., 2017) (see Figure 3-7).
Final Remarks
To summarize, Tilman described recent, unpublished work revealing a fairly tight log-linear relationship between diet-related health effects (mortality, heart disease, diabetes, and stroke) and diet-related environmental impacts across four different areas (GHG emissions, eutrophication, use of irrigation water, and land clearing). He interpreted these results to mean that even a relatively small shift toward healthier, more plant-based diets would have both health benefits and even larger environmental benefits. He noted, however, that there are some outliers, one being sugar-sweetened beverages, observing that foods with added sugars have relatively low environmental impacts but negative health impacts. On average, however, with some exceptions, “healthier foods offer greater environmental benefits,” he concluded.
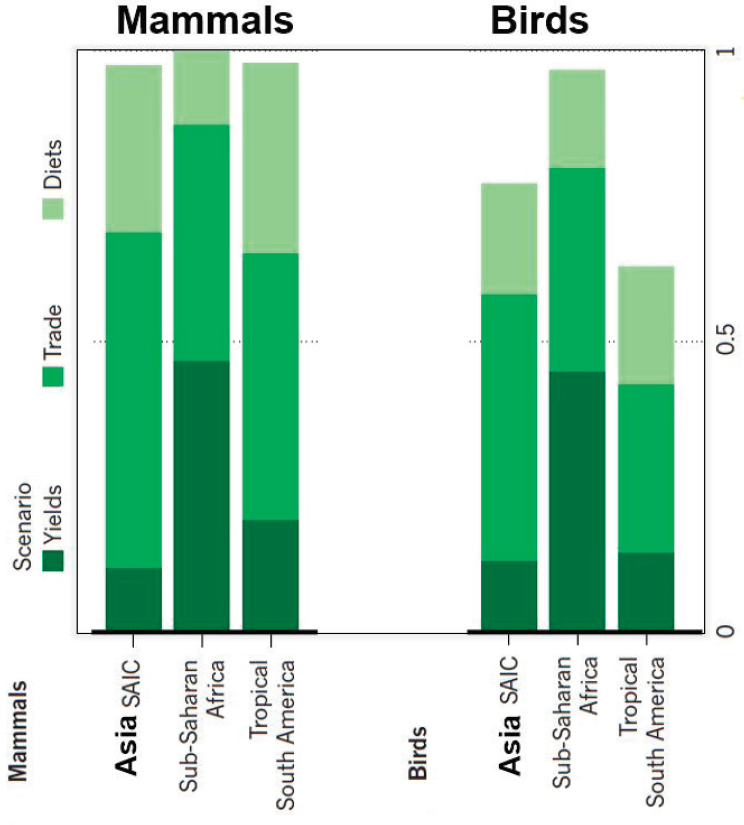
NOTES: SAIC = Southeast Asia, India, and China. Dietary shifts that prevent land clearing are depicted by upper lightly shaded bars; increased trade of crops from nations with higher yields to nations with lower yields are depicted by middle bars; and dietary shifts that increase yields are depicted by lower darkly shaded bars.
SOURCES: Presented by David Tilman on August 1, 2018, modified from Tilman et al., 2017.
WHAT MAKES FOR FOOD SYSTEMS THAT ARE SUSTAINABLE AND RESILIENT?
Mark Rosegrant, International Food Policy Research Institute (IFPRI), Washington, DC, offered a definition of sustainability similar to but slightly different from the 2012 FAO definition cited earlier by Drewnowski and others (see Chapter 2), but still a UN definition: “A sustainable food system is a food system that delivers food and nutrition security for all in such a way that the economic, social, and environmental bases to generate food security and nutrition for future generations are not compromised” (HLPE, 2017). In addition, he defined a resilient food system as “a system that is able to persist, adapt, and transform under conditions of uncertainty” (Folke et al., 2010). Starting with these definitions, he stated that the objective of his presentation would be to explore what policies, investments, and behavioral changes contribute to improving income, food security, and nutrition while reducing GHG emissions, the use of water and land, and the conversion of forests.
Challenges to Sustainable, Resilient Food Systems
Elaborating on points made by several other speakers, Rosegrant identified several challenges to achieving a sustainable diet, as detailed below.
Increasing Prevalence of Overweight and Obesity
Rosegrant observed that the world has been experiencing a slow decline in malnourishment, down from about 1 billion malnourished people worldwide in the 1990s to 800 million currently. Moreover, the number of stunted children worldwide has decreased as well over that same time period, although mostly in Asia, with the number in Africa increasing. But simultaneously, Rosegrant pointed out, there has been a rapid increase in the number of overweight and obese children worldwide, including in Africa and Asia (de Onis et al., 2010, 2012).
Pervasive Micronutrient Deficiencies
In addition to the rapid rise in obesity, Rosegrant cited pervasive micronutrient deficiencies, including extreme cumulative deficiencies in India and other parts of Asia, and medium to high cumulative deficiencies in much of the rest of Asia as well (FAO, 2013a). Citing a specific example, he reported that the economic cost of micronutrient deficiencies in India has been estimated at US$17.3 billion (2004 dollars), or 2.5 percent of India’s gross domestic product (GDP) (Stein and Qaim, 2007). He added that,
according to FAO data, there is a high prevalence of specific micronutrient deficiencies worldwide as well (e.g., anemia, vitamin A deficiency, iodine deficiency) (FAO, 2013a).
Population Growth and Urbanization
Rosegrant observed that the United Nations has projected rapid population growth in sub-Saharan Africa, South Asia, and East Asia in particular (see Figure 3-8). Those same areas are also the most challenged nutritionally with respect to food security, he pointed out. Also as shown in Figure 3-8, the world is becoming more urbanized (UNDESA, 2014), with the implications discussed below.
Evolving Food Demand: Increasing Consumption of Sugar, Fats, Oils, and Meat
Rosegrant described the several ways in which food demand is evolving as a result of urbanization and rapid income growth. While diets are changing in some positive ways—for example, he noted that the consumption of fruits and vegetables is increasing in much of the world—consumption
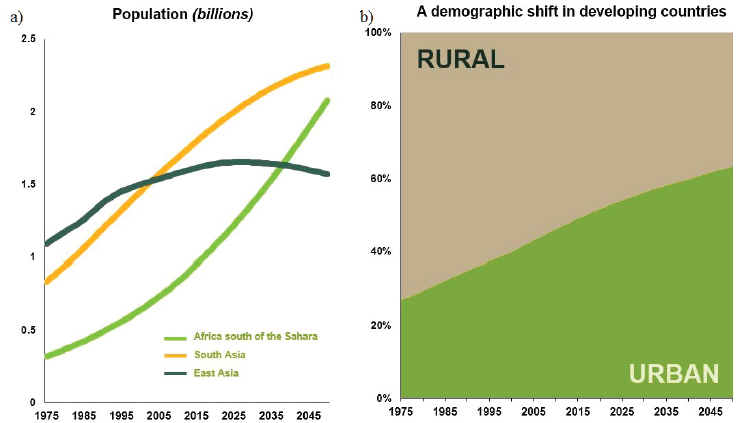
NOTE: Population growth is depicted in billions.
SOURCES: Presented by Mark Rosegrant on August 1, 2018, based on information from UN World Urbanization Prospects, 2014 revision.
of sugar, fats, and oils is also increasing, and people are eating more convenience and fast foods. In addition, he observed, meat consumption continues to grow rapidly, leading to a rapidly growing demand for grains for feed. According to Rosegrant, half of the growth in grain demand through 2050 is likely to be for the direct feeding of livestock. “That, in turn,” he said, “puts intense pressure, of course, on land and water” (IFPRI, 2011).
Water Stress and Crop Yield
In 2011, work by Rosegrant and his IFPRI colleagues, in collaboration with the Veolia Water Company, found that 36 percent of the global population lived in a water-scarce area and that 39 percent of global grain production and 22 percent of global GDP were located in areas with significant water stress. By 2050, Rosegrant reported, these numbers are expected to be much higher, with half the population (52 percent), half of grain production (49 percent), and nearly half of global GDP (45 percent) occupying water-stressed regions (FAO, 2011; IFPRI, 2011).
Regarding crop yields, Rosegrant continued, yields of maize are projected to be 30 percent lower in 2050 than today because of climate change, compared with no climate change (Nelson et al., 2009). Thus, he stated, much of the world, including the United States, will experience heavy losses in yield. He pointed out that U.S. yield and exports play an important role in global food security.
International Food Policy Research Institute’s (IFPRI’s) International Model for Policy Analysis of Agricultural Commodities and Trade (IMPACT): Comparing Future Impacts of Different Climate Change, Agricultural Investment, and Meat Demand Scenarios
Rosegrant described how, given the above challenges, IFPRI’s IMPACT modeling system has been used to examine and compare several different future climate change, agricultural investment, and meat demand scenarios. Without going into great detail, he described IMPACT as a global, multimarket model with a high level of disaggregation, encompassing 159 countries, 154 water basins, and 60 commodities (Robinson et al., 2015). The model links climate, water, and crop models, capturing macroeconomic and sectoral trends as well, including GDP and income growth, although modelers can specify alternative assumptions. In the version discussed by Rosegrant, IMPACT is also linked to a general equilibrium model that captures the effects of economic changes (e.g., changes in labor, employment, and GDP) on the agricultural sector (Robinson et al., 2015).
As outputs, Rosegrant continued, IMPACT generates estimates of yields, commodity prices, trade, employment, household income annually,
and other impacts. Through the use of postsolution models, indicators of hunger, nutrition, and health can also be estimated. Rosegrant shared results, detailed below, for two postsolution indicators: number of hungry people (using FAO methodology to estimate the number of people below a specific calorie consumption threshold in any given country) and number of stunted children (based on econometric results estimated by Lisa Smith and Lawrence Haddad1). Rosegrant explained that all of these results were based on the most severe representative concentration pathway (RCP) climate change scenario (the Intergovernmental Panel on Climate Change’s [IPCC’s] RCP of 8.5), plus a medium level of GDP growth.
Scenarios for More Sustainable and Resilient Food Systems: Investing in Agricultural Efficiency
First, Rosegrant described results from modeling three different types of additional investments in the agricultural sector to improve productivity and efficiency: (1) research and development investments to increase productivity, including investments by CGIAR, a global partnership and the main international agricultural research system, as well as investments by the National Agricultural Research System (NARS); (2) various water investments, including the expansion of irrigation systems, the enhancement of water use efficiency, and enhanced soil management (e.g., system-level efficiency, no-till farming, integrated soil fertility management, and rainwater harvesting); and (3) investments in rural infrastructure to benefit agricultural production and value chains (e.g., investments in the transportation and energy sectors).
Rosegrant and colleagues modeled the impacts of each of the sets of investments separately and then the impacts of all together (the “comprehensive investment portfolio”). According to Rosegrant, the comprehensive investment portfolio totaled about $25.5 billion per year above baseline (current annual expenditures are about $38 billion). The researchers ran the models from 2015 through 2050. They examined three different types of outcomes in 2050, all computed relative to baseline: (1) income (GDP per capita); (2) outcomes related to food supply, hunger, and nutrition (agricultural supply, hunger, stunted children); and (3) environment (water use, GHG emissions, forest cover).
In the interest of time, Rosegrant described only the results of the comprehensive investment scenario. The researchers were essentially asking, in that scenario, with all of these various additional annual investments totaling $25.5 billion per year above baseline beginning in 2015, how outcomes
___________________
1 For more information, see https://www.sciencedirect.com/science/article/pii/S0305750X14003726 (accessed January 7, 2019).
in 2050 would be different compared with the baseline investment level. The model projected a nearly 6 percent increase in per capita income in 2050 due to higher investment compared with the baseline scenario, Rosegrant reported. In addition, as expected, it projected a substantial increase in agricultural supply (11.5 percent), a 24 percent reduction in hunger, and a 9 percent reduction in the number of stunted children in 2050 compared with the baseline investment. In other words, he clarified, there would be 120 million fewer hungry people and 10 million fewer stunted children in 2050 as a result of these additional agricultural investments. With respect to environmental outcomes, he added, these investments would generate substantial reductions in water use—about 11 percent. In addition, because both crop and livestock productivity would be enhanced, land use would also be reduced, with about 88 million hectares saved. The more efficient production of animals with respect to methane gases would generate a reduction of about 25 percent in GHG emissions, or about 3 Gt, by 2050.
Scenarios for More Sustainable and Resilient Food Systems: Reduced Meat Demand
The IMPACT modeling system was also used to predict future outcomes under different reduced meat demand scenarios, Rosegrant continued. One of these scenarios was a high-income scenario involving a 50 percent reduction in per capita meat demand in all high-income countries relative to baseline (i.e., no meat reduction). Another scenario was a 50 percent reduction in both high-income countries and the two of the largest middle-income countries, Brazil and China. One of the important findings from this modeling exercise, Rosegrant pointed out, was that when meat consumption was reduced in both the high-income countries and Brazil and China, it increased dramatically in sub-Saharan Africa—more than 30 percent over its current very low levels (see Figure 3-9). Meat consumption increased dramatically among developing countries overall (minus Brazil and China) as well, by a little less than 30 percent. Rosegrant explained that these increases were projected to occur elsewhere in the world because of the lower prices due to the reduced consumption of meat. The other finding of note, he said, was that the impacts of a reduction in Brazil and China were even greater than the impacts of a reduction in high-income countries because of those two countries’ large populations, coupled with their high levels of meat consumption.
According to Rosegrant, the model also revealed reduced demand for feed grain and a modest reduction in the risk of hunger. The latter finding, he explained, was the result of not only lower-priced meats but also lower-priced grains, particularly maize, but also wheat and rice, inducing people to increase their consumption. When both high-income countries
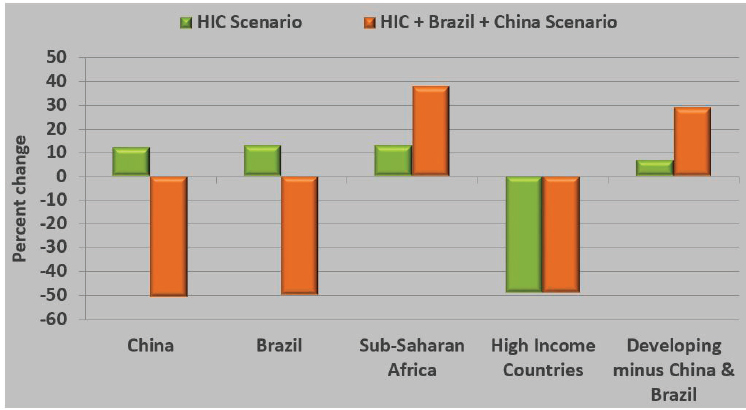
NOTES: HICs are depicted by green bars. HICs and Brazil and China are depicted by orange bars.
SOURCE: Presented by Mark Rosegrant on August 1, 2018.
and Brazil and China reduced meat consumption, the risk of hunger in sub-Saharan Africa and developing countries overall was reduced by 9 and 6 percent, respectively. In terms of absolute numbers, Rosegrant elaborated, this reduction would bring 60 million people out of hunger in developing countries, 40 million of them in sub-Saharan Africa. Again, he said, these results point to “important distributional impacts from that drop in meat consumption.”
In both of the scenarios with reduced meat consumption, Rosegrant added, significant land would also be conserved, including both cropland and pasture. Under the scenario involving high-income countries plus Brazil and China, a total of 180 million hectares of land worldwide would be saved. Land in developing countries, minus Brazil and China, would account for a little less than half of that total.
For purposes of comparison, Rosegrant mentioned results from a different modeling study, in which non-CO2 GHG emissions were examined under three different meat demand scenarios (constant, more, and less) (Popp et al., 2010). By 2060, GHG emissions were projected to increase by about 40 percent in the constant meat demand scenario, compared
with about a 60 percent increase at baseline (i.e., no meat reduction) in Rosegrant and colleagues’ IMPACT modeling. In the more meat demand scenario, GHG emissions doubled. In the less meat demand scenario, GHG emissions decreased by about 60 percent, which Rosegrant noted was similar to what he and his colleagues had observed with the IMPACT model. So again, Rosegrant observed, reduced meat consumption was projected to have very large impacts on GHG emissions.
Final Remarks
In conclusion, Rosegrant summarized three main points. First, increased investment in agricultural research and development, rural infrastructure, and irrigation and water use efficiency would generate substantial increases or improvements in food supply, income, food security, and nutrition. Rosegrant emphasized, however, that the income necessary for improving food security and nutrition can be generated only with increased food production in developing countries. “You are not going to get that kind of income improvement by importing food,” he said, adding that more efficient agriculture also results in reduced water use, GHG emissions, and forest loss. Second, dietary change policies could also be powerful, and arguably more so, in reducing GHG emissions, hunger, and agricultural land use. And third, achieving more resilient, sustainable food systems will require a balanced approach and recognition of the need for sustainable productivity growth, improved value chains, and significant dietary changes.
DISCUSSION
Following Rosegrant’s presentation, he, Afshin, and Tilman participated in an open discussion with the audience, summarized here.
Modeling for Resilience
In reference to Rosegrant’s consideration of not just sustainable but also resilient food systems, Nicole Tichenor Blackstone asked about ways in which modeling can capture the different dimensions of resiliency in a robust way across different contexts. Rosegrant clarified that IMPACT captures resilience in the sense, for example, that expanding irrigation while also increasing the efficiency of water use provides additional resilience for farmers, who then need not rely on rainwater. However, he agreed that much more could be done with IMPACT to explore resilience. In addition, he mentioned work with which he has been involved in collaboration with The World Bank on the short-term impacts of El Niño Southern Oscillation (ENSO) events (El Niño and La Niña) and the types of policy responses available.
Tilman agreed that irrigation is “incredibly important” for ensuring resiliency, particularly in areas of periodic drought. In addition, he mentioned work in his lab on patterns of crop production worldwide suggesting that greater local crop diversity on farms appears to be associated with more resiliency. Thus, he suggested that diversity may be another component of resiliency in agriculture.
Modeling for Meat Versus Protein Versus Fish
Maha Tahiri asked Rosegrant whether he had modeled for protein overall, not just for meat, and projected outcomes by 2050 if everyone worldwide simply met the recommended level of protein intake. Rosegrant replied that he and his colleagues have not yet done this modeling, although they now have the capability to do so not just for protein but for about 15 other nutrients as well. The list of nutrients on which they will focus is still being finalized, he noted, based on input from a team of nutritionists. He expects that input to be available quite soon.
Tahiri then asked Tilman to explain the variation in environmental impacts of fish (shown earlier in Figure 3-2). Tilman clarified that wild-caught fish caught on “long lines” with hooks have very low GHG impact (“non-trawling fishery” in Figure 3-2). In contrast, trawling, which basically involves dragging nets deep in the ocean, often along the ocean floor, requires boats to use much more diesel fuel (“trawling fishery” in Figure 3-2). Tilman explained that the amount of GHGs emitted by trawling fisheries is about halfway between what is emitted by chicken and beef production. Fish grown in ponds or nets suspended in the ocean are associated with higher GHG emissions, he noted, similar to those of chicken, but if aquaculture uses pumps to recirculate and filter the water, emissions can be similar to those of trawling fisheries because of the energy required of the pumps (“recirculating aquaculture” in Figure 3-2). Thus, he summarized, fish can be either low- or high-impact, depending on how they are caught or produced (Tilman and Clark, 2014).
Food Safety and Sustainability
Jessica Campbell of General Mills asked whether and where food safety is being considered in discussions of sustainable diets. In the GBD study, Afshin replied, the assumption is that food safety causes an immediate, not a long-term, effect, and thus it has not been incorporated into his team’s analyses of overall health effects. He said he recognizes, however, that there are different opinions as to whether such factors as trans-fat intake are food safety issues. If the definition of food safety is expanded to include such
factors, he explained, then yes, some aspects of food safety are included in the work he and his team do.
Errors of the Estimates
Johanna Dwyer, National Institutes of Health, asked about the size of the errors of the various estimates discussed by the speakers and how those errors are estimated.
Afshin replied that in GBD, the researchers work with about 20 risk factors that are all related to some form of malnutrition—either undernutrition (stunting, wasting, micronutrient deficiencies), diet quality or composition, or excess calorie intake (overweight, obesity). One of the current challenges, he observed, is how to account for overlap when combining all of these risk factors and all of their effects to derive a single diet-related burden of disease. To this end, he explained, he and his team developed metrics for estimating direct versus mediated effects—an effect could be partly a direct effect of diet but also partly mediated, for example, through obesity. He noted that a paper describing this work is forthcoming. With respect to the risk factor estimates themselves, he continued, estimates for micronutrient deficiencies, for instance, have been very unstable because of the assumptions that must be made about daily versus usual intake. He mentioned that GBD has been working with FAO to reevaluate estimates of micronutrient deficiency. As an example, he explained that when results were corrected for daily variation in zinc intake, the prevalence of zinc deficiency dropped from about 20 to 25 percent to less than 10 percent.
With the IMPACT modeling system, Rosegrant said, IFPRI has been unable to establish formal error bands because of the number of variables. He noted, however, that his team has done some backcasting, the results of which have suggested that their regional predictions have been fairly accurate and in some places, such as China, “spot on.”
Language: Use of the Term “Processed Food”
“I think it is very important as we proceed in this conversation, with lots of different people from different disciplines coming together, that words matter,” Kristi Reimers, Conagra Brands, commented. She mentioned the pervasiveness of using “processed food” as a surrogate for high-energy-dense, low-nutrient-dense foods. She said she understood that it is difficult to say “high-energy-dense, low-nutrient-dense,” but suggested that a different surrogate be used, as not all processed foods can be thus characterized. As an example, she pointed to tomatoes that are processed during tomato season, so they are a processed food, but a very high-nutrient-dense
food. She suggested that a different surrogate could help with more effective communication.
Red Meat: How to Move Forward Other Than Saying “Eat Less”
“It is very hard to create a positive story for red meat when we talk about sustainability,” Reimers continued. The increase in demand for red meat continues, she observed, still outselling vegan or vegetarian options “hands down.” She stressed that this demand cannot be ignored, and asked whether there are other solutions besides telling people to “eat less.”
In Tilman’s opinion, this is a fundamental question. He mentioned human evolutionary history, with meat being an important part of humans’ diets when they lived as hunter–gatherers. He believes that much of the current conversation around sustainable diets stems from a fundamental conflict between the taste preference humans have for items that were limited in their evolutionary past, such as salt, sugar, fats, and proteins, and the foods that are actually healthy for them and the environment. These taste preferences, he asserted, can lead people to like manufactured foods that have unhealthy levels of salt, sugar, and fat and to eat more red meat than is healthy. He argued for putting more effort into developing foods that are nutritionally dense and lower in calories but also very high in what humans perceive as good taste. He pointed out that vegetarian and vegan foods can be delicious and suggested that some entrepreneurs or companies invest in making what he described as “incredibly delicious varieties of such foods.” He predicted that there could be a much greater market for these tasty and healthy foods.
Rosegrant mentioned the surprisingly rapid development of “clean meat,” which is laboratory-developed meat cloned from cells. In his opinion, its taste is almost as satisfying as that of regular meat. However, he predicted that it would take perhaps another 10 to 15 years before clean meat can compete with regular meat.
Instead of focusing on preferences, Rosegrant suggested, another strategy is to use punitive taxes, either carbon taxes, which would be far higher for meat than for other, healthier foods, or direct meat taxes. He acknowledged, however, that such taxes would be a “tough sell” in a country such as the United States, and that in most of Africa and much of Asia, where people are eating only 1 to 2 kilograms of meat per capita daily, even substantial increases in meat consumption could be beneficial.
Wilde added that in the United States, the meat industry has almost a veto power over certain proposals or strategies that are particularly harmful to meat industry–related livelihoods. At first glance and compared with baseline, he observed, some of Rosegrant’s results might look
fairly frightening to someone in the meat industry. He wondered, however, whether the results were really as “bad” as they looked. For Wilde, one of the more interesting modeling results described by Rosegrant during his presentation was the increased consumption in other parts of the world when prices fell in currently high meat-consuming countries. He suggested that this increased consumption elsewhere could be developed into an acceptable storyline for those in the meat industry who want to be “good sports” about sustainable diets but have some line below which they are not willing to go.
Rosegrant explained how the models that he described supported Wilde’s argument. At baseline there was about a 60 percent increase in meat consumption between 2015 and 2050. However, when meat consumption in high-income countries plus Brazil and China was reduced by 50 percent, there would still be a 10 percent increase globally by 2050 because when that much demand is removed from the global meat system, prices fall, making meat more affordable for more people (Tilman and Clark, 2014).
Data, Analysis, and Policy
Rose asked the panelists what new developments they foresee in the next few years that will affect their impressions of sustainable diets or what new developments they would like to see.
Tilman echoed what Fanzo had said earlier (see Chapter 2): that enough is known “in broad outline”; the results are large enough and the error limits small enough. “What we really need to do,” he said, “is find ways to change society so that we adopt the ideas that we are talking about”—that is, make diets healthier and reduce their environmental impacts. Although he acknowledged that more data could be gathered and more intricate analyses conducted, he believes data and analyses are not the limitations. “I think we are really policy and adoption limited,” he said. “That is where we need the greatest creativity.”
Rosegrant replied that models could “get fancier,” and in fact, he and his group are using machine learning to develop more integrated, larger models. But more important than developing new models, in his opinion, is developing more precise analytic techniques that can provide highly spatially disaggregated and real-time data that help farmers become more efficient through the use of less fertilizer and water. It is in that realm, he argued, rather than in modeling per se, that new developments could have beneficial effects.
Afshin echoed Rosegrant’s call for more precise data collection methods, but in the realm of sensor-based, individual-level data. “We really do not know what people eat,” he said. “We are making educated guesses.”
This page intentionally left blank.


