
5
Innovation in Food Production and Distribution to Reduce Environmental Footprint
Session 4, moderated by Kate Houston, Cargill, Inc., Washington, DC, built on the foundation developed on the first day of the workshop while also adding some new perspectives. Speakers explored how food systems are innovating and finding new ways to address sustainability, some of which have already been implemented, Houston remarked, while others are on the horizon. This chapter summarizes the presentations and discussion that took place during this session, with highlights of the presentations provided in Box 5-1.
REDUCING THE FOOTPRINT OF ANIMAL AGRICULTURE
Frank Mitloehner, University of California, Davis, opened the session with a glimpse of what he described as “ground zero of environmental discussions, and that is the sunny state of California.” He informed the audience that California is the leading agricultural state in the nation, producing 50 percent of all fruits and vegetables and 20 percent of all dairy (CDFA, 2017). What many people do not realize about California, he pointed out, is that about half of the state consists of marginal land—land that cannot be used to produce crops and is unusable for most other purposes as well, and thus is used largely for grazing livestock. Most agriculture in California occurs in the Central Valley, he noted, a place with significant environmental issues as well. He added that Fresno is not only the nation’s leading agricultural county but also the one with the worst air quality (UC Agricultural Issues Center, 2009). To curb the impact not just of livestock but
of all sectors of society, California has what Mitloehner described as very aggressive regulations and among the most proactive air resources agencies.
Livestock and Climate Change: Fact or Fiction?
Mitloehner explained that, throughout his talk, he would be addressing several seemingly conflicting observations about livestock and climate change. The first is the claim that livestock is the predominant contributor of greenhouse gas (GHG) emissions globally, producing 18 percent of all anthropogenic GHG emissions, and that livestock emits more GHGs than does transportation. Mitloehner clarified that the 18 percent figure, first reported in Livestock’s Long Shadow (FAO, 2006), was later reduced to 14.5 percent (FAO, 2013b) and that the majority of that amount is related to deforestation in developing and emerging countries. Often, he said, people will apply a global number, such as the 18 percent figure from the 2006 Food and Agriculture Organization (FAO) report, to the United States to convince others to change their eating habits. In his opinion, this is a conflating of information about global and national trends that does not hold true.
The statement that livestock emits more GHGs than does transportation also comes from the 2006 FAO report, a finding Mitloehner says he critiqued for using different methods to estimate emissions when the report was first issued. A life-cycle assessment (LCA) was used to estimate the emissions attributable to the livestock sector, taking into account all aspects of livestock production, whereas only direct emissions (i.e., from tailpipes) were used to estimate emissions from the transportation sector. Thus, Mitloehner elaborated, the LCA of the carbon footprint of a gallon of milk, for example, includes not just the direct emissions of the cow—belching or emissions from manure—but also emissions from the soil, herbicides and pesticides used to produce feed crops, the crops themselves, the feed produced from the crops, and so on. By contrast, he stated, the estimate of direct emissions for the transportation sector omitted production entirely (i.e., of cars, trucks, trains, planes, and ships), including the steel, rubber, plastic, and other materials used. Nor did it account for the construction of roads, airports, harbors, and so on. It was an “apples to oranges” comparison, Mitloehner said.
Mitloehner uses LCA in his own work. He reported that he chaired an FAO-hosted committee known as the Livestock Environmental Assessment and Performance Partnership (LEAP), which released guidelines on how to conduct LCAs for all livestock and feed commodities (FAO, 2016). Assembling these guidelines involved the work of about 300 of the world’s leading LCA experts. According to Mitloehner, the guidelines are now considered the gold standard for global LCAs.
When examining GHG emissions in the United States, however, people often turn to the U.S. Environmental Protection Agency’s (EPA’s) inventory of direct emissions, Mitloehner continued. According to 2014 EPA data, he reported, a main contributor to the U.S. GHG inventory is carbon dioxide (CO2) (81 percent), which he explained is a direct result mainly of fossil fuel use; other contributors include methane (11 percent), nitrous oxide (6 percent), and fluorinated gases (3 percent). Based on these data, he stated, EPA has determined that the contributors to GHG emissions in the United States are as follows: power production (i.e., electricity), 30 percent; transportation, 26 percent; industry, 21 percent; agriculture, 9 percent; commercial, 7 percent; and residential, 6 percent. He clarified that the 9 percent figure for agriculture is for all agriculture, crops and livestock combined (EPA, 2017). The U.S. livestock sector alone, which includes dairy, beef, sheep, pigs, and poultry, contributes about 4 percent to total U.S. GHG emissions. In California, that percentage is slightly higher, with the livestock sector—both beef and dairy—contributing 5.4 percent of total GHG emissions in the state (EPA, 2017). In contrast, California’s transportation sector contributes 36.9 percent to the state’s total GHG emissions. Mitloehner thus asserted, “The notion that livestock rivals transportation as a greenhouse gas emitter is false, particularly here in the United States.”
The Largest Food-Related Contributor to Greenhouse Gases: Food Waste?
Arguably the greatest food-related contributor to GHG emissions and environmental harm overall, Mitloehner continued, is food waste. This includes not just food waste at the household level but food wasted throughout the entire food supply chain. In the United States, Mitloehner reported, 40 percent of food produced goes to waste (Gunders, 2012); globally, that figure is closer to 30 percent (FAO, 2012a).
The Growing Global Population and a Rapidly Increasing Demand for Eggs, Meat, and Milk
Mitloehner observed that the global population has been increasing exponentially since the mid-18th century and is expected to reach 10 billion by 2050. When he was a boy, there were 3.5 billion people on earth, compared with 7.6 billion today. “By the time I am an old man,” he said, there will be 9.5 billion people alive. In other words, over his lifetime, the human population will have tripled. “But the natural resources to feed these people will not have tripled,” he added. “If we are lucky, we will have the same amount of resources, but most likely fewer.”
Today’s global population growth is happening primarily in emerging and developing countries, Mitloehner continued, not only because people
are having more babies but also because life expectancies are increasing, so that cumulatively, there are more people alive. He showed a satellite image of the world with much of Southeast Asia circled and stated that there are more people living inside than outside that circle. So clearly, he noted, Southeast Asia, with an expected 41 percent increase in its population over the next 10 years, is a major food security area. But, he stressed, it is not the only one: the population in Africa is expected to increase by 50 percent over the same time period, the South American population by 7 percent, and the North American population by 4 percent, while the European population is predicted to shrink slightly (Roser, 2018). “We have our work cut out for us with respect to finding means to feed a growing population without depleting our natural resources,” Mitloehner said.
Mitloehner went on to point out that as the global population rises, so, too, does the demand for eggs, meat, and milk, particularly in developing parts of the world. He added that this growing demand is largely a function of disposable income, according to 2005 FAO data (see Figure 5-1), such that the higher the income, the greater the meat consumption, with the United States having the highest meat consumption per capita (kilograms [kg]/year). He predicted that, although China is on the far left of the graph in Figure 5-1, it will be at least where the United States is today in 10 years.
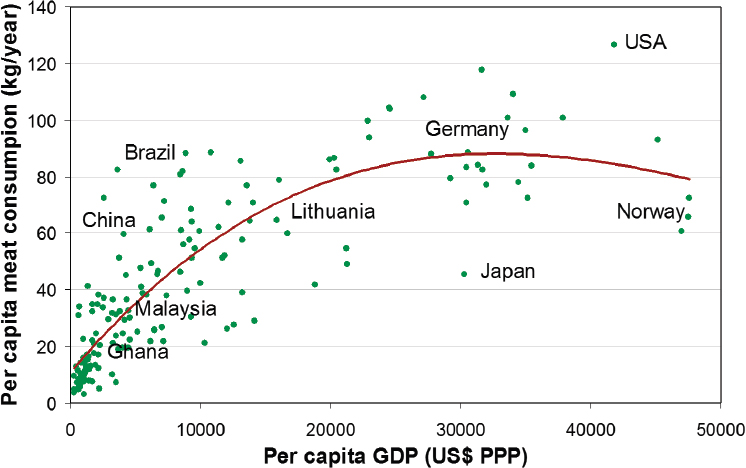
NOTE: PPP = when adjusted by purchasing power parity.
SOURCES: Presented by Frank Mitloehner on August 2, 2018; FAO, 2009.
Agricultural Land Worldwide
An additional “fact or fiction?” statement that Mitloehner had cited at the beginning of his presentation was that livestock occupies 70 percent of all agricultural land globally. He clarified that while two-thirds of the world’s agricultural land currently is used for livestock, particularly ruminant livestock, this is because there is no other food-producing way to use that land (FAO, 2006).
To explain, Mitloehner began by showing a map of global livestock distribution and remarked that the density of livestock in the United States (livestock units per square kilometer [km]) “pales” in comparison with that in such countries as India and China (FAO, 2006). But even more important than global livestock distribution, he continued, is the global distribution of cropland (i.e., crops grown for food for human consumption). Regardless of the number of people in the world, he stressed, whether it is 3, 7, 9, or 12 billion, “that is the only cropland we have available.” To depict this problem in a different way, he asked everyone in the room to imagine that a normal (8.5 by 11 inch) piece of paper represented the surface of the Earth. He folded the paper twice, with the resulting quarter representing the total amount of land in the world. The rest, he said, is water and ice. Of that quarter-sized piece of 8.5 by 11 inch paper, he added, the equivalent of the size of a business card is the total amount of agricultural land, the rest being forests, deserts, cities, and so on. Then, he folded his business card such that one portion was two-thirds the size of the card and the other was one-third. The larger portion, he said, depicted the amount of agricultural land in the world that is considered “marginal.” Again, marginal land is land that cannot be used to grow crops either because the soil is not fertile or there is not enough moisture. According to Mitloehner, the only use for that marginal land is ruminant livestock (i.e., beef, dairy, goats, sheep). Thus, only one-third of all agricultural land worldwide is so-called “arable” land, where anything can be grown (within regional limits) (Alexandratos and Bruinsma, 2012).
To further illustrate the importance of the livestock sector with respect to the global food supply, Mitloehner added that not only is most agricultural land not arable, but half of all arable land in the world is fertilized with chemical fertilizers and the other half with organic fertilizers, which are, by and large, animal manure (FAO, 2006).
The Inverse Relationship Between Production Intensity and Intensity of Greenhouse Gas Emissions
A final “fact or fiction?” statement cited by Mitloehner at the beginning of his talk was that grazing systems produce fewer GHG emissions relative to conventional animal production in confinement systems. He
explained that cows that produce very little milk have a very large carbon footprint relative to those that produce large amounts of milk (see Figure 5-2). He added that this is because the amount of nutrients fed to a cow that produces very little milk (on the left side of the graph in Figure 5-2) is used largely to keep her alive (i.e., “maintenance requirements”), whereas the carbon footprint of a cow that produces a large amount of milk (on the right side of the graph in Figure 5-2) is “diluted” through the amount of milk she produces.
In the United States, Mitloehner continued, about 25,000 pounds of milk is produced per cow per year, while in India and Mexico, respectively, it takes about 20 and about 5 cows to produce the same amount of milk (FAO, 2017a). He emphasized the vast differences in the cumulative environmental impact of 1 versus 5 versus 20 cows, highlighting FAO data from 2010 showing that North America is not the highest, as many think, but the lowest of any region of the world with respect to GHG emissions per unit of milk produced. He remarked that if U.S. data were to be teased out of that combined North American dataset, the difference between milk production emissions in the United States and elsewhere in the world would be starker. The same is true, he observed, with respect to emission intensities associated
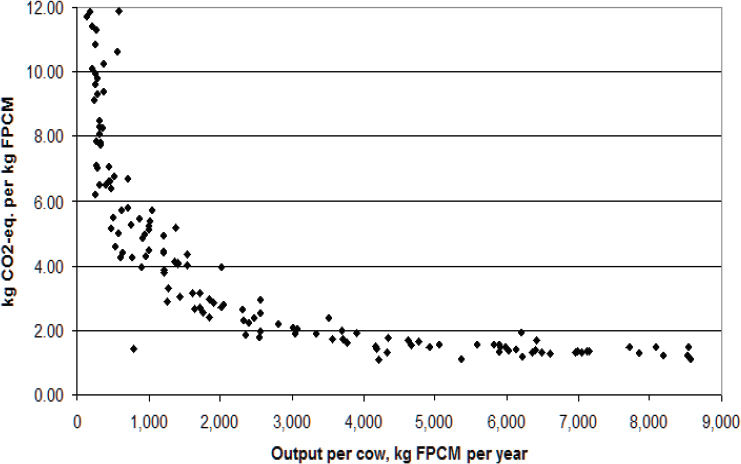
SOURCES: Presented by Frank Mitloehner on August 2, 2018, modified from Gerber et al., 2011.
with both ruminant and nonruminant animals used for meat, with U.S. totals being lower than those in Brazil, China, the European Union, and India.
The Important Role of Technology
According to Mitloehner, the fact that the United States has the lowest, not highest, carbon footprint in the world with respect to beef, dairy, and nonruminant meat animals per unit of product is a function of four approaches: (1) reproductive efficiency; (2) improved health, including vaccination and treatment of animals; (3) improved genetics, meaning that what he termed “high-merit” genetics are being applied to both animals and plants; and (4) the feeding of more energy-dense diets to animals (Gill et al., 2010).
“These four tools have allowed us to shrink animal herds to historic levels in this country,” Mitloehner continued. In 1950, he observed, there were 25 million dairy cows across the United States, whereas today there are 9 million. Yet, even with fewer cows, he explained, the United States is producing 60 percent more milk with this much smaller herd; thus, the carbon footprint of a glass of milk is two-thirds smaller today than it was 70 years ago. The same is true of beef, he added: in 1970, there were 140 million head of beef in the United States; today there are 90 million, so 50 million fewer, yet the same amount of beef is produced as in 1970 (i.e., 24 million tons). The same is true yet again of pork, he observed, with pork production in the United States having tripled over the past 60 years (Mitloehner, 2016). “This is a vast improvement in performance,” he said, leading to significant reductions in environmental emissions.
Other Animals (Outside of Agriculture), Other Countries
Mitloehner commented on the 9.5 million horses in the United States, compared with the country’s 9 million dairy cows, and the lack of discussion around their environmental footprint. Nor does anyone talk about the 160 million dogs and cats nationwide, he added, which consume the same amount of food as 70 million people (Okin, 2007). Mitloehner clarified that he did not mean to deflect from livestock’s contribution by making these statements, but simply wanted to provide additional perspective.
Also to provide additional perspective, Mitloehner described the current situation with swine in China, home to half the world’s pig population and a staggering 1 billion pigs produced per year (Wang, 2006). For Mitloehner, even more remarkable than the number of pigs produced annually is their preweaning mortality. Each year, 40 percent of China’s pig crop, or 400 million pigs, die preweaning and never make it to market. According to Mitloehner, the situation is even worse in India and in African countries because the veterinary systems are dysfunctional, genetics are poor, and the
animals’ nutrition is insufficient. He noted that the Intergovernmental Panel on Climate Change (IPCC) has estimated that about 70 to 80 percent of the global emissions impact of livestock occurs in developing countries because of production inefficiencies (Lubungu, 2017).
Final Remarks
In summary, Mitloehner highlighted two key points. First, livestock has very different environmental footprints throughout the world, with technologies having allowed the United States and other countries with efficient livestock production to arrive at where they are today. The state of California, for example, has mandated a 40 percent reduction in GHG emissions in the next 12 years. “It will be achieved,” Mitloehner asserted. He mentioned technologies being developed to reduce enteric emissions from animals, which constitute the major agricultural source of methane, and technologies being used to digest manure anaerobically so as to convert it into power and fuel. Second, he pointed to the inverse relationship between production intensity and emission intensity, such that the more efficient the agricultural production, the smaller is the environmental footprint. The same is true of vehicles, he observed: the more fuel-efficient a vehicle is, the less gas it burns and the fewer emissions it releases.
REDUCING THE FOOTPRINT THROUGH ALTERNATIVE DIETS
Martin Heller, University of Michigan, Ann Arbor, revisited some of what had been discussed on the first day of the workshop about the impact of diet on the environment, but with a focus on U.S., not global, trends. He described several different approaches that have been used to predict how potential shifts in the U.S. diet could reduce the environmental impacts of the food system.
Why Consider Diets?
Heller’s starting point for thinking about the role of diet was a collection of studies comparing projections of population growth and food demand with what predictive models indicate is needed to reduce global GHG emissions and avoid dangerous climate change. According to Heller, these studies have shown repeatedly that production-side improvements will be insufficient to meet the target of a 2oC rise in global temperature (Bajželj et al., 2014; Bennetzen et al., 2016; Bryngelsson et al., 2016; Hedenus et al., 2014). For example, Hedenus and colleagues (2014) predict that by 2050–2070, food requirements for the world’s growing population will occupy most of the available GHG emissions space if the world is to remain within
the 2oC “safe zone.” But that same space, Heller stressed, requires room for other sectors as well (energy, transportation, industry, land use changes). He noted that adding increased agricultural productivity to the model, such as what Mitloehner had discussed, or technical mitigation measures, such as manure management, would reduce the portion of the available emissions space occupied by agricultural emissions, but there still would not be enough room for the other sectors. He interpreted these findings to mean that demand-side reductions are also necessary if the world is to stay within that 2oC safe zone. By demand-side reductions, he meant reduced animal-based food, specifically reduced meat and dairy consumption, and reduced food waste. As previous speakers had, he pointed to the large differences in GHG emissions between plant-based and animal-based foods. Heller noted that, while it may not always be appropriate to compare GHG emissions per weight (kilogram), doing so provides at least a scale for comparison (see Chapter 2 for a summary of Drewnowski’s remarks on comparing GHG emissions by weight versus calories).
What Would Happen If the United States Shifted to the Diet Recommended by the Dietary Guidelines for Americans?
Heller next considered what would happen if the U.S. diet shifted to that recommended by the Dietary Guidelines for Americans (DGA). He described how he and a colleague compared the 2010 U.S. diet, based on the U.S. Department of Agriculture’s (USDA’s) Loss-Adjusted Food Availability dataset as a proxy, with an average per capita intake of 2,534 calories, against the 2010 DGA food patterns for both 2,534 calories and 2,000 calories (which is closer to what is recommended) (Heller and Keoleian, 2014a). He noted, first, that while the estimated 2010 per capita caloric intake may seem excessive, it was what the data revealed; and second, that although the 2010 DGA is now outdated, the changes between it and the 2015 DGA were subtle and likely would not influence the results.
The researchers found that with the current U.S. diet, GHG emissions associated with meat (beef, pork, and lamb) make up 48 percent of total diet-related GHG emissions. Beef accounts for 84 percent of that figure, so 40 percent of total diet-related GHG emissions is attributable to beef. Heller explained further that dairy contributes 20 percent of total diet-related GHG emissions, while plant-based foods contribute another 22 percent. He added that if the American diet shifted toward what is recommended, which would include increases in consumption of fruits and vegetables, seafood, and dairy (for the omnivorous DGA pattern), there would be a notable decrease in emissions associated with meat, poultry, and eggs, but also a notable increase in emissions related to dairy and slight increases in emissions attributable to fruit and vegetable consumption. The
net effect, Heller stated, would be a 12 percent increase in GHG emissions for a 2,534-calorie diet and a 1 percent decrease for a 2,000-calorie diet (Heller and Keoleian, 2014a).
Heller and Keoleian (2014a) carried their analyses through to the lacto-ovo vegetarian and vegan DGA patterns, as well as Harvard’s Healthy Eating Plate (see Table 5-1). Heller explained that the latter is similar to the omnivorous DGA pattern, but with less red meat and dairy.1 For a 2,000-calorie diet, the researchers found that, compared with an omnivorous diet, with its 1 percent decrease in GHG emissions, a shift to a vegan diet or to either a lacto-ovo vegetarian or Harvard’s Healthy Eating Plate diet would reduce GHG emissions by 53 percent and 33 percent, respectively, compared with the current average American diet.
What Heller found interesting about the latter findings is that the reduction associated with Harvard’s Healthy Eating Plate, which still contains meat, is the same as that associated with the lacto-ovo vegetarian diet, which contains no meat. Thus, he said, “we don’t need to necessarily think about all or nothing—vegetarian or bust.”
GHG Impacts of Food Waste
“Of course,” Heller continued, “everything I’ve showed you so far looks at just the consumed portion of the food” people eat. He noted that
TABLE 5-1 Comparison of Greenhouse Gas (GHG) Emissions from the Current U.S. Diet Versus Various Recommended Diets, at Intake of 2,000 Calories per Day
| Eating Pattern | GHG Emissions (kg CO2 equivalent/capita per day) | Reduction from Current “Average” Diet (%) |
|---|---|---|
| 2010 DGA omnivorous | 3.6 | 1 |
| 2010 DGA lacto-ovo vegetarian | 2.4 | 33 |
| 2010 DGA vegan | 1.7 | 53 |
| Harvard’s Healthy Eating Plate | 2.4 | 33 |
NOTE: CO2 = carbon dioxide; DGA = Dietary Guidelines for Americans; kg = kilogram.
SOURCES: Presented by Martin Heller on August 2, 2018, modified from Heller and Keoleian, 2014a.
___________________
1 The Healthy Eating Plate “is characterized by high quality grains (whole vs. refined), healthy proteins (fish, poultry, beans and nuts vs. red meat and processed meat), greater intake of poly unsaturated fatty acids (healthy oils), reduced intake of sugar-sweetened beverages, and reduced dairy” (Heller and Keoleian, 2014b).
one-third of total U.S. diet-related emissions are from food waste (Heller and Keoleian, 2014a), an amount equivalent to the tailpipe emissions from 33 million average passenger vehicles.
Heller explained that this one-third estimate does not include GHG emissions associated with disposing of food waste, only those associated with producing the wasted food. If one accounts for disposal and assumes that all food waste is disposed of in landfills, which he recognizes is not true but cited for perspective, the estimate of GHG emissions attributable to food waste would increase by another 30 percent (Heller and Keoleian, 2014a).
Other Studies and Approaches to Examining the Environmental Impact of Dietary Shifts
Heller went on to observe that other studies have taken a similar approach to using food availability data to compare GHG emissions associated with the current diet against recommended diets. As just one example, he cited the work of Tom and colleagues (2016), who considered two additional environmental impact indicators—water use and energy use—in addition to GHG emissions. They found that a shift to a recommended food mix would increase GHG emissions by 6 percent, energy use by 28 percent, and water use by 10 percent.
Heller then described the work of Peters and colleagues (2016), who, instead of looking at GHG emissions, examined the carrying capacity of U.S. agricultural land (i.e., the number of persons that can be fed from an area of land). Like Heller and Keoleian (2014a), they estimated current consumption using the USDA Loss-Adjusted Food Availability dataset as their baseline. They then combined average crop yields and livestock rations to determine how much land is required to feed the U.S. population both currently and under a range of different recommended diets. According to Heller, they found that the current carrying capacity of U.S. agricultural land is about 130 percent of the 2010 population. If the American diet shifted to the DGA-recommended omnivorous diet, that figure would increase to 136 percent of the 2010 population; if the diet shifted to 80 percent omnivorous and 20 percent lacto-ovo vegetarian, which Heller described as “a little better than Meatless Monday,” the figure would increase to 178 percent; if the diet shifted to 20 percent omnivorous and 80 percent lacto-ovo vegetarian, it would increase to 249 percent; and if all animal products were eliminated, so that the diet shifted to 100 percent vegan, it would increase to 238 percent (Peters et al., 2016). In other words, Heller clarified, eliminating all animal agriculture would mean less carrying capacity than having some animal agriculture. However, he pointed out, significant reductions in animal-based foods in the U.S. diet would be necessary
before one would begin to see the positive effects of utilizing marginal lands through animal agriculture.
Individual-Level Analysis
“But all of that is looking at the U.S. diet as an average,” Heller continued. Analyzing diet at the individual level, he stated, “opens up a lot of possibilities.” One can begin linking diet, health, and environmental impacts across a population and, he pointed out, “really set the stage for some more nuanced modeling of dietary change.” He went on to describe his recent work linking GHG emissions and energy use to individual self-selected diets.
Using 2005–2010 National Health and Nutrition Examination Survey (NHANES) data for 16,800 individuals, Heller and colleagues (2018) linked more than 7,000 as-consumed food items to their environmental impacts. They conducted an exhaustive search of the LCA literature to populate a database they called dataFIELD (database of Food Impacts on the Environment for Linking to Diets). Because most of the available LCA literature is based on food commodities, Heller and his team also relied on a Food Commodities Intake Database to represent the 7,000 as-consumed food items as compositions of roughly 300 food commodities. Finally, they linked data in dataFIELD with NHANES data to estimate diet-related GHG emissions per capita, including the contribution of both consumed food and food loss (both retail and consumer losses, using data from additional sources). They examined energy use associated with food production in a similar way.
At the mean of the population, Heller reported, total GHG emissions were 4.7 kg CO2-equivalent per capita per day (3.6 kg CO2-equivalent per capita per day for consumed food; 0.3 kg CO2-equivalent per capita per day for retail losses; 0.9 kg CO2-equivalent per capita per day for consumer losses) and 2.2 kg CO2-equivalent per capita per 1,000 kilocalories (kcal) (1.7 kg CO2-equivalent per capita per 1,000 kcal for consumed food; 0.1 kg CO2-equivalent per capita per 1,000 kcal for retail losses; 0.4 kg CO2equivalent per capita per 1,000 kcal for consumer losses).
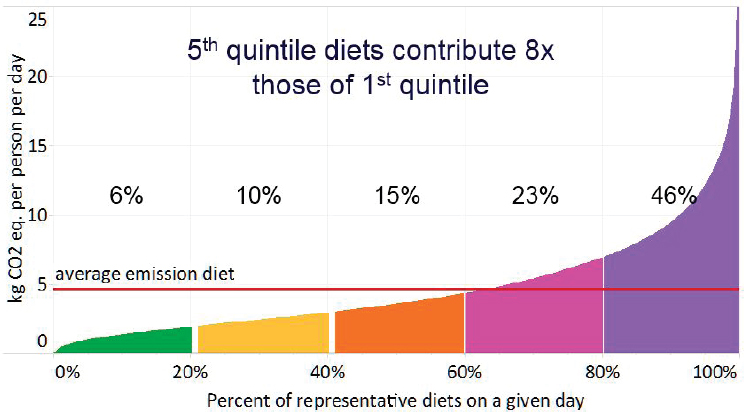
But again in Heller’s opinion, the really interesting conclusions from this work derive from being able to look at GHG emissions as a distribution across a population (see Figure 5-3). He and his research team found that when individual diets are ranked by GHG emissions and the population is divided into quintiles based on those rankings (with bottom emitters in the 1st quintile and top emitters in the 5th quintile), there is an eight-fold difference in cumulative emissions between the top and bottom emitters (see Figure 5-4). For Heller, that difference is striking. “We knew there
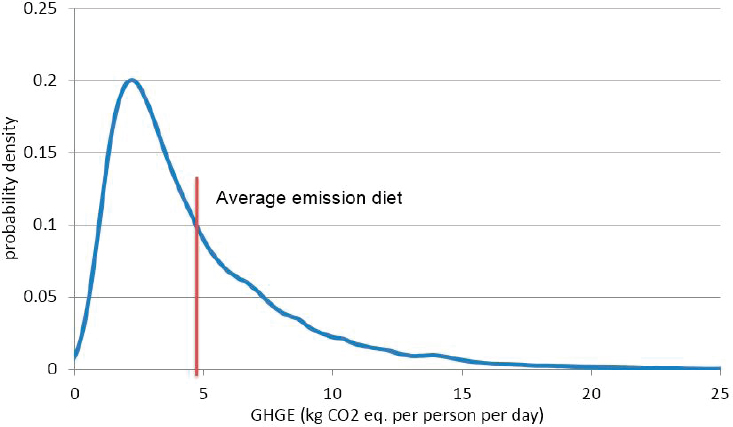
SOURCES: Presented by Martin Heller on August 2, 2018, modified from Heller et al., 2018.
SOURCES: Presented by Martin Heller on August 2, 2018, modified from Heller et al., 2018.
was going to be variance,” he said, “but it is much greater than we were anticipating.”
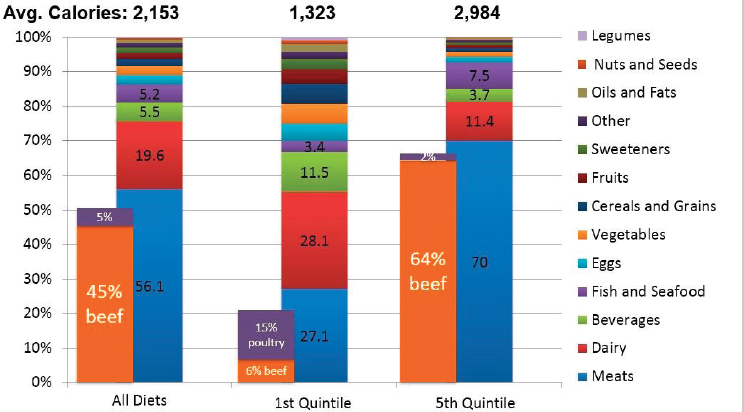
What is driving those differences? First, according to Heller, are notable differences in total caloric intake, with top emitters eating more calories (see Figure 5-5). But even when caloric intake is normalized, he observed, there remains a five-fold difference in GHG emissions between the top and bottom emitters, which suggests a difference in diet composition as well. In fact, as shown in Figure 5-5, a much greater percentage of GHG emissions from top emitters is attributable to meat (70 percent) relative to bottom emitters (27.1 percent). The majority of meat-associated emissions by top emitters is attributable to beef (64 percent of total emissions), compared with poultry for the bottom emitters (15 percent of total emissions) (Heller et al., 2018).
Heller described average beef consumption as 51 grams per day—roughly the equivalent of eating a quarter pounder every other day. In contrast, individuals in the top quintile (the top emitters) consume about one-third of a pound of beef daily. If those in the upper quintile were to shift their diet to one associated with average emissions through some combination of diet composition and caloric intake reduction, Heller suggested, the environmental savings in terms of GHG emissions after 1 year would be equivalent to 44.6 million Americans driving 15 miles fewer every day, a
SOURCES: Presented by Martin Heller on August 2, 2018, modified from Heller et al., 2018.
reduction that could bring the United States 10 percent closer to achieving the United Nations (UN) climate targets (Heller et al., 2018).
Final Remarks
In conclusion, Heller highlighted several key points. First, demand-side changes likely are needed to meet emission-reduction targets, even with some of the efficiency improvements and technological advances discussed by Mitloehner. Second, the individual-level modeling he had described points to wide discrepancies in the United States with respect to the diet-related impact on GHG emissions and offers a different lens for thinking about policy scenarios. Finally, Heller acknowledged having provided a one-sided look at environmental impacts—namely, a look at GHG emissions. He emphasized that there are other environmental indicators, such as water and land use, as well as other aspects of sustainability, that need to be considered.
LOCAL AND REGIONAL FOOD SYSTEMS IN SUSTAINABLE DIETS
Nicole Tichenor Blackstone, Tufts University, Boston, Massachusetts, reflected on the difference between research on sustainable diets and research on local and regional food systems, and how this difference underlies the reality that there are multiple ways to think about sustainable food systems. As an example of her work in research on sustainable diets, she mentioned an analysis in which she and her colleagues compared the environmental impacts of three different diet patterns in the most recent DGA (Blackstone et al., 2018). She pointed out that this kind of analysis is different from the type of work that researchers who study local and regional food systems, including she herself, often do. Yet, she observed that both types of research serve as approaches to understanding sustainable diets, an idea that she traced to Garnett (2014).
Garnett (2014) identifies three different perspectives, or lenses, through which researchers think about sustainable food systems: demand restraint, efficiency-oriented, and food systems transformation. Blackstone explained that demand restraint had also been discussed by several previous speakers—that is, how diets can be shifted or how consumer behavior can be influenced to reduce the environmental, social, and economic costs of the food that is produced and consumed. She identified the second perspective, efficiency-oriented, as what Mitloehner had been getting at—that is, how technology and innovation can be used to reduce the environmental, social, and economic impacts of agriculture and related supply chains. She then turned to the third perspective, which Garnett (2014) terms food systems
transformation. The central argument of this perspective, she explained, is that the problems, or externalities, of the food system are the result of the social and economic organization of the system, rather than being just technical problems or the result of individual decisions.
Blackstone announced that the remainder of her talk would focus on the third perspective—food systems transformation—and expressed the hope that bringing this perspective to the workshop would result in the continuation of conversation around it. Specifically, she said she would focus on local and regional food systems and their economic, social, human health, and environmental contributions to sustainability. People who work in local and regional food systems consider themselves food systems transformers, she said, because they are exploring alternative ways to organize farms and supply chains.
What Is a Local Food System?
According to Blackstone, there is no single definition of a local or regional food system, but one element that runs through all the different definitions is geography. In some cases, she elaborated, this element is distance; in other cases, it is a mileage radius; and in still other cases, it is state-based. Sometimes, she observed, these systems are defined around marketing channels. Indeed, she noted, this is how USDA tracks local and regional food systems: food being sold through either direct or intermediated marketing channels. She explained that direct-to-consumer marketing includes farms selling directly to consumers in farmers’ markets, at farm stands, or through community-supported agricultural endeavors, while intermediated marketing includes farms selling to institutions, retailers, or regional distributors (“hubs”). She identified perceived attributes as yet another way of defining local and regional food systems (Johnson et al., 2013). She emphasized the word “perceived,” noting that many people who are highly enthusiastic about local food sometimes incorporate perceived attributes into their definition of local or regional systems regardless of whether those attributes are valid. For example, they may perceive local foods as having better quality or safety; as automatically being sourced from small-scale farms; or as being fairer, more just, or better for the environment.
Local Versus Regional
With respect to the difference between local and regional, Blackstone remarked that the regional level encompasses the local level, and is typically larger and more comprehensive (Clancy and Ruhf, 2010). She explained that she works on regional food systems in the northeastern United States that cover 12 states, extending from Maine to West Virginia.
Local Food Systems in the United States
Blackstone observed that local and regional food systems represent a very small fraction of the overall U.S. food system—only about 8 percent of U.S. farms use direct or intermediated marketing channels, totaling about $6.1 billion (2012), a little less than 2 percent of U.S. agricultural sales (Low et al., 2015). She added that most local and regional foods are sold through intermediated channels, as opposed to direct markets, and that about half of all local and regional foods are produce, while 30 percent are animal products.
How Might Local and Regional Food Systems Contribute to Sustainability?
Blackstone discussed three ways in which local and regional food systems might contribute to sustainability: (1) economic viability, (2) access and health, and (3) the environment. She went on to discuss each of these in detail, but focused mainly on environmental implications.
Economic Viability
According to Blackstone, research has shown that farms working in local supply chains can have higher net revenue relative to those working in mainstream chains (King et al., 2010). Research has also shown that farms using direct marketing channels have higher survival rates compared with those using intermediate channels (Low et al., 2015). Regarding the latter finding, Blackstone explained that farms with higher survival rates are those with positive sales over time, a notable fact given that U.S. farms have a fairly low rate of positive sales over time. Also notable, she suggested, is that Low and colleagues (2015) found this association to obtain across scale, from very small to midscale to large farms, and for beginning farmers as well. She stressed that beginning farmers in particular are critical for sustainability in agriculture given the aging farmer population. “We need to keep folks on the land,” she declared. In her opinion, these findings are promising for creating future opportunities for farmers.
Blackstone identified food hubs as another opportunity for small and midscale producers who are often locked out of mainstream (i.e., large-scale retail and global) markets because they struggle to meet quantity, quality, or consistency requirements. She defined food hubs, of which there are more than 300 in the United States, as entities that aggregate, market, and distribute source-identified food and often have a values-based mission to support small and midscale farms. She referred to the 2017 National Food Hub Report as a source of information on these entities and their
contribution to the economic viability of these small and midscale operations (Colasanti et al., 2018).
Access and Health
Regarding access to healthier, plant-based foods, Blackstone remarked that there is some evidence at the national level indicating that prices for selected produce items, such as tomatoes, potatoes, and some other fruits and vegetables, may be lower at farmers’ markets than at retail outlets, including superstores (Low et al., 2015). She clarified, however, that these lower prices are only one dimension of access. Shopping at farmers’ markets requires a dedicated trip, time, and motivation. “So it’s not an end-all, be-all for access,” she said, but “there may be some price benefits.”
In addition, Blackstone reported, emerging evidences suggests that local food interventions, such as farm-to-school programs and other similarly complex interventions (i.e., programs that combine multiple factors, such as gardens, nutrition education, taste tests, and food variety) can result in modest increases in fruit and vegetable consumption, as well as increased willingness to try and increased liking of different fruits and vegetables (Graziose and Ang, 2018; Izumi et al., 2015).
Environment: Transportation
In some cases, Blackstone observed, the transportation footprint of a food is greater when the supply chain is local (Low et al., 2015; Nicholson et al., 2015). The reason is that local supply chains can have lower fuel efficiency per unit product; because of their larger scale, regional food systems may offer efficiency advantages (King et al., 2010).
Blackstone emphasized, however, that transportation in food miles is only a small part of the overall environmental footprint of foods. With some exceptions (e.g., air freight for some commodities), she reported, food miles contribute only about 5 percent of average weekly household food-related GHG emissions. Most household food-related GHG emissions, she elaborated, are centered around the farming and manufacturing of foods (Boehm et al., 2018).
Environment: Beef Production in the Northeast
In the northeastern United States, Blackstone continued, not only is there a great deal of interest in local meat, but the region also has a culturally and economically significant dairy sector. She explained that the dairy sector is a multifunctional system that produces both milk and beef, and that the beef it produces has a lower overall environmental footprint
compared with regional grass-fed beef production and uses less land than conventional beef production (Tichenor et al., 2017). “So there are ways in which regionally specific production systems might have some environmental benefits,” she said, “depending on where you are in the region.”
Yet, Blackstone pointed out, these systems rely heavily on corn-based feeds. She and her research team were struck by evidence in the animal science literature demonstrating that a high-energy feed that mimics corn can be created from plant-based retail food waste (Froetschel et al., 2014), coupled with the large potential supply of plant-based retail food waste in the Northeast because of the large number of urban centers. They therefore wondered whether there might be a way to further improve the sustainability of these systems by using food waste as feed. Currently, Blackstone noted, policies to promote green energy or less landfilling of waste in the region are encouraging anaerobic digestion of food waste, and that policy pressure is growing. But again, she asked, what if, instead of sending that food waste to the digesters, it were used in animal feed? Would there be net benefits? So she and her team conducted an LCA of the benefits and costs of shifting food waste to feed and found that doing so would indeed reduce both GHG emissions and acidification potential (Blackstone et al., in prep).
Blackstone referred to this as a “leftovers approach” because it relies both on leftovers from the dairy industry to produce beef and leftovers from human consumption and retail for animal feed. In her opinion, the recycling of food waste into feed should be a priority across the region. She called for further assessment of the feasibility of using this leftovers approach with additional species, such as pigs.
Environment: System-Level Issues
“As we think about folks shifting to more sustainable diets,” Blackstone cautioned, “we need to think about where that’s going to happen.” She explained that production of fruits and vegetables in the United States is highly geographically concentrated, as Mitloehner had pointed out. She noted that California produces most of the country’s leafy greens (95 percent from Arizona and California combined), broccoli (92 percent), celery (95 percent), garlic (100 percent), processing tomatoes (94 percent), strawberries (79 percent), and grapes (89 percent) (CDFA, 2017). And because fruits and vegetables are major contributors to consumptive water use and water depletion (Blackstone et al., 2018), increasing fruit and vegetable production in current production centers such as California would exacerbate water stress in those areas. She added that, because geographically concentrated production is increasingly vulnerable to climate change–related droughts, fires, and erratic weather patterns, concentrated production centers are likely to be less resilient in the face of these shocks. She suggested
thinking about how local and regional food systems might be potential mechanisms for increasing fruit and vegetable production in sustainable ways, though she acknowledged that this was only a hypothesis and that much empirical work would be needed to understand its implications.
Questions to Consider
Blackstone listed several questions to consider as research in the field of sustainable diets moves forward. First, how can the potential contributions of local and regional food systems be integrated into such research in meaningful ways? Blackstone suggested involving sociologists to help examine the social and cultural potential of these alternative systems. Second, what is the role of circular economies (e.g., using food waste as feed)? Going beyond the food system, how does that system intersect with other aspects of the economy, and how can more circular systems be created? Third, Blackstone urged consideration of how decentralizing production might contribute to resilience, something she believes should be studied empirically. Finally, she asked about structural issues and the underlying economic and social systems driving the externalities that exist today.
In conclusion, Blackstone stressed that local and regional food systems are not the answer to all sustainability issues. In her opinion, achieving sustainable diets will require many different approaches and all scales working together—from global and large-volume distributors, to farmers’ markets, to backyard gardens.
SUSTAINABLE FOOD SYSTEMS: INNOVATIONS AT THE INTERSECTION OF SUPPLY CHAINS AND CONSUMERS
For Karrie Denniston, Walmart, Bentonville, Arkansas, there are any number of different doors one could walk through when thinking about the role retail serves in sustainable food systems. “Should we talk about food waste? Should we talk about global policy? Should we talk about local systems?” she asked. Regardless of which door one walks through, she suggested, the issues very quickly become muddled, and “you will very quickly run into someone else walking through a different door.” The consequences of this complexity, she asserted, are that “when we maximize for one thing, we create issues somewhere else.” For example, as Blackstone had pointed out, increasing fruit and vegetable consumption creates issues of water stress. As another example, packaging food differently to extend shelf life creates plastic waste. Denniston informed the audience that the focus of her presentation would be how retail sits at a nexus amid all of these different issues, and on where Walmart enters into the conversation.
Walmart’s Mission and the Creation of Shared Value
According to Denniston, Walmart has about 11,000 stores around the globe, plus multiple e-commerce platforms. The company serves about 27 countries and 270 million customers yearly, and it sources from about 100 different countries worldwide. “So that’s an unbelievably complex system,” Denniston said. “We end up being this interface between supply chain and demand, because we see the customer as they walk through the door and we play this signaling role, sending [signals] back and forth between where supply chains are at and where customers are going.”
With respect to Walmart’s mission “to save people money so that they can live better,” Denniston reflected on the fact that while some markers of global prosperity are moving in positive directions, inequality is increasing. And as consumption demand continues to increase, so will the pressure around affordability and access as more people want more things. “Price will continue to matter,” Denniston observed. She added that the growing global population is expected to exacerbate the already large impact of consumption on the environment and will raise new social issues as well.
In terms of where Walmart fits into this picture for the long term, Denniston stated that it sees itself as creating shared value. “By that,” she said, “we think that doing good in the world is actually also good for business,” and without surety of supply, resources, and sustainable food systems, there would be no business. Thus, Walmart’s aspiration is to bring safe, healthy, affordable food to people in places where they need it through cold chain,2 logistic support, and other improvements and in a way that is regenerative to the environment and is good for both the people who eat and the people who produce the food. Denniston stressed, however, that no one business or any one sector, academic or nongovernmental organization (NGO), can do this alone; changes in infrastructure, as well as in behavior, will be required. She added that Walmart cannot focus on everything everywhere because it sources from so many countries worldwide and from so many different types of supply chains. Therefore, it prioritizes its contribution to these efforts based on where the greatest risk lies (i.e., the potential for things to go wrong), the tools at its disposal (e.g., suppliers, logistics expertise), its philanthropic tools (e.g., where it can fill a gap or scale a promising program that does not yet have market viability or government support to scale on its own), and customer feedback.
___________________
2 The term “cold chain” refers to a temperature-controlled supply chain. For more information, see https://www.who.int/countries/eth/areas/immunization/epi_logistics/en/index1.html (accessed January 4, 2019).
The Complexity of Supply Chains
Denniston cited seafood as a good example of how the social and environmental implications of supply chains are so inextricably linked. Think about shrimp, she suggested. Shrimp grown in aquaculture ponds need to be fed protein. That protein comes from what is known in the industry as “trash fish”—food that is fished out of the sea and lands on a boat, but has no market value because it is not a species people like to buy. It is on those boats far back in the supply chain where that fishmeal is being caught that the greatest risk of exploitation exists for workers—for example, having their passports withheld and being forced to work long hours. Denniston emphasized the relative lack of visibility that far back in the supply chain. “That’s a key issue as we think about sustainable food systems,” she stressed, “what’s happening to those folks on those boats.” But then shift the lens, she said, to the person who is captaining that boat. That captain is going to fish for a longer period of time just to get the same catch that meets his economic needs.
On another boat farther up the supply chain, Denniston continued, fishing for some other species, a crew is trying to meet all the standards of sustainable certification. She described them as really wanting to “do it the right way.” So they pull up their catch and take it to port, but then the wholesaler to whom they bring it does not have enough demand to keep it separated from other catches, and their catch never makes it to market with a signal saying, “we worked hard to catch this sustainably.”
Meanwhile, in a nearby village, Denniston said, imagine a farmer who has worked hard to perfect what she has been doing with her aquaculture ponds. Yet, her neighbor has not been judicious about water quality or pond runoff. Consequently, her ponds become diseased, and her harvest fails.
Denniston then pointed to a family somewhere around the world that walks into a store and sees information about what seafood can provide them in terms of health, but they are worried that they are unable to afford it. The challenge, she said, is not only how to communicate healthy food messages so that people can navigate the information, but also how to provide access to that healthy food. She noted that it is because of this challenge that Walmart and the Walmart Foundation made a commitment to help provide 4 billion meals over 5 years to people in need.
In summarizing her supply chain example, Denniston said, “We took a trip around the world, and all of those individuals, all of those communities, are acting completely rationally … doing what they are doing.” Yet, she stressed, the challenges they face are tremendous. At the same time, however, so, too, are the opportunities. “We can walk through any of these doors and test ideas, test tools, test innovations, and create positive
changes,” Denniston observed. For the remainder of her presentation, she discussed some of the lessons Walmart has learned when entering these doors and encountering these issues.
Lessons Learned by Working Across Supply Chains
Denniston described six lessons learned by working across supply chains: (1) what good looks like must be defined, (2) industry collaboration is necessary to strengthen market systems, (3) transparency and data matter, (4) engage the people who are impacted by the issues, (5) economics help drive innovation, and (6) consumer engagement helps drive demand.
What Good Looks Like Must Be Defined
In Denniston’s opinion, defining what good looks like is a powerful tool as it points people in the same direction toward what should be done. Dietary guidelines are an example, as is the Paris Agreement’s 2oC goal. An example from the Walmart Foundation is its investment in small and medium enterprises in China to help them understand how to mitigate food safety risks. The first step toward doing that, Denniston observed, was helping them understand food safety practices: only after a shared understanding and food safety code were agreed upon could training begin.
Industry Collaboration Is Necessary to Strengthen Market Systems
A second lesson learned, Denniston continued, is the importance of bringing people together to drive change. She cited as an example Walmart’s work on what is called the Midwest Road Collaborative, whereby suppliers; local community leaders; and others across Illinois, Iowa, and Nebraska come together to decide collectively how to optimize fertilizer, reduce nutrient runoff, and improve water quality. She suggested that if Walmart had simply approached those same suppliers and requested that they implement sustainable practices, it would have meant nothing to them. The market signal is not strong enough for one farmer to act alone, she stressed. Rather, “it’s the collaboration that makes the difference.”
Transparency and Data Matter
“What we measure matters,” Denniston continued, since the greater is the visibility into a supply chain, the greater is the opportunity to respond. She relayed how in 2017, Walmart started piloting block chain technology as a tool for understanding food systems more rapidly. But before initiating the pilot, her staff asked a team to identify where a specific package
of mangoes had originated—a task that took them 7 days, utilizing what she described as the “best in class” tools available. “From a food safety perspective,” she emphasized, “if there is a recall, those 7 days are significant.” After the block chain technology was piloted, she reported, the mango package test was repeated. This time, utilizing the block chain technology, it took the team only 2.2 seconds to identify a farm in Mexico as the origin of the mangoes. The lesson, Denniston said, is not that block chain technology is “the answer,” because in fact, questions remain about its scale and application, and work is still under way with suppliers on determining how to utilize the technology. Rather, she asserted, the lesson is the importance of considering ways to innovate with respect to collecting this kind of information.
Engage the People Who Are Impacted by the Issues
Denniston observed that although the fourth lesson—engage the people who are impacted by the issues—seems self-explanatory, it had been the subject of little discussion at this workshop. In fact, she included it as a lesson learned not because Walmart does this particularly well, but because the company has noticed its lack. As an example, she pointed out that the major tools Walmart uses in its efforts to combat deforestation include market signals and government responses; however, a community that may not have an economically viable alternative and that is trying to survive and feed its families does not care about market signals or government regulations. “If we don’t get to know what assets that community has as an alternative,” she stressed, “we won’t be successful.”
Economics Help Drive Innovation
According to Denniston, one way to articulate the fifth lesson—that economics help drive innovation—is that if there is a strong enough business case for an idea, people will figure out how to implement it. As an example, Walmart set a goal of sending zero food waste to landfills, but had no idea how to accomplish this. However, Denniston reported, food waste is expensive, so determining how to eliminate it became an economic imperative. Over the past couple of years, she noted, the company has been testing ways to reduce food waste from strawberries. Through a series of iterative experiments, it has successfully removed about a day and a half from the supply chain, extended the freshness life of the product by 2 to 3 days, and increased by 70 percent the amount of strawberries out on the floor in stores rather than sitting in warehouses. Denniston added that Walmart also invests heavily in food recovery, and in 2017 donated about 750 million pounds of food to people in need.
Consumer Engagement Helps Drive Demand
In describing the sixth lesson learned—that consumer engagement helps drive demand—Denniston observed that it is difficult to create consumer demand. It is not something a retailer can decide to do, she pointed out, but it is something a retailer can signal. So, for example, when Walmart made its healthier food commitments in 2011, it not only reformulated products by reducing sugar and sodium and removing trans fats altogether, but also introduced an icon to help consumers with decision making. Specifically, Denniston recounted, the company introduced a “best if used by” date to help consumers avoid confusion regarding expiration dates that do not specify “sell by” or “use by.” She explained that the new icon is now on 92 percent of Walmart’s private-label brands in the United States. According to Denniston, this one small change has eliminated an estimated 660 million pounds of food waste, and she described this kind of tool as one with a great deal of promise. In her opinion, it is critically important that greater consideration be given to how to shift some of the signaling and deliver sustainability guidance in a more tailored, systematic way.
Questions to Consider
Denniston concluded by offering three questions to consider. First, what really needs to happen? What does a sustainable food system look like? Second, why isn’t it happening? How can the people who are actually making sustainable food choices every day be engaged? What are the frictions? What are the barriers? Lastly, she asked, “What would have to be different tomorrow for us to get that system that we are looking for?” How can people be provided the tools and guidance needed to shift behavior?
DISCUSSION
Following Denniston’s presentation, she, Blackstone, Heller, and Mitloehner participated in an open discussion with the audience, summarized here.
Environmental Impact of Transportation: Nutrient-Dense Versus Energy-Dense Food Supply Chains
Imagine a city of 20 million people, each of whom is eating a diet of 2,000 calories, Drewnowski proposed. Further suppose that the average energy density of their diets, filled with broccoli, leafy greens, baby carrots, and other vegetables, is one-half calorie per gram. That, Drewnowski said, amounts to about 80,000 to 100,000 tons of food moving through the city streets every day to be delivered to people, depending on how much is lost
to waste. But if that same population were to switch to a diet filled with processed foods or ultra-processed foods, such as chocolate and potato chips, with an average energy density of 5 calories per gram, only about 8,000 tons of food would be moving through the city streets every day. As a result, transportation costs would be cut by one-tenth. Plus, Drewnowski added, energy-dense foods are cheaper. He asked what these observations mean in terms of how a shift toward a less energy-dense diet would play out economically in the long term. “My fear,” he said, “is that for big cities, many of them poor, there are going to be incredible economic pressures to eat energy-dense diets which are cheap but nutrient poor.”
Blackstone replied by reiterating that focusing overly on food miles is unwarranted, as the associated environmental impact does not compare with the impacts of production. That said, she added, there are differences in transportation efficiency, noting that the difference in transportation impact between a fruit and vegetable supply chain and a processed food supply chain depends on how the foods are transported. If the same fruits and vegetables are being air-freighted, she pointed out, their transportation will have a much larger environmental impact—by an order of magnitude—than if they are being transported by trucks. Alternatively, if they are being transported on fully loaded trucks, the difference is not as dramatic as an order of magnitude.
Comparing Greenhouse Gas Emissions: By Calories or Weight?
“We don’t carry food,” Drewnowski observed. “We eat it.” Moreover, while there are no requirements for any particular weight of food to be consumed daily, there are requirements for calories (approximately 2,000) and nutrients. He asked, then, why GHG emissions are measured per kilogram of food (as Heller had done during his presentation) when examining diet and suggested that calories are a more appropriate metric.
Heller explained that he and his colleagues used GHG per kilogram because the intake data they had were by weight. He considered the metric merely an avenue for linking GHG emissions and intake and agreed that it is not the best metric for comparing different foods. But in his opinion, neither is caloric content. Using calories as a metric, he argued, leads to such situations as lettuce having a greater GHG emissions impact than pork. “And that’s fairly illogical as well,” he asserted.
Blackstone agreed with Drewnowski that in the context of a diet pattern, it makes sense to use a calorie comparison. In a healthy diet, she observed, one consumes a much smaller quantity of calories from fruits and vegetables relative to other foods. But like Heller, she disagreed with Drewnowski about the use of calories at the level of individual foods. “It skews,” she argued.
Consequences of China’s One-Child Versus Two-Child Policies
When asked by an audience member about the environmental impact of China’s two-child policy compared with its one-child policy, Mitloehner replied that the lifting of the one-child policy in China will not make a great difference because the vast majority of families will continue to have only one child—the expense of raising a larger family is too great. He believes that, more than the number of children per family, increasing life expectancy is what is driving the population structure of China. He pointed out that the average Chinese individual lives much longer today than was the case 20 to 30 years ago, which cumulatively has had a large effect on the country’s total population density.
Environmental Impact of Different Breeds of Livestock
When asked by Regina Tan, USDA, whether different livestock breeds—for example, Jersey versus Holstein cows—have different environmental impacts and whether there has been any international effort to share breeding stock, Mitloehner replied that in general, yes, there are significant differences among breeds. For example, a smaller-framed Jersey is more efficient at producing milk relative to a larger-framed Holstein. He agreed about the need to trade livestock internationally to improve breeds, but cautioned that breeds also need to be adapted to local conditions.
Improving the Infrastructure of Veterinary Medicine
Tan also asked whether there have been international efforts to improve the infrastructure of veterinary medicine. Mitloehner replied that the veterinary infrastructure is largely underdeveloped in much of the developing world, where livestock are often infested with parasites that consume the nutrients intended for them. This is a “grave concern,” he said, because the animals are often not vaccinated or otherwise treated appropriately. He pointed out that this leads to enormous production losses, which in turn drive environmental impact. In his opinion, the question is, “Are we ready for a new green revolution?”
Disclosing Conflicts of Interest
Lurie proposed that a standard policy of the Food Forum be for all speakers to disclose their conflicts of interest, and that this policy be implemented immediately. Noting that on this panel, Denniston and Heller had been quite clear about their conflicts of interest, he asked Mitloehner and Blackstone whether they had any conflicts they would like to disclose.
Mitloehner disclosed that about 98 percent of his funding comes from public sources, including EPA and the California Air Resources Board, and that the remaining 2 percent comes from companies that fund technology research on the mitigation of emissions. As an example of the latter, he mentioned pharmaceutical companies at the forefront of developing technologies that help reduce environmental footprints (e.g., feed additives that reduce GHG emissions). Blackstone disclosed that her funding comes entirely from her academic institution and an environmental leadership foundation.
Are Dietary Shifts Enough to Move the Needle on Climate Change?
Jackie Schulz, Kraft Heinz, Glenview, Illinois, informed the audience that she had recently attended the Institute of Food Technologists’ (IFT’s) annual meeting, where she saw Dennis Dimick’s presentation “Eyes on Earth.” In line with that presentation, she commented on the urgency of the climate change crisis. She asked the panel to reflect on whether dietary shifts, which obviously have potential benefits, are enough to move the needle on climate change as quickly as is needed, and whether reductions in fossil fuel use and food waste would have a greater impact more quickly.
Mitloehner replied that in his opinion, dietary changes will occur, but they will occur slowly. Moreover, he suggested, many parts of the world will see shifts toward, not away from, a more animal-based diet. Re-educating those masses of people will take a long time, he argued, “time that we don’t have.” He clarified that he did not mean to imply that this re-education should not happen, but that a direct, major change in carbon emissions is needed. He reiterated that the vast majority of carbon emissions is driven by fossil fuel use. “That is undisputed internationally, I believe,” he said. The biggest players, he pointed out, are countries such as China and India that currently are mounting a large drive to electrify their vehicle fleets. According to Mitloehner, “that will have a profound impact.” In the United States, he added, “what we drive” and “how we heat or cool our houses” also has a profound impact. He was adamant that food choices not be compared with fossil fuel choices. “There is no comparison between these two,” he stressed, “particularly in a country like this one.”
The Environmental Impact of Beef Consumption: Conflicting Perspectives
Regarding the production efficiency of dietary shifts, an audience member observed that on the first day of the workshop (summarized in Chapters 2 through 4), many speakers had expressed “a beef with beef,” that is, the view that beef is a big problem with respect to GHG emissions and land use. Today, in contrast, Mitloehner had remarked that beef accounts for
only 4 percent of U.S. GHG emissions and implied that beef consumption in the United States is not a concern. According to this audience member, the reason estimates of U.S. GHG emissions from beef are so low is that use of pasture land use is assumed to be free from a GHG perspective. In addition, she asserted that it is important to view the environmental impact of beef consumption from a system point of view: that 3 billion people are going to enter the global middle class and that dairy and beef consumption are going to increase by 70 to 80 percent. Because all pasture lands worldwide are being used currently but many are not being used productively, she agreed with Mitloehner that investing in livestock productivity is essential. But even with that investment and even if livestock productivity worldwide were raised to U.S. levels, she stressed, it still would not be possible to meet the expected 70 to 80 percent increase in demand for beef. That growing demand, she pointed out, will continue to drive deforestation. Thus, she concluded, “it is really important in high beef consumption countries, like the U.S., the UK, and others, that we have reductions in order to allow others to eat beef as they enter the global middle class.”
Mitloehner clarified that the 4 percent figure for the United States was for all livestock, not just beef, and that it referred only to direct emissions. Still, he acknowledged, beef alone is no doubt an important driver of GHG emissions. He also agreed that the increased demand for beef will be significant globally. In his opinion, however, one of the most salient aspects of the carbon footprint of beef globally is the extreme inefficiency of beef production in much of the developing world. He explained that while a beef steer in the United States is “finished” at 14 months of age, that animal peer in Africa may live 10, 15, or 20 years before being harvested. For Mitloehner, addressing these inefficiencies is important to reduce the global carbon footprint of livestock.
Elaborating on the equity perspective, Blackstone remarked that, even if GHG emissions due to livestock in the United States are only 5.5 percent of total U.S. GHG emissions, they are in fact massive and probably greater than those in many other countries. In addition, she argued, because the United States has been emitting such large amounts of GHGs for so long, the nation has an ethical obligation to reduce its emissions regardless of breakdown by sector.
Given the urgency of the climate change crisis, Heller opined that no single sector is going to solve the problem. Rather, he argued, efforts are needed on all fronts.
Consumption-Based Greenhouse Gas Emissions
Springmann commented on the push internationally to examine GHG emissions from a consumption-based perspective. He mentioned as an
example work being done by the Center for International Climate Research (CICERO) in Norway (Barrett et al., 2013). Mitloehner added that, while many researchers do look at consumption-based emissions as an academic exercise, the GHG emission inventories of EPA are prepared using a production-based approach.
Promoting Local and Regional Food Systems to Consumers: Any Federal Policies?
Rebecca Boehm, University of Connecticut, pointed to the recent farm bill negotiations, in which programs that supported local food systems, such as the Food Insecurity Nutrition Incentive Grant program, received more funding and garnered bipartisan support. She wondered whether there were any federal policies in place to promote local and regional food systems to consumers in an effort to drive demand for such systems, such as through the DGA.
Blackstone commented that, while redemption of Supplemental Nutrition Assistance Program (SNAP) vouchers at farmers’ markets has been increasing over time because of the portals provided where people can use their electronic benefits transfer (EBT) cards, the company that handles all of these EBT transfers is ceasing operations. She cautioned that many farmers’ markets will then be unable to process SNAP vouchers, and stressed the importance of finding some way to continue support for a highly successful program that provides access to healthy foods in low-income communities.
This page intentionally left blank.


